planning in software project management - ethesis - th¨ses
TRANSCRIPT
PLANNING IN SOFTWARE PROJECT MANAGEMENT
AN EMPIRICAL RESEARCH OF SOFTWARE COMPANIES IN VIETNAM
Thesis
presented to the Faculty of Economics and Social Sciences
at the University of Fribourg (Switzerland)
in fulfillment of the requirements for the degree of
Doctor of Economics and Social Sciences
by
Quynh Mai NGUYEN
from Vietnam
Accepted by the Faculty of Economics and Social Sciences on May 30th, 2006
at the proposal of
Professor Dr. Andreas Meier (first advisor)
Professor Dr. Jacques Pasquier (second advisor)
Professor Dr. Laurent Donzé (third advisor)
Fribourg, Switzerland
2006

The Faculty of Economics and Social Sciences at the University
of Fribourg neither approves nor disapproves the opinions
expressed in a doctoral dissertation. They are to be considered
those of the author (decision of the Faculty Council of January
23rd, 1990).

To my parents, and To Phuong and Trung, my children


i
ACKNOWLEDGEMENT
I would like to express my extreme gratitude to Prof. Dr. Andreas Meier for his guidance,
encouragement and helpful supervision during the process of this thesis. I would like to
thank Prof. Jacques Pasquier and Prof. Laurent Donzé for their review and comments.
My special thanks also go to Dr. Fredric William Swierczek for his invaluable help,
advices and suggestions for improvement. Without their help and advice this dissertation
could not be completed.
I would like to thank my friends, Dr. Bui Nguyen Hung, and Dr. Nguyen Dac Hoa,
Mrs. Nguyen Thuy Quynh Loan for their assistance and helpful suggestions and
contributions.
I would like to thank the government of Switzerland and the Swiss – AIT – Vietnam
Management Development Program (SAV) for giving me the scholarship for this PhD
program. I am grateful to Dr. Hans Stoessel – Director of SAV, Ms. Bui My Nhung and
Ms. Nguyen Thi Bich Ngoc for their kind support in many ways.
My thanks also go to my colleagues at the School of Industrial Management for
providing such a pleasant working atmosphere.
Finally, I owe thanks to my daughter, Phuong and my son, Trung for their love and
giving me strength every day during the difficult period of my study. Words are limited
to express my gratitude to my father, my mother, my father-in-law and to the in memory
of my mother-in-law for their patience and encouragement during my study.
ii
ABSTRACT
The software industry has become a key industry in many developing countries because
of the application of information technology in business, manufacturing and many other
sectors. Software development produces higher value addition compared to other
industries with more skilled human resources. Software project management is an
interesting issue of both researchers and managers. Software projects have a notorious
reputation of poor performance in terms of schedule, cost and quality assurance. There
has been limited research on software project management, especially in a context of
developing countries. Consequently, this study will concentrate on the role of planning
for project success.
The conceptual framework in this study was developed to examine the critical role of
planning in software projects. This framework includes three important elements:
planning factors, planning performance and project outcomes. Planning factors are
defined as human, management and technical factors that involved in project planning.
Planning was assessed by the performance of four tasks, including defining requirements
and specifications, estimating cost and time, scheduling and risk analysis. Project
outcomes were evaluated by five criteria: overall success, qualitative benefits (such as
improving project team ability, enhancing the company image financial benefits),
financial benefits, time and costs. In the framework, planning performance is influenced
by human, technical and management factors. Planning performance also related to
project outcomes. This framework also proposed to analyze the influence of project
characteristics on the relationships between the planning factors and planning
performance.
Both quantitative and qualitative analysis were used to examine the relationships
identified in the conceptual framework. 80 software projects in 65 software companies in
Vietnam were analyzed. This data was collected mainly by survey. One case of the
leading software company was chosen for in – depth analysis through interviews.

iii
The research finding indicated that, there were not many significant differences between
software projects based on size, type and ownership. Smaller projects had better
scheduling, less budget excess, and better intangible benefits like improving project team
capability, enhancing the company image, etc. than bigger projects. Considering the
ownership differences between software projects, the significant differences mainly
related to human factors. The project manager effort, team member ability and customer
involvement of software projects in foreign companies were better than that in local
companies. There were minor differences between software projects by type, such as
commercial, made to order, and outsourcing.
These findings indicated the important role of human factors in planning. The role of the
explanatory variable of planning to project success also confirmed. There were
significant relationships between planning performing and all five project outcomes. The
qualitative analysis of the project as shown the case study of the Financing and
Promoting Technology Corporation (FPT Corp.) provided more explanations for these
quantitative findings.

iv

v
Table of Contents
Chapter Title Page
Acknowledgement i
Abstract ii
Table of Contents v
List of Figures xii
List of Tables xiv
1 INTRODUCTION
1.1 Background of The Vietnam Software Industry 1
1.1.1 The Development of Software Sector in Vietnam 1
1.1.2 Government Support Policies for Software Industry In Vietnam 3
1.2 Objectives of The Study 4
1.3 Significance of The Study 7
1.4 Methodology 9
1.5 Scope of The Study 11
1.6 Organization of The Study 12
1.7 Summary 13
2 CONCEPTS AND DEFINITIONS 15
2.1 Software Product and Process 16
2.1.1 Software Product 16
2.1.2 Software Process 17
2.2 Software Project Management 19
2.2.1 Concepts of Software Project Management 19
2.2.2 Software Project Management Functions 20
2.3 Planning in Software Development Project 24
2.3.1 Planning 24
2.3.2 Life-cycle Models 27

vi
2.3.3 System Development Methods 31
2.3.4 Planning Techniques 32
2.4 Summary 34
3 REVIEW OF EMPIRICAL STUDIES 35
3.1 Software Project Problems 36
3.1.1 Performance of The Software Project 36
3.1.2 People Issues 36
3.1.3 Project Management Issues 37
3.2 Project Performance Evaluation Criteria 38
3.3 Classification of Critical Factors For Project Success or Failure 43
3.4 Relationship Between Critical Factors and Project Outcomes 47
3.4.1 Relationship Between Personnel and Project Success 47
3.4.2 Relationship Between Applying Methods, Techniques and
Project Success
48
3.4.3 Relationship Between Management Approach and Project
Success
48
3.4.4 Relationship Between Project Characteristics and Project
Success
49
3.4.5 Relationship Between Planning and Project Success 50
3.5 Summary 55
4 CONCEPTUAL FRAMEWORK AND RESEARCH METHODOLOGY 57
4.1 Planning Factors and Performance 58
4.2 Conceptual Framework 60
4.3 Development of Hypotheses 62
4.3.1 Hypothesis 1: The Impact of Personnel Factors on Planning 62
4.3.2 Hypothesis 2: The Impact of Technical Factors on Planning
Performance
65
4.3.3 Hypothesis 3: Impact of Management Factors on Planning
Performance
66

vii
4.3.4 Hypothesis 4: The Impact of Planning Performance on Project
Outcomes
68
4.3.5 Hypothesis 5: The Impact Of Project Characteristics on
Planning Performance
70
4.4 Operationalization of The Variables 71
4.5 Variables Related To Planning Factors and Planning Performance 72
4.6 Variables Related To Planning Performance and Project Outcomes 75
4.7 Variable Related To Project Characteristics and Planning Performance 76
4.8 Statistical Methods 76
4.9 Data Collection Methods 79
4.9.1 Sample Source 79
4.9.2 Questionnaire Design and Pre-test for The Exploratory Study 79
4.9.3 Questionnaire Design and Pre-test for The In – depth Study 80
4.9.4 Sample Size and Collection Method in the In – depth study 81
4.9.5 Sampling Errors 82
4.10 Summary 83
5 PLANNING IN SOFTWARE PROJECTS – A CASE STUDY OF THE
FINANCING AND PROMOTING TECHNOLOGY CORPORATION
85
5.1 Introduction 86
5.2 The Financing And Promoting Technology Corporation (FPT) – An
Introduction
87
5.3 Project Characteristics 88
5.4 Project Planning 89
5.4.1 Defining The Customer Requirements, Project Scope and
Objectives
89
5.4.2 Defining the Project Manager Authority and Project
Infrastructure
90
5.4.3 Analyzing the Project Characteristics 91
5.4.4 Identifying The project Activities And Estimation of Effort For
These Activities
92
viii
5.4.5 Identifying Activity Risks 93
5.4.6 Allocation of Resources 93
5.5 Evaluation of Planning Performance and Project Outcomes 93
5.6 Factors Influencing the Planning Performance 94
5.7 Summary 97
6 SOFTWARE PROJECT MANAGEMENT IN VIETNAM –
DESCRIPTIVE RESULTS
99
6.1 Introduction 99
6.2 Sample 99
6.3 The Current Status of Software Project Management 100
6.3.1 Team Management 101
6.3.2 Planning 103
6.3.3 Quality Management 104
6.4 Common Problems of Software Project Management 105
6.5 Software Project: Evaluation Criteria and Success Factors 105
6.6 Conclusions 107
7 PLANNING IN SOFTWARE PROJECT MANAGEMENT –
DESCRIPTIVE ANALYSIS OF SURVEY
109
7.1 Introduction 110
7.2 Sample Demographics 110
7.3 Representative of the Sample 102
7.4 Software Project Characteristics 116
7.4.1 Project Types 116
7.4.2 Project Cost And Duration 116
7.5 People Factors In Planning 119
7.5.1 Customer 119
7.5.2 Project Managers 120
7.5.3 Project Team Members 122
7.6 Technical Factors In Planning 122

ix
7.6.1 Project Management Methods 123
7.6.2 System Development Methods 124
7.6.3 Life-Cycle Methods 125
7.7 Management Approach 127
7.7.1 Management Supports 127
7.7.2 Defining Goals And Scope 128
7.7.3 Communication Methods 129
7.7.4 Resource Availability 131
7.7.5 Management Styles 131
7.8 Planning Performance And Project Outcomes 132
7.9 Summary 134
8 DIFFERENCES IN PROJECTS BY SIZE, TYPE AND OWNERSHIP 135
8.1 Differences In Software Projects By Size 136
8.1.1 General Characteristics Of Software Projects 136
8.1.2 Human Factors 139
8.1.3 Technical Factors 139
8.1.4 Management Factors 140
8.1.5 Planning Performance And Project Outcomes 140
8.1.6 Summary 142
8.2 Differences In Software Projects Between Local And International
Companies
142
8.2.1 General Characteristics Of Software Companies And Projects 143
8.2.2 Human Factors 144
8.2.3 Technical Factors 146
8.2.4 Management Approach 147
8.2.5 Planning Performance And Project Outcomes 148
8.2.6 Summary 149
8.3 Differences in Software Project Types 149
8.3.1 Project Characteristics 150
8.3.2 Human Factors 151

x
8.3.3 Technical Factors 152
8.3.4 Management Approach 153
8.3.5 Planning Performance And Project Outcomes 154
8.3.6 Summary 156
9 THE RELATIONSHIP BETWEEN PLANNING FACTORS,
PLANNING PERFORMANCE AND PROJECT OUTCOMES
157
9.1 Introduction 158
9.2 Data Preparation 158
9.3 Reliability and Validity of Measures 159
9.3.1 Reliability 159
9.3.2 Content Validity 160
9.3.3 Construct Validity 160
9.4 Correlation Analysis 162
9.5 Multiple Regression Analysis 164
9.5.1 Assumptions in multiple regression analysis 164
9.5.2 Estimating the Regression Models 164
9.6 Logistic Regression Analysis 168
9.6.1 Model 1: The relationships between planning factors and
planning performance
168
9.6.2 Model 2: The relationships between planning performance and
project success and outcomes
169
9.6.3 Model 3: Relationship between project characteristics and
planning performance
170
9.7 The Impact of Planning Factors on Planning Performance 170
9.7.1 The Effect of The Human Factors on Planning Performance 170
9.7.2 The Effect of The Technical Factors on Planning Performance 172
9.7.3 The Effect of The Management Factors on Planning
Performance
174
9.8 The Impact of Planning Performance on Project Outcomes 176
9.9 The Impact of Project Characteristics on Planning Performance 181
xi
9.10 Summary 182
10 CONCLUSIONS AND MANAGERIAL IMPLICATIONS 185
10.1 Summary of Findings 185
10.1.1 Common Problems In Software Projects In Vietnam 186
10.1.2 Planning In Software Projects 187
10.1.3 Difference In Software Projects By Size, Type And Ownership 188
10.1.4 Relationship Between Planning Factors, Planning Performance
And Project Outcomes
190
10.2 Implications 194
10.2.1 Theoretical Implications 194
10.2.2 Managerial Implications 195
10.3 Limitations of the Research 196
10.4 Suggestions For Further Study 197
Bibliography 199
Appendices
Appendix A: Questionnaires 209
Appendix B: List of surveyed companies 223
Appendix C: Tables & Figures 233
xii
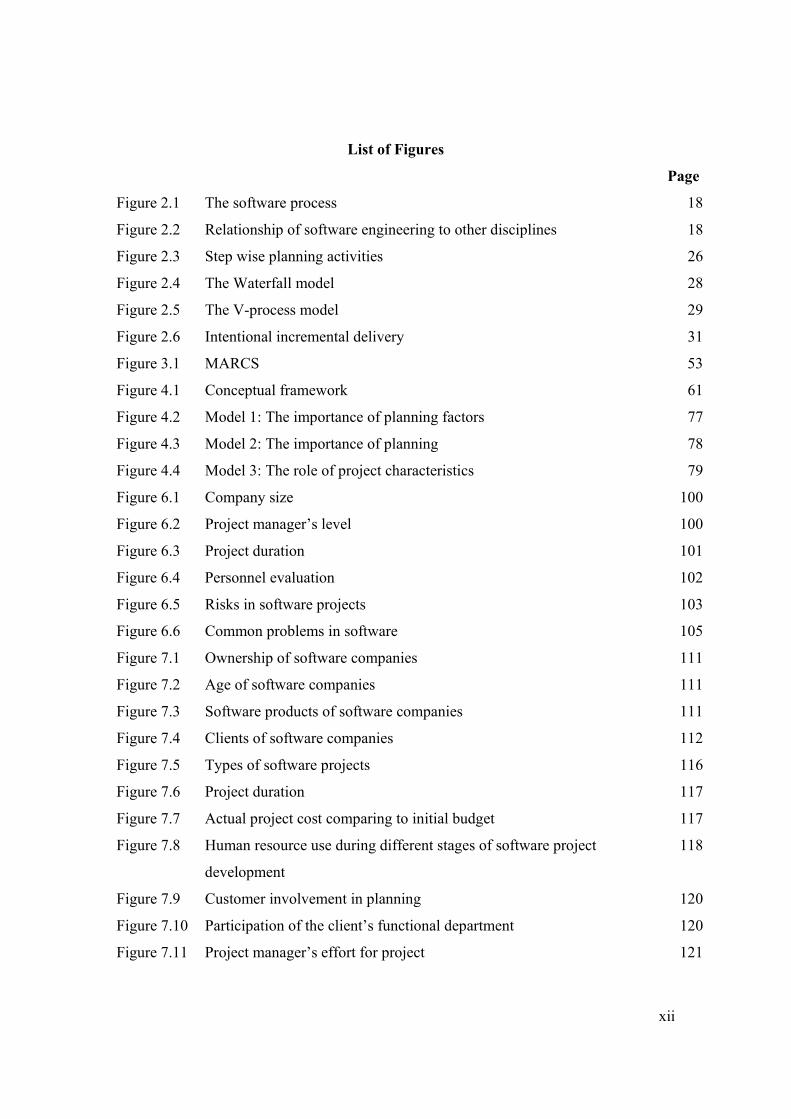
List of Figures
Page
Figure 2.1 The software process 18
Figure 2.2 Relationship of software engineering to other disciplines 18
Figure 2.3 Step wise planning activities 26
Figure 2.4 The Waterfall model 28
Figure 2.5 The V-process model 29
Figure 2.6 Intentional incremental delivery 31
Figure 3.1 MARCS 53
Figure 4.1 Conceptual framework 61
Figure 4.2 Model 1: The importance of planning factors 77
Figure 4.3 Model 2: The importance of planning 78
Figure 4.4 Model 3: The role of project characteristics 79
Figure 6.1 Company size 100
Figure 6.2 Project manager’s level 100
Figure 6.3 Project duration 101
Figure 6.4 Personnel evaluation 102
Figure 6.5 Risks in software projects 103
Figure 6.6 Common problems in software 105
Figure 7.1 Ownership of software companies 111
Figure 7.2 Age of software companies 111
Figure 7.3 Software products of software companies 111
Figure 7.4 Clients of software companies 112
Figure 7.5 Types of software projects 116
Figure 7.6 Project duration 117
Figure 7.7 Actual project cost comparing to initial budget 117
Figure 7.8 Human resource use during different stages of software project
development
118
Figure 7.9 Customer involvement in planning 120
Figure 7.10 Participation of the client’s functional department 120
Figure 7.11 Project manager’s effort for project 121

xiii
Figure 7.12 Level of specification control 121
Figure 7.13 Team member ability and attitude 122
Figure 7.14 System development methods 124
Figure 7.15 Life-cycle methods 125
Figure 7.16 Goals of project 128
Figure 7.17 Communication methods with customers 128
Figure 7.18 Communication methods within project team 128
Figure 7.19 Resource availability on software projects 130
Figure 7.20 Plan evaluation 132
Figure 10.1 Summary of findings 190
xiv
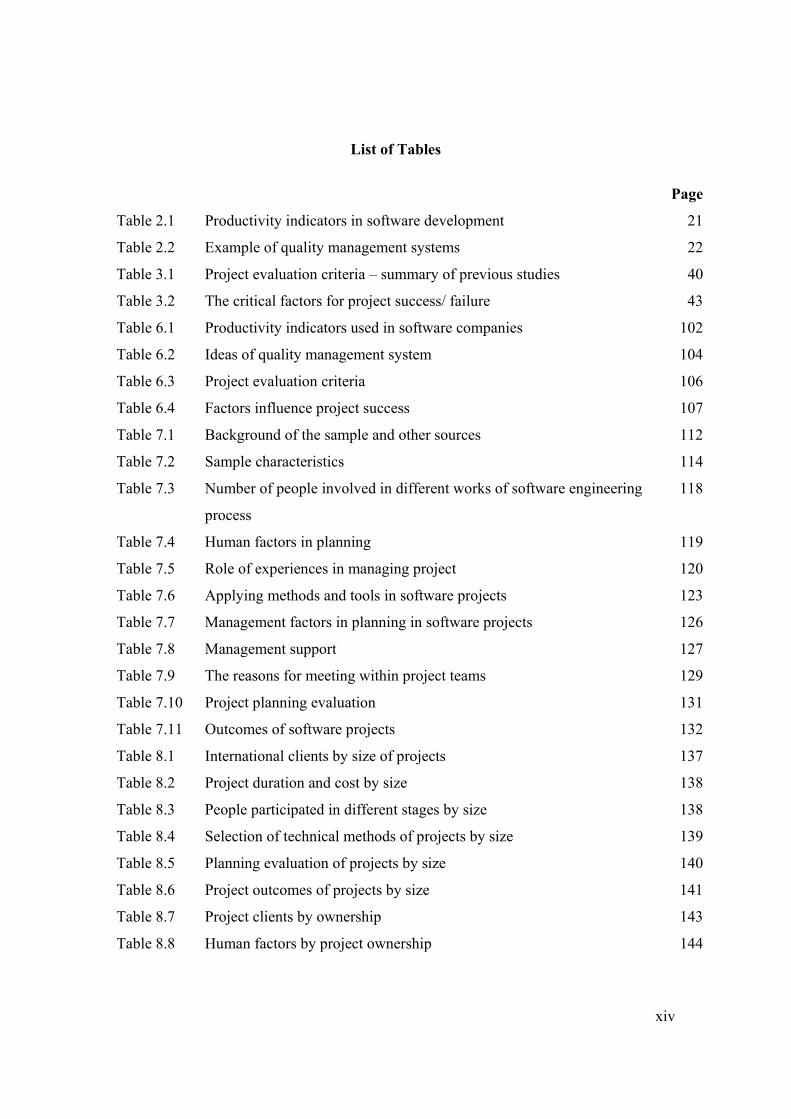
List of Tables
Page
Table 2.1 Productivity indicators in software development 21
Table 2.2 Example of quality management systems 22
Table 3.1 Project evaluation criteria – summary of previous studies 40
Table 3.2 The critical factors for project success/ failure 43
Table 6.1 Productivity indicators used in software companies 102
Table 6.2 Ideas of quality management system 104
Table 6.3 Project evaluation criteria 106
Table 6.4 Factors influence project success 107
Table 7.1 Background of the sample and other sources 112
Table 7.2 Sample characteristics 114
Table 7.3 Number of people involved in different works of software engineering
process
118
Table 7.4 Human factors in planning 119
Table 7.5 Role of experiences in managing project 120
Table 7.6 Applying methods and tools in software projects 123
Table 7.7 Management factors in planning in software projects 126
Table 7.8 Management support 127
Table 7.9 The reasons for meeting within project teams 129
Table 7.10 Project planning evaluation 131
Table 7.11 Outcomes of software projects 132
Table 8.1 International clients by size of projects 137
Table 8.2 Project duration and cost by size 138
Table 8.3 People participated in different stages by size 138
Table 8.4 Selection of technical methods of projects by size 139
Table 8.5 Planning evaluation of projects by size 140
Table 8.6 Project outcomes of projects by size 141
Table 8.7 Project clients by ownership 143
Table 8.8 Human factors by project ownership 144

xv
Table 8.9 Application of technical methods in the planning by projects ownership 146
Table 8.10 Management factors by projects ownership 147
Table 8.11 Planning evaluation by projects ownership 147
Table 8.12 Project clients by project type 149
Table 8.13 Project duration, cost and size by project type 150
Table 8.14 Human factors by project type 151
Table 8.15 Technical factors by project type 152
Table 8.16 Functional supports by project type 153
Table 8.17 Planning performance of projects by type 154
Table 8.18 Project outcomes by project type 155
Table 9.1 Homogeneity measure of the construct 159
Table 9.2 Correlation matrix 163
Table 9.3 Multiple Regression Results of Model 1 165
Table 9.4 Multiple Regression Results of Model 2 166
Table 9.5 Multiple Regression Results of Model 3 167
Table 9.6 Logistic regression analysis for the model 1 168
Table 9.7 Logistic regression analysis for the model 2 169
Table 9.8 Project success and planning tasks 177
Table 9.9 Qualitative benefits and planning tasks 178
Table 9.10 Financial benefits and planning tasks 179
Table 9.11 Completion time and planning tasks 179
Table 9.12 Completion cost and planning tasks 180
Table 9.13 Hypotheses testing results 182

xvi
1
1
INTRODUCTION
1.1 BACKGROUND OF THE VIETNAM SOFTWARE INDUSTRY ........................... 1
1.1.1 The Development of the Software Sector in Vietnam................................... 1
1.1.2 Government Support Policies for Software Industry in Vietnam.................. 3
1.2 OBJECTIVES OF THE STUDY................................................................................. 4
1.3 SIGNIFICANCE OF THE STUDY............................................................................. 7
1.4 METHODOLOGY....................................................................................................... 9
1.5 SCOPE OF THE STUDY .......................................................................................... 11
1.6 ORGANIZATION OF THE STUDY ........................................................................ 12
1.7 SUMMARY ............................................................................................................... 13
1.1 BACKGROUND OF THE VIETNAM SOFTWARE INDUSTRY
1.1.1 The Development of the Software Sector in Vietnam
Since the Doi moi policy with significant changes in policies and regulations, Vietnam
economy has been growing very quickly. Market economy transformation has made
Vietnam a country of high economic growth rate, stable macroeconomic environment and
integration into the world economy. Along with country economic development,
Information technology (IT) sector is growing and influencing other sectors of the
economy. Software is an important segment in the IT sector. It has quickly become one of
the most profitable and dynamic sectors in the world (Tran, 2001). Realizing the
importance and benefits that software sectors and IT industry can contribute to the country
economic development, Vietnam has had put emphasis on this industry as the lead sector to
help Vietnam in achieving a knowledge – based economy (VNN - Vietnam News, 2000).
2 Chapter 1
In the 90s, software industry in Vietnam was underdeveloped, but it then has a surge
blooming due to relatively strong demand for IT and software products and services. Since
then, the industry has had continuously growing with rapid increase in number of
established software enterprises. This sector has an average growth rate of 22.7%
(Hochiminh Computer Association – HCA, 2006). However, the overall value of this
market is still relatively small in comparison to other Asian economies. In 2005, the total
turnover of the Vietnamese Information Technology market, including hardware, software
and services, was US$ 828 million, an increase of 20.9% over 2004 (HCA, 2006).
The IT industry in Vietnam has an imbalanced structure. In 2000, hardware accounted for
83.3%, services and software were 17.6%. This imbalance has changed overtime. In 2005,
the market value of software and services was US$ 198 million, 23.9% of total market
value and the value of hardware was 72.1% (HCA, 2006).
Export turnover for software is a main contribution to the software industry development
as the export value can be much bigger compared to domestic market size. The year 2003
was a successful one for software outsourcing in Vietnam with exports revenue US$ 30
millions (HCA, 2004). In thee consecutive years from 2003 - 2005, the tunover of
software oursourcing for export have had the growth rate of 50%. In 2005, this number
reached US$ 70 millions (HCA, 2006). Japan is one of key markets for software
outsourcing with support from Japanese software businesses in Vietnam. The Corporation
for Financing and Promoting Technology (FPT) was the leader for software exports in
2004 of US$ 3.05 million (HCA, 2004). However, export revenue is mainly in outsourcing
and sub-contracting activities while revenues from software package are limited.
In Vietnam there are few software development companies. Most software companies
actually concentrate on hardware installation, computer training and services (Vietnam
Chamber of Commerce and Industry – VCCI, 2000). According to the HCA (2004), there
was 570 software companies with 12,000 software programmers. Most software companies
in Vietnam are of small scale with less than 20 employees (VCCI, 2000). The survey also
showed that most Vietnam local companies have less than 25 developers. According to
HCA’s criteria for classifying by size, the small business has from 10 – 30 employees, the
medium size business has about 30 – 100 persons and a large company is with more than
Introduction 3
100 employees. There are only some companies with more than 100 employees like FPT, a
Vietnam’s largest software producer, has 800 programmers, or TMA (Tuong Minh &
Associates) – a largest outsourcing company – has about 600 engineers. The productivity
of programmers in 2003 reached the level of US$ 10,000 per man – year (HCA, 2004).
Regarding the quality management system in software companies, at present, there are 3
companies in Vietnam with CMM certification and 33 services and software companies
with ISO 9001 certification (HCA, 2004). Domestic software companies still have to
struggle to survive in business. There are only a few local companies which can truly
compete with foreign companies. The local software market is overwhelmingly dominated
by foreign software suppliers who occupy 70% of the market (VCCI, 2000). The main
obstacles hindering the potential of local software companies are their own weaknesses
including the lack of infrastructure, and insufficient intellectual property rights. In
Vietnam, the rate of copyright piracy continued to be high at 90% in 2005 (BSA & IDC,
2006)
1.1.2 Government Support Policies for Software Industry in Vietnam
Vietnam Government has aimed at building software industry the leading sector with high
growth rate. Officially, the government has shown its commitment to develop Vietnam into
a main software exporter in the region via significant investments in software promotion
projects. A number of software parks have been built and put into operation by municipal,
provincial authorities and relevant Government agencies. They offer tax exemptions and
other incentives to software and related services firms. There are now around 10 software
parks in the country (Nguyen Duong, 2004) such as Hoa Lac high-tech Park, 30km west of
Hanoi City, established in 1999, Saigon Software Park and Quang Trung Software Park,
established in July 2000 and March 2001, respectively in Hochiminh City, Dannang
Software Park in Da Nang worth $1.7 million, established in 2000, Can Tho Software Park
in 2002. In addition, the Virtual Software Village project valued at US$7 million is now
being implemented to attract software customers and support domestic companies in
marketing their software products. Moreover, the government has applied most preferential
treatments to software enterprises, especially tax rates (Nguyen Duong, 2004), and many
decrees related to the policy of developing Information technology have been issued. These
decrees continue to strengthen the IT management of the government and to reduce the
4 Chapter 1
telecommunication – Internet prices, diversify services and abolish monopoly in
telecommunication sector (HCA, 2004). The protection of copyright can be achieved
through enhancing the enforcement of the law.
In spite of government efforts in industry development, the sector development in Vietnam
is still underdevelopment expectation. By 2000, the software industry was expected to
generate an output worth of US$500 million, 25,000 high-level experts and professional
programmers with good skill in English (Huynh, 2001). Three years later, the turnover of
software and services was US$ 515 million and the number of programmers was only
12,000, about half of the expected target in 2003 (HCA, 2004).
The selection of software as a key industry for development with government support and
commitment has created potential opportunities for investors in the software industry.
Vietnam may be the next software industry success story in Asia, highlighting the growing
competition in Asia in this knowledge-intensive sector (Asia Pacific Bullentin, 2002).
While it is far too soon to suggest Vietnam poses a threat to the position of regional
powerhouses like India and Singapore, its low wage costs for skilled software developers
will help it to make inroads into the market. Following India’s achievement history,
Vietnam can believe on the success of software industry in the near future. However, this
success is not guaranteed. Software companies nowadays have to increase productivity,
flexibility and efficiency, the key competitive advantages to grow and success. This study,
therefore, will focus on operational aspects which can help software companies manage
their development process to achieve success.
1.2 OBJECTIVES OF THE STUDY
In software industry, many techniques of general project management are applicable to
software development. However, the software industry has also achieved a notorious
reputation of poor performance in terms of schedule, cost, and quality assurance.
Estimating, planning, and quality control processes are so bad that the majority of large
system projects run late or exceed their budgets. Many are canceled without ever reaching
completion (Jones, 1998). This failure of software is often referred to as the “software
crisis”. This term refers to the fact that software projects are frequently delivered behind
schedule, cost more than the original estimates, fail to meet user requirements, are
Introduction 5
unreliable, and virtually impossible to maintain (Chatzoglou and Macaulay, 1996). A study
in the USA found that 31 percent of software projects were canceled before completion,
and more than half the projects cost an average of 189 percent more than their original
estimates (Whittaker, 1999).
“Software crisis” can be attributed to the poor application of design approaches, but also to
inadequate project management due to lack of recognition and understanding of the real
problems in software development (Ratcliff, 1987). Many previous studies have indicated
the role of project management for project success. The results of Blackburn et al (1996)
indicated that the methods employed to manage the project and the people involved in the
cross-functional process of software development tend to be more important than the tools
and technology. Although new technologies have been developed to facilitate software
development process, programmer’s knowledge and experience is still the key to better
software development. Therefore, managing the programmers and related stakeholders in
software development, is more important than the technology itself. In recent studies,
Aladwani (2002) found the positive significant relationship between project planning and
project success. Procaccino et al. (2002) also indicated the significant role of customer
involvement and support from top management to the success of a project. The more
customer involvement and top management support, the higher chance of project success.
Project management is therefore a very important aspect that influences project results.
This leads to the first research question in this study: What is the current status of project
management practices in the software industry in Vietnam, a developing country?
Project management includes four main activities: planning, monitoring, coordinating, and
reviewing. Many previous studies have mentioned the important role of planning in
software project management. Project planning can have a major influence in explaining
the variation in the success of organizational projects including IT related activities (Pinto
and Slevin, 1988). Chatzoglou et al. (1997) has proposed a model for determining the
factors affecting the identification of the customer’s requirements in planning. These
factors are divided into three groups: human, management and technical. Chatzoglou

6 Chapter 1
considered the influence of these factors on the number of interactions1 in the Requirement
Capture and Analysis (RCA) process, and then considered the level of resources that
should be allocated for RCA. For more interaction, more time is needed and additional cost
is involved. Chatzoglou’s model produces the estimations for resources needed for the
whole project as well as for the RCA stage. This model did not show the direct link
between each factor (human, management and technical) to the specific project outcomes.
Regarding the factors influencing the project outcomes, Whittaker (1999) revealed three
common reasons for project failures. The first reason is poor project planning in which
risks were not addressed or the project plan was weak. Secondly, the business case for the
project was weak. Lastly there was a lack of management, involvement and support.
Aladwani (2002) also reported a positive relationship between IT project planning and
performance. However, Callahan and Moretton (2001) could not determine the relationship
between amounts of time spent for planning and the time for software development. Dvir,
Raz and Shenhar (2003) have also studied the relationship between project planning effort
and project success. Their results indicated there is a high correlation between the planning
efforts for the development of functional requirements and the technical specifications of
the product with the overall project success.
Although the previous studies have considered many factors that influence project
outcomes, but planning was mentioned as an important factor for project success. It is
necessary to focus more on the role of planning, including the factors of planning and the
link between planning performance and specific outcomes. This study develops a
conceptual model to assess these relationships.
Firstly, this model will be useful for Vietnamese software companies. There have been few
research studies done in this field. Most research has been related to the macro policies for
industry development rather than on how software projects are managed. Little attention
has been given to the planning in project management and the main factors influencing
project outcomes. These are the research gaps that this study seeks to fill. Secondly, the
1 Number of interactions of the RCA process is number of repeated times of process: (a) gather information;
(b) examine and assimilate the information (in order to identify requirements); (c) test whether enough
information has been gathered and requirement identified.
Introduction 7
results will contribute not only to project managers in the Vietnamese context but also to
the emerging software industry in a transition economy.
This study will assess the planning process in a software project. Specifically, it has three
objectives. The first objective is to investigate the factors that influence planning
performance and develop a model that will identify the relationships between these factors,
planning performance and project outcomes. In previous studies, planning was considered
a factor that relates to project outcomes (Whittaker, 1999; Aladwani, 2002; Calahan and
Moreton, 2001). It is usually treated as an independent variable. Only few studies
considered planning as a dependent variable (Chatzoglou, 1997 and Dvir et al., 2003). This
study defines the factors that influence planning performance and its impact on project
outcomes. By reviewing the literature on software project management, a set of factors that
are hypothesized to affect planning performance will be derived. These factors are
categorized as human, technical and management. The influence of planning is considered
related to different aspects of project outcomes.
The second objective is to examine how planning is implemented in practice in the
emerging Vietnamese software industry. Differences in planning related different project
characteristics like size, type and ownership of software projects will be explored.
The final objective is to determine the causal relationships between the human, technical
and management factors, planning performance and project outcomes. The strength of
relationships help to define the key factors related to project success. Therefore, project
managers can influence these factors to achieve better outcomes. The moderating effect of
project characteristics on the relationship between planning factors and planning
performance proposed in the conceptual model is also investigated in this analysis.
1.3 SIGNIFICANCE OF THE STUDY
This study makes a contribution to both the theoretical and practical dimensions of
software project management. By reviewing and analyzing the previous studies on the
critical success/ failure factors in software project management, focusing on the role of
planning, the limited research concerning the critical factors for good planning
performance or on the link between planning and project outcomes was found. A

8 Chapter 1
theoretical model is specified to define the relationship between planning factors, planning
performance and project outcomes. This model is needed to understand the components of
planning and their impacts on project outcomes through planning performance in software
project management, especially in the context of a newly emerging industry like software
in a developing country. The results of this study help to understand the role of planning in
software project and to know how to achieve a good planning performance. It contributes
to the gaps in the theory of software project management which has considered the critical
factors for project success, but not related to the planning process. This analysis also
contributes to the knowledge of the characteristics of software project management as a
new industry emerges.
The findings are also very useful to both managers and policy makers of the government
related to the software industry of Vietnam. Firstly, this practical contribution will fill the
gap in understanding of Vietnamese software project management. At the moment, most
studies and market surveys were focused on macro aspects of the software industry like
assessing or forecasting the IT market, human resource development issues, government
policies and support policies. This initial empirical study will describe the current status of
software project management in Vietnam software sector. The results will present a general
evaluation of project team management, quality management and planning and indicate the
common problems in software projects.
Secondly, this study investigates the practice of planning in software projects through
human, management and technical factors. Project outcomes defined by different indicators
are also presented. This information is very helpful to project managers and stakeholders to
have a better understanding of planning and to improve the results of software projects in
Vietnam.
Thirdly, this study investigates the relationships between different planning factors and
planning performance and project outcomes. Understanding the role of planning to project
outcomes helps project managers to be more effective. They will better understand the
relationships between different aspects of planning performance and project outcomes, for
example whether or not the relationship between defining requirements and specifications
will influence project completion time and cost. This will help project managers to
consider how to improve the specific planning performance actions be able to improve
Introduction 9
specific project outcomes. Understanding the links between planning factors and planning
performance will help project managers to select and control these factors in order to
achieve better results. Then, they will be able to forecast the expected improvements in
planning performance and project outcomes if these factors are changed. Improving the
planning will solve the most common problems of poor planning in Vietnamese software
projects today. Through these research findings, better guidelines for project managers to
enhance, better preparation in planning will be identified.
Recognizing the current status of software project management will provide more
information to the policy makers to understand the importance of support policies for the
development of the software industry in Vietnam.
1.4 METHODOLOGY
To achieve the study’s objectives, a two – stage research project was designed. In the first
stage, an exploratory research will focus on two issues. The purpose of this research is to
describe the current status of project management in Vietnamese software companies. In
the second stage, the research will focus on defining factors influencing the software
project outcomes. The results of the first exploratory study will be the foundation for the
second stage study – an empirical analysis on the role of planning in software projects, and
its influence on performance.
This two – stage approach is selected because that literature on software project
management in the context of developing countries is not extensive. Theory (usually based
on studies in the context of developed countries) may be not relevant in practice, especially
in the context of an infant industry in which the project managers do not have much
experience and knowledge of project management. The exploratory approach will focus on
specific problems related to software and provide insights from the project manager’s point
of view.
The exploratory research is an empirical study. Methodology and results of this exploration
will be presented in Chapter 4 of this thesis. The results indicated that poor planning is the
most common problem in software project management. Based on this, the next stage
survey will focus on planning activities of software project. Through reviewing and

10 Chapter 1
analyzing previous research, a conceptual framework will be constructed. The analysis
includes three models to test a comprehensive set of hypotheses. Correlation and regression
analysis will be used to investigate the causal relationships in those models.
The first model analyzes the relationship between planning factors (11 factors) and
planning performance. Planning performance was considered the dependent variable.
Planning factors were identified as independent variables such as project manager’
experience and efforts, team member capability, customer involvement, applied project
management, system development and life cycle method, management support, project
objectives, resource availability and management styles.
The second model explores the relationship between planning performance and 5 project
outcomes. In this model, planning performance becomes an independent variable and
project outcomes will be treated as dependent variables. In the overall framework of the
study, planning performance plays the role of explanatory variable.
The third model examines the effect of project characteristics on relationship between
planning factors and planning performance. The differences of behavior and performance
between different software project size, type, and ownership are identified. The moderating
effect of different project types is examined.
Data collection for the two stages is different. The sampling frame is based on the
Information Technology Directory – Vietnam, 2003. This list included company name,
address, year of establishment, number of employees, and their major products. First, a
random sample was selected and sent by mail. The response rate was low. Then, a snow
ball sampling approach was used. Through some software project managers - a respondent
network was created by the nomination of initial respondents. This sampling method
begins with few project managers and spreads out on the basic of links to the initial cases.
The questionnaire will be distributed and collected mainly by this method. The exploratory
research includes 55 questionnaires collected from Hochiminh City. Data for the in – depth
survey will be collected from 80 software projects in both Hanoi and Hochiminh City.
Additionally, 13 other project managers were interviewed in-depth for qualitative analysis.
Introduction 11
For analysis of data, SPSS software will be used. Descriptive statistics, factor analysis, and
regression techniques will be used for the analysis of the relationships and testing the
hypotheses. The validity and reliability of variables will also be analyzed. Details of the
research methodology will be presented in Chapter Four.
1.5 SCOPE OF THE STUDY
There are various approaches used in project management. According to the Institute of
Electrical and Electronics Engineers (IEEE) (1993), “software project management is the
process of planning, organizing, staffing, monitoring, controlling, and leading a software
project”. The Guide to the Project management Body of Knowledge (PMBOK Guide)
(PMI, 1996) describes project management as including five types of management
processes: initiating, planning, executing, controlling and closing. This study adopted the
PMBOK definition for software project management. This definition separates project
management into specific tasks to focus on a particular process of project management.
This study is conducted in the context of software industry in Vietnam, which is considered
a very productive industry with high value added. The software industry has been a key
industry in many Asia countries like India, Singapore or Taiwan.
This study focuses only on software development projects in commercial software
companies rather than companies which develop software for their own use. In fact,
software project development also is undertaken by companies themselves in different
sectors, but they are not very extensive or professional because the level of information
technology in Vietnamese companies is still low. This project therefore does not choose
software development projects for own usage because of its lack of substance and
suitability.
The study targets the entire population of Vietnamese software companies with about 600
companies (IT Directory in 2003). In fact, software companies are mainly located in two
major centers: HoChiMinh City and Ha noi, for this reason the survey is conducted in these
cities. A mailed survey was employed to collect data. In order to obtain the data of
software projects, project managers were chosen as the appropriate respondents. They
could provide all information related to their projects.

12 Chapter 1
1.6 ORGANIZATION OF THE STUDY
This study contains 10 chapters. The first chapter is the Introduction. In this chapter, an
overview of Vietnam software industry is presented. It identifies the role of the software
industry in a developing country whose main advantage is human resources. This chapter
also introduces the reasons to focus on project management in software development for
this research. The objectives, scope and contributions of this study are described in
following sections of chapter one.
Chapter Two presents the concepts and definitions related to software project management.
The purpose of Chapter Two is to examine the theoretical background of software
engineering and project management. Chapter Three reviews the related studies on
software project management.The analysis of previous studies on the evaluation of project
and critical factors for success are also presented in Chapter Three. This is the foundation
for exploratory research (Chapter Six) and to develop the conceptual framework (Chapter
Four).
Chapter Four describes the conceptual framework, hypotheses and research methodology.
The model of relationship between planning factors, planning performance and project
outcomes is specified. Based on this model, the hypotheses are developed. This chapter
also discusses various methodological issues such as the operationalization and
measurement of variables and the sampling method.
Chapter Five presents the qualitative analysis of software project management through a
case of a software project in the leading software company in Vietnam – the Financing and
Promoting Technology Corporation. This chapter will describe the actual project planning
in the context of study.
Chapter Six presents the results of exploratory research on software project management
and defines the main issues related to the in - depth empirical study. This chapter describes
the current status and common problems of software project management in Vietnamese
context through empirical research. The research results also contribute to the theoretical
understanding of the evaluation criteria and successful factors for a software project in
Introduction 13
practice. This is to supplement the repertoire of knowledge on software project
management typically characteristic of the developed countries industry context.
Chapter Seven presents the results of the survey about software project planning. This
chapter describes the characteristics of software companies and software projects in the
survey sample. The planning process in software projects analyzes three groups of factors:
human, technical and management. The last section of this chapter presents the assessment
of project managers concerning planning, planning performance and project outcomes.
Chapter Eight presents the results of analysis of differences by project size (below and
above average size group), project ownership (belonging to local or foreign companies)
and project types (commercial, made-to-order or outsourcing). The analysis includes a
comparison of project characteristics, planning factors, planning performance and project
results of these groups. The statistical results, discussions and explanations are presented to
support the findings.
Chapter Nine describes the hypothesis testing. Firstly, the analysis of validity and
reliability and testing the assumptions for regression analysis are discussed. Secondly, each
hypothesis is presented with supporting statistical results and discussion. In the final
section, a short summary of the importance of hypotheses is presented.
Chapter Ten is an overview of the findings and the implications for theory of project
management, planning and effective practices for project management.
1.7 SUMMARY
This chapter presents the introduction of this research. The background information of the
Vietnamese software industry is introduced. Based on an analysis of the theory and
practice, the rationale and purpose of this study are presented. The objectives for the
research are specified. This section is followed by the significance and the scope of the
study, and a short description of research methodology. This chapter ends by presenting an
outline of the complete research study.

14 Chapter 1
15
2
CONCEPTS AND DEFINITIONS
2.1 SOFTWARE PRODUCT AND PROCESS................................................................ 16
2.1.1 Software Product ......................................................................................... 16
2.1.2 Software Process.......................................................................................... 17
2.2 SOFTWARE PROJECT MANAGEMENT .............................................................. 19
2.2.1 Concepts of Software Project Management ................................................ 19
2.2.2 Software Project Management Functions.................................................... 20
2.3 PLANNING IN SOFTWARE DEVELOPMENT PROJECTS................................. 24
2.3.1 Planning ....................................................................................................... 24
2.3.2 Life-cycle Models........................................................................................ 27
2.3.3 System Development Methodologies.......................................................... 31
2.3.4 Planning Techniques.................................................................................... 32
2.4 SUMMARY ............................................................................................................... 34
In this chapter, the terminology and concepts related to this study are presented. The first
section presents the concepts related to software products and the design process. The
second section includes the concepts, definitions and key areas of software project
management. The last section describes the concepts and activities related to planning. This
section also reviews the methods and techniques used in planning.

16 Chapter 2
2.1 SOFTWARE PRODUCT AND PROCESS
2.1.1 Software Product
Software is defined as (1) instructions (computer programs) that when executed provide a
desired function and performance, (2) data structures that enable the programs to
adequately manipulate information, and (3) documents that describe the operation and use
of the programs (Pressman, 1997).
Software is a logical rather than a physical system element. According to Pressman (1997)
a software product has three characteristics. Firstly, software is developed or engineered. It
is not manufactured in the classical sense. Secondly, software is not “worn out”. It is not
susceptible to the environmental condition which causes hardware to be worn out, but it
may deteriorate. Finally, most software is custom – built, rather than being assembled from
existing components. In fact, with a few exceptions, there are no catalogs of software
components. It is possible to order off-the-shelf software, but only as a complete unit, not
as components that can be reassembled into new program. Today, with the developments
in software technology, the possibility to reuse software components is increasing.
Reusability becomes an important characteristic of a high – quality software product. The
last characteristic of Pressman (1997) therefore, is not relevant.
There are many ways to classify software products. For functionality it can be classified as
application or system software. Because there are so many different uses for computers,
there are correspondingly a large number of different application programs. Some of which
are of special function or “packages” tailored for a specific purpose (e.g., inventory control
or payroll). There are also general-purpose application programs that are not linked to any
specific business task, but support instead general types of information processing. The
most widely used general-purpose application packages include spreadsheet, data
management, word processing, desktop publishing, graphics, multimedia, and
communications. Some of these general-purpose tools are actually development tools that
can be used for creating applications.
Many decision support and business applications are built with programming languages
rather than with general-purpose application programs. This is especially true for complex,

Literature Review – Concepts and Definitions 17
unstructured problems. Information systems applications can also be built with a mix of
general-purpose programs and/or with a large number of development tools ranging from
editors to random number generators.
Systems software is a class of programs that controls and supports the computer hardware
and its information processing activities. Systems software also facilitates the
programming, testing, and debugging of computer programs. It is more generalized than
applications software and is usually independent of any specific type of application.
According to Krishnan (1998) the software industry can be broadly classified into custom
software, software service and packaged software. Custom software includes internal
system development within an organization. Software service includes the systems
integration and systems consulting services provided by a wide range of organizations,
from an independent programming consultant to large consulting organizations. The
packaged software domain includes all software sold as tradable products.
2.1.2 Software Process
There are some different definitions of the software development process. According to the
Institute of Electrical and Electronics Engineers, software engineering is (1) the application
of a systematic, disciplined, quantifiable approach to the development, operation, and
maintenance of software; that is, the application of engineering to software, and (2) the
study of approaches to application (IEEE, 1993). A software process determines activities
and organizational procedures to enhance collaboration in the development team so that a
quality product is delivered to the customers (Leszek, 2001).
Pressman (1997) described the software process as an approach that includes framework
activities and umbrella activities as shown in Figure 2.1. A Common Process Framework is
established by defining a small number of framework activities that are applicable to all
software projects, regardless of their size or complexity. A number of task sets – each
collection of software engineering work tasks, project milestones, software work products
and deliverables, and quality assurance points which enable the framework activities to be
adapted to the characteristics of the software project and the requirements of the project
team. Finally, umbrella activities, including software quality assurance, software
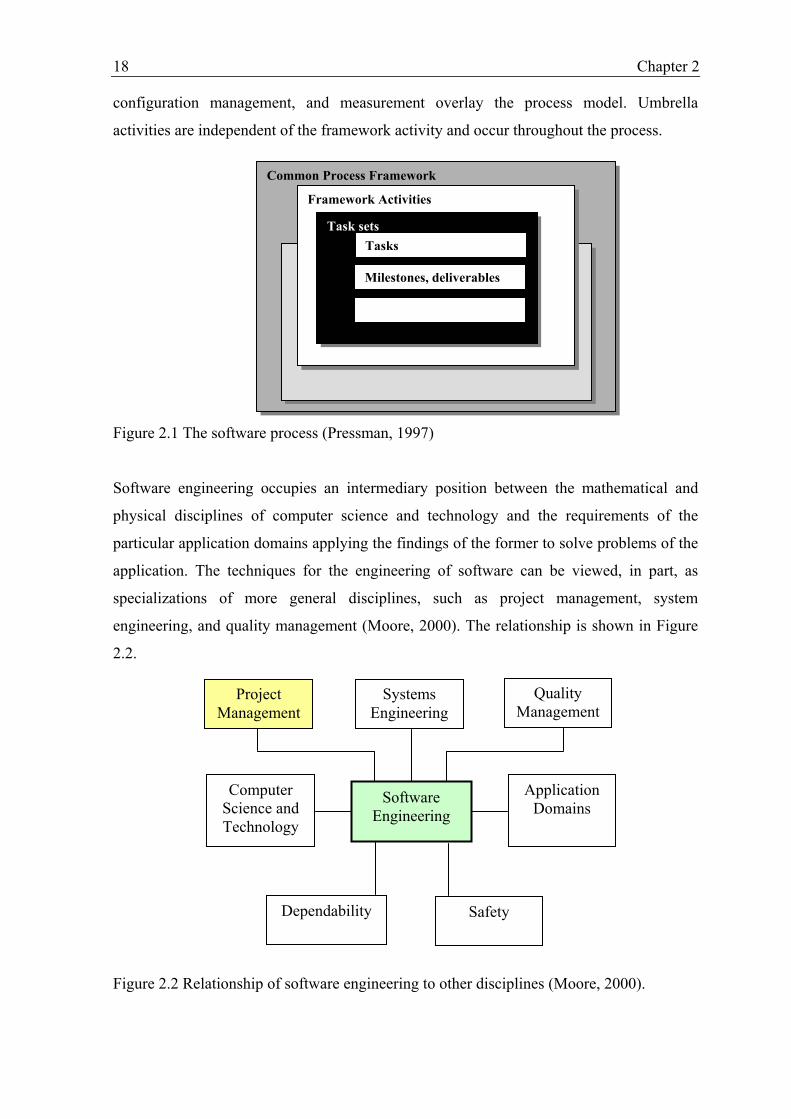
18 Chapter 2
configuration management, and measurement overlay the process model. Umbrella
activities are independent of the framework activity and occur throughout the process.
Figure 2.1 The software process (Pressman, 1997)
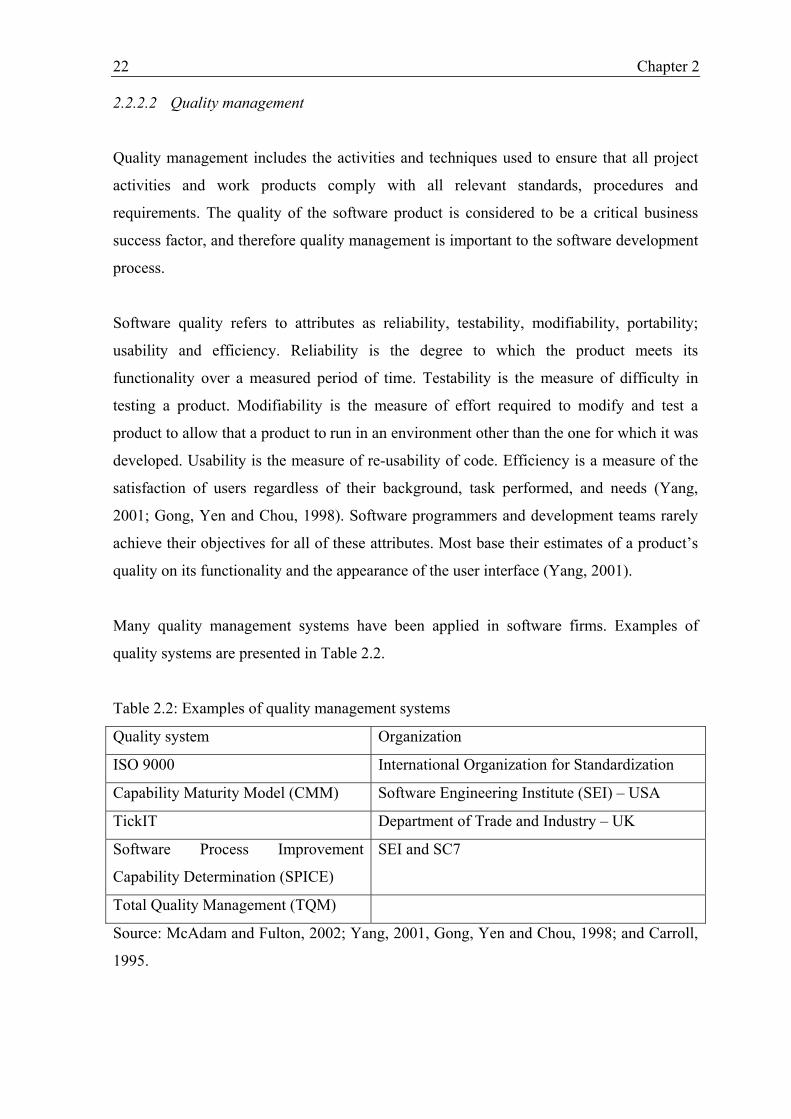
Software engineering occupies an intermediary position between the mathematical and
physical disciplines of computer science and technology and the requirements of the
particular application domains applying the findings of the former to solve problems of the
application. The techniques for the engineering of software can be viewed, in part, as
specializations of more general disciplines, such as project management, system
engineering, and quality management (Moore, 2000). The relationship is shown in Figure
2.2.
Figure 2.2 Relationship of software engineering to other disciplines (Moore, 2000).
Common Process Framework
Framework Activities
Task sets Tasks
Milestones, deliverables
Software Engineering
Quality Management
Systems Engineering
Project Management
Computer Science and Technology
Dependability Safety
Application Domains

Literature Review – Concepts and Definitions 19
This study will focus on a specific emphasis of software engineering that is project
management. It will not consider technical aspects like computer science and technology or
application domains.
Computer programmers write, test, and maintain the detailed instructions, called programs
or software that computers must follow to perform their functions. They also conceive,
design, and test logical structures for solving problems by computer. Many technical
innovations in programming – advanced computing technological innovations in
programming tools – have redefined the role of a programmer and elevated much of the
programming work done today. In short, computer programmers refer to individuals whose
main job function is programming. This group has a wide range of responsibilities and
education backgrounds.
2.2 SOFTWARE PROJECT MANAGEMENT
2.2.1 Concepts of Software Project Management
The Institute of Electrical and Electronics Engineers (IEEE) (1987) defines “software
project management is the process of planning, organizing, staffing, monitoring,
controlling, and leading a software project”. This is a common definition of project
management. However, unlike hardware development or construction projects, there are
three characteristics that make software project different from others. Firstly, it is not
obvious until very late in the project whether or not the code meets the requirements.
Secondly, the software development process is mainly implemented in the mind and it is
virtually impossible to measure progress until it is completed. Lastly, testing the software
product and integrating it are neither simple nor obvious (Parth, 1999).
Software project management can be defined as the process of making visible what is
invisible. Specifically, the software engineering process is invisible because its progress is
not immediately visible. Software products contain more complexity than other engineered
artifacts. Software developers have to conform to the requirements of human clients.
Clients sometimes are inconsistent and organizations have lapses in their collective
memory, or in communication that developers have to cater for. Lastly, software systems
are likely to be subject to a high degree of changes (Hughes and Cotterell, 2002). By this

20 Chapter 2
definition, managing a software project is not an easy task. This is the reason why project
management in the Information Technology area has had a poor success rate, an issue
which will be examined in the next section.
2.2.2 Software Project Management Functions
The functions of project management include defining the requirements, establishing the
extent of work, allocating the resources required, planning the execution of the work,
monitoring the progress and adjusting deviations from the plan (Munns and Bjeimi, 1996).
The Project Management Body of Knowledge Guide (PMBOK Guide) (Project
Management Institute, 2000) describes five types of management processes: initiating,
planning, executing, controlling and closing. This guide specializes in process types with
37 aspects of processes that are applied to nine program management knowledge areas,
namely: project integration, scope, time, cost, quality, human resource, communications,
risk and procurement (Moore, 2000).
For this exploratory research, the focus will be on key knowledge areas including human
resource, quality, and time management.
2.2.2.1 Human Resource management
Human resource management includes all the processes that will be undertaken to identify,
secure and maintain an effective project team. This may take place in a self-contained team
management plan or it may be a section of the project plan. The team management plan
may include staffing, team structure, team communication, conflict resolution,
performance appraisal and training. A recent survey of leading software organizations in
Europe identified that the quality of people in a software team is one of the most important
factors in improving productivity and quality in software projects (Blackburn et al., 1996).
To effectively manage the project team, the manager has to focus on training, motivating
and evaluating the project personnel.
One important indicator of the quality of people is productivity, however reliable measures
of software productivity have eluded researchers for years (Yu, Smith, and Huang, 1990).

Literature Review – Concepts and Definitions 21
Indicators which could be used for software productivity measurement include size –
oriented and function – oriented metrics (Hughes and Cotterell, 2002).
Size – oriented metrics are derived by normalizing quality and/or productivity measures by
considering the “size” of the software that has been produced. In order to develop metrics
that can be assimilated to metrics from other projects, lines of code (LOC) is considered as
a normalization value. A set of simple size-oriented metrics which could be developed for
each project is presented in Table 2.1. Size-oriented metrics are not universally accepted as
the best way to measure the process of software development (Jones, 1999). Most of the
controversy is related to the use of lines of code (LOC) as a key measure. However,
research in this area has often used LOC for measuring project productivity or size. Other
research indicated that productivity measured by lines of code per man-month spent on the
project area is different by types of project. For business application, the average was 1,040
LOC/ man-month or 1.04 KLOC/ man – month (Blackburn et al, 1996).
Table 2.1: Productivity indicators in software development
Size – oriented metrics Function – oriented metrics
- errors per KLOC (thousand lines of code)
- defects per KLOC
- $ per LOC
- pages of documentation per KLOC
- errors/ person-month
- LOC per person-month
- $/ page of documentation
- errors per FP
- defects per FP
- $ per FP
- page of documentation per FP
- FP per person-month
Source: Pressman, 1997
The function point metric was created to measure the size, productivity, quality and other
attributes of software applications. The function point (FP) metric is composed of the
weighted totals of five external aspects of software application, namely inputs, outputs,
logical files, inquiries and interfaces (Jones, 1998). The common indicators of productivity
by the function – oriented measurement approach is presented in Table 2.1.
22 Chapter 2
2.2.2.2 Quality management
Quality management includes the activities and techniques used to ensure that all project
activities and work products comply with all relevant standards, procedures and
requirements. The quality of the software product is considered to be a critical business
success factor, and therefore quality management is important to the software development
process.
Software quality refers to attributes as reliability, testability, modifiability, portability;
usability and efficiency. Reliability is the degree to which the product meets its
functionality over a measured period of time. Testability is the measure of difficulty in
testing a product. Modifiability is the measure of effort required to modify and test a
product to allow that a product to run in an environment other than the one for which it was
developed. Usability is the measure of re-usability of code. Efficiency is a measure of the
satisfaction of users regardless of their background, task performed, and needs (Yang,
2001; Gong, Yen and Chou, 1998). Software programmers and development teams rarely
achieve their objectives for all of these attributes. Most base their estimates of a product’s
quality on its functionality and the appearance of the user interface (Yang, 2001).
Many quality management systems have been applied in software firms. Examples of
quality systems are presented in Table 2.2.
Table 2.2: Examples of quality management systems
Quality system Organization
ISO 9000 International Organization for Standardization
Capability Maturity Model (CMM) Software Engineering Institute (SEI) – USA
TickIT Department of Trade and Industry – UK
Software Process Improvement
Capability Determination (SPICE)
SEI and SC7
Total Quality Management (TQM)
Source: McAdam and Fulton, 2002; Yang, 2001, Gong, Yen and Chou, 1998; and Carroll,
1995.
Literature Review – Concepts and Definitions 23
In the following sections, three well – known quality management systems in software
development in Vietnam, including ISO 9000, TQM and CMM are presented.
ISO 9000 has been effectively adapted for use in the software industry. From the ISO 9000
series, ISO 9001 is the most pertinent standard for software development and maintenance.
It is applied to ensure that the supplier conforms to specified requirements during several
stages of development – including design, development, production, installation, and
servicing. ISO9000-3 provides guidelines for applying standard to the development, supply
and maintenance of software (McAdam and Fulton, 2002; Yang, 2001).
TQM is a paradigm and a philosophy first adopted in Japan. TQM originated in the
manufacturing sector but is increasingly applied to other sectors such as the service
industries, health, government and education (Dean and Bowen, 1994).There is a growing
trend of adopting the TQM philosophy to software development. Applying TQM to the
software development process can control software quality and productivity (Gong, Yen
and Chou, 1998). The key elements of TQM include: customer focus, attention to process,
continuous improvement, measurement and analysis of data, and human factors, such as
management and leadership.
The capacity maturity model (CMM) was created by the Software Engineering Institute in
the late 1980s to help software organizations improving their software processes along an
evolutionary path (Paulk, 1994). The CMM describes the principles and practices
underlying software process maturity and assesses software process capability at five
levels: initial, repeatable, defined, managed, and optimizing. Except for the first level, each
level has a set of key process areas on which an organization should focus to improve its
software process. Each level also is a well-defined evolutionary plateau directed toward
achieving a more mature software process at the next level (McAdam and Fulton, 2002;
Yang, 2001).
2.2.2.3 Time management
Time management includes the processes and techniques used to ensure the timely
completion of the project. It involves the development and management of the project work
activities and the project schedule. As part of the project planning specifically, the

24 Chapter 2
definition phase, a detailed project schedule and work breakdown structure should be
defined based on a project proposal. The project schedule must show the dates when each
activity should start and finish and how much each resource will be required during the
schedule (Hughes and Cotterell, 2002).
2.3 PLANNING IN SOFTWARE DEVELOPMENT PROJECTS
The concepts and definitions in this section concentrate on planning in software projects.
This is the foundation for the in-depth analysis (second stage) of this study.
2.3.1 Planning
The literature on project planning may be divided into two streams. The first stream
concerns the strategic aspects of project planning and focuses on the selection of projects
that are congruent with organizational goals. The second stream of project planning
research concerns the process of planning individual projects (Aladwani, 2002). Hughes
and Cotterell (2002) offered an outline of main planning activities in a software
development project. This outline includes both the strategic planning streams. The outline
is displayed in Figure 2.3. In this study, the interest is on planning within individual
projects. Project planning, with reference to the extent to which timetables, milestones,
workforce, equipment, and budget are specified (Slevin and Pinto, 1986). According to
Chatzoglou and Macaulay (1996), planning system development means determining what
work must be done, who will accomplish it, and when it will be done. Specifically, project
planning involves estimating the effort, time, cost and staff resources needed to execute the
project.
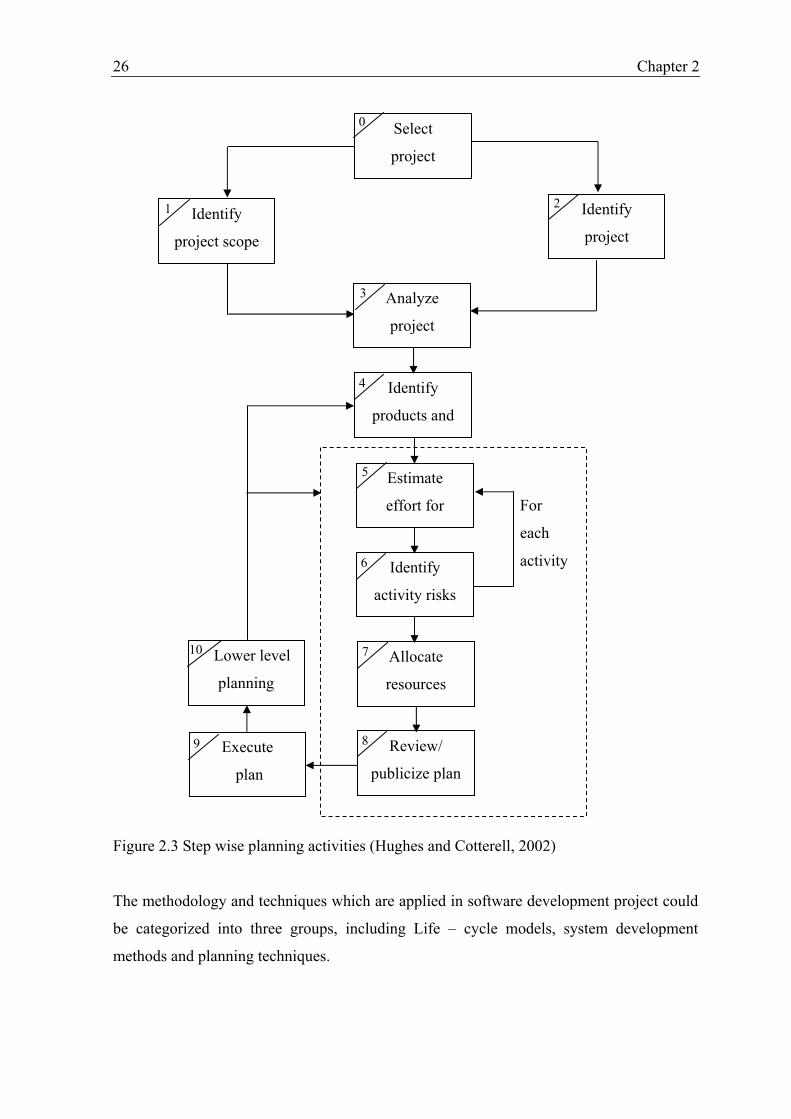
According to Hughes and Cotterell (2002) planning includes seven steps as presented in
Figure 2.3. Step One is to identify the project scope and objectives. The activities in this
step ensure that all the parties to the project agree on the objectives and are committed to
its success. A common problem is overlooking people who are affected by the project. Step
Two is to identify the project infrastructure. There is usually an existing infrastructure into
which the project can fit. Project leaders must identify the precise nature of this
infrastructure. Step Three is to analyze the project characteristics. This is to ensure that the
appropriate methods are used for the project. Step Four is to identify project products and

Literature Review – Concepts and Definitions 25
activities. A more detailed planning of individual activities is done. Step Five is to estimate
the effort for each activity. Effort is the amount of work that needs to be done. The elapsed
time – the time between the start and the end of a task – is estimated based on this effort.
The individual activity estimates of effort should be summed to get an overall actual
estimate which can be reconciled with the previous planned estimate. These estimates
could reveal that some activities are going to take a longer time. Longer activities are more
difficult to control. It would better to break this down into a series of smaller sub-tasks.
Step Six is to identify activity risks. The project manager should identify and quantify the
project risks through considering each activity. A risk reduction approach is produced. The
risk analysis in this step should consider the last step and change the estimation of effort
for each activity. Step Seven is to allocate resources. Based on the estimated efforts in step
five, the staff available for the project is identified and is allocated to specific tasks. In Step
Eight, the project manager will review the quality aspects of the project plan and then
document this plan and obtain the agreements. Finally, in steps Nine and Ten, the project
manager executes the plan and initiates lower level planning.
This step wise planning approach is used to construct a framework to identify and analyze
activities in planning of specific software projects in the in – depth survey conducted in
this research.
The selection of software development methodology and planning techniques do impact
project results (Verner, Overmyer, McCain, 1999). Moreover, fast changing technology
(such as new languages, new operating systems or increased hardware speed, etc.) and the
higher requirements in the business environment (such as, increasingly complex
applications, high development costs or time-to-market) have a strong influence on the
management of software development projects (Parth, 1999).
26 Chapter 2
Figure 2.3 Step wise planning activities (Hughes and Cotterell, 2002)
The methodology and techniques which are applied in software development project could
be categorized into three groups, including Life – cycle models, system development
methods and planning techniques.
Identify
project
Select
project
Identify
project scope
Analyze
project
Identify
products and
Estimate
effort for
Identify
activity risks
Allocate
resources
Review/
publicize plan
Execute
plan
Lower level
planning
For
each
activity
0
2 1
3
4
5
6
7
89
10

Literature Review – Concepts and Definitions 27
2.3.2 Life-cycle Models
The life – cycle model (or process model) is a development strategy that encompasses the
process, methods, and tools layers that are used to build software. The research of Verner,
Overmyer, McCain (1999) indicated that the choice of the right life – cycle methodology is
a key factor in the successful projects.
There are many views on how to develop information systems. Some of these perspectives
have been captured in particular methodologies, for example: ad hoc (Jones, 1990),
waterfall (Royce, 1970), participative (Mumford and Weir, 1979), soft systems
(Checkland, 1981), prototyping (Naumann and Jenkins, 1982), incremental (Gilb, 1988),
spiral (Boehm et al., 1984), reuse (Matsumoto and Ohno, 1989), formal (Andrews and
Ince, 1991), rapid application development (Martin, 1991; Morton, 2004), object-oriented
(Humphrey, 1990) and software capability (Jones, 1986).
In this section, the popular life-cycle models are described, namely the waterfall, V-
process, spiral, software prototyping and incremental delivery approach. The details of
these approaches are suggested by Hughes and Cotterell (2002).
2.3.2.1 The Waterfall model
This is the “classical” model of system development. Figure 2.4 describes this model as a
sequence of activities working from top to bottom. The diagram shows some arrows
pointing upwards and backwards. This indicates that a later stage may reveal the need for
some extra work at an earlier stage, but this should definitely be the exception rather than
the rule. The limited scope for interaction is in fact one of the strengths of this process
model. With a large project it is necessary to avoid reworking tasks previously completed.
Reopening completed activities changes the promised completion dates.
Hughes and Cotterell (2002) indicate there is nothing intrinsically wrong with the waterfall
approach, even though alternative models are advocated. It is the ideal process for which
the project manager strives. If the software to be developed is familiar to the project team
(in terms of application domains and technology), the waterfall approach allows project

28 Chapter 2
completion times to be forecast with more confidence than more iterative approaches,
allowing projects to be controlled effectively.
Figure 2.4 The Waterfall model
2.3.2.2 The V-process model
Figure 2.5 gives a diagrammatic representation of this model. This is an elaboration of the
waterfall model and stresses the necessity for validation that will match the activities that
create the products of the project.
The V-process model can be seen as expanding the activity testing in the waterfall model.
Each step has a matching validation process which can, where defects are found, cause a
loop back to the corresponding development stage and a reworking of the following steps.
Ideally, this feedback should only occur where a discrepancy has been found between what
was specified by a particular activity and what was actually implemented in the lower level
of activity.
Feasibility study
User reqs.
Analysis
System design
Program design
Coding
Testing
Operation

Literature Review – Concepts and Definitions 29
Figure 2.5 The V-process model
2.3.2.3 The Spiral model
This is another way of looking at the waterfall model. In the waterfall model, it is possible
to escape at the end of any activity in the sequence. A feasibility study might decide that
the implementation of a proposed system would be beneficial. Management authorizes the
detailed analysis of user requirements. Some analysis might already have taken place at the
feasibility stage, but a more thorough investigation is launched. This could reveal that the
costs of implementing the system would be higher than the projected benefits and lead to a
decision to abandon the project.
The greater level of detail considered at each stage of the project leads to a higher degree
of confidence about the success of the project. This can be portrayed in a loop or a spiral
where the system to be implemented is considered in more detail in each application. Each
stage terminates with an evaluation before the next interaction is taken.
Feasibility study
User reqs.
System design
Program design
Code
System testing
User acceptance
Program testing
Review Corrections
Corrections
Corrections
Corrections
30 Chapter 2
2.3.2.4 Software prototyping
A prototype is a working model of one or more aspects of the projected system. It is
constructed and tested quickly and inexpensively in order to test assumptions. Prototypes
can be classified as throw-away or evolutionary.
In throw-away prototypes, the prototype is used only to test ideas and is then discarded
when the actual development of the operational system begins. The prototype could be
developed using a different software environment or even a different hardware platform. In
evolutionary prototypes, the prototype is developed and modified until it can become the
operational system. In this case the standards that are used to develop the software have to
be carefully considered (Hughes and Cotterell, 2002).
According to developers, using the prototype approach helps both software project team
and customer develop are understanding of the customer’s expectations. Often, a customer
defines a set of general objectives for software but does not identify detailed input,
processing, or output requirements. In other cases, the developer may be unsure of the
efficiency of an algorithm, the adaptability of an operating system, or the form that human
– machine interaction should take. In this situation, a prototyping solution may offer the
best approach. (Presman, 1997).
2.3.2.5 Incremental delivery
The incremental model combines the elements of the linear sequential model with the
interactive philosophy of prototyping. But unlike prototyping, the incremental model
focuses on the delivery of an operational product with each increment. Early increments
are “stripped down” versions of the final product, but they do provide capability that serves
the user and also provide a platform for the evaluation by the user (Pressman, 1997). The
application of this approach is word-processing software.
This approach involves breaking the application down into small components which are
then implemented and delivered in sequence. Each component delivered must give some
benefit to the user (Pressman, 1997). Figure 2.6 gives a general outline of the approach.
Time boxing is often associated with an incremental approach. Here the scope of the

Literature Review – Concepts and Definitions 31
deliverables for an increment is rigidly constrained by an agreed deadline. This deadline
has to be met, even at the expense of dropping some planned functionality. Omitted
features can be transferred to later increments (Hughes and Cotterell, 2002).
Figure 2.6 Intentional incremental delivery (Hughes and Cotterell, 2002).
2.3.3 System Development Methodologies
System development methodologies are promoted as a means of improving the
management and control of the software development process, structuring and simplifying
the process, and standardizing the development process and product by specifying
activities to be done and techniques to be used (Russo and Walz, 1995).
System development methods are rapidly changing with the development of new
technology in software engineering. Russo and Walz (1995) conducted a survey on how
system development methods are used. They found that the Structured approach was most
used. Currently, the trend of system development has changed to the object – oriented
Incremental delivery plan
Identify system objectives
Create open technology plan
Plan increments
Design increment
Build the increment
Implement the increment
Evaluate the results
Feedback Repeat
for each
increment
32 Chapter 2
methodology. This is very popular in software engineering today. Some popular system
methodologies will be reviewed in this section.
The Structured approach or modeling is a kind of conceptual modeling paradigm related to
models (Pressman, 1997).
Object orientation is the most common principle in software research and development at
present. It covers various stages of the software life cycle, from implementation, through
design to system analysis. Object-oriented programming, which emphasizes
implementation issues rather than the underlying designs and requirements of the system,
is well known and well established. The object orientation is more than just a programming
paradigm, the emphasis in object-oriented technology has shifted to the earlier stages of the
software development process (Pressman, 1997).
Rapid application development (RAD) is the methodology or choice of architecture and
tools, requirements and design analysis, selection of personnel and management,
construction, and implementation and support. The goals of RAD are to be faster, better
and cheaper (Hirschberg, 1999)
Rational Unified Process (RUP) is a software engineering process that was created by
Rational, a software development company, bought and developed by IBM. It provides a
disciplined approach to assigning tasks and responsibilities within a development
organization. Its goal is to ensure the production of high-quality software that meets the
needs of its end-users, within a predictable schedule and budget (Jacobson, Booch and
Rumbaugh, 1999 and Kruchten, P. 1999)
2.3.4 Planning Techniques
One of the most important phases of project management is the “Planning phase”, in which
all work to be done is determined and defined. Planning is the most time consuming set of
activities but valuable if done properly. In this phase, many different techniques are used,
such as tables, work breakdown structure (WBS), charts and networks. Tables are used to
present the project activities and relevant information such as the duration, dependency,
cost, starting, ending, and required resources. Tables are used during the planning and

Literature Review – Concepts and Definitions 33
controlling phase and can be used for implementation and monitoring. WBS (Work
Breakdown Structure) is an organizational chart that breaks the project into subsystems,
components and tasks that can be readily accomplished. It is used for scheduling, pricing
and resource planning. WBS simplifies summarizing and reporting progress and costs.
Organization Breakdown Structure (OBS) is a model that organize resources into groups
for better management. It can be used to keep track of resource allocation and specific
work assignments. There is a strong interdependency between OBS and WBS (Badiru and
Pulat, 1995).
The Gantt Chart is one of the oldest and most useful techniques planning. It is clear, simple
and easy to use and understand. The interdependency between activities is not easily
represented, especially in large projects, hence networks are used. Networks are a graphical
display of the project activities showing their interdependency. Several network techniques
have been introduced and used over the years. Mainly two types of networks can be used,
depending on the type of project under consideration: deterministic and probabilistic
methods. For representation, either activity-on-arrow (AOA) or activity-on-node (AON)
are used to model the project. The probabilistic method is known as the program evaluation
and review technique (PERT), while the deterministic method is called either the
precedence diagramming method (PDM) which uses the AON method for representation,
or the arrow diagramming method (ADM) which uses AOA method. All of the methods
use what is known as the critical path method for determining the project duration, critical
path(s), floats and other relevant data.
The empirical research of Abbasi and Al-Maharmah (2000) indicated that Project
management software is used most frequently for project management (70%). Other
applications in planning and managing the project are reporting progress (53%), time cost
analysis (50%), bar chart (53%), critical path method (CPM) (34%), organization
breakdown structure (OBS). Similar results were found in the empirical study of White and
Fortune (2002). Project management software is the most commonly used application
(77%), next is the Gantt chart (64%) and Cost benefit analysis (37%). However, this study
also shows that the application of project management software had the most the
limitations. These included inadequate coverage for complex projects, difficult to model
the “real world”, too heavy documentation, or too time consuming.

34 Chapter 2
Both of these studies examined project management in various industries. In software
projects, planning and managing a project still depends on a method of estimating the
resources required in terms of cost, effort and timescale (Chatzoglou and Macaulay, 1998).
There are many available methods and software packages (such as COCOMO,
SOFTCOST, ESTIMACS, PRICE S, PRINCE etc.) that support the various estimations for
software development projects. The most commonly used planning techniques in software
projects and their impacts on the final project outcomes is one of objectives that will be
examined by this study.
2.4 SUMMARY
This chapter provides the background for both the exploratory and in – depth research. The
software product and process were defined. The definition of software project management
functions were followed PMBOK Guide (2000). The emphasized was on the team, quality
and time management functions. The planning approach is followed Hughes and Cotterell
(2002) that planning activities were separated into ten steps. The remaining sections
described common methods in software project management, including system
development, life – cycle methods and planning techniques.
The current status of software project management is analyzed through three main areas of
project management, including team management, quality management and time
management. The step wise approach of planning provides the framework for conducting
in – depth interviews with project managers about their software projects. Besides, the
concepts of life – cycle models, system development methods and planning techniques in
software project were presented.
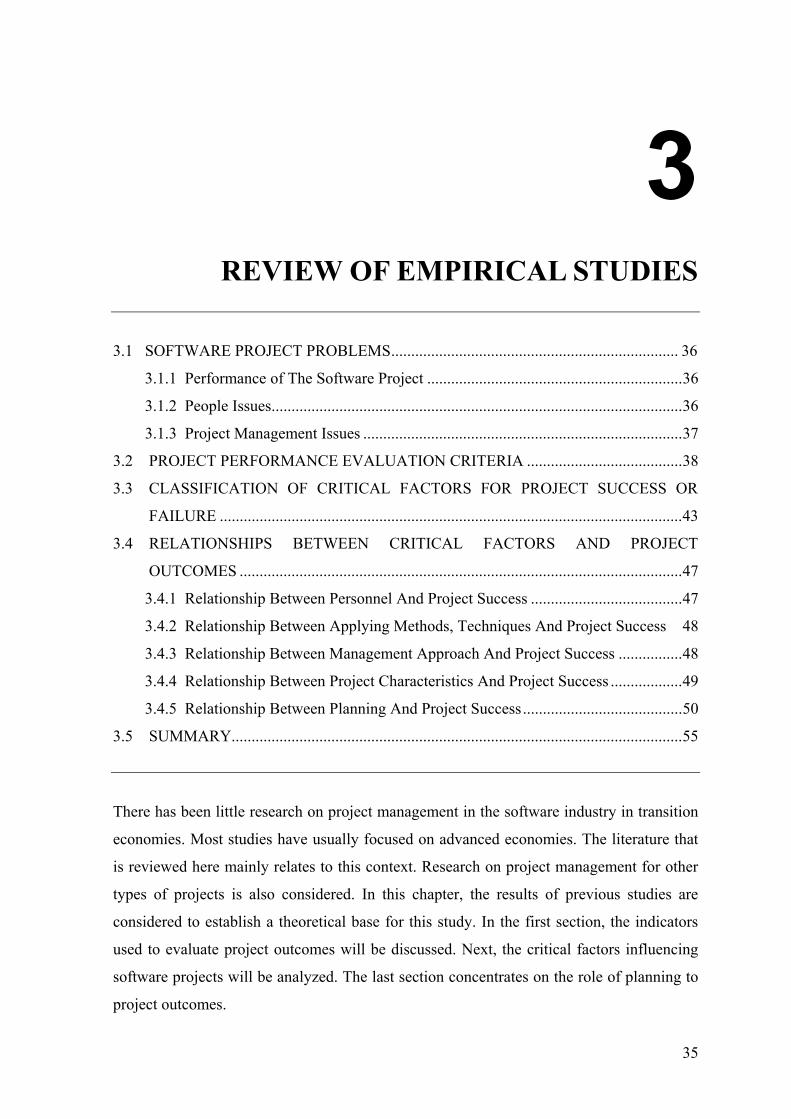
35
3
REVIEW OF EMPIRICAL STUDIES
3.1 SOFTWARE PROJECT PROBLEMS........................................................................ 36
3.1.1 Performance of The Software Project ................................................................36
3.1.2 People Issues.......................................................................................................36
3.1.3 Project Management Issues ................................................................................37
3.2 PROJECT PERFORMANCE EVALUATION CRITERIA .......................................38
3.3 CLASSIFICATION OF CRITICAL FACTORS FOR PROJECT SUCCESS OR
FAILURE ....................................................................................................................43
3.4 RELATIONSHIPS BETWEEN CRITICAL FACTORS AND PROJECT
OUTCOMES ...............................................................................................................47
3.4.1 Relationship Between Personnel And Project Success ......................................47
3.4.2 Relationship Between Applying Methods, Techniques And Project Success 48
3.4.3 Relationship Between Management Approach And Project Success ................48
3.4.4 Relationship Between Project Characteristics And Project Success ..................49
3.4.5 Relationship Between Planning And Project Success........................................50
3.5 SUMMARY.................................................................................................................55
There has been little research on project management in the software industry in transition
economies. Most studies have usually focused on advanced economies. The literature that
is reviewed here mainly relates to this context. Research on project management for other
types of projects is also considered. In this chapter, the results of previous studies are
considered to establish a theoretical base for this study. In the first section, the indicators
used to evaluate project outcomes will be discussed. Next, the critical factors influencing
software projects will be analyzed. The last section concentrates on the role of planning to
project outcomes.
36 Chapter 3
3.1 SOFTWARE PROJECT PROBLEMS
Considerable research has been focused on problems in software development projects.
The main purpose of this research is to understand the common problems and why they
happened. The results of these studies are very rich and detailed. In this section, software
project problems are categorized into 3 groups: performance of the project, people, and
project management issues.
3.1.1 Performance of the Software Project
Performance is defined as the fulfillment of the management and technical requirements of
the software, including its functions, cost and schedule. Performance problems were related
to the inability to deliver the product within budget and/or on schedule and to develop a
high-quality product that was acceptable to the customer (Duvall, 1995). Many software
projects have problems with meeting deadlines and cost targets. Gibbs (1994) indicated
that for every six new large-scale software systems put into operation, two others were
cancelled. Another study in the USA found that 31 percent of software projects were
canceled before completion and more than half the projects will cost more than 189 percent
of the original estimates (The Standish Group, 1995). A study which focused on meeting
deadlines in software projects in Germany revealed that in 60 percent of the projects
investigated, more than 20 percent were behind time, while only 5 percent were completed
on time (Eversheim et al., 1997).
This poor performance stems from other problems that happen during the software
development process. The following discussion will reveal the problems related to people
issues, and project management issues.
3.1.2 People Issues
There are many people involved in or related to a software project. In general, they can be
categorized into two groups: project personnel and stakeholders (including the customer or
user, subcontractor and the personnel of the parent company). The main problem for
project personnel (including project manager, designer, programmer, etc.) is the lack of
skillful and talented people (Duvall, 1995) or a shortage of programmers (Yang, 2001).

Review of Empirical Studies 37
This problem becomes more serious because of the poor training given in software
companies. Many software project managers are either untrained or poorly trained for their
work. They are also severely under equipped. The Software Productivity Research
Company (USA) has indicated that less than 25% of US software project managers
received any formal training in software cost estimating, planning, or risk analysis (Jones,
1999).
The customer is defined as the end user(s) of the software and/ or the one who pays for the
development. The customer doesn’t know what they want but know what they like (Duvall,
1995). This problem occurs because programmers have so much more experience with
computers than their users. They find it very difficult to understand a user who does not
have similar capabilities and familiarly with software (Parth, 1999). The customer can be
inconsistent. Organizations, because of no memory, poor internal communication or
ineffective decision-making can exhibit remarkable “organization stupidity” that
developers have to recognize (Hughes and Cotterell, 2002). Therefore, software project
managers always encounter problems in defining the customer’s requirements. Users
cannot adequately define the requirements because the application they want has never
been done. Moreover, the requirements change, such as the need to adjust the level of
functionality incorporated into the final product (Duvall, 1995).
3.1.3 Project Management Issues
Project management issues refer to the problems which usually happen in the software
development process in performance or enabling technologies. Enabling technologies are
the methods and tools used to develop the software.
Managers often feel that the processes they used did not address their needs. The problem
of defining the requirements was the most difficult part of the software development
process and was inefficient. There are also inherent problems with the software process.
Managers complained about dissatisfaction they felt in dealing with tools for software
development –that did not meet their needs and/ or were difficult to learn (Duvall, 1995).
A survey conducted by Thayer, Pyster and Wood (1981) identified the common problems
in software project management. They include poor estimates and plans, lack of quality
38 Chapter 3
standards and measures, lack of guidance about decisions, lack of techniques to make
progress visible, poor role definition and incorrect success criteria. Although this study was
conducted more than 20 years ago, the problems found still exist in software projects
today. An assessment by the Software Engineering Institute (SEI) in 1991 indicated that
93% of the companies assessed did not have a well-defined software development process.
81% did not have a quality management system. The software process has a poorer
reputation than most other product development functions. The problems in managing the
development process often leads to quality lapses.
Software projects have a high level of change. Change was the replacement of one thing
with another, implying movement. Everything can be changed, people, situations, needs or
specifications (Duvall, 1995). Hence, managing a software project always has the risk of
changes.
In short, these problems in the software development process lead to the high rate of failure
of software projects and they still are the concern of managers and researchers. The
common problems in software projects will be examined in the context of software
industry in Vietnam – a developing country.
3.2 PROJECT PERFORMANCE EVALUATION CRITERIA
The criteria for evaluating success or failure in projects have a rich literature with a variety
of points of view. This section will summarize the results of different studies on specifying
criteria for project evaluation.
Poor software project performance is based on the criteria of completion on time and
within budget. These criteria are very important in determining the project results.
However, in the literature the definition of project success has changed over the years. In
the 1960s, project success was measured entirely from the technical viewpoint that is the
product worked. In the 1980s, the definition for project success required meeting three
objectives completed on time, within budget and at a desired level of quality (Kerzner,
1998). The quality of a project was commonly defined as meeting technical specifications.
All these measures were internal to a project. After the introduction of TQM, a project was
considered to be a success by meeting the internal performance measures of time, cost and
Review of Empirical Studies 39
technical specification but also is acceptance by customer and the customer’s satisfaction
(Kerzner, 1998).
Focusing on customer satisfaction is reflected in considerable research in project
management. The related studies on evaluation criteria for software and other kinds of
project are presented in Table 3.1. This summary is developed from the research of
Westerveld (2003). The previous studies related to project evaluation are divided into two
groups. First is software and IT projects and second is on other types. According to
Westerveld (2003), the evaluation criteria could be categorized as project results and
stakeholders satisfaction. The project results include outcomes related to project time, cost
and quality. Stakeholders include project personnel, clients, users, contacting partners and
others. The analysis and classification in Table 3.1 are to identify the criteria most
commonly used.
As Table 3.1 indicated, there are many criteria for evaluating project performance, but the
most common evaluation criteria are project results (in terms of cost, time and quality).
Only the research of Seen, Beaumont and Mingins (2001) did not consider this criterion.
Their research emphasized more on the benefits for the parent company, not for an
individual project. Satisfaction of customers (including both clients and end-users) is
another criterion that many researches used. Although Westerveld (2003) distinguished
between clients and end-users for his analysis, most studies on software or IT projects
rarely do this. Additionally, the satisfaction of project personnel and parent company are
also an objective that many projects consider. This analysis also showed that contracting
partners were considered in only few studies. Because of many researches in this summary
missed this criterion, the satisfaction of contracting partners, therefore, is not important.
Comparing between software/ IT projects and other project types, the criteria for
evaluating software or IT projects are quite similar to that of other type of projects.
In brief, the most common criterion for project evaluation is project results in terms of
time, cost and quality. Satisfaction of customer is next important. The projects rarely
considered the satisfaction of contracting partners.
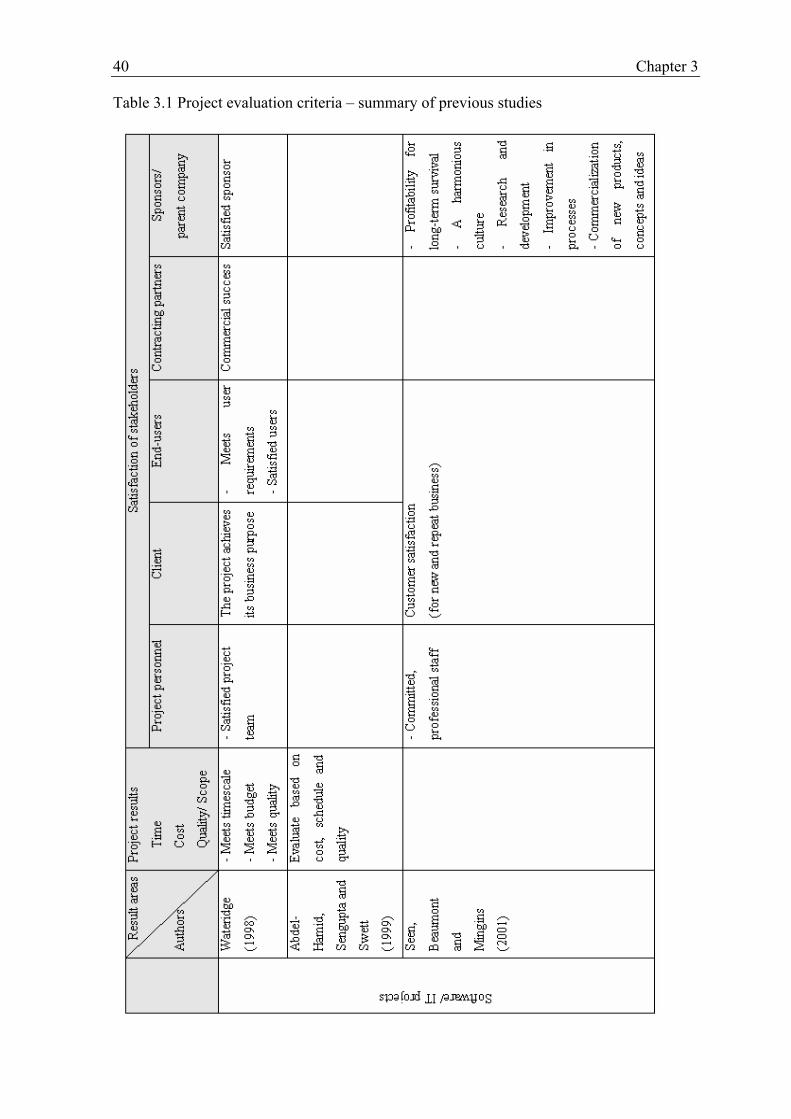
40 Chapter 3
Table 3.1 Project evaluation criteria – summary of previous studies
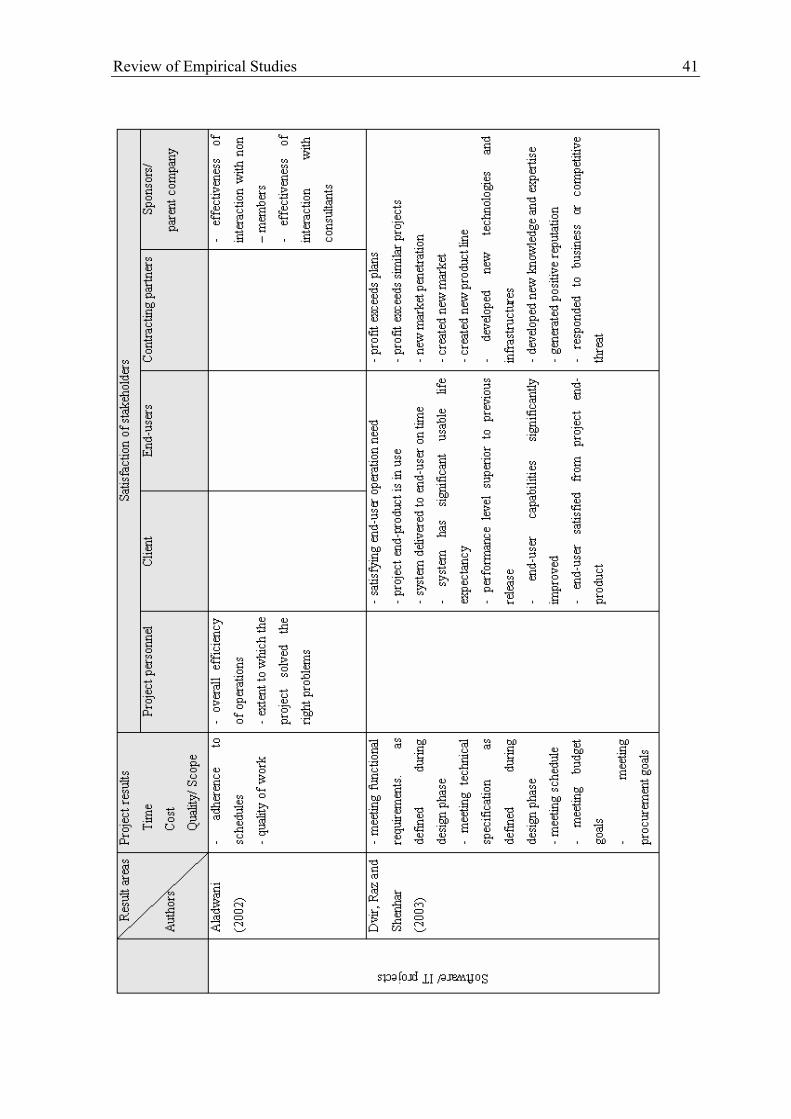
Review of Empirical Studies 41

42 Chapter 3
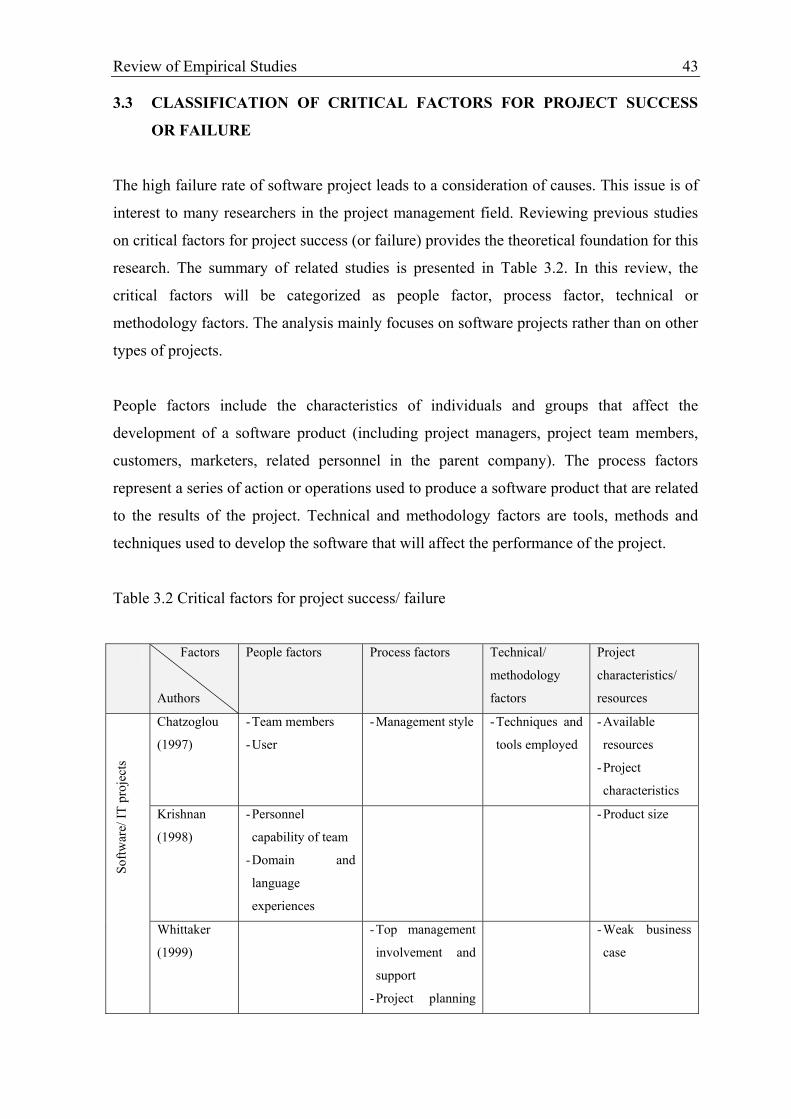
Review of Empirical Studies 43
3.3 CLASSIFICATION OF CRITICAL FACTORS FOR PROJECT SUCCESS
OR FAILURE
The high failure rate of software project leads to a consideration of causes. This issue is of
interest to many researchers in the project management field. Reviewing previous studies
on critical factors for project success (or failure) provides the theoretical foundation for this
research. The summary of related studies is presented in Table 3.2. In this review, the
critical factors will be categorized as people factor, process factor, technical or
methodology factors. The analysis mainly focuses on software projects rather than on other
types of projects.
People factors include the characteristics of individuals and groups that affect the
development of a software product (including project managers, project team members,
customers, marketers, related personnel in the parent company). The process factors
represent a series of action or operations used to produce a software product that are related
to the results of the project. Technical and methodology factors are tools, methods and
techniques used to develop the software that will affect the performance of the project.
Table 3.2 Critical factors for project success/ failure
Factors
Authors
People factors Process factors Technical/
methodology
factors
Project
characteristics/
resources
Chatzoglou
(1997)
- Team members
- User
- Management style - Techniques and
tools employed
- Available
resources
- Project
characteristics
Softw
are/
IT p
roje
cts
Krishnan
(1998)
- Personnel
capability of team
- Domain and
language
experiences
- Product size
Whittaker
(1999)
- Top management
involvement and
support
- Project planning
- Weak business
case

44 Chapter 3
(inadequate risk
mgt. and weak
project plan)
Verner,
Overmyer
and McCain
(1999)
- Customer and user
- Project manager
- Management
support
- Requirement and
specification
defining
- Estimation and
schedule
- Staffing
- Life cycle
methodology
- Risk mgt.
techniques
- Planning,
monitoring and
control
techniques
Abdel-Hamid
Sengupta,
Swett (1999)
- Project goals:
cost/ schedule or
quality/ schedule
Softw
are/
IT p
roje
cts
Callahan and
Moretton
(2001)
- Project leader
power
- Supplier
involvement
- Sale and
marketing
involvement
- Time spent for
planning
- Frequency of load
build
- Financial rewards
- Testing
methods
Yeo
(2002)
- User involvement
- Management
style
- Internal
communication
- Estimate of
timeline
- Definitions of
requirements and
scope
- Project risk
analysis
- Vision/ Goal
- Choice of
software
- Degree of
customization
in application
- Change in
design
specifications
Aladwani
(2002)
- Project diversity of
project team
members
(difference in
- Planning - Technical
complexity
- Project size

Review of Empirical Studies 45
backgrounds,
experiences and
skills among team
members)
Procaccino,
Verner,
Overmyer
and Darter
(2002)
- Customer/ users
involvement
- Management
support
- Project scope
defining
- Method of
requirements
gathering
Dvir, Raz and
Shenhar
(2003)
- End-user
involvement
- Requirements
defining
- Technical
specifications
defining
- Project
management
implementation
Nguyen M.
(2003)
- Project manager
- Team members
- Knowledge in
related field
- Knowledge in
decision making
- Planning &
estimating
- Communication
with customer
- Quality standards
& measure
-Planning
software
Jang and Lee
(1998)
- Clients’
participation
- Top management
support
- Functional
experience of team
members
- Goal defined
- Compatibility
of the
methodology
used
- Standardization
of procedures
Oth
er p
roje
ct k
inds
White and
Fortune
(2002)
- Senior manager
support
- End-user
commitment
- Goal/ Objectives
defined
- Scheduling
- Adequate funds/
resource
Hameri and
Heikkila
(2002)
- Understand of
project team about
project objectives
- Project planning
and scheduling
- React to sudden
changes in the
project
management
- Discipline in
design change
control
- Technological
difficulty

46 Chapter 3
Westerveld
(2003)
- Project manager
and team members
(skills,
background)
- Management
support
- Project
characteristics
(size,
uniqueness,
urgency)
- External
environment
(political,
technological)
Belout and
Gauvreau
(2003)
- Project personnel - Management
support
- Project mission
defining
- Project scheduling
- Communication
- Monitoring and
control
- Trouble-shooting
solving
- Technical tasks
Table 3.2 categorized all factors influencing the success of a project from previous studies.
The first group is personnel factors. This group was considered by most studies. Although
there are many stakeholders related to a project, the analysis indicated that typically only
the project team and customers influence the success or failure of a project. Regarding the
project team, the role of the project manager and the knowledge and experience of the
project team are critical. Customers are evaluated based on their knowledge, experience
and involvement in the project. The second group is management factors. This factors
group was also studied by many researches. The most prevalent group relates to
management support, planning and the definition of project goals. The third group is
technical factors involved in the software project. Previous studies considered the
importance of applying methods and tools related to project results. The summary in Table
3.2 shows that the technical factors were not considered in many studies. Software projects,
however usually related to technical methods like system development, life cycle methods
and project management. The lack of technical factors in the previous studies shows the
gap in literature of software project management. The importance of this factor group
should be studied further. The last group is characteristics and resources of a project. The

Review of Empirical Studies 47
most frequent factor in this group is the project size. The influences of these factors on
project results are presented in the next sections.
3.4 THE RELATIONSHIPS BETWEEN CRITICAL FACTORS AND PROJECT
OUTCOMES
The influence of the critical factors that classified in Table 3.2 on the project outcomes will
be described in more detail. In this analysis, the relationships between personnel, technical,
management and project characteristics will be identified.
3.4.1 Relationship Between Personnel And Project Success
Krishnan (1998) indicates that a higher capability of personnel in the software development
team is significantly associated with both the improved productivity and quality software
products. Aladwani (2002) supposed that a diversified membership may adversely affect
the planning process. However, the empirical evidence in his study did not support this
assumption. Chatzoglou & Macaulay (1996b) indicated that Project team member’s
experience, commitment, user knowledge and interpersonal communication are ranked as
very important factors related to planning performance. Regarding the role of project
manager, Verner, Overmyer and MacCain (1999) through interviews with the software
managers, found that the capability of project managers plays an important role in project
performance, especially project failure.
However, Callahan and Moretton (2001) did not find a relationship between project leader
power and software development time. Regarding the role of customers, Procaccino et al.
(2002) found that the higher the level of confidence that customers have in the project
manager and development team, the more likely the project will be successful. However,
the involvement of the customer in scheduling estimates does not increase the success of a
project. Previous research by Dvir et al. (2003) concluded that user involvement should
start at the first stage of the project and continue until its successful end.
Previous studies have indicated that the higher capability of project managers and team
members, the better project results. The involvement of customers in the project also
influences the project outcomes. Therefore in this study, the role of project manager, team

48 Chapter 3
members and customer in planning are considered simultaneously in the conceptual model,
so the relationships between project managers, team members and customers and project
results will be examined related to project results.
3.4.2 Relationship Between Applying Methods, Techniques And Project Success
There is not much research on the application of the methods and techniques in project
management. Verner, Overmyer and McCain (1999) indicated that applying appropriate
and efficient techniques in the software development process would increase the chance for
project success. Chatzoglou et al. (1997) considered the methods and techniques used in
software projects influence the software development process. Their results showed that
just 53% of projects apply some methodology in the development process. The application
of project management methods was surveyed in the study of White and Fortune (2002).
They investigated the current practice of project management in many kinds of projects.
The most used techniques were the Gannt chart and project management software. The
lack of research on this aspect is also evident related to the complexity and diversity in
applying the types of methods and techniques.
In short, the influence of the application of methods and techniques on project results was
not clarified in previous studies. In this study, this relationship is studied concerning
software projects. The methods or techniques used in software projects are categorized as
project management, system development and life-cycle methods.
3.4.3 Relationship Between Management Approach And Project Success
The analysis presented in Table 3.2 indicated that management approach and process
factors were considered in many studies. Chatzoulog et al. (1996, 1997) identified
management styles and available resources as important to planning and influencing
performance. Kasser and William (1998) identified a list of 34 risk – indicators of an IT
project. In which, poor plans was ranked a high risk factor. This was followed by
“resources are not allocated well”, “failure to communicate with the customer” and “lack
of management support”. According to Whittaker (1999), two common reasons for project
failure were poor project planning and the lack of management involvement and support.
Abdel-Hamid et al. (1999) found the positive relationship between different project goals,

Review of Empirical Studies 49
software project planning and resource allocation. The difference in project goals focused
on the “cost and schedule” or “quality and schedule” influenced the project outcomes. With
the given specific software project goals, managers do planning and make resource
allocation choices in such a way that they will meet those goals. Callahan and Moreton
(2001) found the negative relationship between the involvement of supplier and sales and
marketing in the early stages of design and software development time. More involvement
indicated less development time. The involvement of sales and marketing is considered as
a part of management support. Yeo (2002) identified the top five failure factors of a
project. These include “lack of user involvement”, “top-down management style”, and
“poor internal communication”. Procaccino et al. (2003) considered the role of
management support to project success. They did not find a significant relationship
between “project manager with full authority” and “project success”. However, there was a
significant correlation between “project with committed sponsor” and “project success”. In
recent research, Belout and Gauvreau (2003) found a significant link between project
mission, and management support in planning with the success of the project.
In brief, the management factors influencing project results include management support
including the role of top management, involvement of the sales and marketing department,
and suppliers. The availability or allocation of resources for the project is the second factor
influencing project outcomes. Other aspects include project planning, project objectives
and scope, management styles and communication. The results of previous studies were
very consistent. The relationships between management factors in planning and project
outcomes in software projects will be examine in this study.
3.4.4 Relationship Between Project Characteristics And Project Success
The remaining factors are diversified but they are related to project characteristics. In this
section, the influence of project characteristics and project success is examined.
In identifying the factors that influence project outcomes, researchers usually consider the
effect of characteristics of the project. The common project characteristics used in previous
studies were project size, project sectors and project types. Overall the evidence suggests
that project size has a negative effect on IT project success (Aladwani et al., 1999).
Krisnan (1998) investigated the impact of various team factors in packaged software
50 Chapter 3
development. His findings indicated that the effect of product size on the field defects of
software product is positive and significant. This means that the bigger product size was
related to lower quality because of increased software defects. Aladwani (2002) found a
negative relationship between project size (measured by number of people involved in the
project) and project planning. But there is no link between project size and project success.
Nguyen M. (2003) also did not find any evidence for the relationship between project size
(measured by duration and number of people involved in the project) and project results.
The study of Belout and Gauvreau (2003) examined the moderating effects of project
sectors and the organization structure on project success. For three types of project
organization (project-based, matrix and functional structures), the correlations between
variables of project mission, management support, project schedule, client acceptance,
personnel, technical tasks and communication and project success were different. In the
case of the matrix structure, there were significant correlations between only three of these
seven factors, including project mission, management support and project schedule and
project success. For the project – based structure, there were significant correlations
between almost all seven factors (except personnel) and project success. Finally, in the
case of the functional structure, the management support, client acceptance and
communication were significant correlated with success. In short, these variables have a
different impact on performance depending on the organizational structure.
In summary, previous studies considered the influence of project characteristics including
project size, project sector and organization structure on project success.
3.4.5 Relationship Between Planning And Project Success
Project planning, in this study, refers to the extent to which timetables, milestones,
workforce, equipment, and budget are specified (Slevin and Pinto, 1986). In Table 3.2,
planning belongs to the group of management factors. According to Whittaker (1999) the
most common reason for project failure is poor project planning, specifically, risks were
not addressed or the project plan was weak. The empirical study of Aladwani (2002) also
confirmed that there is relationship between project planning and project success.
Review of Empirical Studies 51
Many factors presented in Table 3.2 are related to planning or appear only in the planning
stage. Various studies demonstrate the important role of planning to project outcomes
(Whittaker, 1999; Aladwani, 2002; Belout and Gauvreau, 2003; Nguyen M., 2003). Other
research explores more specific aspects such as human resource, management or applied
tools or techniques throughout the project life-cycle. There are two studies that examined
planning in detail. First, the studies of Chatzoglou and Macaulay (1996 – 1998) considered
the role of input factors such as people, management and technical methods in the
requirements capturing and analysis (RCA) stage – an important task in planning. Their
approach provides a comprehensive view of factors in planning that can affect the efforts
during the RCA stage and throughout the whole development process. Second, the
empirical study of Dvir et al. (2003) considered planning as composed of three major
tasks: development of functional requirements; development of technical specifications and
the implementation of project management. They examined the relationship between the
performance of these tasks and the project results. In the following sections, these studies
will be described.
3.4.5.1 MARCS model
Chatzoglou and Macaulay (1996) proposed a new approach for project planning and
estimation, described as MARCS (MAnagement of the Requirements Capture Stage). The
main objective of MARCS model is to provide project managers accurate predictions of
time, cost and requirements of the project development process, the RCA process as a
whole, as well as each interaction of the RCA separately. This should be done as early in
the system development life-cycle as possible, and be based on the factors readily
identifiable and measured from the beginning of the RCA process. The inputs for this
model include the project, manager, development method, personnel and user
characteristics. The model’s output consists of two sets:
- The general MARCS model: refers to the resources of the whole project development
process and to the resources of the RCA process
- The expanded MARCS model: refers to the resources of each interaction of the RCA
process
From this model, Chatzoglou (1997) conducted a survey to consider the factors affecting
the completion of the requirements capturing stages of projects with different

52 Chapter 3
characteristics. In this model, they are described as moderating variables. The project
characteristics include:
- Developing Organization (Software houses, Industry, Consultants, Academics)
- Developers (Project managers, system analyst, consultants)
- Project type (Software, System)
- The type of problem (structured, average, unstructured)
- Its applicability (tailored, generic)
- The target user (own company, external)
In the next stage of development, Chatzoglou and Macaulay (1998) modified this model.
The changes were mainly centered on output variables. The modified model is displayed in
Figure 3.1. In this model, the input factors include human, management, and technical
factors. The outputs of this model are the allocation of resources for the development
process, the RCA process and for each interaction of the RCA process.

Review of Empirical Studies 53
Figure 3.1 MARCS (Chatzoglou and Macaulay, 1998)
Requirements capturing and analysis (RCA) is a very important task in planning. Based on
the customer requirements, the project team defines product specifications and then
estimates time and efforts for the project. This stage corresponds to the steps 1, 3 and 4 of
Step wise planning activities (Hughes and Cotterell, 2002) that was presented in Chapter 2.
The Chatzoglou model offers a general approach to the input factors of planning that is
applied in this study. The MARCS’s output is allocation of resource of the whole project
and RCA stage while this study centered on planning performance and project outcomes.
HUMAN FACTORS
Team members 1. Experience with system development
and with establishing requirements. 2. Knowledge of the problem domain 3. Anxiety and stress for the successful
completion of the process 4. Commitment and persistence to the
development of the specific system
Users 1. Knowledge of the purpose of system
development 2. Motivation 3. Conflicts between users 4. Resistance to accept the development of
the specific system 5. Participation in the development process
and communication with team members
Team members 1. Experience with system development
and with establishing requirements. 2. Knowledge of the problem domain 3. Anxiety and stress for the successful
completion of the process 4. Commitment and persistence to the
development of the specific system
MANAGEMENT 1. Resources available for the completion of the
process 2. Management style adopted
TECHNICAL FACTORS 1. Techniques and tools employed during the
process
PROJECT CHARACTERISTICS 1. The size of the project (big, medium, small) 2. The type of problem (structured, average,
unstructured) 3. Its applicability (bespoke, generic) 4. The target user (own company, external
client 5. Developers (Software houses, Industry,
Consultants, Academics) 6. Sources of information 7. Constraints
RESOURCE OF THE
PROJECT
DEVELOPMENT
P
R
O
D
U
C
T
I
V
I
T
Y
RESOURCE OF THE
RCA
PROCESS
RESOURCE OF EACH
INTERACTION OF
THE RCA

54 Chapter 3
3.4.5.2 Planning dimensions in Dvir’s study (2003)
The study of Dvir et al. (2003) focused on the relationship between the different aspects of
project planning and project success through empirical research conducted in Israel. In this
study, the planning efforts were considered by three dimensions:
- Development of functional requirements
- Development of technical specifications
- Implementation of project management processes and procedures
In the first level of planning, the functional requirements are developed. This focuses on
defining the characteristics of the end product that is based on customer or end-user
requirements. The next level is to develop the technical specifications. The team creates the
product focused on the technical specifications of the project deliverables that are needed
to support the functional requirements. Finally, at the project management level, the focus
is on planning the activities and processes that need to be carried out.
Dvir et al. (2003) evaluated project success from the perspectives of the project team (as
meeting planning goals), end-user (as end-user benefits) and contractors (as contractor
benefits). To determine the relationship between planning and project success, Dvir (2003)
used correlation analysis. They found important results. First, there was a high correlation
between capturing and developing the functional specifications of the end product and the
definition of technical specifications. They also indicated a significant positive relationship
between the amount of effort invested in defining the goals of the project and the
functional requirements and technical specifications of the product and project success.
Second, there was no correlation between the implementation of planning procedures and
the various success dimensions. To explain this negative result, Dvir et al. (2003) presented
their evidence. The important role of planning was emphasized heavily by commonly
accepted professional standards, such as the Guide to the Project management Body of
Knowledge of Project Management Institute (PMI). The assumption behind this position is
that planning reduces uncertainty and increases the likelihood of project success. Currently
with the advancements in computerized planning techniques and the increase in project
management training, a certain level of planning is done in all projects. Therefore, there
were no significant statistical correlations in the data.

Review of Empirical Studies 55
Their last finding related to the project success measures. All four success-measure
(meeting planning goals, end-user benefits, contractor benefits and overall project success)
are highly inter – correlated, implying that projects perceived to be successful are
successful for all their stakeholders.
The important contribution of Dvir et al. study for this research is their approach to
planning. It considered four dimensions, including defining requirements and
specifications; estimating project time and effort; setting the schedule and risk analysis.
Their study measured Project outcomes from different points of view. These include
meeting planning goals, end – user benefits, contractor benefits and overall project success.
In brief, both studies of Chatzoulog et al. (1996 – 1998) and Dvir et al. (2003) emphasized
planning in software projects. Chatzoulog et al. focused on the influence of personnel,
technical and management factors on the effort spent for requirements capturing and
analysis – an important stage of planning and for the whole project as well. Dvir et al.
centered on the relationships between the specific dimensions of planning and project
success.
3.5 SUMMARY
This chapter examined the previous studies related to software project management.
Through classification of the criteria used for project success evaluation from related
researches, the most common criteria were identified. They include the project result in
terms of time, cost and quality, and the satisfaction of customers. The relationships
between planning factors and project success in previous studies were analyzed to indicate
what factors are important and why they will be used in this study. These analyses also
indicate the gaps in literature on planning in software project management. The technical
factors were not much considered by previous researches.
The importance of planning to project outcomes was analyzed to construct the framework
for this research which will be presented in the next chapter. The main criteria for project
evaluation identified in this chapter will be used to evaluate the project outcomes of this
research.

56 Chapter 3
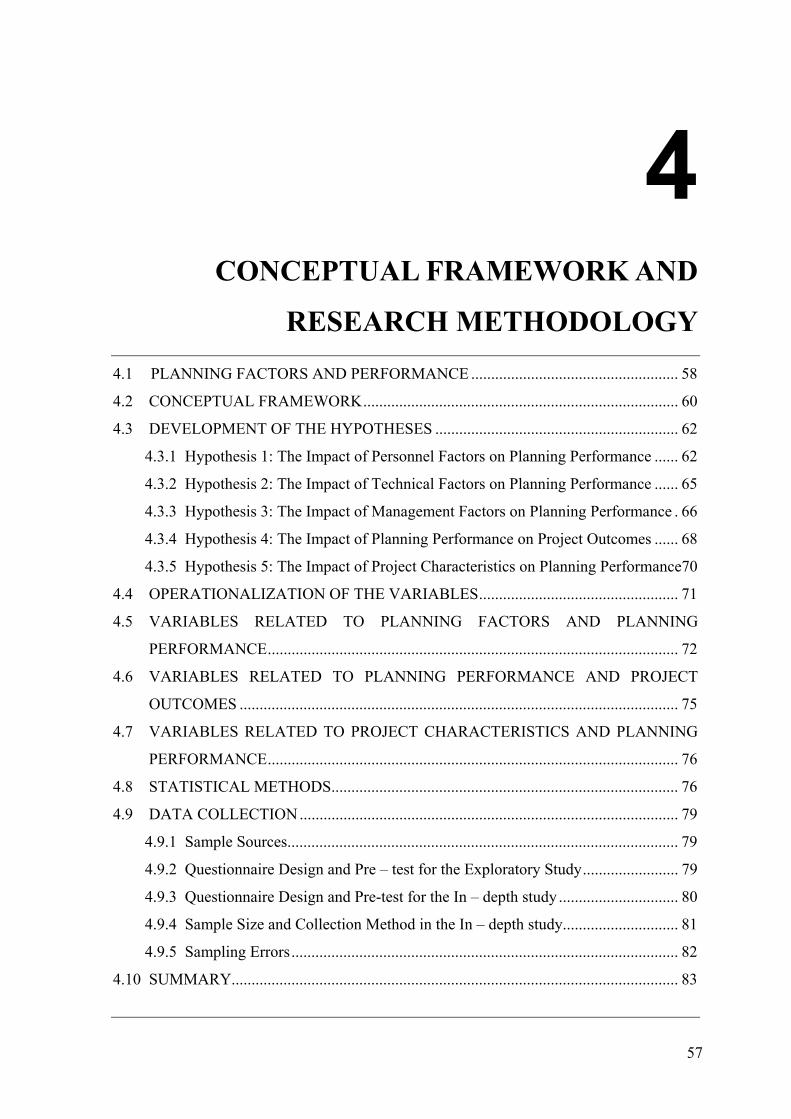
57
4
CONCEPTUAL FRAMEWORK AND
RESEARCH METHODOLOGY 4.1 PLANNING FACTORS AND PERFORMANCE .................................................... 58
4.2 CONCEPTUAL FRAMEWORK............................................................................... 60
4.3 DEVELOPMENT OF THE HYPOTHESES ............................................................. 62
4.3.1 Hypothesis 1: The Impact of Personnel Factors on Planning Performance ...... 62
4.3.2 Hypothesis 2: The Impact of Technical Factors on Planning Performance ...... 65
4.3.3 Hypothesis 3: The Impact of Management Factors on Planning Performance . 66
4.3.4 Hypothesis 4: The Impact of Planning Performance on Project Outcomes ...... 68
4.3.5 Hypothesis 5: The Impact of Project Characteristics on Planning Performance70
4.4 OPERATIONALIZATION OF THE VARIABLES.................................................. 71
4.5 VARIABLES RELATED TO PLANNING FACTORS AND PLANNING
PERFORMANCE....................................................................................................... 72
4.6 VARIABLES RELATED TO PLANNING PERFORMANCE AND PROJECT
OUTCOMES .............................................................................................................. 75
4.7 VARIABLES RELATED TO PROJECT CHARACTERISTICS AND PLANNING
PERFORMANCE....................................................................................................... 76
4.8 STATISTICAL METHODS....................................................................................... 76
4.9 DATA COLLECTION............................................................................................... 79
4.9.1 Sample Sources.................................................................................................. 79
4.9.2 Questionnaire Design and Pre – test for the Exploratory Study........................ 79
4.9.3 Questionnaire Design and Pre-test for the In – depth study .............................. 80
4.9.4 Sample Size and Collection Method in the In – depth study............................. 81
4.9.5 Sampling Errors................................................................................................. 82
4.10 SUMMARY................................................................................................................ 83
58 Chapter 4
The examination of literature in Chapter Three reviewed the previous studies that
considered the factors influencing project results and demonstrated the important role of
project planning. In the first section of this chapter, the related studies are analyzed to
define the gap concerning the role of planning in project success and the factors
influencing the planning process. This analysis will be used to develop the conceptual
framework and hypotheses for this study, which is presented in the next section. The last
section of this chapter will propose the research methodology.
4.1 PLANNING FACTORS AND PERFORMANCE
Previous studies have identified many of the critical factors which influence project results.
Various significant relationships between personnel, technical and management factors and
project success or failure were considered. The role of these factors should be recognized
in planning software projects. The reason for this emphasis is that bad decisions or poor
performance in planning will considerably influence the project results. Planning
performance is evaluated based on four main tasks, including identifying customer
requirements and defining product specifications, estimating time and efforts, scheduling,
and analyzing risks.
Most studies have considered personnel the most vital factor for project success during
project life cycle. Personnel in software project include both the project team and
customers. The knowledge and experience of the project team in planning will affect
planning performance, especially in defining the customer requirements and estimating the
effort necessary for the project. The involvement of the customer is a factor that many
studies have identified. This commitment, especially in the initial stage of the project is
crucial to capture and analyze customer or user requirements and to ensure the project
teams’ understanding of product specifications. Management support is also documented
as an important factor for project success. In software project planning, management
support means the involvement and support of top management, functional departments
and the sponsor. Many authors have examined the important role of clearly defining
objectives and customer requirements. These activities take place in the initial stage of a
project and strongly affect the development process and project results. Late changes in
objectives and user requirements are costly. The choice of methods or techniques to be
used in managing the project is also made in the planning stage. This decision could

Conceptual Framework and Research Methodology 59
influence the success or failure of a project (Verner, Overmyer and McCain, 1999; Yeo,
2002; Nguyen M., 2003).
According to the study of Sauer and Cuthbertson (2003), 97% of project managers have
participated in managing the necessary requirements and specifications. They spend about
12.3% of their time in planning. However, the practice of planning is not always good.
Thayer, Pyster and Wood (1981) found that poor estimates and plans are a common
problem in software projects. In an empirical study in a developing country (Vietnam),
85% project managers agreed with these common problems (Nguyen M., 2003). Planning
skills are also considered as important for successful project managers (Sauer and
Cuthbertson, 2003).
The role of planning in a software project was studied in more detail in the research of
Chatzoglou et al. (1997 – 1999) and Dvir et al. (2003). The Chatzoglou model provides a
broader view of the input factors in planning such as human, management and technical
factors. This model, with the acronym MARCS, offers project managers a new approach to
make more accurate predictions of project time, cost and requirements of the project
development process and the requirement capture and analysis (RCA). The classification of
inputs in Chatzoglou model is more useful for my study on planning software projects. It
provides the list of factors being considered as the inputs that influence planning which
will be used to construct a conceptual framework that will be presented in the next section.
The Chatzoglou (1997) model only considers planning in the Requirement Capture and
Analysis (RCA) stage of the waterfall life-cycle model. However, this model seems to be
no longer appropriate for modern software development project (Verner et al., 1999). In
fact, the RCA stage is an interactive process during software development cycle (similar to
spiral or prototyping approaches). My study will examine the influence of the input factors
not on planning in the RCA stage as in the study of Chatzoglou et al. (1996 a, b) but
throughout the whole planning cycle. The reason for this is that the software projects in my
study context have much smaller size than Chatzoglou et al. (1996b), which were usually
completed in 5 months and employed from 5 – 10 people (Nguyen M., 2003). Projects in
Chatzoglou et al. study (1996b) were of medium size, completed within 3 years involving
30 people. In small projects, it is difficult to separate the influence of factors only in the
RCA process.
60 Chapter 4
If the Chatzoglou et al. (1999) study provided the approach related to input factors of
planning, the study of Dvir et al. (2003) considered the major tasks of planning. It includes
the development of the functional requirements, technical specifications and the
implementation of the project. Dvir et al. (2003) examined the relationships between the
accomplishment of these tasks and the project results. Their findings explain the key
activities of planning stage and project success from different points of view. This
approach is very useful to develop a new conceptual model for evaluating the role of
planning. However, the study of Dvir et al. (2003) did not show which factors in planning
will lead to the better development of technical specifications, the estimation of time and
effort for the project or those which will increase the chance of project success.
In summary, the conceptual framework of this study will apply the classification of input
factors in the planning process of Chatzoglou model (1999). The impacts of these input
factors are examined in the assessment of planning performance. Then, how planning
performance influences the final project outcomes will also be assessed.
4.2 CONCEPTUAL FRAMEWORK
Based on the literature analysis, a conceptual framework for evaluating the impact of input
factors on planning performance and identifying the relationships between planning
performance and different project outcomes is constructed. This conceptual framework is
described in Figure 4.1.
The first part of this framework examines the relationships between personnel,
management and the technical factors and planning. These factors are based on the study of
Chatzoglou and Macaulay (1998) and builds on the synthesis of previous studies on critical
factors for project success or failure. The planning process is evaluated through the
performance of four main tasks: defining requirement and specifications, estimating time
and effort; scheduling, and risk analysis. The second part of this framework examines the
relationships between planning and project outcomes. Project outcomes are evaluated by
results in terms of completion time and cost, product quality, customer satisfaction,
organizational benefits and personnel benefits. This model also considers the moderating
effects that project characteristics have on the relationship between input factors and
planning performance. Three characteristics are considered, project size, project type and

Conceptual Framework and Research Methodology 61
the ownership. The assumptions and explanations of these relationships will be presented
in the next section.
Figure 4.1: Conceptual framework of planning factors, planning performance and project
outcomes
The development of the hypotheses related to the relationship between planning factors and
planning performance and project outcomes is described in the next sections.
Customers/ Users (Involvement of customer/ user in project planning stage)
Technical factors - Life-cycle methodology - Estimation techniques/ tools - Planning/ scheduling and
risk management techniques
Project Team
Project manager (Experience, power, effort)
Team members (experience, technical capability, commitment and persistence)
Management factors
Management support
Objectives statement
Leadership style
Availability of resources
Planning Performance
- Defining
requirements and specifications
- Estimating
timeline and effort - Scheduling - Identification,
estimation and evaluation of risks
Project Outcomes - Project results
(completion time and cost)
- Quality and Customer satisfaction
- Organization benefits - Project personnel
satisfaction
Project characteristics (size and ownership)
Planning factors

62 Chapter 4
4.3 DEVELOPMENT OF THE HYPOTHESES
The important role of planning to project results is confirmed by many previous studies.
This research explores in more detail the impact of different factors in the planning
process. The relationship between the planning process and different project outcomes are
examined. Based on the research objectives and the conceptual framework, the hypotheses
of this study are specified.
4.3.1 Hypothesis 1: The Impact of Personnel Factors on Planning Performance
The human factor in the Chatzoglou model (1998) includes team members and users.
However, these people have very different roles and responsibilities in a software project.
From the management perspective, the project manager can control team members and
satisfy the client. This model will consider human factors separately as external and
internal stakeholders.
Internal stakeholders mean the members in the project team. The important role of project
manager has been affirmed in past research. Verner et al. (1999) have found, in successful
projects, the respondents did not often comment on the project manager. Over half of the
unsuccessful projects encounter problems with the project manager, such as no experience,
insufficient time spent on project planning and the lack of an integrated project plan.
Callahan and Moretton (2001) have identified the relationship between the project leader’s
power and software development time. The greater the power, the shorter the development
time. Nguyen M. (2003) also found the relationship between a capable project manager and
potential project success.
In brief, previous studies have confirmed the influence of the project manager’s effort and
experience on project outcomes. Chatzoglou et al. (1997) considered the role of experience
and knowledge of team members in the allocation of resources in planning, but did not
clarify the role of the project manager.
This study focuses on planning, so the influence of project manager in terms of his effort
and experience on planning performance is explored. There are two variables to be
examined. The first is the effort that project managers spend for planning. Barry et al.

Conceptual Framework and Research Methodology 63
(2002) indicated that a longer project duration required, more effort for the project. In this
study, it is expected that if project managers spend more effort in the planning stage, they
will achieve the better planning performance. The second variable is the project manager’s
experience. As mentioned by Verner et al. (1999) and Nguyen M. (2003), the project
manager with more experience will reduce the possibility of the failure of the project. The
following hypotheses are proposed:
H1a: There is a positive relationship between the effort that project manager spends for the
planning stage and planning performance.
H1b: There is a positive relationship between the experience of the project manager and
planning performance.
Regarding the role of team members, Krishnan (1998) found that a software team with
more capable staff exhibits a significantly lower number of defects in their products. The
capability of personnel in the team is measured by the technical competence of the team as
a whole relative to other software project teams in the firm. The assessment ranged from
(1) very low capability to (5) very high capability. Defects measure the number of
customer reported defects. Once customer complaints are received, they will be analyzed
for their validity. A valid complaint is passed to the second level of service support for
more detailed analysis. This complaint is identified as a field defect, and was collected
from the central defect database of the software companies.
According to Chatzoglou and Macaulay (1996 – 1998), the project team members can
affect the resource allocation in the requirement capture and analysis as well as in the
whole development process. The project team members are assessed by their experience
with system development, requirements definition, and knowledge of the application
domain.
Barry et al. (2002) also considered project team skills as a variable that can influence the
project effort measured by time units to complete the project requirements. Their study
didn’t find a link between this factor and project effort or duration. However the project
team skills were rated as high or low. These results of Barry et al. (2002) are consistent
with other studies. The skills of the project team and the effort that the project team spends

64 Chapter 4
to complete project requirements could be considered as two different dimensions that
influence project results.
In planning, team members have to capture and analyze the customer’s requirements.
These are used to define the product specifications. From this, the necessary activities for
software development process are determined. For this reason, team member capability
could influence the planning performance in terms of defining requirements and product
specifications. The following hypothesis is proposed:
H1c: There is a positive relationship between the capability of team members and planning
performance
In a software company, the most important external stakeholder is the customer.
Chatzoglou (1997), proposed five determinants from the customer that could influence
project planning. The first is the customer’s knowledge of the purpose of the IT system and
software. Second, is the customer’s motivation for ordering the software. Next, is the level
of conflicts between the users. Fourth, is the resistance to the development of the specific
system. Finally, the participation of customers in the development process and
communication with project team members is influential.
Historical data are usually unavailable for the first four determinants because the software
company was not aware of the necessity to investigate them. Participation of the customers
is easier to evaluate and has been discussed in many previous studies. Verner, Overmyer
and McCain (1999) indicated that problems with customers and users affected nearly 50%
of the failed projects. One of these problems is the insufficient involvement of the user
community. According to Yeo (2002), the lack of user involvement and their inputs from
the beginning are key factors related to project failure. Procaccino et al. (2002) indicated
that the higher involvement of the customer or user, the higher the chance for project
success. The study of Dvir, Raz and Shenhar (2003) also found that “end-user
representatives involved in need definition” is the most important factor in the
development of the functional requirements of software.
In current study, it is expected that the level of customer involvement influences the
planning performance. The following hypothesis is developed:

Conceptual Framework and Research Methodology 65
H1d: There is a positive relationship between customer involvement and planning
performance
4.3.2 Hypothesis 2: The Impact of Technical Factors on Planning Performance
Technical factors refer to the quality of techniques and tools employed and their efficient
use in the planning stage. Chatzoglou (1996a) treated technical factors as one input in his
model. Verner, Overmyer and McCain (1999) concluded that applying appropriate and
efficient techniques and tools in the software development process will increase the chance
for project success. In this study, applying the tools and techniques in the planning stage
will be considered. These methods and techniques are categorized as project management
approaches, system development methods and life-cycle methodology.
The application of project management techniques was surveyed in the study of White and
Fortune (2002). They indicated that the Gantt chart and project management software were
the most used techniques in project management. Applying project management methods
or tools did not appear in the list of factors critical to the project outcomes they identified.
Regarding software projects, the system development methods and life-cycle methodology
are also considered. These methods are used in the early stage and throughout the software
project life – cycle. Choosing system development methods and life-cycle methodology in
a software project depends on the technology of software engineering. These technologies
have changed over time, from the structured approach to object – oriented programming.
Today, many methods and tools are available. They range from a basic approach (like
object – oriented) to more complex applications (like RUP). These methods were described
in the Chapter 2. The use of these methods has not been studied in depth in previous
studies. This study assumes that applying the methods or techniques in project planning
with improve planning performance. The following hypotheses are proposed:
H2a: There is a positive relationship between applying project management methods and
planning performance.
H2b: There is a positive relationship between applying system development methods and
planning performance.
66 Chapter 4
H2c: There is a positive relationship between applying life-cycle methodologies and
planning performance.
4.3.3 Hypothesis 3: The Impact of Management Factors on Planning Performance
In previous studies, many management factors were examined. This study will examine the
impact of management support, objective setting, the availability of resources and
management style on planning performance.
Management support in planning stage
Whittaker (1999) found that a lack of management involvement and support was a cause
for project failures. Verner, Overmyer and McCain (1999) also indicated that almost all of
the failed projects were affected by the lack of higher level of management support. Belout
and Gauvreau (2003) also confirmed the positive correlation between management support
and project success. Callahan and Moretton (2001) found a significant negative
relationship between the supplier, involvement of sales and marketing department and the
software development time. More involvement resulted in a shorter software development
time. Procaccino et al. (2002) identified a significant correlation between a committed
sponsor and project success.
In this study, management support in the planning stage will be considered at different
levels: top management support, committed sponsorship and early involvement of sales
and marketing departments. The following hypothesis is proposed:
H3a: There is a positive relationship between management support and planning
performance.
Objectives Setting
Clearly defining the project mission, goal and scope are very important to project success.
This action should be undertaken at the very start of the software development process.
Abdel-Hamid et al. (1999) found that different in project goals such as minimizing
overruns in cost, schedule or quality and reducing overrun affects planning and resource
allocation. This significantly influences project performance.

Conceptual Framework and Research Methodology 67
The results of Yeo (2002) also indicated that a weak definition of requirements and project
scope is one of the biggest failure factors in a software project. Belout and Gauvreau
(2003) found the link between the project mission defined in the planning stage and project
success. In the framework of this study, the clear definition of project goals influences
planning performance. Several project objectives are examined: cost and time criteria and
customer oriented criteria. It is hypothesized that:
H3b: There is a positive relationship between clear project objectives and the planning
performance.
Availability of resources
The availability of resources related to allocation in the project influences project results.
Resources usually mean people, time and money. Chatzoglou & Macaulay (1997) found
that spending less than 15% of the total time and 15% of total cost in the requirements
capture and the analysis process was insufficient for the successful completion of this
process. White and Fortune (2002) ranked “adequate funds and resources” as the major
factor that influenced project outcomes. The allocation of resources is determined in the
project plan, and availability of sufficient resources is a constraint for planning. Resources
such as qualified personnel or infrastructure will be advantageous for planning. In this
framework, availability is considered as an important management factor that influences
planning performance. The following hypothesis is proposed:
H3c: There is a positive relationship between the sufficient availability of resources and
planning performance
Project management style
Chatzoglou and Macaulay (1998) specified management style as a factor that affects the
software development process. Yeo (2002) also proposed that a top-down management
style can negatively influence project success. However, only in the study of Loo (2002), is
this management style specified. He identified the commonly adopted leadership styles in
project management, including people-oriented, participative, transformational, and
situational leadership. An appropriate management style could speed up the process and
motivate project team members. This will contribute to the success of a project. The pilot
survey of project managers in Vietnam indicated that these styles are unknown or not

68 Chapter 4
commonly used. An alternative management style is considered, such as people – oriented,
work – oriented, etc. In a software project, personnel play the important role in developing
products. The people – oriented style would be appropriate to this type of project. In this
study, it is supposed that:
H3d: There is a positive relationship between the people – oriented management style and
planning performance
4.3.4 Hypothesis 4: The Impact of Planning Performance on Project Outcomes
Whittaker (1999) indicated that poor project planning, specifically, inadequate risk
management and a weak project plan are the common reasons for project failure. Project
planning has a mediating effect on the link between project uncertainty and IT project
success (Aladwani 2002). Poor planning in software projects in Vietnam was the most
important cause of project failure (Nguyen M., 2003). Project planning is definitely
affected by human, technical and management factors.
In current study, the relationship between project planning performance and different
project outcomes are examined. If there is a relationship between planning and project
success, the relationship of different factors related to personnel, applied techniques and
the management approach in planning to final project outcomes is also determined. Dvir et
al. (2003) considered planning through three dimensions, including the development of
functional requirements, technical specifications, and the implementation of project
management. Planning performance is evaluated the through defining requirements and
specifications, estimating effort and time, setting schedules, and risk analysis.
To measure the outcomes, multiple criteria are used. Through a synthesis of the common
criteria used for project evaluation in Chapter 3, the most frequent evaluation criteria used
are:
- Project results in terms of time, cost and quality (Wateridge, 1998; Abdel-
Hamid et al., 1999: Dvir et al., 2003)
- Customer satisfaction (Wateridge, 1998; Seen et al., 2001; Dvir et al., 2003)
- Organization benefits (Seen et al., 2001; Dvir et al., 2003)
- Project team members satisfaction (Wateridge, 1998)
Conceptual Framework and Research Methodology 69
Estimating the project duration, cost and budget, scheduling and budget are very important
tasks of planning. A good project plan with accurate estimation, good scheduling and
appropriate risk analysis could help the project to be completed on time and within budget.
Planning performance influences project outcome in terms of time and cost. Quality and
customer satisfaction are the most important criteria for the evaluation project results. In
planning, the customer requirements are defined as product specifications. Besides the
criteria of product quality, the satisfaction of customers depends on how much the
requirements are met. For that reason, the definition of product requirements and
specifications in the planning will affect product quality and customer satisfaction.
Organization and project team benefits could be categorized as financial and intrinsic
benefits. Better planning performance with an accurate estimation of cost, time and
allocation of resource will increase the financial benefit of the projects. Financial benefits
are defined as the benefits in money for both the parent companies and project teams.
Explicit requirements and specifications of the software product will contribute to the
qualitative benefits of a project. Non – financial benefits include improving the company
image, enhancing the project team capability, customer satisfaction. This study expects that
planning performance is related to the accomplishment of project outcomes and the
possibility of project success. It is proposed that the better the planning performance, the
lower the project completion time and cost. The following hypotheses will be tested:
Hypothesis 4a: There is a positive relationship between effective planning performance
and project success
Hypothesis 4b: There is a positive relationship between effective planning performance
and the project’s financial benefits
Hypothesis 4c: There is a positive relationship between effective planning performance
and project’s qualitative benefits
Hypothesis 4d: There is a negative relationship between effective planning performance
and project completion time

70 Chapter 4
Hypothesis 4e: There is a negative relationship between effective planning performance
and project completion costs
4.3.5 Hypothesis 5: The Impact of Project Characteristics on Planning Performance
The essence of relationships between planning factors, planning performance and project
outcomes can differ between projects with different characteristics (Chatzoglou, 1997a,
1998; Krishnan, 1998; Aladwani, 2002 and Westerveld, 2003). Project characteristics that
were commonly considered in previous studies included project size, type, target user, and
sectors.
Although the study of Nguyen M. (2003) indicated that there is no difference between
projects with different sizes, but the project size in that study is small and measured by
number of people in project team. The common measurement for project size is number of
man – month spent for the project. This data, however, was not recorded in all projects,
especially small ones. Using the duration of project and number of people involved in
project team to measure project size could confirm similar results as previous studies. It is
assumed that projects with a longer duration will be difficult to control and manage. In
planning also, it is difficult to estimate the effort and risk for the project with longer
duration and more people participate. This study considers project size as a project
characteristic that influences planning performance.
Software projects are developed by different types of software companies. The companies
are classified by their ownership, such as foreign and local. It is expected that there are
differences in the management process and technology between foreign and local
companies. These differences could influence planning performance. It is assumed that the
differences (if any) come from technology and management process transferred by foreign
partners.
In brief, there are three project characteristics that will be considered as factors influencing
the planning performance. These are project duration, project type and project ownership.
The following hypotheses are proposed:
H5a: There is a negative relationship between project size and effective planning
performance.
Conceptual Framework and Research Methodology 71
H5b: There is positive relationship between project ownership (international company)
and planning performance.
4.4 OPERATIONALIZATION OF THE VARIABLES
The operationalization of variables in the study is done in two steps. In the first step, the
measurements for the constructs that have been developed in the conceptual framework are
defined. In the second step, the items of each construct are specified to define the variables.
The constructs include:
- Project manager effort
- Project manager experience
- Team member knowledge, experience and attitude
- Customer involvement
- Project management method
- System development method
- Life-cycle method
- Management support
- Objective of the project
- Resource availability
- Management style
- Planning performance
- Project outcomes
- Project characteristics
The types of scaling for these constructs are both nominal and interval scale. The methods
or techniques applied in the project, including project management method, system
development method, and life – cycle method and the project characteristics such as project
duration, project type and project ownership use the nominal scale.
A five point Likert scale is developed to measure most of the constructs. The scale used in
these measures is modified to meet the specific purpose of each construct. The following
constructs used this scale: Project manager effort; Project manager experiences; Team
72 Chapter 4
member ability; Customer involvement; Management support; Project objective;
Availability of resource; Management style; Planning performance; Project outcomes.
The scale used to measure Completion time and Completion cost of the project is a four -
point scale. It includes 1 = ahead of schedule/ budget; 2 = On time/ within planned budget;
3 = Over 30% behind schedule/ cost overrun; 4 = Over 50% behind schedule/ cost overrun.
Time and effort spent for planning is measured by “% of elapsed time” and “% of total
involved in the whole project”.
The nominal scales that indicate the background characteristics of the software companies
and projects are also specified. These items covered Location (Location); Enterprise
ownership (Local or Foreign); Year of foundation (Company age); Number of employees
(Company size); Field of products (Products); Clients location (Clients); Software project
type (Project type); and the Number of people involved in project (Project size).
The summary of these measurements is presented in Appendix C, Table 4.1
4.5 VARIABLES RELATED TO PLANNING FACTORS AND PLANNING
PERFORMANCE
Dependent variable: Hypothesis 1 – 3
The dependent variable for Hypothesis 1 through Hypothesis 3 is Planning Performance.
As described in the conceptual framework, planning performance is measured through the
implementation of the four tasks of planning, including defining requirement and
specifications, estimating cost and time, setting the schedule and risk analysis. Respondents
were asked to indicate how they evaluate these tasks in planning. A five – point rating
scale is used, in which 1 = very poor; 2 = poor; 3 = average; 4 = good; 5 = very good. As
alternative, we recode also the Planning performance variable as a dummy variable, in
which 4 and 5 are recoded as 1 that represents the satisfied planning performance and 1, 2
and 3 take the zero value that represents the dissatisfied planning performance.

Conceptual Framework and Research Methodology 73
Independent variables: Hypothesis 1 – 3
The independent variables for Hypothesis 1 through Hypothesis 3 include: project manager
experience, project manager effort, team ability and commitment, customer involvement,
applying project management method, applying system development method, applying the
life-cycle method, management support, project objectives, availability of resources, and
management styles.
Project manager experience represents the level of management experience of the project
manager or team leader. This experience assessed managing teams, communication with
the customer and technical knowledge and skills applied in the initial stage of a project.
The project manager’s experience is measured by the five – point rating scale, in which 1 =
very low; 2 = low; 3 =average; 4 = high; 5 = very high.
Project manager effort represents the level of effort that a manager spends for project
planning. The effort is revealed through the activities the manager carries out for project
planning and the extent of control of product specifications. The effort of the project
manager in the project is evaluated by a comparison to other projects management
experience. A five – point rating scale is used for these items, in which 1 = much lower; 2
= lower; 3 = equal; 4 = higher; 5 = much higher.
Team member’s ability and commitment represents the knowledge and experience of
project members in analysis of requirements, system development and their commitment in
planning. These items are evaluated by the project manager through a comparison to work
requirements. A five – point rating scale is used, in which 1 = very low; 2 = low; 3 =
average; 4 = good; 5 = very good.
Customer involvement indicates the level of participation of the customer in planning. It is
evaluated by the project manager. A five – point rating scale is used, in which 1 = very
low; 2 = low; 3 = average; 4 = good; 5 = very good.
The project management method specifies the application of a specific project management
method in the project. This is a dummy variable with 1 = Yes (applied) and 0 = No (not
applied).

74 Chapter 4
The system development method identifies a specific method that was applied in the
project. The most used method is determined. The variables then are formed from these
most frequently used methods. They include object – oriented and RUP method. These are
also dummy variables.
The life-cycle method indicates a specific method that was applied in the project. The most
frequent life-cycle methods are chosen to form the variables. They are waterfall and spiral
model. This is also a dummy variable.
Management support represents the extent of support from different internal and external
stakeholders that are related to the project. They include top management, sponsor, sale
and marketing department of the software company, the functional departments of the
client. The involvement of these stakeholders is evaluated separately. A five – point rating
scale is used for these items, in which 1 = strongly disagree; 2 = agree; 3 = neutral; 4 =
agree; 5 = strongly agree.
Project objectives indicate the level of importance of the different outcomes that the
project wants to achieve. The common objectives are listed and respondents are asked to
rate the importance of each. Two variables named “Cost and time oriented” and “Customer
oriented” were established. A five – point rating scale is used for these items, in which 1 =
very unimportant; 2 = unimportant; 3 = neutral; 4 = important; 5 = very important.
Availability of resources identifies the level of four important resources used in a project,
including manpower, time, budget and infrastructure. A five – point rating scale is used for
these items, in which 1 = very unimportant; 2 = unimportant; 3 = neutral; 4 = important; 5
= very important.
Management style specifies the extent of applying different management styles in the
planning of a project. Three decision making styles and two leadership styles are
considered. The definitions of these styles are different from what was proposed in the
conceptual framework. The pilot survey indicated that respondents didn’t know or apply
the styles identified by past research, such as people-oriented, participative,
transformational, and situational leadership. These styles are modified and respondents are

Conceptual Framework and Research Methodology 75
asked to rate the level of use of these styles. The variables then are formed from the most
frequently used methods. This is set up as a dummy variable.
4.6 VARIABLES RELATED TO PLANNING PERFORMANCE AND PROJECT
OUTCOMES
Dependent variables: Hypothesis 4a – 4e
The dependent variables for Hypothesis 4 are project outcomes. They include project
success, qualitative benefits, financial benefits, completion time and completion cost
Project success represents the level of success is evaluated from different points of view,
including the project team, parent company, customer and sponsor (if available).
Qualitative benefit identifies the extent of the contribution of the project results on the
qualitative benefits of the software company such as enhancing the image of company or
improving the team member capability.
Financial benefit indicates the extent of the contribution of the project results on the
financial returns for the software company and the project members.
Completion time specifies the level of accomplishment within time of the project.
Completion cost identifies the level of accomplishment within the budget of the project.
The scale of these dependent variables has been described in the previous section. We have
also recoded them as binary variables. For project success, qualitative benefits and
financial benefit, values of 4 and 5 are changed to 1 that represents the satisfaction
outcomes, values of 1, 2 and 3 are changed to 0 that represents the dissatisfaction.
Regarding completion time and completion cost, values 1 and 2 are recoded to 1 as the
satisfaction outcome and values 4 and 5 are changed to 0 that represents the dissatisfaction
outcome.
Independent variable: Hypothesis 4a – 4e
The independent variable for hypothesis 4 is planning performance that indicates the level
to which the performance of the four main tasks of planning is accomplished.

76 Chapter 4
4.7 VARIABLES RELATED TO PROJECT CHARACTERISTICS AND
PLANNING PERFORMANCE
The dependent variable for hypothesis 5 is the same for hypotheses 1 – 3, that is planning
performance. The independent variables for hypothesis 5 are also the same for hypotheses
1 – 3; with three more variables added. These are project size, type and ownership. These
characteristics are treated as dummy variables. For project size, value of 1 is assigned for
the below average size group and 0 is assigned for the above average size group. For
project ownership, value of 1 denotes a project of the foreign company and value 0 denotes
a project of local company. Only most frequent type of made – to – order is chosen for
project type variable. The value of 1 is assigned for a made – to – order project and value
of 0 for the others.
To examine the moderating effect of the project characteristics on the relationship between
planning factors and planning performance, the interaction variables are established. These
variables are defined by product of planning factor variables (independent variables) and
project characteristics (moderating variables).
4.8 STATISTICAL METHODS
This study uses various statistical techniques to analyze the results of the survey. The
descriptive statistics are used to indicate the status of planning in software projects
presented in Chapter Seven. In chapter eight, we test by mean of several t – tests the
differences in planning performance according to different characteristics of the project.
The independent-samples t – test is used for examining the different between two groups of
project size (below and above average size) and project ownership (local and foreign
company). The ANOVA analysis is applied for testing the different between three groups
of project type (commercial, made-to-order, and outsourcing). The results of this analysis
are presented in Chapter Eight.
For testing the proposed hypotheses of relationships between planning factors, planning
performance and project outcomes, two regression analysis techniques are used: the
classical multiple regression model and the binary logit regression model.

Conceptual Framework and Research Methodology 77
Three models are developed to test Hypotheses 1 – 5. Specifically, the Model 1 named the
importance of planning factors which is used to test the sets of Hypotheses 1 – 3 predicts the
impact of planning factors on planning performance. The results of relationship analysis are
presented in Chapter Nine. Mathematically, Model 1 is expressed in Figure 4.2.
Figure 4.2: Model 1: The importance of planning factors
Model 2 analyses the importance of planning with 5 variations and is used to test
Hypothesis 4a – 4e which predicts the causal relationship between planning performance
and project outcomes and success. Mathematically, Model 2 is expressed in Figure 4.3.
Model 1: The importance of planning factors
PLAN = f (H1, H2, H3, H4, T1, T2, T3, T4, T5, M1, M2, M3, M4, M5, M6)
where: PLAN = Planning performance
H1 = Project manager experiences
H2 = Project manager efforts
H3 = Team member ability and commitment
H4 = Customer involvement in planning
T1 = Project management method
T2 = System development method 1 (Object - oriented)
T3 = System development method 2 (RUP)
T4 = Life-cycle method 1 (Waterfall)
T5 = Life-cycle method 2 (Spiral)
M1 = Support from top management and functional department
M2 = The importance of Project objective 1 (Cost & time oriented)
M3 = The importance of Project objective 2 (Customer oriented)
M4 = Availability of resource
M5 = Applying level of management style 1 (People oriented)
M6 = Applying level of management style 2 (Work oriented)

78 Chapter 4
Figure 4.3: Model 2: The importance of planning
Model 3 is developed to test the effects of the Project characteristics on the planning
performance. The variables of project size (SIZ), and project ownership (OWN) are added
into the model. Mathematically, Model 3 named the role of project characteristics is
expressed in Figure 4.4.
Model 2: The importance of planning
Model 2a: Impact of planning performance on project success of a software
project
OUT1 = g1(PLAN)
Model 2b: Impact of planning performance on Qualitative benefits of a software
project
OUT 2 = g2(PLAN)
Model 2c: Impact of planning performance on Financial benefits of a software
project
OUT 3 = g3(PLAN)
Model 2d: Impact of planning performance on Completion time of a software
project
OUT 4 = g4(PLAN)
Model 2e: Impact of planning performance on Completion cost of a software
project
OUT 5 = g5(PLAN)
where:
PLAN = Planning performance
OUT 1 = Project outcome 1 (Project success)
OUT 2 = Project outcome 2 (Qualitative benefits)
OUT 3 = Project outcome 3 (Financial benefits)
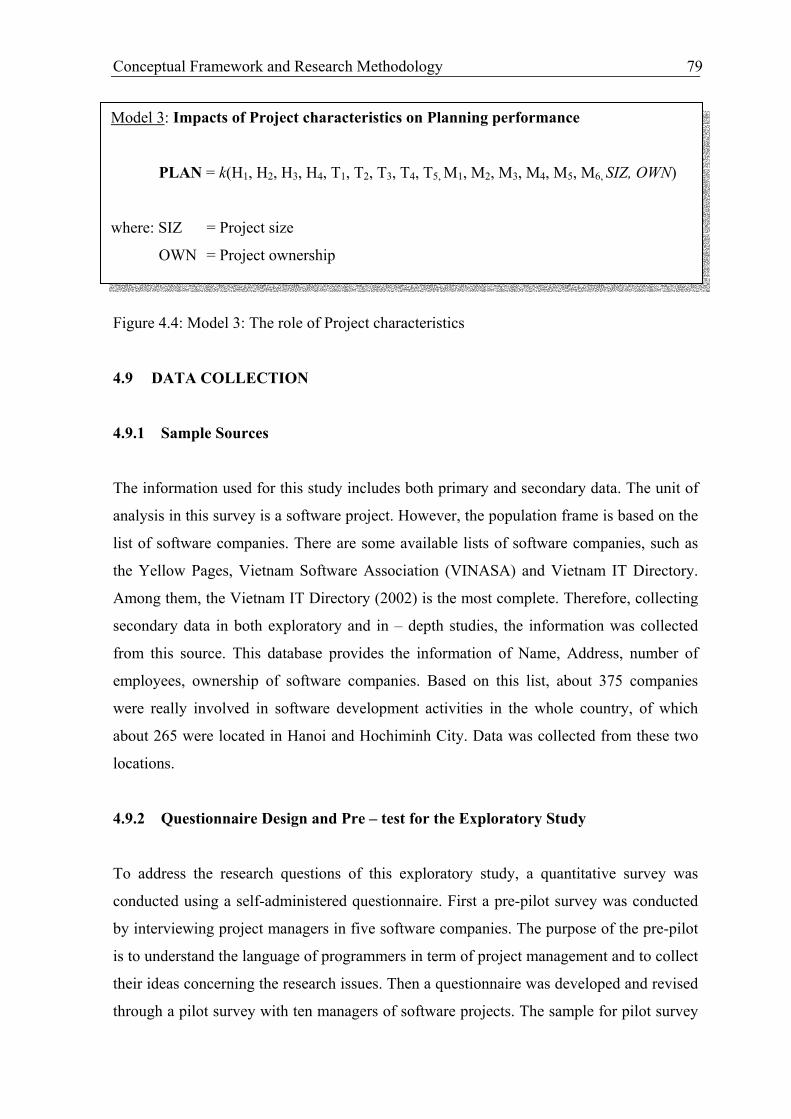
Conceptual Framework and Research Methodology 79
Figure 4.4: Model 3: The role of Project characteristics
4.9 DATA COLLECTION
4.9.1 Sample Sources
The information used for this study includes both primary and secondary data. The unit of
analysis in this survey is a software project. However, the population frame is based on the
list of software companies. There are some available lists of software companies, such as
the Yellow Pages, Vietnam Software Association (VINASA) and Vietnam IT Directory.
Among them, the Vietnam IT Directory (2002) is the most complete. Therefore, collecting
secondary data in both exploratory and in – depth studies, the information was collected
from this source. This database provides the information of Name, Address, number of
employees, ownership of software companies. Based on this list, about 375 companies
were really involved in software development activities in the whole country, of which
about 265 were located in Hanoi and Hochiminh City. Data was collected from these two
locations.
4.9.2 Questionnaire Design and Pre – test for the Exploratory Study
To address the research questions of this exploratory study, a quantitative survey was
conducted using a self-administered questionnaire. First a pre-pilot survey was conducted
by interviewing project managers in five software companies. The purpose of the pre-pilot
is to understand the language of programmers in term of project management and to collect
their ideas concerning the research issues. Then a questionnaire was developed and revised
through a pilot survey with ten managers of software projects. The sample for pilot survey
Model 3: Impacts of Project characteristics on Planning performance
PLAN = k(H1, H2, H3, H4, T1, T2, T3, T4, T5, M1, M2, M3, M4, M5, M6, SIZ, OWN)
where: SIZ = Project size
OWN = Project ownership
80 Chapter 4
was chosen by convenient method. However, it covered both local and foreign software
companies with different size. The pilot survey was designed to ensure all the questions
were clearly understandable without further explanations.
The revised questionnaire includes 20 questions that explored the following areas:
information about the respondent, the project and the company
project management practices (focused on team, quality, and time management)
and major problems in managing the software project.
the criteria used for evaluating project outcomes
the critical factors influencing project success
The questionnaire is displayed in the Appendix A1 and the list of companies in this
exploratory survey is shown in Appendix B1.
Once the questionnaire was reviewed, 120 copies were sent to project managers in software
companies by mail. 55 accepted responses were received from 46 software companies.
Some larger companies (with more than 100 employees) provided more than 1 response. A
few responses with missing data have been excluded from this sample.
4.9.3 Questionnaire Design and Pre-test for the In – depth study
The in – depth survey to identify the role of planning in software project management was
conducted through two steps. The first is a pilot survey using by in-depth interviews with
the 13 project managers or executive managers of software companies in two locations of
Hanoi and HCMC. They were asked to describe the most recent project in which they have
participated. Most questions were open-ended, but followed the framework developed for
this study. The interviewees in this in – depth interviews are come from both local and
foreign companies. The selection was based on convenient method however the sample
should cover software companies in both local and foreign sectors and with different size.
Most of popular software companies like FPT, CMC, PSV and TMA were included in this
sample. The goal of this interview is to provide the understanding of project management
in software companies for questionnaire design and qualitative analysis.

Conceptual Framework and Research Methodology 81
Based on the conceptual framework, measurements presented in previous sections and
interviews, a questionnaire with 35 questions, including 90 variables was designed. The
respondents for this survey were project managers or team leaders. Top managers and
customers (if available) of the project were interviewed to consider the different point of
view on issues such as the involvement of customer or user, the satisfaction of customer,
the support of the top manager and the success of the project. This questionnaire was
translated into Vietnamese, except for the well-known technical terminology.
The collected data consists of:
- Background data of the software companies (name, location, number of employees,
products, clients)
- Background data of the software projects (name, type of project, clients, project
duration and cost, number of people involve in project)
- People in project planning (experience and authority of project manager;
knowledge, experience and commitment of team members; involvement of
customer)
- Techniques in project planning (application of method/ tools/ software in project
management; system development and life-cycle software development model)
- Management in project planning (management support; objective statements,
leadership style; communication methods and goals; availability of resources)
- Planning performance in software projects (in terms of defining requirements and
technical specification of software product; estimating timeline and cost;
scheduling; analyzing risks)
- Project outcomes (in terms of time, cost, quality of delivered product, customer
satisfaction, organization benefits and project personnel satisfaction)
This questionnaire is presented in Appendix A2. The results of these in-depth interviews
are also used for the qualitative analysis in Chapter 6.
4.9.4 Sample Size and Collection Method in the In – depth study
According to Neuman (2000), the sample size of small population should be rather large,
i.e about 30% of the population size. Applying this rule, sample size for our survey would
be 80. In this case, an empirical research is conducted to apply the conceptual model of the

82 Chapter 4
relationship of factors of people, management and tools to planning performance and to
project results. With this emphasis, the questionnaire is designed to collect detailed
information from a specific software project.
This survey is conducted by using a self-administrated questionnaire, distributed by mail or
email and contact to respondents, or by giving it and collecting it later. Similar to the
exploratory study, the response rate of mail survey is very low (about 8%). Many software
companies that were selected randomly in the list were not still existence or not focused on
the software activities as their describing. Therefore, the snowball method was applied to
reach the respondents. The initial project managers were asked to suggest other potential
respondents. The author got a lot of supports from project managers in various software
companies. Through their introduction, the new samples were selected. The response rate
of this method is much higher than mailing (about 60%).
Totally 400 questionnaires were distributed by random mailing and snowball method. 80
qualified responses from software projects were received from 65 software companies
(20%). Some companies sent more than one response (from different software projects).
This sample size is acceptable according to suggested by Newman (2000). The
“representativity” of the sample will be examined through comparing the background of
the sample and the population. This will be presented in the Chapter Seven.
4.9.5 Sampling Errors
The estimates from a sample survey are affected by two types of errors: (1) non – sampling
errors, and (2) sampling errors. Non – sampling errors are the results of mistake made in
implementing data collection, such as inability to obtain information from different persons
in a sample. In the survey questionnaire, there is a question that should be answered
differently by different people such as project managers, top managers and project clients.
In some projects, I could not assess all these persons, so the question was answered
through the evaluation of the project manager. The other errors include differences in
question interpretation, in ability or unwillingness of respondents to provide accurate
information, inability to recall information. For these types of error, the data collection
method by interviewing in this study could reduce them. Except some responses received
by mail or email, most of data were collected through interview. Some sensitive questions

Conceptual Framework and Research Methodology 83
related to revenue, specific clients were not in the questionnaires to help the interviewees
fell free to answer. Some non – sampling errors relate to data analysis such as processing
errors, imputation errors. Although numerous efforts were made during the implementation
of this survey to minimize this errors, non – sampling errors are impossible to avoid
completely and difficult to evaluate statistically.
Sampling errors, on the other hand, can be evaluated statistically. The sample of software
companies selected in this study is only one of many samples that could have been selected
from the same population. Each of samples would yield results that differ somewhat from
the results of actual sample selected. In this study, to examine the representative of the
sample, the characteristics of the current sample will be compared to the other studies’ and
population information. However, this comparison is limited because there is only some
characteristics of the population such as company ownership, size, age are available.
Another comparison is the comparison between 2 sub-samples that extract from the
original sample of this study. Because the data were collected in a quite long time, the 20
last samples that collected in the beginning of the year of 2004 will be compared to the first
60 samples. The results of these comparisons will be presented in Chapter 7.
4.10 SUMMARY
This chapter discusses the research design relevant to this study. The design included the
conceptual framework, development of the hypotheses, operationalization of variables,
statistical methods and sampling.
The conceptual framework and hypotheses were developed based on the analysis of
previous research. This analysis determined the gap in the literature on software project
management, especially the role of planning. The conceptual framework is used to develop
the hypotheses that will be tested. The constructs used in conceptual framework were
generalized, not specifically for the Vietnamese context. Most of the variables were
operationalized by adopting measures developed in previous research. The multiple and
logistic regression models will be used for hypotheses testing are also presented. The
sampling method in this study is integrated between mailing (and receiving randomly) and
snowball method. The sample of 80 projects was collected, mainly in which come from the
snowball method.

84 Chapter 4

85
5
PLANNING IN SOFTWARE PROJECTS –
A CASE STUDY OF THE FINANCING AND
PROMOTING TECHNOLOGY
CORPORATION 5.1 INTRODUCTION ................................................................................................................86
5.2 THE FINANCING AND PROMOTING TECHNOLOGY CORPORATION (FPT) – AN
INTRODUCTION ................................................................................................................87
5.3 PROJECT CHARACTERISTICS ........................................................................................88
5.4 PROJECT PLANNING ........................................................................................................89
5.4.1 Defining The Customer Requirements , Scope and Objectives................................89
5.4.2 The Project Manager’s Authority and Project Infrastructure....................................90
5.4.3 Analyzing The Project Characteristics......................................................................91
5.4.4 Identifying The Project Activities And Estimation...................................................92
5.4.5 Identifying Activity Risks .........................................................................................93
5.4.6 Allocation Of Resources ...........................................................................................93
5.5 EVALUATION OF PLANNING PERFORMANCE AND PROJECT OUTCOMES........93
5.6 FACTORS INFLUENCING THE PLANNING PERFORMANCE....................................94
5.7 SUMMARY..........................................................................................................................97

86 Chapter 5
5.1 INTRODUCTION
This chapter will describe the planning process in a specific software project in the leading
software company in Vietnam. This qualitative analysis brings the real case that helps to
understand how an actual project plan works. The chapter begins with methodology for
conducting the in – depth interview. It is followed by background of the company. In the next
section, the project planning process is described. The last sections present the project outcomes
and the relationship between planning and these outcomes.
In – depth interviews were conducted with 13 project managers of software companies in Hanoi
and Hochiminh City (the Questionnaires for this survey is presented in the Appendix A3).
Through these interviews, the project managers described their projects, and defined the
influences of key factors on planning performance and outcomes. They also explained these
relationships. These interviews provide information for qualitative analysis that support or
explain the quantitative results. A leading software company in Vietnam was chosen for an in –
depth case analysis in this chapter. The Financing and Promoting Technology Corporation (FPT)
agreed to participate. The impact of the performance of real software projects will help to
describe planning in practice and explain the relationships that related to performance. The
analysis will be conducted based on the Step wide planning framework of Hughes and Cotterell
(2002) that was presented in Chapter Two.

Case Study of the Financing and Promoting Technology Corporation 87
5.2 THE FINANCING AND PROMOTING TECHNOLOGY CORPORATION (FPT) –
AN INTRODUCTION
FPT is a large local joint – stock company that mainly operates in IT. Founded in 1988 with only
13 employees with a head office located in Hanoi, FPT Corp. has grown to 2045 employees. It
operates six business units, including software development which is its main focus, system
integration, distribution, internet service, computer manufacturing and software professional
training service with many branches in Hochiminh City, other provinces as well as representative
offices in the USA, Japan, and India.
FPT has focused on software engineering since 1990 for both local the market and export. Also in
1990, the Software Development Center was established for a new direction. By the end of 2003,
FPT had 800 employees in software units and is the largest software producer in Vietnam. FPT
has re-structured its software development activities into two subsidiaries, FPT Software
Company (FSOFT) and FPT Software Solutions Company (FSS). FSOFT concentrates on the
outsourcing market abroad, and FSS provides the Solutions and Software services to business
units and government organizations in Vietnam and the Asian region.
Both FSOFT and FSS employ an advanced quality assurance system to insure customer
satisfaction, FPT Software has become the first Information Technology Company of Vietnam to
achieve the ISO 9001:2000 certificate. In 2004 it became one of the first companies in Asia to
achieve the SEI CMM 5 certificate. Also, FSOFT has also conducted a program for Insight
management, which is highly appreciated by customers. In addition, FSOFT is determined to
achieve other international standards such as CMM Integrated and Six Sigma. Based on business
requirements, the quality certificates have helped FSOFT build and maintain customer
relationship.
With more than 15 years in software development, FPT Software has done work for major clients
in the local market like Citibank, Deutsche Bank, HSBC, Vietnam Industrial Commercial Bank,
Stock Exchange Centre, VMS Mobile phone Company Ministry of Finance, General Department
of Taxation, State Treasury, and Vietnam Airline. The overseas customer list includes many
88 Chapter 5
leading firms like Harvey Nash (UK); WinSoft (Canada); ProDX, Ambient (USA); NEC, Hitachi
Soft, Nissen, Sanyo Electric, and NTT-IT (Japan).
FPT Software has gained many awards like “The Most Credible IT Company” awarded by PC
WORLD Vietnam for 6 consecutive years from 1998 to 2003 and “The Best Software Exporter”
awarded by the Ministry of Trade of Vietnam in 2003. This company is still the leader in IT
sector in 2005 (HCA, 2006)..
5.3 PROJECT CHARACTERISTICS
With an advanced quality assurance system and the professional staff, the management of
software project development in FPT Software has been standardized. Project managers and
developers are provided with the necessary tools, methods and training for their work. FPT
Software is one of few professional software developers in Vietnam. The evaluation of project
managers concerning the role of different factors of project planning and their impact on project
outcomes were drawn from this context.
Although FPT Software is strong in both outsourcing software and build – to – order projects, in
this case study, the analysis of a typical build – to – order project will be assessed. It is not a
strategic project with a major investment, so it can represent many other projects of FPT.
Through this project, the process and methods of project management in FPT Software will also
be described.
The project selected for analysis is to develop software for Hospital Administration made to order
for a state hospital in Vietnam. This project was implemented by the FPT Software Branch in
Hochiminh City. Because of the requirement of the interviewee – the project manager of this
project – the name of client was not disclosed. This project was planned to be completed in 18
months. The schedule was met but the actual cost for the project was over budget by 140%. The
total number of people involved was 7 developers, for which coding was the largest effort (6
persons). Planning included only 1 person – the project manager. In this project, the FPT team
implemented the whole process, from defining customer requirements to deployment and
maintenance.
Case Study of the Financing and Promoting Technology Corporation 89
The project manager of this project was has had 5 years of experience in project management and
has managed over 10 projects.
5.4 PROJECT PLANNING
Project planning is the first stage of a project. Planning was implemented by the project manager.
The content of the project plan included 7 steps. The first step is the overview of the project in
which the characteristics, software delivery, scope, and related documents were described. The
second step presented the project organization, team and procedures to coordinate with other
units. The third step specified quality management including criteria and control procedures. The
fourth step described the project process and schedule with specific milestones. The fifth detailed
the project configuration. The last steps considered resources and risk management.
The time allocated for planning this project was one month with only one person; it accounted for
0.75% of total effort spent for the project. This effort is very small as compared to the average of
22% of surveyed projects. The main activities of the planning are presented in the next section.
5.4.1 Defining The Customer Requirements , Scope and Objectives
Based on the customer proposal, the initial requirements were defined. In the initial meetings
between the client and project team (usually the project manager), the scope and objectives were
identified. The client’s objective for this software was to improve the management system of the
hospital, reduce the procedures for customers – patients, and better manage the clinical records.
The first objective was to deliver good quality software that met the customer’s objective. The
project team also set their own objectives, such as return from the project, and to gain potential
customer from other hospitals through developing this software. Although both sides obtained an
agreement for the general objectives of the project, there were still differences in defining the
specific features of the software. Because the customer had little experience in office
management and software, they could not clearly define their requirements for the software in
hospital management. To deliver the customer the best product to improve their operations
management, and to define the customer requirements and product specifications, the project

90 Chapter 5
team had proposed to change some requirements with the agreement of the customer. Therefore,
the requirements of this software were defined by both the project team and the customer. The
risk management procedure of FPT was presented for the customer’s agreement. This procedure
was to minimize the changes like customer requirements or late collection of information
throughout the whole software development process.
The main objective of the project was to satisfy the customer. To evaluate the project results,
many quantitative criteria were identified. These objectives followed the Quality Assurance (QA)
criteria, the key expected results were:
- Actual project time: not over 120% of plan
- Actual project cost: not over 130 % of budget
- For unit test or system test: not over 2 errors/ man – month
- For customer test: not over 1 error/ man – month
The QA includes many criteria to control the quality of a project. Depending on the
characteristics of a specific project, the project manager could consider how to apply these
criteria to the project. In this project, the project manager selected about 80% of QA requirements
of the company.
5.4.2 The Project Manager’s Authority and Project Infrastructure
In this project, the project manager had full authority to decide all issues related to the project like
selection and assigning the personnel, dealing with customers, project financing, subcontracting
and the decision to continue or cancel the project. The initial project budget could be approved by
project leader or the Board of Directors depending on the importance or the level of resource
utilization. When there are changes in the plan that require more resources (personnel or finance),
the project manager needs to get approval from top management. The project team could also
require support from other functional departments through the Product manager or Board of
Directors. However, in this project, after the contract was signed, the Sales and Marketing
department did not participate in any stage of the software development. With the described

Case Study of the Financing and Promoting Technology Corporation 91
authority, the project manager evaluated that it was enough to help him handle the project’s
issues.
Defining the project infrastructure included the selection of team members, and defining
communication methods. The selection of project team members was implemented by the project
manager based on the work. In the schedule, the project manager defined who would be involved
in specific tasks and at a specific time.
The methods of communication with the customer and within the project team were also defined
in the plan. The most common communication methods in this project were meetings and email.
Email was used to inform and communicate with the project team, and meetings helped to solve
the project problems, review the progress of team members and motivate the team. The minutes
of meetings with the customer and the reviews of project team meetings were recorded by a
specific department in FPT.
5.4.3 Analyzing The Project Characteristics
The general purpose of this analysis is to ensure that the appropriate methods were used in the
project. The methods that are reviewed here concern the project management, system
development and the project life cycle.
Like all software projects of FPT, this software project applied the management process designed
by FPT Software. This process based on the Microsoft Solution Framework. The project team
also used MS Project software and templates designed by the company to support project
management. The common tools used in this project included the Gannt chart, resource allocation
and time sheets to manage the time spent by developers for the project.
The life cycle method used for this project is Prototyping. This method was selected because of
the lack of experience of the customer. This was the first time the customer would be applying
management software to their services by an outsource contract. The lack of customer’s
experiences could lead to difficulties in defining their requirements or to change during the
92 Chapter 5
project duration. The project team could face risks if they chose the traditional methods like
waterfall in which the requirements are fixed and the experiences of software team specified. The
prototyping method reduces the uncertainty by conducting experiments in the design.
The development system method applied in this project was Object – oriented using UML
(Unified Modeling Language)∗. Without experience in software development, the customer was
not involved in the decision to choose these methods. The project manager took responsibility for
this choice.
5.4.4 Identifying The Project Activities And Estimation
Based on the proposal of the customer and the pilot survey of their activities, the product
specifications and project activities were defined. In this project, the manager selected the Use-
Case - Point (UCP) to estimate the effort for the project. The UCP system was developed by FPT
Software and applied for their projects. The number of man-months was calculated on the basis
of use-case and the cost of project was estimated. Based on experience, the project manager
defined and estimated the human resources needed for analysis and design, coding, testing, and
deploying. According to this project manager, the effort for analysis and design accounted for
30%, coding 40% and testing 30%.
In the master plan, the schedule with important milestones based on the required output to the
customer was defined.
∗ The Unified Modeling Language (UML) is a standard language for specifying, visualizing, constructing, and
documenting the artifacts of software systems, as well as for business modeling and other non-software systems. The
UML represents a collection of best engineering practices that have proven successful in the modeling of large and
complex systems. The UML is a very important part of developing object oriented software and the software
development process. The UML uses mostly graphical notations to express the design of software projects. Using
the UML helps project teams to communicate, explore potential designs, and validate the architectural design of the
software (http://pigseye.kennesaw.edu/~dbraun/csis4650/A&D/UML_tutorial/what_is_uml.htm)
Case Study of the Financing and Promoting Technology Corporation 93
5.4.5 Identifying Activity Risks
A risk plan was established to manage changes in the projects. In this plan, the potential risks
were listed. The solutions to prevent or overcome these risks were proposed in the plan. The
planner could refer to the risk database established by FPT Software. The risk management plan
was reviewed and updated weekly. In fact in this project, there was a risk in the information
collection and deployment stage. Because of the complexity of customer activity, the duration of
collecting data for defining the product requirements and specifications was extended compared
to the plan. Time for deploying this software to actual activities of customer was also longer than
planned. However these changes were estimated in the plan, the project manager also had to
increase time and effort of the project team to meet the planned time. The actual cost of project
therefore exceeded the budget. The causes of these risks were mainly the responsibility of the
customer, so this project manager negotiated the agreement with the customer to share this
excessive cost.
5.4.6 Allocation Of Resources
After estimating the effort and time for the project, the task list was established. This task list was
based on template files designed by FPT Software. This list included the job description for each
position like the project manager, technical leader, tester and developer. The training documents
were attached to this task list. In this task list, the responsibility of team members was defined by
RADIO principle, with R is Review, A is Approve, D is Do, I is Inform and O is Omit. With this
task list, personnel allocated for a specific task at a specific time.
5.5 THE EVALUATION OF PLANNING PERFORMANCE AND PROJECT
OUTCOMES
In the plan of this project, the list of project activities, schedule and workforce assignment were
defined. To evaluate this plan, four criteria of planning performance are considered. The first is
the analysis and defining of product specifications. The project manager evaluated the customer
requirements were understood but defining the product specifications was not very good. The

94 Chapter 5
second is the estimation of effort, time and cost for the project. This was an accurate estimation.
The third was scheduling the project which defined the timeline with important milestones for the
project. The project manager evaluated this schedule good. The last was risk analysis. This
project did not have a very good risk management plan, because some changes were not
estimated or accurate. This risk related to the customer. In the deployment stage, the customer did
not have good preparation for their staff’s knowledge, facilities and time. This led to a longer
time for software deployment to the customer, with some software functions changed. This led to
increased project costs.
Project outcomes were evaluated in terms of project time, cost, overall success, financial and non
– financial benefits. This project was completed on time but over budget. The budget was
exceeded because of the changes in time required for data collection and deployment. This higher
cost was shared by the customer so it did not influence the financial benefits of the project. This
project was successful from the evaluation of the customer and the parent company. However, the
project team was not satisfied with the quality of the delivered software. Although this software
met the customer’s requirements, the project team had expected to produce a better product with
more features. Therefore, they evaluated the results of this project as average. The project
manager indicated that, the project gained some non – financial benefits such as improving the
team’s knowledge and experience in software engineering and applications for hospital
management. This project was a first step to access the market for hospital management software.
This product could be modified for other hospitals.
5.6 FACTORS INFLUENCING THE PLANNING PERFORMANCE
The planning process, performance and project outcomes were described above. This section will
present the influence of human, technical and management factors on the planning performance
and the role of planning to the project outcomes. These influences were evaluated by the project
manager. The reasons of the relationships are also explained.
For the human factor, the project manager had a high appreciation of the role of customer
involvement. In this project although the customer had close contact and support from the project

Case Study of the Financing and Promoting Technology Corporation 95
team, their lack of knowledge and poor preparation in deployment limited the project results. The
role of project manager was important to produce a good plan, especially when the client
company did not set up management processes, or other related procedures. The project manager
should be flexible in deciding what processes could be applied in his project and to adapt to the
characteristics of each project. The effort that the project manager spent for planning also shows
commitment to the project. The project manager spent much of his effort to produce the plan. The
project manager was very experienced in the estimation of cost, time and effort for the project.
The project manager identified the parameters for the estimation. Techniques were used only to
facilitate this calculation.
The project manager also confirmed the relationship between team member’s knowledge and
experience in the analysis of requirements and for system development and planning. This
influence however, was less important than customer involvement and project manager effort and
experience. In this project, the project manager also defined the main requirements and product
specifications. In a small project like this, the project manager was involved in both management
and technical tasks. He took the main responsibility for defining the customer’s requirement and
product specification. The team members involved mainly in coding stage. For this reason the
project manager of this project evaluated the factor of team member’s knowledge and experience
in requirement analysis and system development in planning as not very important.
This project applied some methods and techniques of project management and system
development that were designed by the parent company – FPT Software. These methods and
techniques were considered very appropriate by the evaluation of the project manager. However,
he did not rank applying technical methods as an important factor influencing the planning. There
were two reasons. Firstly, FPT – Software has designed processes, and procedures for project
management, and quality assurance and they should be applied for every project of the company.
In FPT Software, all projects regardless of failure or success have the same management process.
Secondly, there are no good or bad methods, but only appropriate or inappropriate application.
The selection of methods for projects, like system development or life cycle method depends on
the project manager’s knowledge and experiences. In some cases, it could depend on the
customer.
96 Chapter 5
In the management factors, management support is important for a good plan. In this project, only
top – down support was mentioned. The functional departments of FPT – Software were not
involved in the planning. According to the project manager, management support was very
necessary especially when the company has many parallel projects. However, in software
companies, projects made to the customer’s order are a major business, these projects usually get
the high support from their managers.
The project manager of this project however ranked setting the project goal and scope as more
important than management support. The objectives were set by the project team and the
customer will decide the outcomes are expected. In this project, there were few conflicts between
the project team and customer goals. The project team wanted to deliver the best quality products
(in the project team’s view) while the customer needed an acceptable product (in the customer’s
view) in the planned time. The result is the project team accepted the elimination of some
software features, and increased costs so the project could match planned time.
The two final management factors were the availability of resources and management styles. The
availability of resources was evaluated as unimportant. This was because this project was small,
using the human resource available for this project did not conflict with other projects of the
parent company. Other resources like finance, facilities were not constraints for the project. The
project manager received all resources required for the project. Concerning management style,
the project manager did not have a consistent style to manage his project. He just followed the
project management procedures of the company. Moreover, this project had only seven members
(in the peak stage), and managing project was not too complicated. The project manager did not
indicate any the relationship between management style and planning performance. In general,
the project manager followed a task – oriented style to manage the team.
The role of planning was very important to project outcomes in the project manager’s evaluation.
It provides the framework for project implementation. In this project, every project activity, the
assignment of team members, timelines, and important milestones were defined. The changes
were also estimated. Although, there were some changes in the actual implementation, but the
plan was reviewed frequently to update the plan.

Case Study of the Financing and Promoting Technology Corporation 97
5.7 SUMMARY
In this chapter, the planning activities of an FPT project of hospital administration software made
to order of a hospital in HCM City has been described. This is small project with only 7
developers and was developed in 18 months. By following the management process and quality
assurance system of FPT Corporation the plan of this project was done very professionally. The
main problem of this project was the risks related to the changing requirements of the customer,
this led to an increased cost of 140%. The plan was good in terms of defining requirements and
product specifications, estimation of effort, and scheduling. Risk analysis was not accurate. This
project was evaluated as successful by the customer, but the project team was not satisfied
because it was over budget and it had insufficient product features compared to their
expectations. In this project, the role of project manager’s experience and effort, customer
involvement and setting project goal and scope were very important. The next important factors
were management support and team member’s knowledge and experience. Applying technical
methods, the availability of resource, and management styles were not important. The project
manager also emphasized the role of planning in the success of a project. This case study helps to
increase the understanding of the planning process in practice and the relationships between
factors in planning as well as between planning and project outcomes.

98 Chapter 5
99
6
SOFTWARE PROJECT MANAGEMENT IN
VIETNAM – DESCRIPTIVE RESULTS
6.1 INTRODUCTION....................................................................................................... 99
6.2 SAMPLE ...................................................................................................................... 99
6.3 THE CURRENT STATUS OF SOFTWARE PROJECT MANAGEMENT ............ 100
6.3.1 Team Management .................................................................................... 101
6.3.2 Planning (including time management and risk estimation) ..................... 103
6.3.3 Quality Management ................................................................................. 104
6.4 COMMON PROBLEMS OF SOFTWARE PROJECT MANAGEMENT ............... 105
6.5 EVALUATION CRITERIA AND SUCCESS FACTORS........................................ 105
6.6 CONCLUSIONS ........................................................................................................ 107
6.1 INTRODUCTION
An exploratory research was conducted to provide an overview of project management in
software companies in HCM City. This chapter is to present the current status of project
management practices and to identify the key criteria that project managers use for project
evaluation and the factors influencing project success. The chapter concludes with a
general summary of all findings and suggestions for a further in – depth research.
6.2 SAMPLE
All companies in the sample were operating in software business, most (43) were in
Hochiminh city, the 3 remaining companies operated in Hanoi and Cantho. They produce
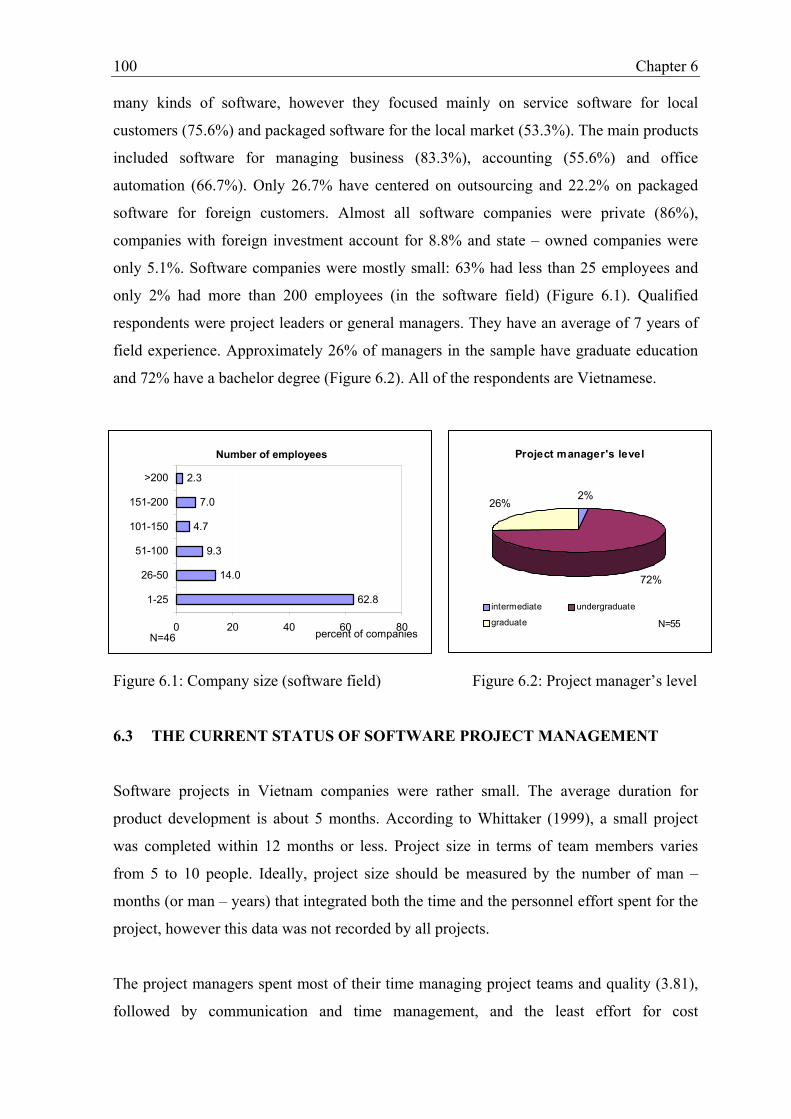
100 Chapter 6
many kinds of software, however they focused mainly on service software for local
customers (75.6%) and packaged software for the local market (53.3%). The main products
included software for managing business (83.3%), accounting (55.6%) and office
automation (66.7%). Only 26.7% have centered on outsourcing and 22.2% on packaged
software for foreign customers. Almost all software companies were private (86%),
companies with foreign investment account for 8.8% and state – owned companies were
only 5.1%. Software companies were mostly small: 63% had less than 25 employees and
only 2% had more than 200 employees (in the software field) (Figure 6.1). Qualified
respondents were project leaders or general managers. They have an average of 7 years of
field experience. Approximately 26% of managers in the sample have graduate education
and 72% have a bachelor degree (Figure 6.2). All of the respondents are Vietnamese.
Figure 6.1: Company size (software field) Figure 6.2: Project manager’s level
6.3 THE CURRENT STATUS OF SOFTWARE PROJECT MANAGEMENT
Software projects in Vietnam companies were rather small. The average duration for
product development is about 5 months. According to Whittaker (1999), a small project
was completed within 12 months or less. Project size in terms of team members varies
from 5 to 10 people. Ideally, project size should be measured by the number of man –
months (or man – years) that integrated both the time and the personnel effort spent for the
project, however this data was not recorded by all projects.
The project managers spent most of their time managing project teams and quality (3.81),
followed by communication and time management, and the least effort for cost
Number of employees
62.8
14.0
9.3
4.7
7.0
2.3
0 20 40 60 80
1-25
26-50
51-100
101-150
151-200
>200
percent of companiesN=46
Project manager's level
2%
72%
26%
intermediate undergraduate
graduate N=55

Software Project Management in Vietnam – Descriptive Results 101
management (2.43). In the next section managing the team, quality, time and risk in the
software projects are discussed.
34.1
56.8
9.1
0.0
10.0
20.0
30.0
40.0
50.0
60.0
< 3 months 3 - 6 months 9 - 12 months
Project Duration
%
Figure 6.3: Project duration
6.3.1 Team Management
In personnel management, measuring productivity provides the base for evaluation and the
motivation of employees. However, only 48% of software companies have measured
productivity, and the most commonly used indicator is the Function point (FP)1/ man-
month. The Table 6.1 presents indicators used for productivity measurement in software
companies.
For evaluating a programmer’s performance, the emphasis was on productivity. However,
only a few respondents could provide concrete figures. The most common indicator used
for productivity measurement was FP/ man - month. Some companies have used the
average revenue per employee as an indicator to measure productivity. However, most
companies either do not disclose their revenue or could not separate this figure only for
software products. Therefore, the productivity of Vietnamese programmers can not be
indicated by this indicator.
1 Function point (FP) metric is composed of the weighted totals of five external aspects of software
application, namely inputs, outputs, logical files, inquiries, interfaces (Jones, 1998)

102 Chapter 6
Table 6.1: Productivity indicators used in software companies
Productivity indicators Frequency Percentage/
total cases
Percentage/ measured
productivity cases
KLOC 2/ man-month 4 8.7 18.2
Defects/ KLOC 2 4.3 9.1
Errors/ man-month 5 10.9 22.7
FP/man-month 11 23.9 50.0
Defects/ FP 8 17.4 36.4
Others 5 10.9 22.7
Most project managers had technical backgrounds without much management competence.
Software companies did not pay attention to training in project management: 30% of the
companies have no training in project management for their employees, and about 54%
organized short term training, only 1 – 2 times per year. This creates many of the problems
in project management. The evaluation of project personnel was done by the project
manager based on comparison of work requirements. Approximately 60% evaluated the
level of project management competence of managers in their company as average or
below. However, cooperation between team members received a better assessment, more
than 60% evaluated the coordination of developers in project team as good or very good
(Figure 6.4).
Evaluation of Project personnel
0 20 40 60 80 100
Project & Team mgtcapability
Coordination inproject team
percent of respondents
bad
average
good
very good
N = 55
2 KLOC: thousand line of code
Figure 6.4: Project personnel evaluation

Software Project Management in Vietnam – Descriptive Results 103
6.3.2 Planning (including time management and risk estimation)
According to Whittaker (1999), planning can be considered in two aspects, project
planning and risk estimation. The findings of this study indicates that about 65% of
projects always consider risks in the planning stage, and only 4% projects have never
considered risks. This means that estimating risk was considered important in software
companies. Risks seem to be minimal in these projects except for the risk of changing
requirements of customers. The frequency of risks in software project is presented in
Figure 6.5. This result shows that changing requirements from the customer is most
common problem faced by projects. The next risk is poor communication with customers.
This finding implies the risks of project usually coming from outside are difficult to
control. Therefore, the project managers should treat the problem of customer’s
requirements as a key activity of the software project and build this into their project
management methodology.
For project planning, estimation of cost and time and techniques used for time management
in the planning stage are considered. Only 22% of the projects used specialized software
for estimating time and cost, most projects (95%) were based on experiences. Only 15% of
the projects did not use any planning technique. Approximately 73% of projects have used
MS Project software for project planning. This ratio was 80% reported in White and
Fortune (2002). However a simple tool such as the Gantt chart was not in common use
(only applied in 47% projects).
Risks in software projects
0 20 40 60 80 100
Customer change
Poor communication
Technical complexity
Need more resources
Project team problems
Others
percent of respondents
very often
often
average
rarely
never
N = 55
Figure 6.5: Risks in software projects

104 Chapter 6
6.3.3 Quality Management
A quality management system is an issue that many project managers mentioned. 50% of
software companies have not yet applied a quality management system. About 32% of
companies applied the quality management system of ISO 9000 (however not all certified);
and 17.4% followed the Capability Maturity Model (CMM). The reason for preferring the
ISO quality system is that it has international recognition in Vietnam. 80% of the project
managers knew the ISO 9000 system; 56% recognized CMM but only 20% knew about
TQM in the software industry.
Although half of the project managers said their company has applied ISO or CMM for
quality but they still agreed that now they need a quality management system. This
indicates that they may not be satisfied with their current quality approach. Graham (1994)
stated that small companies are in a relatively disadvantaged position for obtaining ISO
certification because of limited resources. Few project leaders indicated that with a small
scale, the current quality systems are not appropriate to their company. However, the in –
depth interview showed that many project managers disagree with this idea. They think
software quality does not only depend on the programmer’s capability, but the quality
control system. This confirms the necessity of a quality management system. The project
managers’ ideas are indicated in Table 6.2.
Table 6.2: Quality management system
Ideas Agree Disagree
My company now needs a quality management
systems
69.2% 9.6%
Current quality management systems in the world are
not suitable to small software companies in Vietnam
24.5% 51%
Software quality mainly depends on programmer’s
capability
22.2 % 50%
According to Yang (2001), most people based their estimates of a software product’s
quality on its functionality and the design of its user interface. This finding confirmed this
view. Software reliability is considered an important attribute by 95% of the respondents,

Software Project Management in Vietnam – Descriptive Results 105
followed by user efficiency (90%). The remaining attributes such as modifiability and
portability are considered not very important for software products.
6.4 COMMON PROBLEMS OF SOFTWARE PROJECT MANAGEMENT
The common problems addressed in this analysis confirmed the results of a study of
Thayer, Pyster and Wood (1981). Two additional problems mentioned by interviewees in
the pilot survey are considered. The results indicate that poor project planning is still a
common problem in software companies. Lack of knowledge in related business fields is
also another important problem, for example, programmers with no experience in
producing software for accounting, banking or management applications. The responses
are presented in Figure 6.6.
Additional items concerning poor knowledge in related field and lack of software contracts
to gain experience in project management were added to the survey after the pilot study
was conducted. However this issue did not have much agreement among respondents.
Their ideas were also very different. With project managers in the large software
companies, the lack of software contracts was a problem unlike the small companies.
Common problems in software project management
0 20 40 60 80 100
Poor estimating and project planning
Poor knowledge in related filed andpoor communication with customer
Lack of quality standards andmeasures
Poor knowledge in decision making
Lack of contracts
percent of respondents
very agree
agreeneutral
disagreevery disagree
N = 55
6.5 EVALUATION CRITERIA AND SUCCESS FACTORS
About 58% of projects were evaluated as completed on time, within budget and satisfying
quality requirements. These results are lower if the project size is larger (Jones, 1999). The
Figure 6.6: Common problems in software projects
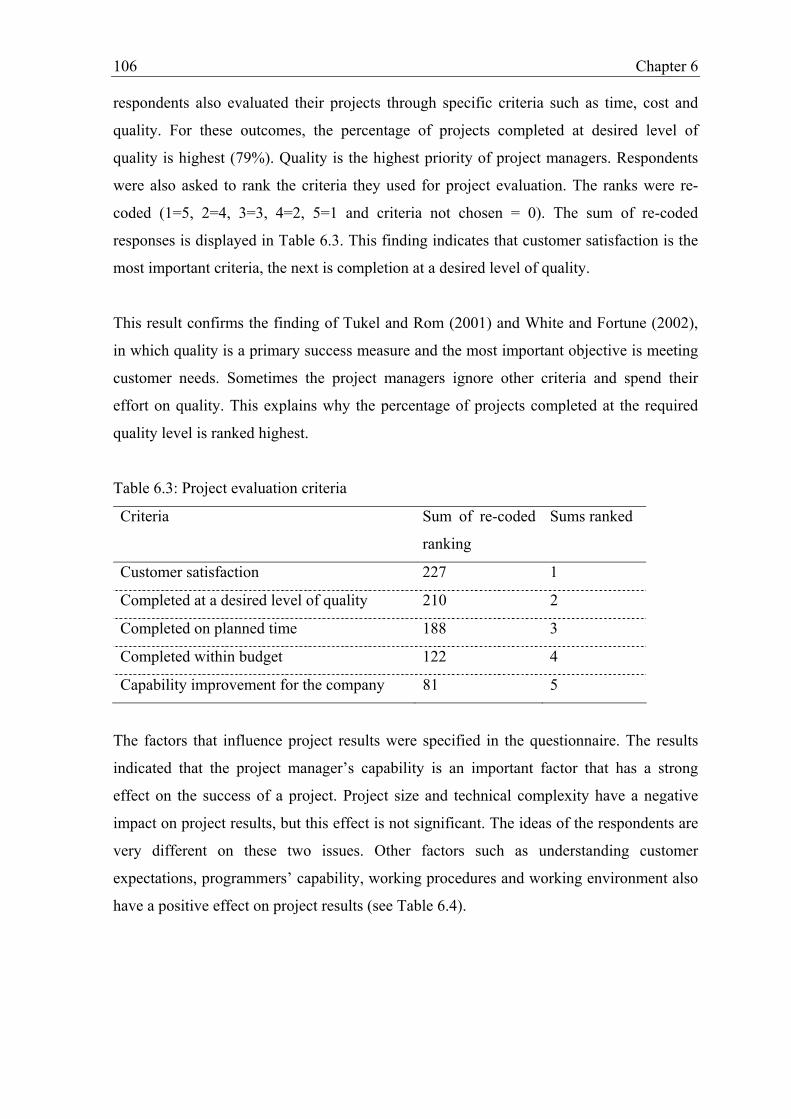
106 Chapter 6
respondents also evaluated their projects through specific criteria such as time, cost and
quality. For these outcomes, the percentage of projects completed at desired level of
quality is highest (79%). Quality is the highest priority of project managers. Respondents
were also asked to rank the criteria they used for project evaluation. The ranks were re-
coded (1=5, 2=4, 3=3, 4=2, 5=1 and criteria not chosen = 0). The sum of re-coded
responses is displayed in Table 6.3. This finding indicates that customer satisfaction is the
most important criteria, the next is completion at a desired level of quality.
This result confirms the finding of Tukel and Rom (2001) and White and Fortune (2002),
in which quality is a primary success measure and the most important objective is meeting
customer needs. Sometimes the project managers ignore other criteria and spend their
effort on quality. This explains why the percentage of projects completed at the required
quality level is ranked highest.
Table 6.3: Project evaluation criteria
Criteria Sum of re-coded
ranking
Sums ranked
Customer satisfaction 227 1
Completed at a desired level of quality 210 2
Completed on planned time 188 3
Completed within budget 122 4
Capability improvement for the company 81 5
The factors that influence project results were specified in the questionnaire. The results
indicated that the project manager’s capability is an important factor that has a strong
effect on the success of a project. Project size and technical complexity have a negative
impact on project results, but this effect is not significant. The ideas of the respondents are
very different on these two issues. Other factors such as understanding customer
expectations, programmers’ capability, working procedures and working environment also
have a positive effect on project results (see Table 6.4).
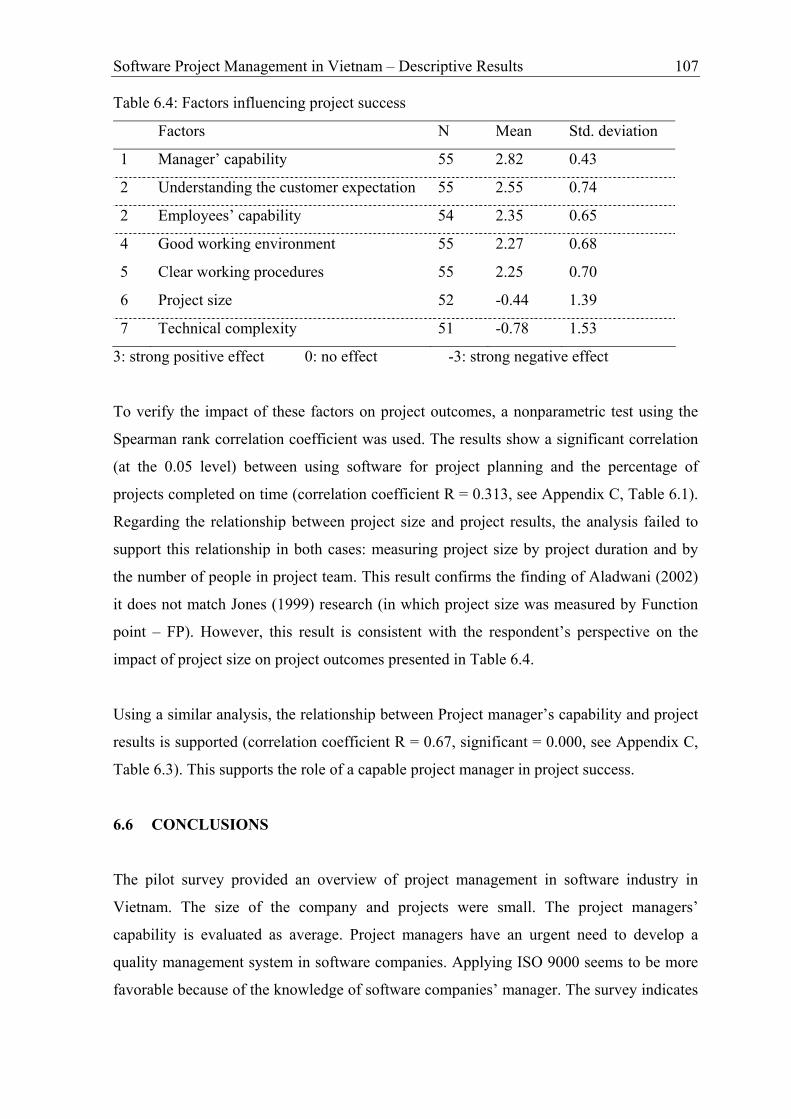
Software Project Management in Vietnam – Descriptive Results 107
Table 6.4: Factors influencing project success
Factors N Mean Std. deviation
1 Manager’ capability 55 2.82 0.43
2 Understanding the customer expectation 55 2.55 0.74
2 Employees’ capability 54 2.35 0.65
4 Good working environment 55 2.27 0.68
5 Clear working procedures 55 2.25 0.70
6 Project size 52 -0.44 1.39
7 Technical complexity 51 -0.78 1.53
3: strong positive effect 0: no effect -3: strong negative effect
To verify the impact of these factors on project outcomes, a nonparametric test using the
Spearman rank correlation coefficient was used. The results show a significant correlation
(at the 0.05 level) between using software for project planning and the percentage of
projects completed on time (correlation coefficient R = 0.313, see Appendix C, Table 6.1).
Regarding the relationship between project size and project results, the analysis failed to
support this relationship in both cases: measuring project size by project duration and by
the number of people in project team. This result confirms the finding of Aladwani (2002)
it does not match Jones (1999) research (in which project size was measured by Function
point – FP). However, this result is consistent with the respondent’s perspective on the
impact of project size on project outcomes presented in Table 6.4.
Using a similar analysis, the relationship between Project manager’s capability and project
results is supported (correlation coefficient R = 0.67, significant = 0.000, see Appendix C,
Table 6.3). This supports the role of a capable project manager in project success.
6.6 CONCLUSIONS
The pilot survey provided an overview of project management in software industry in
Vietnam. The size of the company and projects were small. The project managers’
capability is evaluated as average. Project managers have an urgent need to develop a
quality management system in software companies. Applying ISO 9000 seems to be more
favorable because of the knowledge of software companies’ manager. The survey indicates

108 Chapter 6
project planning is the main weakness of project managers for these standards. The
findings also clearly demonstrate the importance of project management in the success of
software projects. The characteristics of a project as project size, technical complexity have
no impact on project result. However the human factors, especially role of project manager
is critical to the success of a project. In regard to evaluation criteria, the most important
objective for project managers is to fully satisfy the customer. They also focus on quality
rather than meet the targets of time and budget. From a managerial point of view, the
research findings underscore the need to develop a quality management system in software
companies; and to improve the capability of project managers for better planning and
project success.

109
7
DESCRIPTIVE ANALYSIS OF THE SURVEY
ON PLANNING IN SOFTWARE PROJECT
MANAGEMENT
7.1 INTRODUCTION ........................................................................................................ 110
7.2 SAMPLE DEMOGRAPHICS ...................................................................................... 110
7.3 REPRESENTATIVE OF THE SAMPLE .................................................................... 112
7.4 SOFTWARE PROJECT CHARACTERISTICS.......................................................... 116
7.4.1 Project Types ....................................................................................................... 116
7.4.2 Project Cost And Duration .................................................................................. 116
7.5 PEOPLE FACTORS IN PLANNING .......................................................................... 119
7.5.1 Customers ............................................................................................................ 119
7.5.2 Project Managers ................................................................................................. 120
7.5.3 Project Team Members........................................................................................ 122
7.6 TECHNICAL FACTORS IN PLANNING .................................................................. 122
7.6.1 Project Management Methods............................................................................. 123
7.6.2 System Development Methods............................................................................ 124
7.6.3 Life-cycle Methods.............................................................................................. 125
7.7 MANAGEMENT APPROACH ................................................................................... 126
7.7.1 Management Supports ......................................................................................... 127
7.7.2 Defining Objectives And Scope .......................................................................... 127
7.7.3 Communication Methods .................................................................................... 128
7.7.4 Resource Availability .......................................................................................... 130
7.7.5 Management Styles ............................................................................................. 130
7.8 PLANNING PERFORMANCE AND PROJECT OUTCOMES................................. 131

110 Chapter 7
7.9 SUMMARY.................................................................................................................. 133
7.1 INTRODUCTION
This chapter presents the initial results of this survey – the descriptive statistics of planning in
software projects. It begins with the sample demographics of the study. Next, the planning
approaches in software projects are described through summarizing personnel, technical and
management factors. This is followed by an assessment of planning performance and the
outcomes. The last section is a summary of the key points.
7.2 SAMPLE DEMOGRAPHICS
In term of ownership, 58.5 % are local private or joint- stock companies; 29.2% are foreign
investors and the rest (12.3%) are state-owned. Software companies in Vietnam are mostly
young and small. 61% have been established within 1- 5 years, 27% from 6 – 10 years, and
only 4% were established more than 15 years (see Figure 7.1 and 7.2). 44% are small
companies having less than 20 employees. Only 10% have more than 140 employees.
The most prevalent software products are applications in Finance & Accounting (62.5%) and
for Commercial and Services (58%). Other software applications are for Education and
Training (45%), Government administration (45%), Telecommunication (34.4%) and
Manufacturing (36%). Very few companies have developed software in the engineering area
such as software for construction or specific sectors (see Figure 7.3). Only 7.8% of companies
are specialized in one field. Most companies produce software for 2 – 4 areas of application
(64%).
Most also produce software for both local and foreign clients. The major international clients
are in North America (36%) and Europe (36%). An interesting future international market is
Japan. In the local market, products are developed mainly for private companies (79.5%) and
government organizations (70.5%) (see Figure 7.4).

Descriptive Analysis of the Survey on Planning in Software Project Management 111
Figure 7.1: Ownership of software companies
Age of Software companies
61
28
92
0
10
20
30
40
50
60
70
1 - 5 years 6 - 10 years 10 - 15 years > 15 years
%
Figure 7.2: Age of software companies
Software products of software companies
6358
4536 34
28 2516 16 14 11
20
10203040506070
Fina
nce
&A
ccou
ntin
g
Com
mer
cial
&Se
rvic
e
Gov
ernm
ent
adm
inis
tratio
n
Man
ufac
torin
g
Tele
com
mun
icat
ion
Med
icin
Tour
ism
Tran
spor
tatio
n
Educ
atio
n &
Trai
ning
Ente
rtain
men
t
Con
stru
ctio
n
Agr
icul
ture
/Fo
rest
ry &
Sea
food
%
Figure 7.3: Software products of software companies
Local - private/ joint
stock59%
Foreign29%
State-owned12%
Ownership of software companies

112 Chapter 7
Figure 7.4: Clients of software companies
7.3 REPRESENTATIVE OF THE SAMPLE
Although the data was not randomly collected, our sample contains the main chacracteristics
of the population. To examine the representative of sample, the characteristics of the sample
are compared to the background of the population. The information of population background
is based on the reports of The Vietnam Software Industry Development Program 2006 – 2010
prepared by the Post and Telecommunication Ministry (2005) and The Picture of Vietnamese
Software Businesses of Hochiminh Computer Association (Tran L.H., 2005). The sample in
my study was collected from September 2003 to March 2004. The data from those reports was
mainly collected in the year of 2004. Due to the difference of time of data collection is not
very much; the comparison is acceptable.
The background data includes company ownership, size, age and market. This data of the
sample of this study and other sources is presented in Table 7.1
Table 7.1: Background of the sample and other sources
Characteristics Current
Sample
Report of Post and
Telecommunication
Ministry (2005)
Report of Hochiminh
Computer Association
(Tran L.H, 2005)
Ownership
Limited and joint stock Co. 59.0% 86.0 % 77.0%
Foreign 29.0% 8.0 % 17.0%
State owned 12.0% 5.1% 6.0%
Foreign Clients36
6
19
36
05
10152025303540
American(North)
American(South)
Asia Europe
%
Local Clients
7179
38
0
20
40
60
80
100
Government org. Private org. Individuals
%

Descriptive Analysis of the Survey on Planning in Software Project Management 113
Current Sample Report of Post and
Telecommunication Ministry
Report of Tran L.H
(HCA)
Age
1 – 5 years 61% NA ≤ 4 years 54%
6 – 10 years 28% NA 5 – 10 years 32%
11 – 15 years 9% NA 11 – 15 years 11%
> 15 years 2% NA > 15 years 3%
Size (number of employees)
< 40 66.7% <30 86.2% <30 65%
40 – 60 12.7% 30 – 50 5.4% 30 – 50 17%
60 – 100 6.3% 50 – 100 4.8% 50 – 100 6%
≤ 100 85.7% ≤ 100 96.4 ≤ 100 88%
100 – 160 8% NA 100 – 150 6%
> 300 3.5% NA > 300 4%
Oversea market
North American 36% NA American 37%
Europe 36% NA Western Europe 21%
Asia 19% NA Asia 12%
This comparison indicates that except the ownership, the sample characteristics like company
size, age and oversea market are similar to the data from the reports of the Ministry of Post
and Telecommunication and the Hochiminh Computer Association (HCA). Regarding the
ownership of software companies, the ratio of private and joint stock companies in the sample
is lower than in the other sources. The reason could come from the data collection method of
snowball used in current research. The popular companies were accessed first. They are
usually big companies having the ownership of joint stock, state owned and foreign. The
survey network established from these initial interviews, therefore have much relates to such
kind of ownership. This bias does not much influence the research findings because the
analyses do not relate much on the specific kind of ownership.
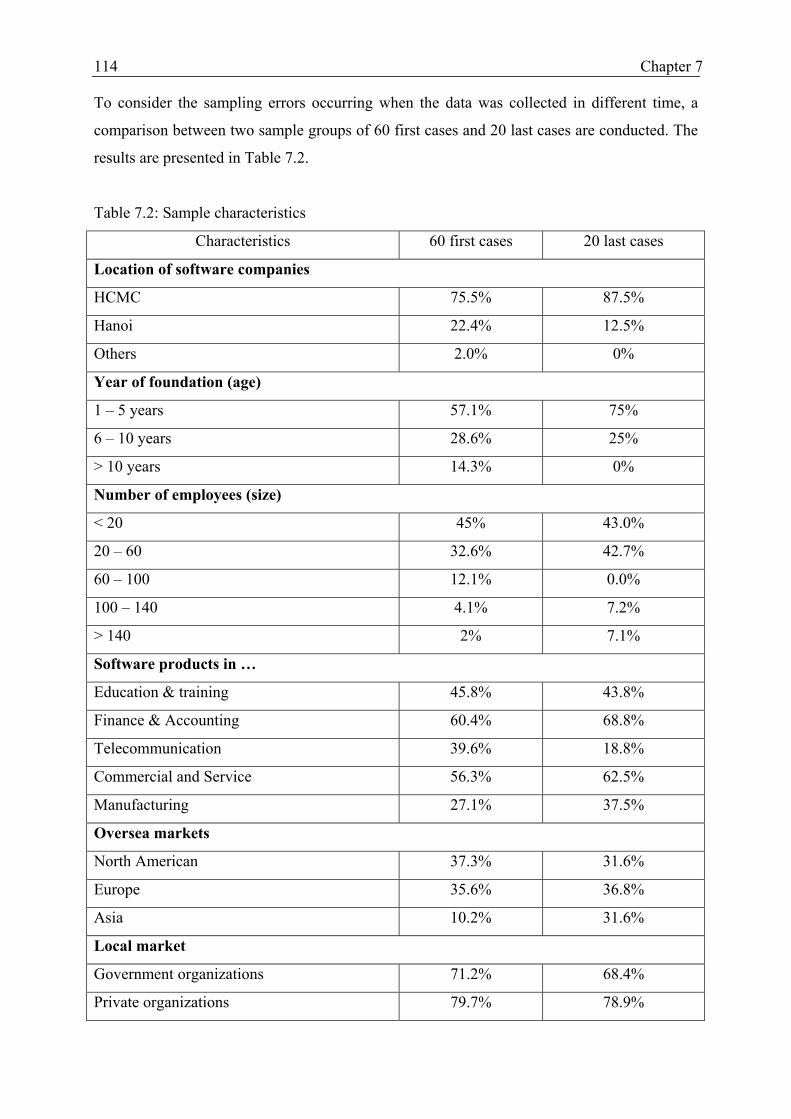
114 Chapter 7
To consider the sampling errors occurring when the data was collected in different time, a
comparison between two sample groups of 60 first cases and 20 last cases are conducted. The
results are presented in Table 7.2.
Table 7.2: Sample characteristics
Characteristics 60 first cases 20 last cases
Location of software companies
HCMC 75.5% 87.5%
Hanoi 22.4% 12.5%
Others 2.0% 0%
Year of foundation (age)
1 – 5 years 57.1% 75%
6 – 10 years 28.6% 25%
> 10 years 14.3% 0%
Number of employees (size)
< 20 45% 43.0%
20 – 60 32.6% 42.7%
60 – 100 12.1% 0.0%
100 – 140 4.1% 7.2%
> 140 2% 7.1%
Software products in …
Education & training 45.8% 43.8%
Finance & Accounting 60.4% 68.8%
Telecommunication 39.6% 18.8%
Commercial and Service 56.3% 62.5%
Manufacturing 27.1% 37.5%
Oversea markets
North American 37.3% 31.6%
Europe 35.6% 36.8%
Asia 10.2% 31.6%
Local market
Government organizations 71.2% 68.4%
Private organizations 79.7% 78.9%

Descriptive Analysis of the Survey on Planning in Software Project Management 115
Individuals 40.7% 31.6%
Type of software projects
Commercial 20.3% 30%
Build to order 53.9% 70%
Outsourcing 16.7% 0%
Project duration
< 6 months 41.7% 45%
6 – 12 months 33.3% 20%
12 – 24 months 18.3% 20%
> 24 months 6.7% 15%
Number of people involved in the projects 9 11
Respondents
Project managers 81.7% 70%
Top managers 11.7% 25%
Team members 6.7% 5%
Project manager experiences (No. of years) 2.9 3.3
The comparisons include software company characteristics (including location, age, size,
software products, client markets) and the project characteristics (including project type,
duration, project size in term of number of project staffs) and the respondents. The results in
Table 7.2 indicates only few big different between these sample groups, such as the company
age. In the group of last 20 cases, the ratio of young companies (less than 5 years) is higher
than in the group of first 60 cases. There is not outsourcing projects in the sample group of 20
last cases while this ratio of first 60 cases is 16.7%. These differences indicate that, the sample
collected in different time has few differences in sample structure. However, it cans still
conclude that, the sample in this study represents to the population.
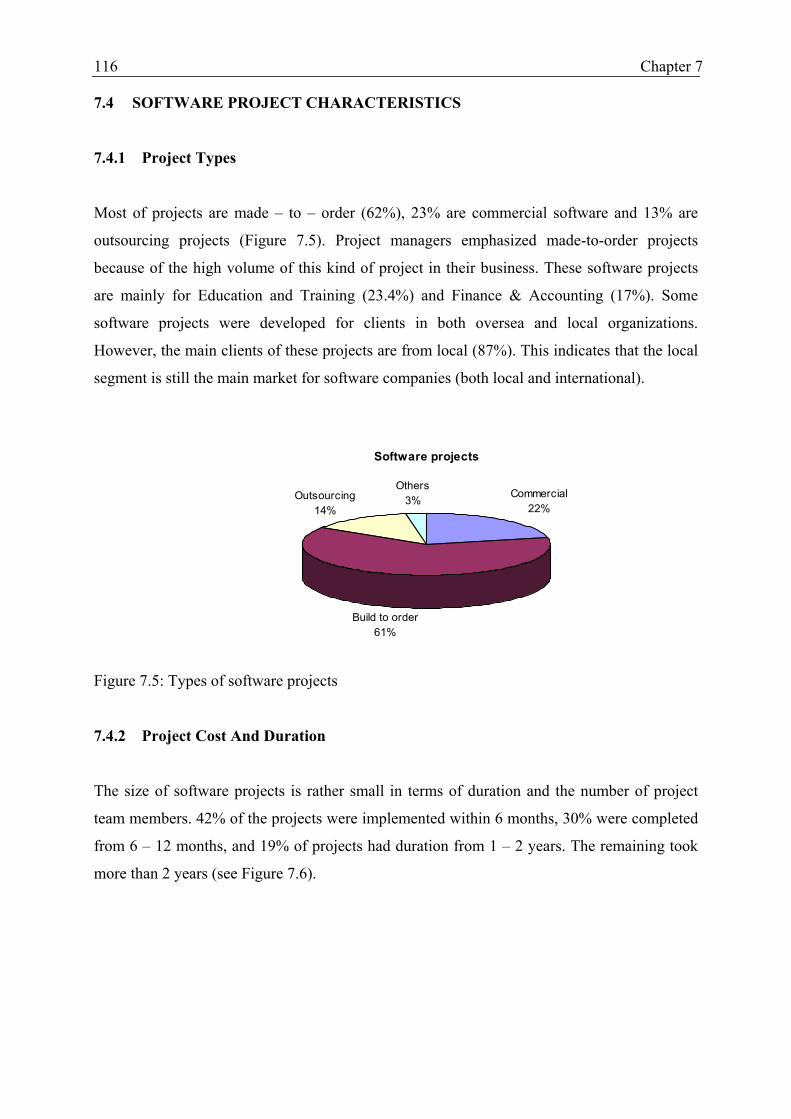
116 Chapter 7
7.4 SOFTWARE PROJECT CHARACTERISTICS
7.4.1 Project Types
Most of projects are made – to – order (62%), 23% are commercial software and 13% are
outsourcing projects (Figure 7.5). Project managers emphasized made-to-order projects
because of the high volume of this kind of project in their business. These software projects
are mainly for Education and Training (23.4%) and Finance & Accounting (17%). Some
software projects were developed for clients in both oversea and local organizations.
However, the main clients of these projects are from local (87%). This indicates that the local
segment is still the main market for software companies (both local and international).
Figure 7.5: Types of software projects
7.4.2 Project Cost And Duration
The size of software projects is rather small in terms of duration and the number of project
team members. 42% of the projects were implemented within 6 months, 30% were completed
from 6 – 12 months, and 19% of projects had duration from 1 – 2 years. The remaining took
more than 2 years (see Figure 7.6).
Software projects
Build to order61%
Others3% Commercial
22%Outsourcing
14%

Descriptive Analysis of the Survey on Planning in Software Project Management 117
Project duration
11
31
20
10 118 9
0
5
10
15
20
25
30
35
< 3 months 3 - <6months
6 - <9months
9 - <12months
12 - <18months
18 - <2years
≥2 years
%
Figure 7.6: Project duration
Regarding the actual costs of a software project, most projects were controlled somewhat
well. About 64% projects did not exceed their initial budget. Only 7% projects had an actual
cost more than 150% over the planned budget (Figure 7.7).
Actual project costs as compared to initial budget
26
38
17
13
4 3
0
5
10
15
20
25
30
35
40
< 90% 90% - 109% 110% - 129% 130% - 149% 150 - 199% ≥200%
%
Figure 7.7: Actual project cost as compared to initial budget
The human resource involvement during different stages of software development in these
projects is described Figure 7.8. The number of people involved in the project team is shown
in Table 7.3.
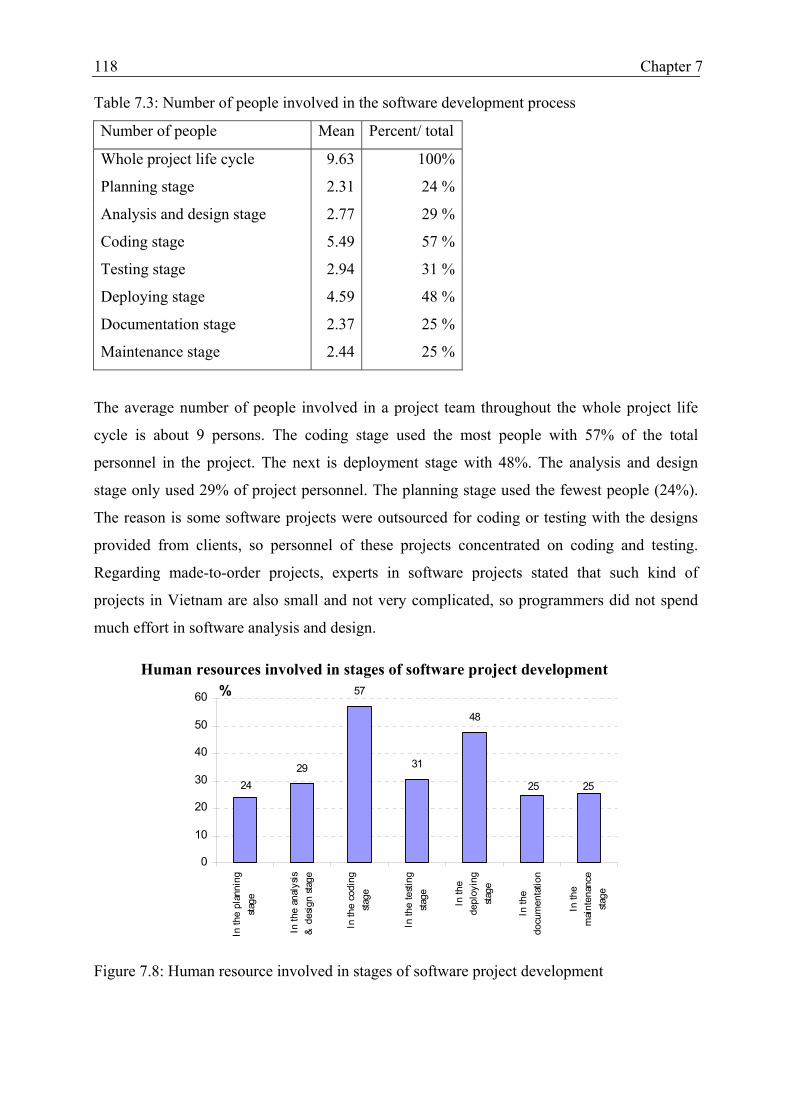
118 Chapter 7
Table 7.3: Number of people involved in the software development process
Number of people Mean Percent/ total
Whole project life cycle 9.63 100%
Planning stage 2.31 24 %
Analysis and design stage 2.77 29 %
Coding stage 5.49 57 %
Testing stage 2.94 31 %
Deploying stage 4.59 48 %
Documentation stage 2.37 25 %
Maintenance stage 2.44 25 %
The average number of people involved in a project team throughout the whole project life
cycle is about 9 persons. The coding stage used the most people with 57% of the total
personnel in the project. The next is deployment stage with 48%. The analysis and design
stage only used 29% of project personnel. The planning stage used the fewest people (24%).
The reason is some software projects were outsourced for coding or testing with the designs
provided from clients, so personnel of these projects concentrated on coding and testing.
Regarding made-to-order projects, experts in software projects stated that such kind of
projects in Vietnam are also small and not very complicated, so programmers did not spend
much effort in software analysis and design.
29
57
31
48
252524
0
10
20
30
40
50
60
In th
e pl
anni
ngsta
ge
In th
e an
alys
is&
des
ign
stage
In th
e co
ding
stage
In th
e te
sting
stage In th
ede
ploy
ing
stage
In th
edo
cum
enta
tion
In th
em
aint
enan
cesta
ge
%
Figure 7.8: Human resource involved in stages of software project development
Human resources involved in stages of software project development

Descriptive Analysis of the Survey on Planning in Software Project Management 119
7.5 PEOPLE FACTORS IN PLANNING
Human resources in software project planning include the project managers, team members
and customers. The general characteristics of human factors related to planning are presented
in Table 7.4.
Table 7.4 Human factors in planning
Items N Means Std. Deviation
Project manager experience (in years) 64 2.99 1.70
Project manager experience (in number of projects) 80 6.11 5.05
Role of experience of Project manager (*) 80 3.71 .62
Project manager effort (*) 80 3.70 .66
Technical ability - team members (*) 80 3.59 .64
Customer involvement (*) 80 3.70 .74
(*) Highest score is 5
7.5.1 Customers
The involvement of the customer in the early stages of software development process has a
major effect on capturing their requirements, especially in the case of software made to order.
For commercial software, the involvement of the customer is less and the project team
sometimes interprets the needs of users. They put themselves into the perspective of users to
identify the customer requirements, especially related to software for individual use like
electronic dictionaries, games.
The results in Figure 7.9 indicate that, 59% projects had high customer involvement in
planning, only 3% evaluated it as low. The project managers (through in – depth interviews)
explained that the customers of these projects don’t have much knowledge about software
engineering and they could not visualize how the software will work. Customer involvement
in the software development process (except for the commercial software projects) is through
assigning a representative person or a group to participate with the project team. The high
involvement of customers was confirmed through the level of participation of the functional
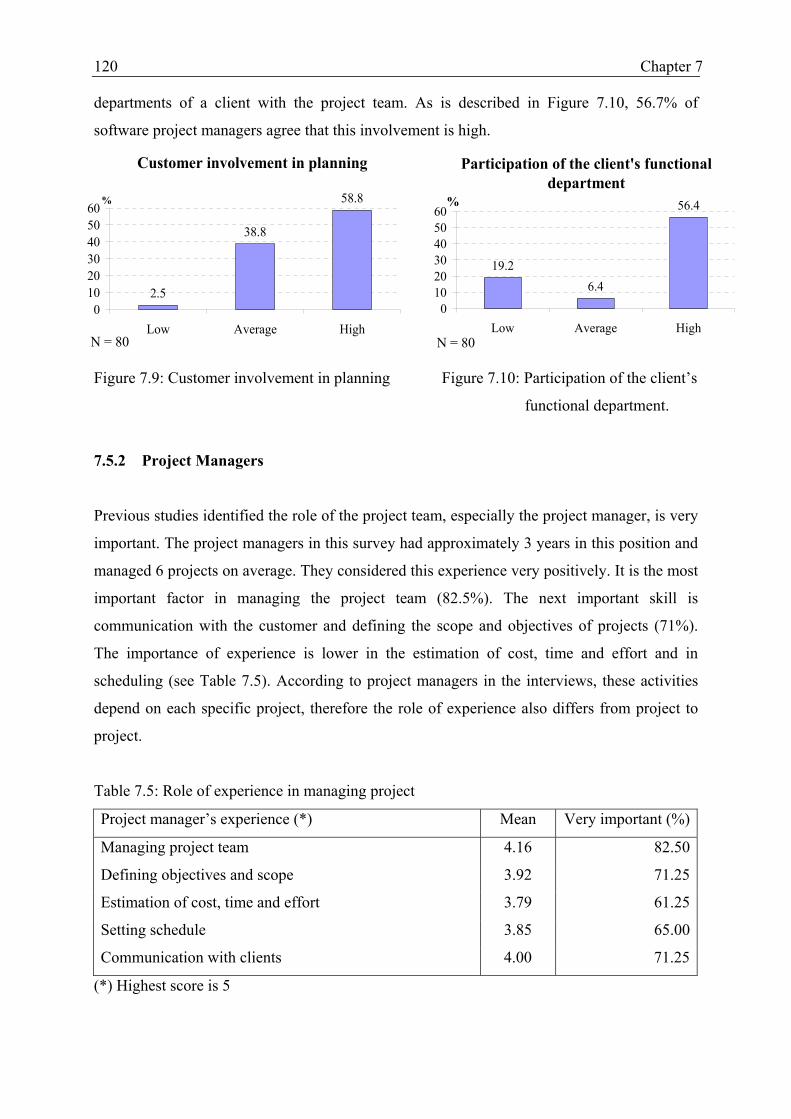
120 Chapter 7
departments of a client with the project team. As is described in Figure 7.10, 56.7% of
software project managers agree that this involvement is high.
Figure 7.9: Customer involvement in planning Figure 7.10: Participation of the client’s
functional department.
7.5.2 Project Managers
Previous studies identified the role of the project team, especially the project manager, is very
important. The project managers in this survey had approximately 3 years in this position and
managed 6 projects on average. They considered this experience very positively. It is the most
important factor in managing the project team (82.5%). The next important skill is
communication with the customer and defining the scope and objectives of projects (71%).
The importance of experience is lower in the estimation of cost, time and effort and in
scheduling (see Table 7.5). According to project managers in the interviews, these activities
depend on each specific project, therefore the role of experience also differs from project to
project.
Table 7.5: Role of experience in managing project
Project manager’s experience (*) Mean Very important (%)
Managing project team 4.16 82.50
Defining objectives and scope 3.92 71.25
Estimation of cost, time and effort 3.79 61.25
Setting schedule 3.85 65.00
Communication with clients 4.00 71.25
(*) Highest score is 5
Participation of the client's functional department
19.26.4
56.4
0102030405060
Low Average HighN = 80
%
Customer involvement in planning
2.5
38.8
58.8
0102030405060
Low Average HighN = 80
%

Descriptive Analysis of the Survey on Planning in Software Project Management 121
Regarding effort of project managers, 59% said that they spent more effort for this project
than others. With greater effort, they have better control of specifications. 60% evaluated their
level of control on specifications is high while only 1.3 % said that it is low (see Figure 7.11
and 7.12). Controlling the specifications of the software product is important for planning.
With higher control the project manager can easier to estimate the cost and assign works. The
effort of the project manager in planning is more important than in other stages. In the
planning stage, project managers take the main responsibility to establish and plan the project.
The relationship between the project manager’s efforts and planning performance will be
analyzed in Chapter Nine.
Project managers's effort for project
3.8
37.5
58.8
0
10
20
30
40
50
60
70
Lower effort than otherprojects
Similar effort likes otherprojects
Higher effort than otherprojects
%
Figure 7.11: Project manager’s effort for project
Level of specification control
1.3
38.8
60.0
0.0
10.0
20.0
30.0
40.0
50.0
60.0
70.0
Low control Average control High control
%
Figure 7.12: Level of specification control

122 Chapter 7
7.5.3 Project Team Members
Project team members are selected based on their ability and commitment to the project. Their
knowledge in system development and the definition of requirements is average (3.28 with 5
as very high). Only about 6% of the projects had a project team with very high ability. The
experience of the project team is also average (3.6). Only 10% of the projects indicated that
the project team has a very high level of experience in system development and requirements
definition. Although the necessary knowledge and experience of team members for planning
is evaluated as only average, their commitment and persistence during this stage is good (70%
of projects indicate this level) (see Figure 7.13). In the planning stage, it is uncertain whether
the projects will be accepted, the high commitment of project team could improve the success
potential of the project.
Team member ability and attitude
12 4 1
54
4129
3455
70
0102030405060708090
100
Knowlegde in sys. dev.& req. definition
Exp. with sys. dev. &req. definition
Commitment &Persistence
%
Low Average High Figure 7.13: Team member ability and attitude
7.6 TECHNICAL FACTORS IN PLANNING
Three kinds of methods in software project development are surveyed, including project
management, system development and life-cycle. The application of these methods in
software projects is presented in Table 7.6.

Descriptive Analysis of the Survey on Planning in Software Project Management 123
Table 7.6 Applying methods and tools in software projects
Items N Means (*) Std. Deviation
Apply project management methods 80 .55 .50
Using software for project management 79 .66 .48
Apply system development method 79 .95 .22
Tools or techniques for system development 80 .36 .48
Apply life – cycle method 80 .65 .48
(*) 1= Yes, 0 = No
7.6.1 Project Management Methods
62% projects have applied various project management methods. These methods are
borrowed from foreign software companies (55%). Some of these methods are the Rational
Unified Process (RUP) and Rational Rose. These methods were designed by Rational, a
software development company in the USA. The Rational Unified Process is a software
engineering process. It provides a disciplined approach to assign tasks and responsibilities
within a development organization. Its goal is to ensure the production of high-quality
software that meets the needs of its end-users, within a predictable schedule and budget.
These approaches usually apply in the popular local or foreign companies like Financing and
Promoting Technology (FPT), CMC, Tuong Minh Association (TMA) or Global EIS. The
details of these are given in Appendix B2. In FPT - the biggest local software company – a
project management procedure was designed based on RUP.
Regarding project management methods, only half the projects applied a particular method.
41% of which have developed that method by themselves. 66% have applied different
software and tools to support project management. 94% of these tools come from foreign
companies. Many projects used Microsoft Project Management. A few companies developed
their own software or tools (like the worksheet) for project management, mainly for
scheduling and tracking the project progress. Through interviews, the project managers
indicated two main reasons why they do not apply project management methods. Firstly,
many software companies don’t have a system for managing software development and
quality assurance. Secondly, the available methodologies are not appropriate to the small
projects.
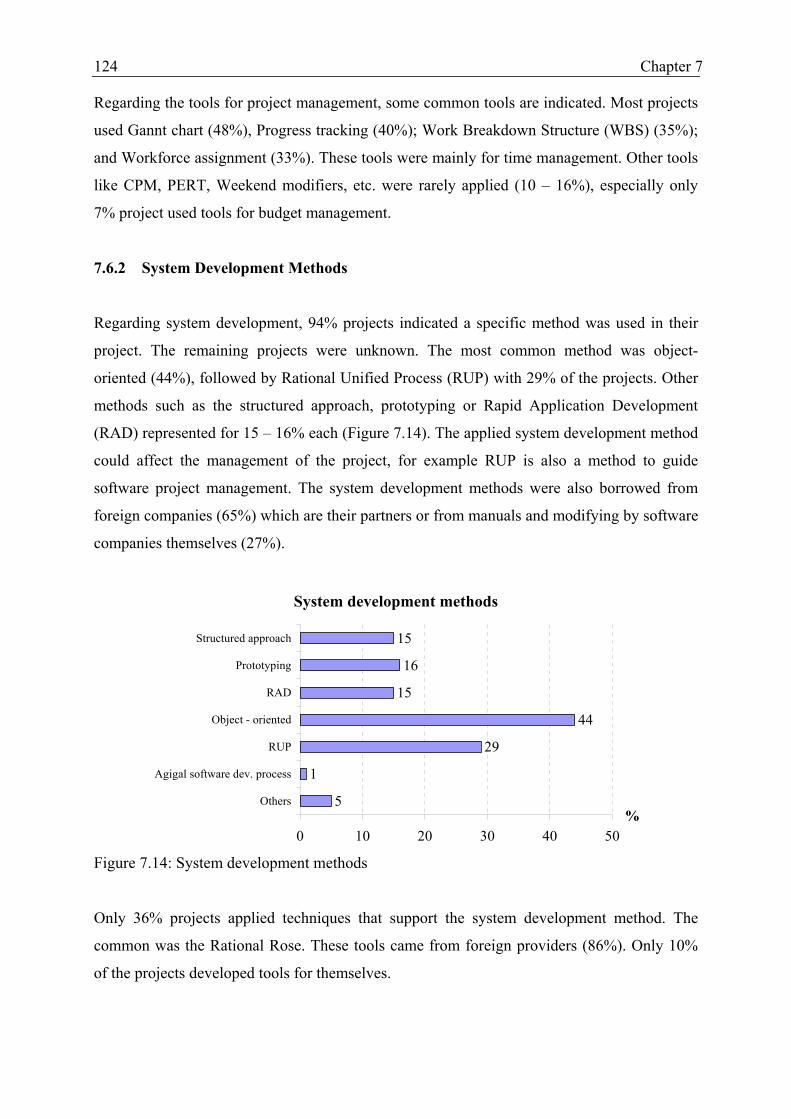
124 Chapter 7
Regarding the tools for project management, some common tools are indicated. Most projects
used Gannt chart (48%), Progress tracking (40%); Work Breakdown Structure (WBS) (35%);
and Workforce assignment (33%). These tools were mainly for time management. Other tools
like CPM, PERT, Weekend modifiers, etc. were rarely applied (10 – 16%), especially only
7% project used tools for budget management.
7.6.2 System Development Methods
Regarding system development, 94% projects indicated a specific method was used in their
project. The remaining projects were unknown. The most common method was object-
oriented (44%), followed by Rational Unified Process (RUP) with 29% of the projects. Other
methods such as the structured approach, prototyping or Rapid Application Development
(RAD) represented for 15 – 16% each (Figure 7.14). The applied system development method
could affect the management of the project, for example RUP is also a method to guide
software project management. The system development methods were also borrowed from
foreign companies (65%) which are their partners or from manuals and modifying by software
companies themselves (27%).
System development methods
5
1
29
44
15
16
15
0 10 20 30 40 50
Others
Agigal software dev. process
RUP
Object - oriented
RAD
Prototyping
Structured approach
%
Figure 7.14: System development methods
Only 36% projects applied techniques that support the system development method. The
common was the Rational Rose. These tools came from foreign providers (86%). Only 10%
of the projects developed tools for themselves.

Descriptive Analysis of the Survey on Planning in Software Project Management 125
7.6.3 Life-cycle Methods
The life-cycle method for software development is very important. It is a framework for the
project team to follow during the process of software development. However about 35%
project managers did not apply any life-cycle method. They are usually small and local
companies. The most commonly used methods are Spiral (20%), Waterfall (19%), followed
Prototyping and Incremental delivery (both 12.5%) (Figure 7.15). The Life-cycle method
affects the way project team plans projects. With the Waterfall method, the software
development process can be separated into different stages, but not with the Spiral model. The
Spiral or Incremental model is assessed as the most current method to become more flexible
to customer requirements. Although the Waterfall model is obsolete, project managers believe
if the software is not too complex or familiar to the project team, and the customer could
clearly define their requirements, the Waterfall model will be applied. In the other cases, the
developers need to apply the Spiral or Prototyping model. Using these models helps
programmers to be more flexible in identifying the customer’s requirements for the analysis
and design of the software.
Life - cycle methods
1
13
13
20
1
19
0 5 10 15 20 25
Others
Incremental delivery
Prototyping
Spiral
V process
Waterfall
%
Figure 7.15: Life-cycle methods
Project managers focused more on software engineering methods (system development) rather
than management (project management and project life-cycle). This indicated that the project
managers lacked of project management knowledge and spent much their time for technical
aspects. They are project managers and developers as well. Usually this identity happened in
small projects.

126 Chapter 7
Choosing the methods and tools in software development and project management was
mainly the responsibility of project managers (81%). Sometimes the clients were involved in
this selection (29%). The top manager (22%) did not participate very much but usually
decided the process or method that would be applied for project management in the whole
company.
7.7 MANAGEMENT APPROACH
Management factors in planning in this analysis include management support, setting project
objectives, communication methods, availability of resources, and management styles. The
general evaluation of these factors is presented in Table 7.7.
Table 7.7: Management factors in planning software projects
Factors (*) N Means Std Deviation
Management support
Top-down support 80 4.13 .72
Functional support 80 3.70 .81
Project objectives
Cost and time oriented 80 3.46 .73
Customer oriented 80 4.34 .68
Communication methods
Formal meeting 80 3.43 .91
Email 80 4.23 .99
Resource availability
Human resource and time availability 80 3.44 .80
Financial availability 80 3.71 .72
Management styles
People oriented 80 2.54 1.09
Work oriented 80 3.48 1.24
Participative 80 2.14 1.11
Consultative 80 3.89 1.16
(*) Highest score is 5

Descriptive Analysis of the Survey on Planning in Software Project Management 127
7.7.1 Management Supports
Management support was considered through the effort of top managers and functional
departments in the parent company and the client organization. Most project managers said
they were given full authority for all work related to their project (71%), especially in
technical and personnel issues. Related to financial issues, they sometimes needed the
approval from a higher level. With sponsoring projects, the project team also had the
commitment to support the project (64%) from sponsors (third party). In short, most projects
got good support from top management. Project managers were satisfied with this situation.
The evaluation of management support is given in Table 7.8.
Table 7.8: Management support
Management support (*) N Mean Std. Deviation
Project manager was given with full authority 80 3.99 0.82
Project with committed sponsor 44 3.80 1.05
Functional departments participated 80 3.60 0.79
Client functional departments participated 78 3.40 1.21
(*) Highest score is 5
7.7.2 Defining Objectives And Scope
Defining the objectives in the early stage of the software development process can influence
project outcomes, although they can be adjusted during the process. Four common objectives
were considered, including product quality, customer satisfaction, minimize cost and reduce
overruns of cost and time. The importance of each objective is presented in Figure 7.16. Only
55% of the projects indicated that software quality was a very important goal. Customer
satisfaction was the next major objective. 43% of the project managers considered it as very
important. Minimizing costs was not a major objective (it is very important only in 5% of the
projects). Defining the project goal in planning did not always satisfy all the members within
the project team and customers. 11% of the projects indicated conflicts in the goal definition
process.
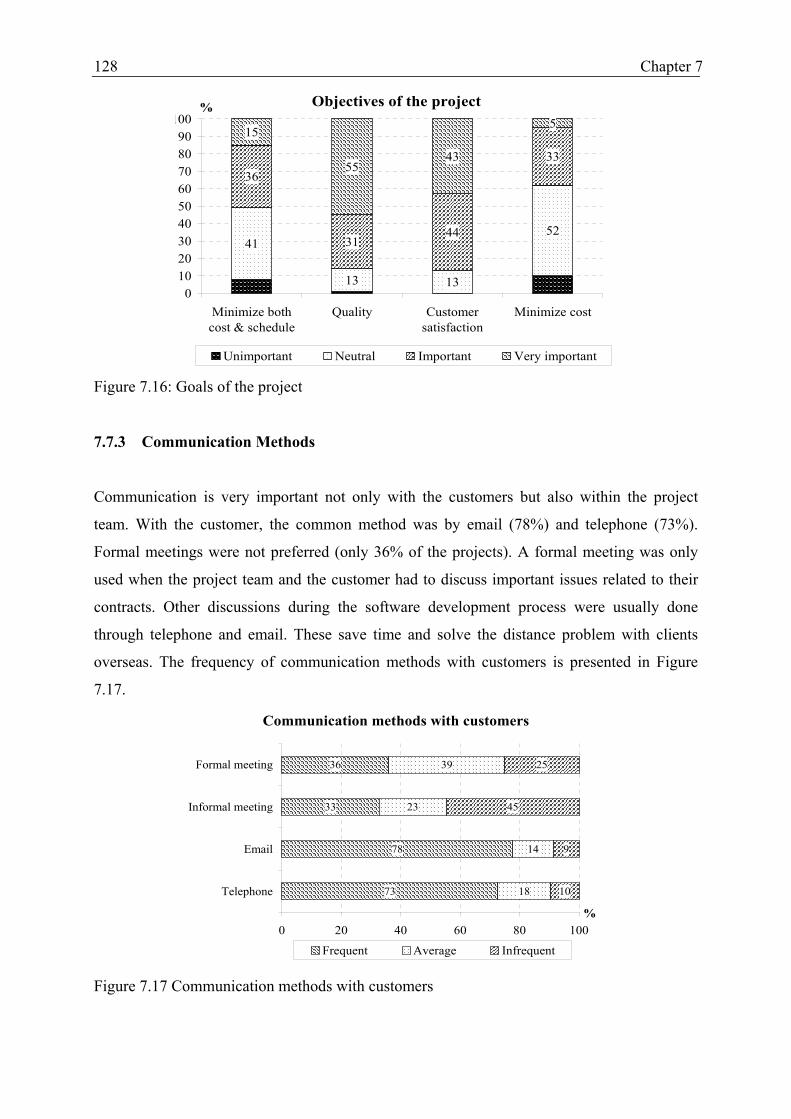
128 Chapter 7
Objectives of the project
41
13 13
52
36
3144
33
15
5543
5
0102030405060708090
100
Minimize bothcost & schedule
Quality Customersatisfaction
Minimize cost
%
Unimportant Neutral Important Very important Figure 7.16: Goals of the project
7.7.3 Communication Methods
Communication is very important not only with the customers but also within the project
team. With the customer, the common method was by email (78%) and telephone (73%).
Formal meetings were not preferred (only 36% of the projects). A formal meeting was only
used when the project team and the customer had to discuss important issues related to their
contracts. Other discussions during the software development process were usually done
through telephone and email. These save time and solve the distance problem with clients
overseas. The frequency of communication methods with customers is presented in Figure
7.17.
Communication methods with customers
73
78
33
36
18
14
23
39
10
9
45
25
0 20 40 60 80 100
Telephone
Informal meeting
Formal meeting
%
Frequent Average Infrequent
Figure 7.17 Communication methods with customers
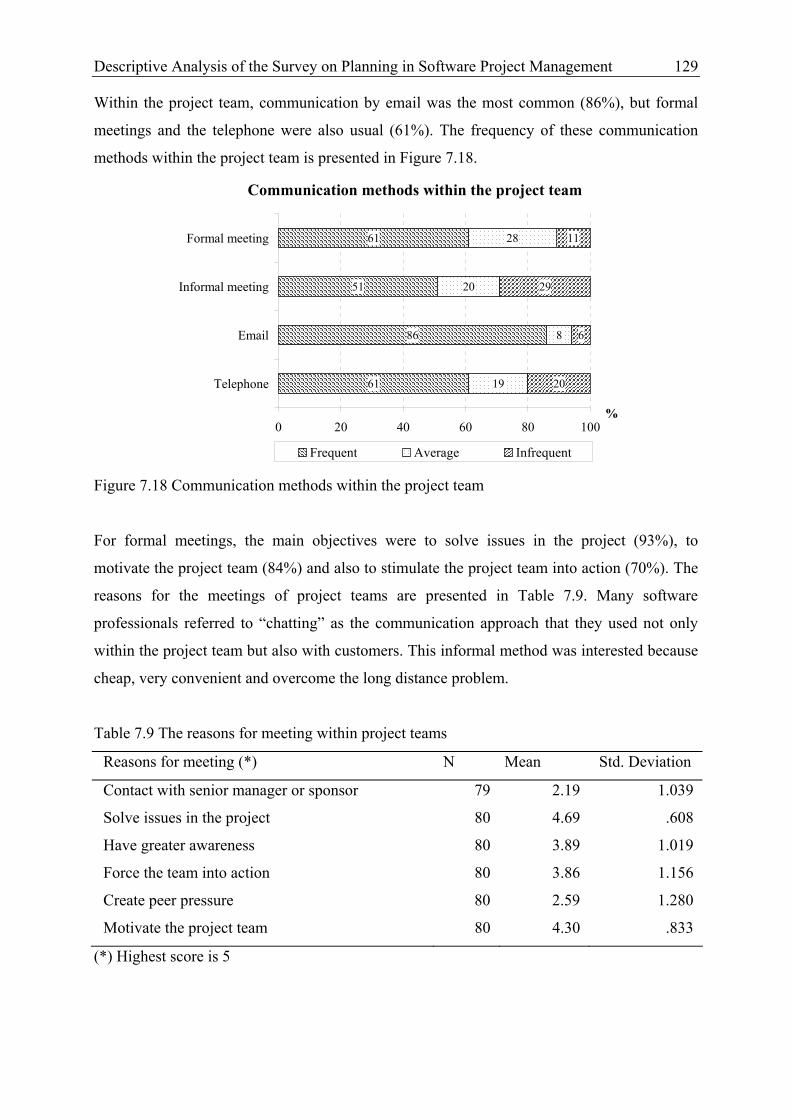
Descriptive Analysis of the Survey on Planning in Software Project Management 129
Within the project team, communication by email was the most common (86%), but formal
meetings and the telephone were also usual (61%). The frequency of these communication
methods within the project team is presented in Figure 7.18.
Communication methods within the project team
61
86
51
61
19
8
20
28
20
6
29
11
0 20 40 60 80 100
Telephone
Informal meeting
Formal meeting
%
Frequent Average Infrequent Figure 7.18 Communication methods within the project team
For formal meetings, the main objectives were to solve issues in the project (93%), to
motivate the project team (84%) and also to stimulate the project team into action (70%). The
reasons for the meetings of project teams are presented in Table 7.9. Many software
professionals referred to “chatting” as the communication approach that they used not only
within the project team but also with customers. This informal method was interested because
cheap, very convenient and overcome the long distance problem.
Table 7.9 The reasons for meeting within project teams
Reasons for meeting (*) N Mean Std. Deviation
Contact with senior manager or sponsor 79 2.19 1.039
Solve issues in the project 80 4.69 .608
Have greater awareness 80 3.89 1.019
Force the team into action 80 3.86 1.156
Create peer pressure 80 2.59 1.280
Motivate the project team 80 4.30 .833
(*) Highest score is 5

130 Chapter 7
7.7.4 Resource Availability
The availability of resources such as time, human resource, budget and infrastructure could
affect the project plan and influence the project outcomes. The survey results indicated that
the availability of all resources in projects was average. The availability of infrastructure like
offices, computers, communication devices, was the highest (65% projects). The availability
of manpower including qualified people as project requirements was lowest compared to other
aspects (18% projects indicated a low availability). The availability of other resources like
time and budget were average. This is shown in Figure 7.19. In short, resource availability
was not a major constraint for planning or in the whole software development process.
Resource availability on software projects
65
46
51
31
34
50
39
51
10
18
4
1
0 20 40 60 80 100
Infrastructure
Budget
Time
Manpower
%
High Average Low
Figure 7.19: Resource availability on software projects
7.7.5 Management Styles
Management style in the project influences the project outcomes. Management styles include
people oriented, work oriented and decision styles including unilateral, consultative, and
participative decision making. These styles were modified to fit the practice of the survey
context. In fact, not all project managers could identify the management styles that they
applied. In this survey, the making decision approach was “to consult the project team before
make final decisions” (consultative style - 61%). The common management style was work –
oriented (51%). The participative style was not applied very much, only 12% of the projects
indicated that all members in their project could participate in the decision process. 21% of
the projects applied a people-oriented management style.

Descriptive Analysis of the Survey on Planning in Software Project Management 131
7.8 PLANNING PERFORMANCE AND PROJECT OUTCOMES
The planning performance of a project is assessed through defining requirements and
specifications, estimating time and effort for the whole project, scheduling and analyzing
risks. The evaluation of project managers in project planning is presented in Table 7.10.
Table 7.10 Project planning performance
Planning performance (*) N Mean Std. Deviation
Defining requirements and specifications 80 3.58 .911
Estimating time and effort for the whole project 80 3.47 .856
Scheduling 80 3.81 .943
Analyzing risks 80 3.21 .937
(*) Highest score is 5
In general, the planning of software projects was average (3.2 – 3.8). Scheduling got the best
performance in planning. It was evaluated as “very good” by 28% of projects. The next was
defining requirements and specifications (19%). Only 11% of the projects evaluated their
estimating project time and effort and analyzing risk as very good. 23% of projects were poor
in risk analysis (Figure 7.20). This evaluation reflected the difficulty in estimating time and
effort for projects. A software project always has uncertainty and the analysis of project risks
is also not very good. According to project managers, it was very difficult to produce an exact
estimation even if many tools and software are available for this. One reason for this difficulty
was the change of customer requirements. This was also the most common risk that software
projects face.
As mentioned in Figure 7.8, the level of staff involvement in the planning of software projects
was lowest. The time and effort that a project team spent for planning was not much. 41% of
the projects spent less than 10% of the time and 48% spent less than 10% of the total effort for
planning.

132 Chapter 7
Planning performance
10.0
12.5
8.8
21.3
41.3
38.8
28.8
42.5
30.0
37.5
35.0
25.0
18.8
11.3
27.5
10.0
0% 10% 20% 30% 40% 50% 60% 70% 80% 90% 100%
Requirement &Specification
Time & effort estimation
Scheduling
Risk analysis
Very bad Bad Average Good Very good
Figure 7.20: Planning performance
The project outcomes were considered quantitatively and qualitatively. The quantitative
indicators measured how the project duration and cost matched the plan. The qualitative
assessment considered how the project results satisfied the customer, project team and the
company. These indicators were evaluated by the project managers. The results are presented
in Table 7.11.
Table 7.11 Outcomes of software projects
N Mean Std. Deviation
Project result in terms of time (*) 80 2.49 .811
Project result in terms of cost (**) 80 2.19 .887
Meet all specifications defined in plan stage (***) 80 3.98 .675
Satisfy customer needs (***) 80 3.96 .605
Enhance company image (***) 80 4.13 .644
Improve project team capability (***) 80 4.33 .632
Financial benefits to company (***) 80 3.70 .736
Financial benefits to team members (***) 80 3.39 .646 (*): 1 = under planned time, 2 = on planned time, 3 = over 30%, 4 = over 50%
(**): 1 = under planned budget, 2 = on planned budget, 3 = over 30%, 4 = over 50%
(***): Highest score is 5

Descriptive Analysis of the Survey on Planning in Software Project Management 133
The analysis indicated that, about 51% of the projects were completed on time and 62% of
projects were completed within the planned budget. The ratio of projects completed late and
over budget was high. 49% of the projects were over; 30% behind schedule and 38% had cost
overruns.
However, 70% of the projects were self-evaluated as successful. The satisfaction of the
project team was not based on completion on time or budget, because it was not their major
objective. 80% of the project managers agreed that they satisfied the customer. 76% of the
projects indicated that the delivered software met all specifications defining in the plan. Other
outcomes of the project were to improve the project team capability (91%), and to enhance the
company image (85%). Concerning the financial issues, 61% of the projects indicated the
software project bring financial benefits to the company. Some project managers indicated
that their company implemented the project for other benefits (such as a long-term
relationship with a customer) rather than money.
In short, the software projects achieved good results by qualitative criteria but were rated only
average or below by quantitative indicators. This demonstrated that the projects emphasize
mainly customer satisfaction and quality.
7.9 SUMMARY
This chapter described the characteristics of the sample, including the size, age, products and
clients of the software companies. In the study, most Vietnamese software companies are
small and young with 44% of companies having less than 20 employees and 61% established
within 5 years. 61% of software projects are made – to – order projects. Most of projects were
implemented in 3 – 9 months (51%) with the participation of about 10 persons, in average.
The planning of software projects was considered through three sets of factors, including
human, technical and management. The involvement of the customer in planning and the
effort of project managers for planning were high. Concerning the technical factor, 94% of the
projects applied system development methods while only 65% of projects used project
management methods. The management support from top managers of software companies
was very good. Software project teams also received the support from functional departments,

134 Chapter 7
such as sales and marketing, finance from the parent company or related departments of client
organizations. The projects focused more on customer satisfaction than other objectives.
In planning, setting the schedule had a positive evaluation by the project managers while risk
analysis was inadequate (average level). Although only 51% and 62% of project were
completed on time and budget, respectively, but 70% of projects were evaluated as successful.
The project managers appreciated the intrinsic benefits that their project received more than
financial benefits.
135
8
DIFFERENCES IN PROJECTS BY SIZE,
TYPE AND OWNERSHIP
8.1 DIFFERENCES IN SOFTWARE PROJECTS BY SIZE ............................................ 136
8.1.1 General Characteristics Of Software Projects ..................................................... 136
8.1.2 Human Factors..................................................................................................... 139
8.1.3 Technical Factors................................................................................................. 139
8.1.4 Management Factors ........................................................................................... 140
8.1.5 Planning Performance And Project Outcomes .................................................... 140
8.1.6 Summary.............................................................................................................. 142
8.2 DIFFERENCES IN SOFTWARE PROJECTS BETWEEN LOCAL AND
INTERNATIONAL COMPANIES.............................................................................. 142
8.2.1 General Characteristics Of Software Companies And Projects .......................... 142
8.2.2 Human Factors..................................................................................................... 144
8.2.3 Technical Factors................................................................................................. 145
8.2.4 Management Approach ....................................................................................... 146
8.2.5 Planning Performance And Project Outcomes .................................................... 147
8.2.6 Summary.............................................................................................................. 148
8.3 DIFFERENCES IN SOFTWARE PROJECT TYPES ................................................. 149
8.3.1 Project Characteristics ......................................................................................... 149
8.3.2 Human Factors..................................................................................................... 150
8.3.3 Technical Factors................................................................................................. 151
8.3.4 Management Approach ....................................................................................... 152
8.3.5 Planning Performance And Project Outcomes .................................................... 153
8.3.6 Summary.............................................................................................................. 155

136 Chapter 8
This chapter presents the results and discussion of comparisons between software projects by
size, type and ownership. The differences in planning between projects are examined through
project characteristics, planning factors, planning performance and project outcomes. The
chapter is completed with the summury of our findings.
8.1 DIFFERENCES IN SOFTWARE PROJECTS BY SIZE
As described in Chapter Seven, the descriptive analysis of survey, project size in this study
was considered by its duration and the number of persons in the project team. Typically,
project size should be measured by man – month or man – year. However, this data was
missing in most software projects in this survey. To analyze the differences by size, project
size will be measured by a modified indicator that is calculated by the number of people in the
project team multiplied by its duration. The average size of the projects was determined, as
approximately 100 man – months. This data does not reflect the real size of a project because
the number of persons involved in different project stages are not similar. However, it could
be used to classify projects by size. This data then was recoded into two groups: projects
which were below 100 man – months and projects which were above 100 man – month.
Hereinafter, below and above average size (100 man – months) groups are called smaller and
bigger.
By this classification, the sample includes 47 projects in the smaller group and 25 projects in
the bigger group. The differences between these two groups are analyzed by the
characteristics of projects and the human, technical and management factors.
8.1.1 General Characteristics Of Software Projects
The characteristics of software projects include types, clients, duration, cost and the number
of team members involved in different stages of the project.
The analysis indicates that there is no significant difference between the bigger and the
smaller size group related to project types (commercial, made-to-order and outsourcing). It
means all project types are implemented with different size. There is also no difference in
project size between local clients. Regarding the international clients of projects, only in the
European market, the number of big projects (more than 100 man – months) is significant

Differences in Projects by Size, Type and Ownership 137
higher than the number of smaller projects. The results of analysis of international clients are
presented in Table 8.1. Other results related to differences in project type, local client market,
are presented in Appendix C, Table 8.2 and 8.3.
Table 8.1: International clients by size of projects
Clients
Number of
observations (N)
Means Std
Deviation
T - value p - value
Smaller 46 .22 .42North America
Bigger 24 .29 .46
-.657 .514
Smaller 46 .02 .15South America
Bigger 24 .04 .20
-.424 .674
Smaller 46 .09 .28Asia
Bigger 24 .13 .34
-.471 .640
Smaller 46 .09 .28Europe
Bigger 24 .29 .46
-1.985 .050
The differences in project cost and number of project team members are analyzed. This
analysis shows that the smaller projects controlled costs better than the bigger projects. In the
large the projects, the more people involved and the more tasks that should be implemented.
Therefore, estimation for the cost of such projects is more difficult. The larger projects usually
have the longer duration, that leads to more changes in the final stages of projects. These
projects have difficulty to produce an accurate cost estimates and to control the changes in the
final project stages indicate that bigger projects have the higher rate of cost overrun. The
analysis results are presented in Table 8.2.

138 Chapter 8
Table 8.2: Project duration and cost by size
N Means Std
Deviation
T - value p - value
Smaller 47 2.38 1.13Duration *
Bigger 25 5.16 1.31
-8.950 .000
Smaller 46 2.11 1.08Actual cost **
(as compared to budget) Bigger 24 2.75 1.39
-2.133
.037
(*) 1 = < 3 month, 2 = 3 - <6 months, 3 = 6 – <9 months, 4 = 9 – <12 months,
5 = 12 – <18 months, 6 = 18 – <24 months, 7 = > 24 months
(**) 1 = < 90%, 2 = 90 – 109%, 3 = 110 – 129%, 4 = 130 – 149%, 5 = 150 – 199%, 6 = > 200%
The total number of people involved in the whole project cycle of projects in the bigger
projects is significantly higher than smaller projects. However, this is not always true for all
stages of the project life cycle. The results indicate that in coding, deploying, documentation
and maintenance stages, the number of people participating in the bigger projects was
significantly higher than in smaller projects. In planning, analysis and design, and testing
stages there were no significant differences. The results are presented in Table 8.3.
Table 8.3: People participated in different stages by size
People participated in … N Means Std
Deviation
T – value p - value
Smaller 47 7.55 4.15the whole project life
cycle Bigger 25 13.52 5.67
-4.644 .000
Smaller 44 2.25 1.14the planning stage
Bigger 21 2.33 1.39
-.239 .813
Smaller 44 2.59 1.42the analysis and
design stage Bigger 20 3.10 1.07
-1.585 .120
Small 44 4.80 3.20the coding stage
Bigger 21 7.38 4.17
-2.512 .017
Smaller 44 2.57 2.10the testing stage
Bigger 21 4.00 5.36
-1.182 .249
Smaller 44 3.32 3.96the deploying stage
Bigger 21 6.81 6.76
-2.192 .037
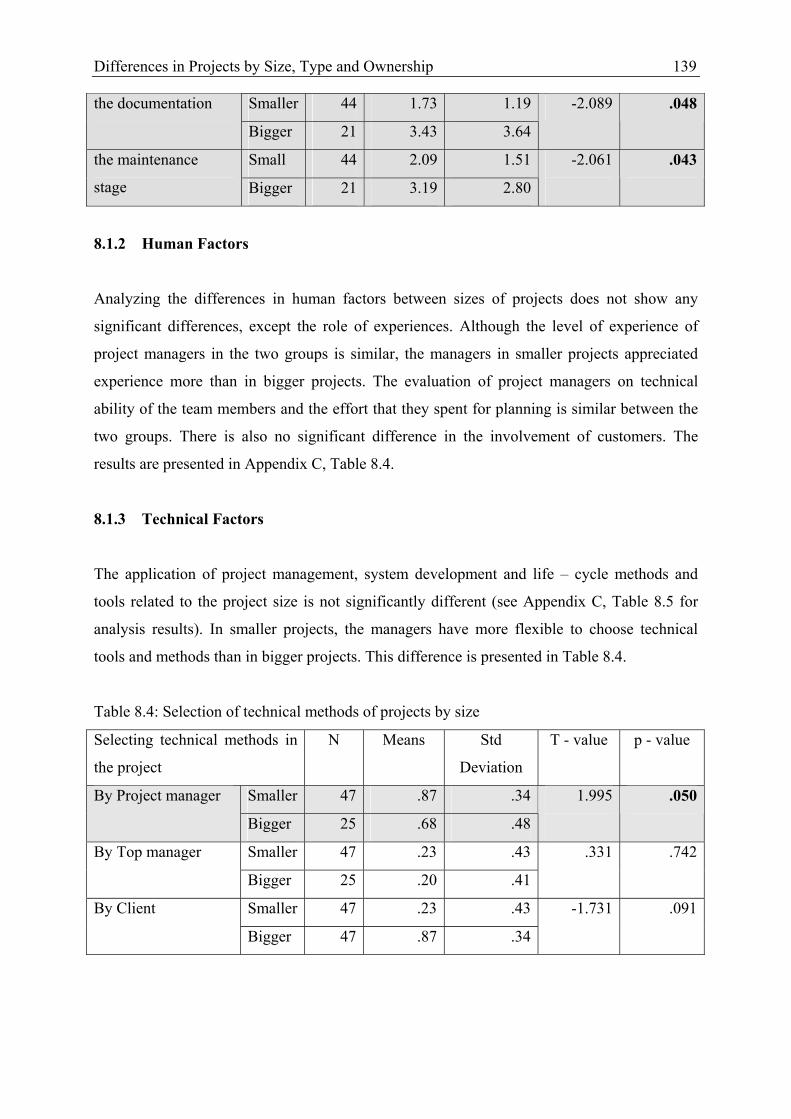
Differences in Projects by Size, Type and Ownership 139
Smaller 44 1.73 1.19the documentation
Bigger 21 3.43 3.64
-2.089 .048
Small 44 2.09 1.51the maintenance
stage Bigger 21 3.19 2.80
-2.061
.043
8.1.2 Human Factors
Analyzing the differences in human factors between sizes of projects does not show any
significant differences, except the role of experiences. Although the level of experience of
project managers in the two groups is similar, the managers in smaller projects appreciated
experience more than in bigger projects. The evaluation of project managers on technical
ability of the team members and the effort that they spent for planning is similar between the
two groups. There is also no significant difference in the involvement of customers. The
results are presented in Appendix C, Table 8.4.
8.1.3 Technical Factors
The application of project management, system development and life – cycle methods and
tools related to the project size is not significantly different (see Appendix C, Table 8.5 for
analysis results). In smaller projects, the managers have more flexible to choose technical
tools and methods than in bigger projects. This difference is presented in Table 8.4.
Table 8.4: Selection of technical methods of projects by size
Selecting technical methods in
the project
N Means Std
Deviation
T - value p - value
Smaller 47 .87 .34By Project manager
Bigger 25 .68 .48
1.995
.050
Smaller 47 .23 .43By Top manager
Bigger 25 .20 .41
.331 .742
Smaller 47 .23 .43By Client
Bigger 47 .87 .34
-1.731 .091

140 Chapter 8
8.1.4 Management Factors
Analyzing the differences in management factors was based on the factors such as the support
from top managers and from functional departments, the project objectives, the
communication methods, the availability of resources and the management styles. The
analysis results indicate no significant differences by size in all of these factors. The results
are presented in Appendix C, Table 8.6.
In general, the differences in human, technical and management factors related to size are not
significant.
8.1.5 Planning Performance And Project Outcomes
The rate of effort and time that project managers spent for planning the projects is similar for
projects regardless of size. Planning performance is evaluated through four main tasks of
planning: defining the requirements and specifications, estimating time and effort for the
project, setting a schedule and analyzing risks. The analysis indicates that there is a significant
difference only in the performance of schedule setting. The smaller projects scheduled better
than bigger ones. Because the duration of smaller projects is shorter, so project managers
could estimate and control time and project activities better. Table 8.5 presents this result.
Table 8.5: Planning evaluation of projects by size
N Means Std
Deviation
T - value p - value
Smaller 46 22.098 15.060% time for planning
Bigger 23 22.739 19.939
-.136 .893
Smaller 38 19.197 14.087% effort for planning
Bigger 13 15.923 14.361
.713 .484
Smaller 47 3.62 .90Requirements and
specifications defining Bigger 25 3.52 1.00
.404 .688
Smaller 47 3.62 .82Time and effort
estimating Bigger 25 3.28 .84
1.629 .110
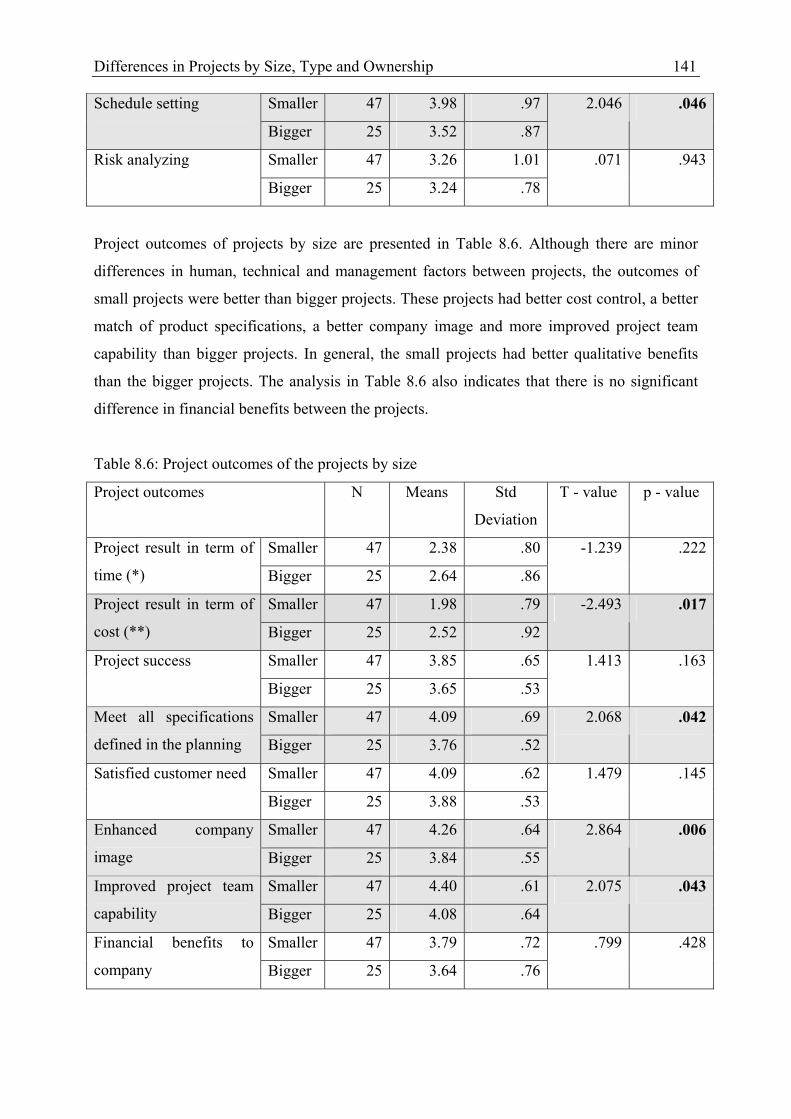
Differences in Projects by Size, Type and Ownership 141
Smaller 47 3.98 .97Schedule setting
Bigger 25 3.52 .87
2.046 .046
Smaller 47 3.26 1.01Risk analyzing
Bigger 25 3.24 .78
.071 .943
Project outcomes of projects by size are presented in Table 8.6. Although there are minor
differences in human, technical and management factors between projects, the outcomes of
small projects were better than bigger projects. These projects had better cost control, a better
match of product specifications, a better company image and more improved project team
capability than bigger projects. In general, the small projects had better qualitative benefits
than the bigger projects. The analysis in Table 8.6 also indicates that there is no significant
difference in financial benefits between the projects.
Table 8.6: Project outcomes of the projects by size
Project outcomes N Means Std
Deviation
T - value p - value
Smaller 47 2.38 .80Project result in term of
time (*) Bigger 25 2.64 .86
-1.239 .222
Smaller 47 1.98 .79Project result in term of
cost (**) Bigger 25 2.52 .92
-2.493 .017
Smaller 47 3.85 .65Project success
Bigger 25 3.65 .53
1.413 .163
Smaller 47 4.09 .69Meet all specifications
defined in the planning Bigger 25 3.76 .52
2.068
.042
Smaller 47 4.09 .62Satisfied customer need
Bigger 25 3.88 .53
1.479 .145
Smaller 47 4.26 .64Enhanced company
image Bigger 25 3.84 .55
2.864 .006
Smaller 47 4.40 .61Improved project team
capability Bigger 25 4.08 .64
2.075 .043
Smaller 47 3.79 .72Financial benefits to
company Bigger 25 3.64 .76
.799 .428

142 Chapter 8
Smaller 47 3.49 .62Financial benefits to
team members Bigger 25 3.28 .68
1.283 .206
(*): 1 = under planned time, 2 = on planned time, 3 = over 30%, 4 = over 50%
(**): 1 = under planned budget, 2 = on planned budget, 3 = over 30%, 4 = over 50%
8.1.6 Summary
In this analysis the project size is based on the average size in term of man – months of 80
projects of this survey. The analysis of differences in characteristics by projects size showed
only a few significant differences. These were mainly related to the allocation of human
resources during project life – cycle. The results also indicated a few minor differences in
human, technical and management factors, however, the analysis for project outcomes
indicated that smaller projects had significantly better non – financial benefits than larger
projects.
8.2 DIFFERENCES IN SOFTWARE PROJECTS BETWEEN LOCAL AND
INTERNATIONAL COMPANIES
As assumed in Chapter Four, the types of ownership of software companies could lead to
differences in the management approach of software projects and project outcomes. This
study considers two types of ownership: local companies (including both private and state-
owned) and international companies. The sample includes 23 projects in international
companies and 57 projects of local companies. The following analysis will compare the two
groups of ownership: international projects and local projects.
8.2.1 General Characteristics Of Software Companies And Projects
The analysis for equality of age and number of employees does not show any differences by
ownership. This means the international and local companies have a similar size and
experience in the Vietnamese market. The international and local companies produce many
kinds of software products and with little focus. There are also no significant differences in
project types that are implemented by either international and local companies (see Appendix
C, Table 8.7 and Table 8.8 for analysis results).
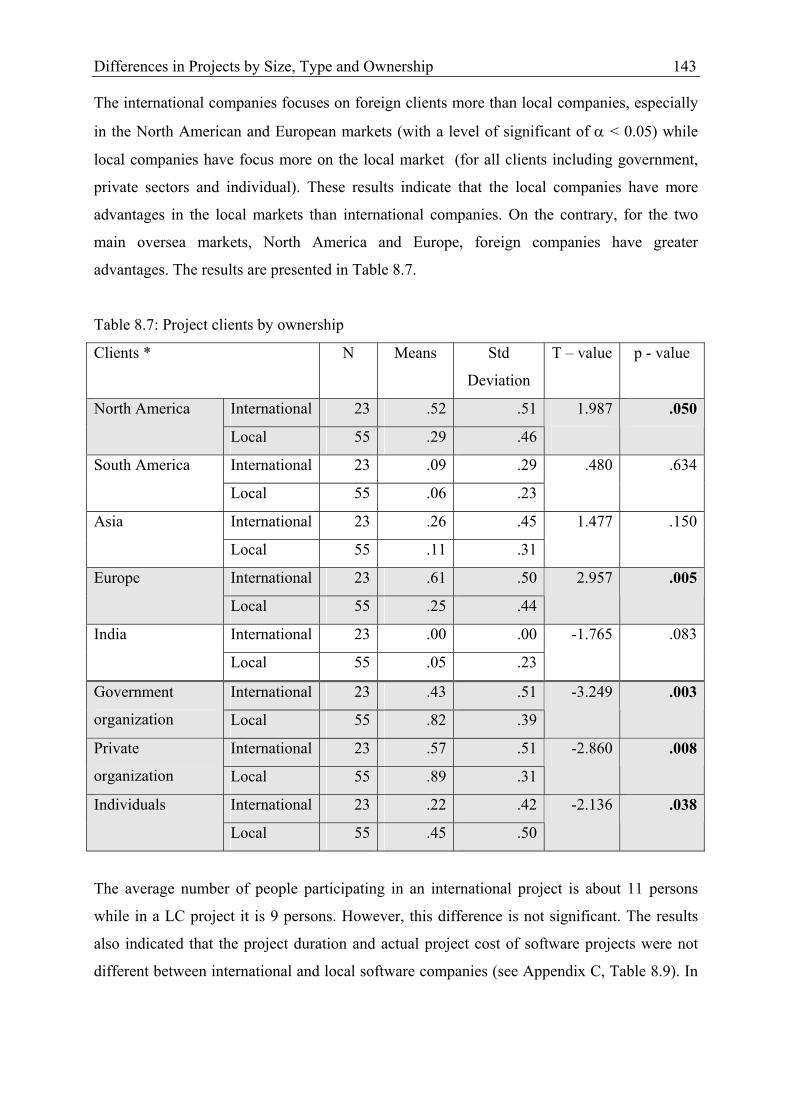
Differences in Projects by Size, Type and Ownership 143
The international companies focuses on foreign clients more than local companies, especially
in the North American and European markets (with a level of significant of α < 0.05) while
local companies have focus more on the local market (for all clients including government,
private sectors and individual). These results indicate that the local companies have more
advantages in the local markets than international companies. On the contrary, for the two
main oversea markets, North America and Europe, foreign companies have greater
advantages. The results are presented in Table 8.7.
Table 8.7: Project clients by ownership
Clients *
N Means Std
Deviation
T – value p - value
International 23 .52 .51North America
Local 55 .29 .46
1.987
.050
International 23 .09 .29South America
Local 55 .06 .23
.480 .634
International 23 .26 .45Asia
Local 55 .11 .31
1.477 .150
International 23 .61 .50Europe
Local 55 .25 .44
2.957 .005
International 23 .00 .00India
Local 55 .05 .23
-1.765 .083
International 23 .43 .51Government
organization Local 55 .82 .39
-3.249 .003
International 23 .57 .51Private
organization Local 55 .89 .31
-2.860 .008
International 23 .22 .42Individuals
Local 55 .45 .50
-2.136 .038
The average number of people participating in an international project is about 11 persons
while in a LC project it is 9 persons. However, this difference is not significant. The results
also indicated that the project duration and actual project cost of software projects were not
different between international and local software companies (see Appendix C, Table 8.9). In

144 Chapter 8
brief, the project characteristics between software projects of the international and local
companies tend to be similar except for the markets they emphasize.
8.2.2 Human Factors
The analysis of human factors in international and local company’s projects is presented in
Table 8.8. Regarding project managers, the difference of average experience (measured by
number of years and projects as project managers) between international company’s project
managers and local company’s project managers is not significant. The analysis indicates that
project managers of international companies put forth significantly greater effort than their
colleagues in projects of local companies.
The team members are evaluated by their knowledge and experience in system development
and requirements analysis and their commitment and persistence in planning. The experience
and knowledge of team members in projects of international companies are significantly
higher than those in local companies.
The involvement of customers in the planning of software projects of international companies
is greater than that in projects of local companies. The reason is that clients of international
companies are usually overseas, more experienced and demanding. They have more
knowledge in software engineering and they require participation in planning to ensure that
their requirements are captured by the project team. The results of the analysis are presented
in Table 8.8.
Table 8.8: Human factors by the project ownership
Items N Means Std
Deviation
T - value p - value
International 20 3.20 1.70Project manager
experiences (in years) Local 44 2.89 1.72
.656 .516
International 23 6.83 6.10PM experiences (No.
of projects) Local 57 5.82 4.59
.711 .482
International 23 3.90 .49Role of experience of
Project manager Local 57 3.64 .65
2.018 .049
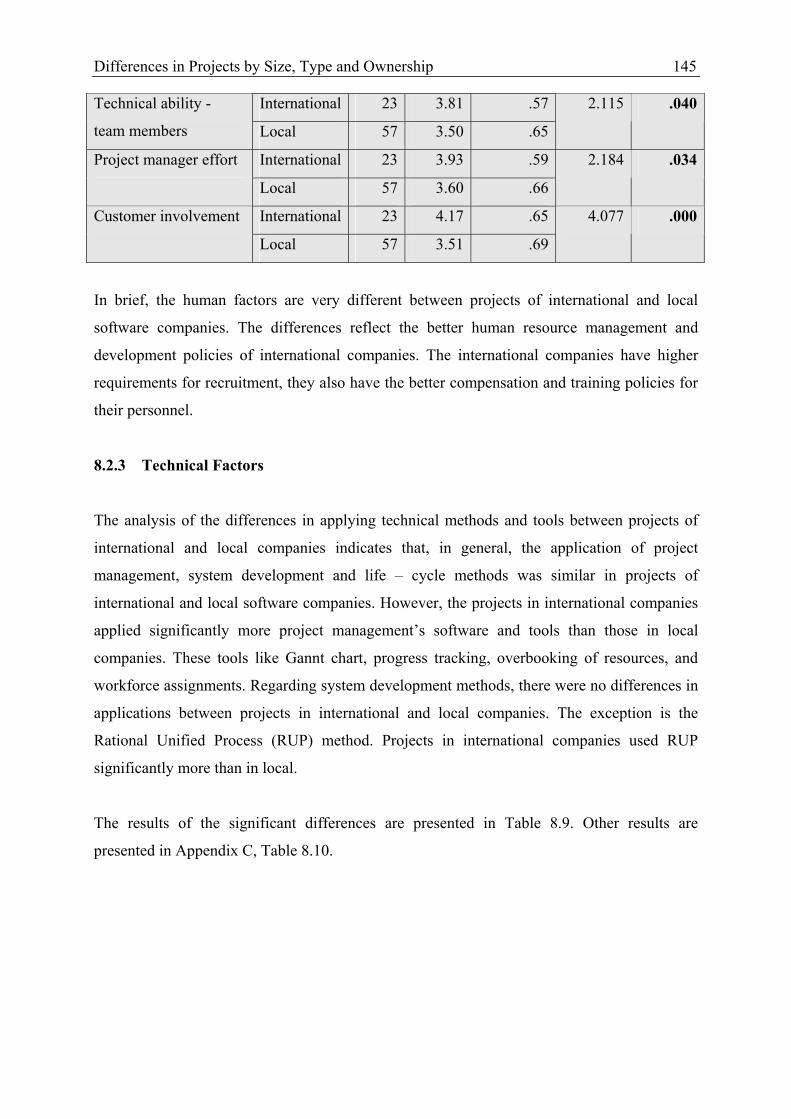
Differences in Projects by Size, Type and Ownership 145
International 23 3.81 .57Technical ability -
team members Local 57 3.50 .65
2.115 .040
International 23 3.93 .59Project manager effort
Local 57 3.60 .66
2.184 .034
International 23 4.17 .65Customer involvement
Local 57 3.51 .69
4.077 .000
In brief, the human factors are very different between projects of international and local
software companies. The differences reflect the better human resource management and
development policies of international companies. The international companies have higher
requirements for recruitment, they also have the better compensation and training policies for
their personnel.
8.2.3 Technical Factors
The analysis of the differences in applying technical methods and tools between projects of
international and local companies indicates that, in general, the application of project
management, system development and life – cycle methods was similar in projects of
international and local software companies. However, the projects in international companies
applied significantly more project management’s software and tools than those in local
companies. These tools like Gannt chart, progress tracking, overbooking of resources, and
workforce assignments. Regarding system development methods, there were no differences in
applications between projects in international and local companies. The exception is the
Rational Unified Process (RUP) method. Projects in international companies used RUP
significantly more than in local.
The results of the significant differences are presented in Table 8.9. Other results are
presented in Appendix C, Table 8.10.

146 Chapter 8
Table 8.9: Application of technical methods in the planning by projects ownership
Items N Means Std
Deviation
T - value p -
value
International 23 .91 .29Using software for project
management Local 56 .55 .50
3.994 .000
International 23 .52 .51Apply RUP
Local 57 .19 .40
3.074 .003
The authority for selection of technical methods and tools applications in the software projects
belongs to project managers, clients or top managers in software companies. The results
indicate that there are no significant differences between projects in international and local
companies (see Appendix C, Table 8.11).
8.2.4 Management Approach
The analysis of the differences of management factors between projects in international and
local companies indicates some significant differences. Regarding the management support,
the availability of resources and management styles, there was little differences between
projects in international and local companies. The results show that projects in international
companies focus on the objective of minimizing cost and maintaining the schedule more than
in local companies. Other objectives such as quality and customer satisfaction show no
significant differences between projects in local and international software companies.
The use of communication methods is somewhat different between projects in the
international and local companies. Projects in international companies use email to
communicate to their customers more frequently than their colleagues in local companies,
however they also had less informal meetings with the customer. The reason is that they have
more clients overseas than local companies. Communication by email helps to overcome the
long-distance problem.
Table 8.10 only presents the results of significant differences. Other results are presented in
Appendix C, Table 8.12.

Differences in Projects by Size, Type and Ownership 147
Table 8.10: Management factors by projects ownership
Factors N Means Std
Deviation
T - value p - value
Project objectives
International 23 3.72 .58Cost and time
oriented Local 57 3.35 .76
2.333 .023
International 23 4.44 .63Customer oriented
Local 57 4.31 .69
.800 .428
Communication methods
International 23 3.22 .85Formal meetings
Local 57 3.52 .92
-1.395 .170
International 23 4.59 .58Email
Local 57 4.09 1.09
2.650 .010
8.2.5 Planning Performance And Project Outcomes
Regarding the effort spent for planning, the analysis indicates that the average time and effort
that project managers spent were not significant between projects in international and local
software companies. The planning performance of projects by ownership is presented in Table
8.11. The projects in international companies indicate a better performance in scheduling and
risk analysis than those in local companies.
Table 8.11: Planning evaluation by projects ownership
N Means Std
Deviation
T - value p - value
International 22 24.54 16.84% time for planning
Local 54 21.87 16.76
.627 .534
International 17 18.94 12.33% effort for planning
Local 37 18.10 14.72
.220 .827
International 23 3.83 .89Requirements and
specifications defining Local 57 3.47 .91
1.597 .118
International 23 3.61 .78Time and effort
estimating Local 57 3.42 .89
.934 .355
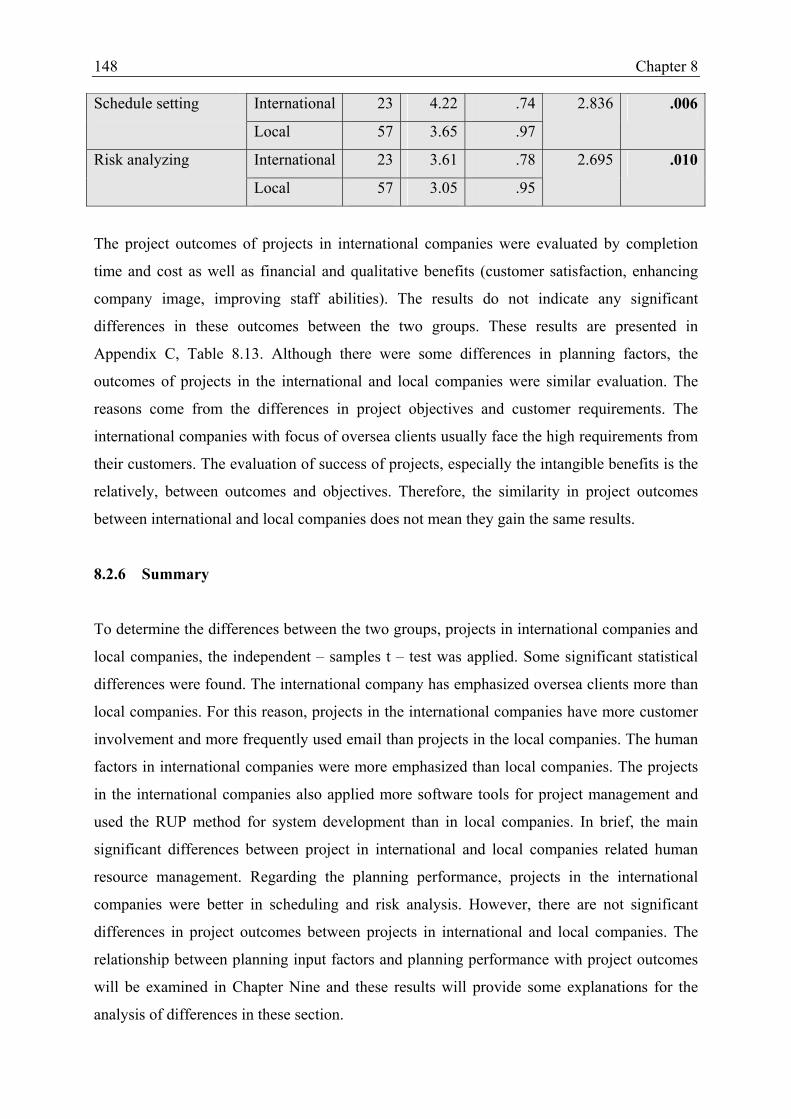
148 Chapter 8
International 23 4.22 .74Schedule setting
Local 57 3.65 .97
2.836 .006
International 23 3.61 .78Risk analyzing
Local 57 3.05 .95
2.695 .010
The project outcomes of projects in international companies were evaluated by completion
time and cost as well as financial and qualitative benefits (customer satisfaction, enhancing
company image, improving staff abilities). The results do not indicate any significant
differences in these outcomes between the two groups. These results are presented in
Appendix C, Table 8.13. Although there were some differences in planning factors, the
outcomes of projects in the international and local companies were similar evaluation. The
reasons come from the differences in project objectives and customer requirements. The
international companies with focus of oversea clients usually face the high requirements from
their customers. The evaluation of success of projects, especially the intangible benefits is the
relatively, between outcomes and objectives. Therefore, the similarity in project outcomes
between international and local companies does not mean they gain the same results.
8.2.6 Summary
To determine the differences between the two groups, projects in international companies and
local companies, the independent – samples t – test was applied. Some significant statistical
differences were found. The international company has emphasized oversea clients more than
local companies. For this reason, projects in the international companies have more customer
involvement and more frequently used email than projects in the local companies. The human
factors in international companies were more emphasized than local companies. The projects
in the international companies also applied more software tools for project management and
used the RUP method for system development than in local companies. In brief, the main
significant differences between project in international and local companies related human
resource management. Regarding the planning performance, projects in the international
companies were better in scheduling and risk analysis. However, there are not significant
differences in project outcomes between projects in international and local companies. The
relationship between planning input factors and planning performance with project outcomes
will be examined in Chapter Nine and these results will provide some explanations for the
analysis of differences in these section.
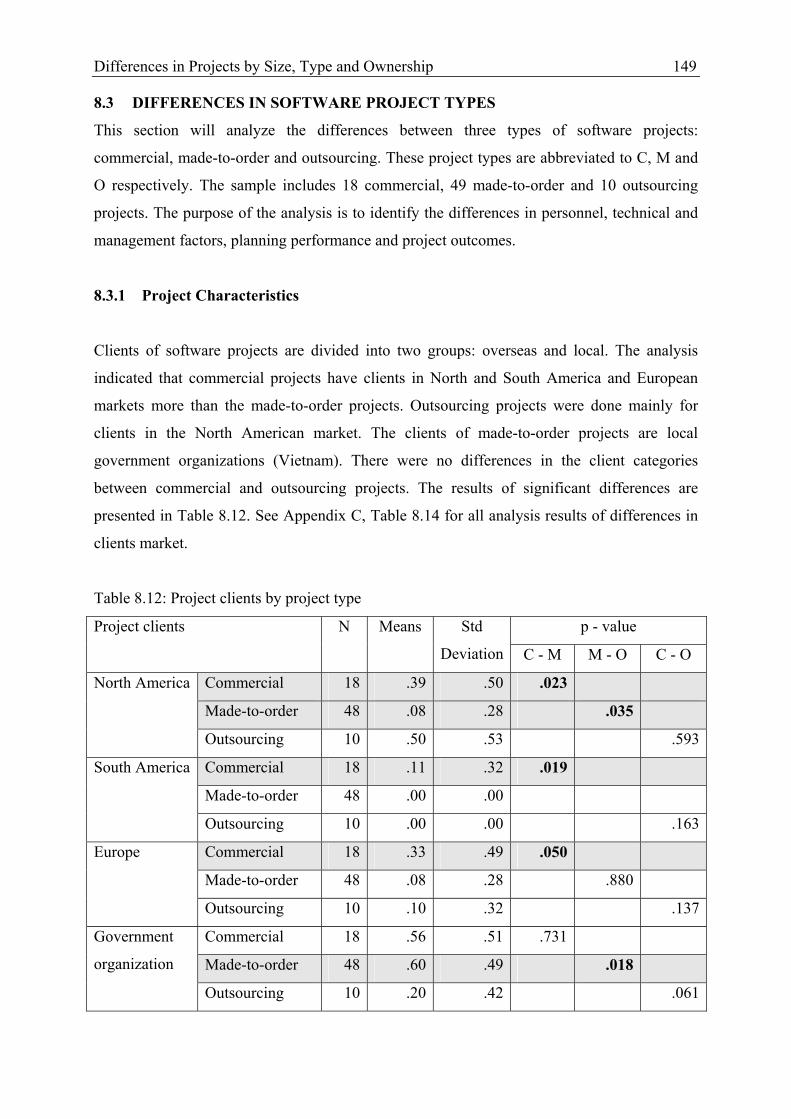
Differences in Projects by Size, Type and Ownership 149
8.3 DIFFERENCES IN SOFTWARE PROJECT TYPES
This section will analyze the differences between three types of software projects:
commercial, made-to-order and outsourcing. These project types are abbreviated to C, M and
O respectively. The sample includes 18 commercial, 49 made-to-order and 10 outsourcing
projects. The purpose of the analysis is to identify the differences in personnel, technical and
management factors, planning performance and project outcomes.
8.3.1 Project Characteristics
Clients of software projects are divided into two groups: overseas and local. The analysis
indicated that commercial projects have clients in North and South America and European
markets more than the made-to-order projects. Outsourcing projects were done mainly for
clients in the North American market. The clients of made-to-order projects are local
government organizations (Vietnam). There were no differences in the client categories
between commercial and outsourcing projects. The results of significant differences are
presented in Table 8.12. See Appendix C, Table 8.14 for all analysis results of differences in
clients market.
Table 8.12: Project clients by project type
p - value Project clients N Means Std
Deviation C - M M - O C - O
Commercial 18 .39 .50 .023
Made-to-order 48 .08 .28 .035
North America
Outsourcing 10 .50 .53 .593
Commercial 18 .11 .32 .019
Made-to-order 48 .00 .00
South America
Outsourcing 10 .00 .00 .163
Commercial 18 .33 .49 .050
Made-to-order 48 .08 .28 .880
Europe
Outsourcing 10 .10 .32 .137
Commercial 18 .56 .51 .731
Made-to-order 48 .60 .49 .018
Government
organization
Outsourcing 10 .20 .42 .061

150 Chapter 8
The analysis of the project duration, cost, and size between the three types of projects
indicates that there is no significant difference in the duration between these projects. Made-
to-order projects control costs better than commercial projects. In fact, the cost for made-to-
order projects depends mainly on the client and is difficulty to change, while the cost for
commercial software projects is controlled by the parent company. The budget for commercial
projects could be changed if the changes in project specifications proposed by project team
are approved by the parent company. With made-to-order projects, the change in budget is
more difficult to approve. The project size in terms of number of project members in
outsourcing is significantly higher than made-to-order projects. Table 8.13 only presents the
analysis of significant differences. Other results are presented in Appendix C, Table 8.15.
Table 8.13: Project duration, cost and size by project type
p - value Items N Means Std
Deviation C - M M - O C - O
Commercial 17 3.00 1.54 .042
Made-to-order 48 2.13 1.06 .341
Project cost (**)
Outsourcing 10 2.60 1.43 .503
Commercial 17 10.44 5.24 .128
Made-to-order 43 8.6 5.14 .050
Project size
(number of people
in project team) Outsourcing 9 12.44 6.17 .544(**) 1 = < 90%, 2 = 90 – 109%, 3 = 110 – 129%, 4 = 130 – 149%, 5 = 150 – 199%, 6 = > 200%
8.3.2 Human Factors
The analysis of differences in human factors between the three groups of project types
indicates that there are significant differences in the effort that project managers spend for
planning. The level of effort in the commercial project is greater than in the made-to-order
and outsourcing projects. Commercial software is a product that is developed by the software
companies for an anticipated market need. The project manager has to define the product
specifications, scope, etc. based on the project team’s estimation of user needs. This process
requires more effort than made-to-order or outsourcing projects in which the requirements are
defined mainly by the customer. The experience of project managers in all project types is not
significantly different.
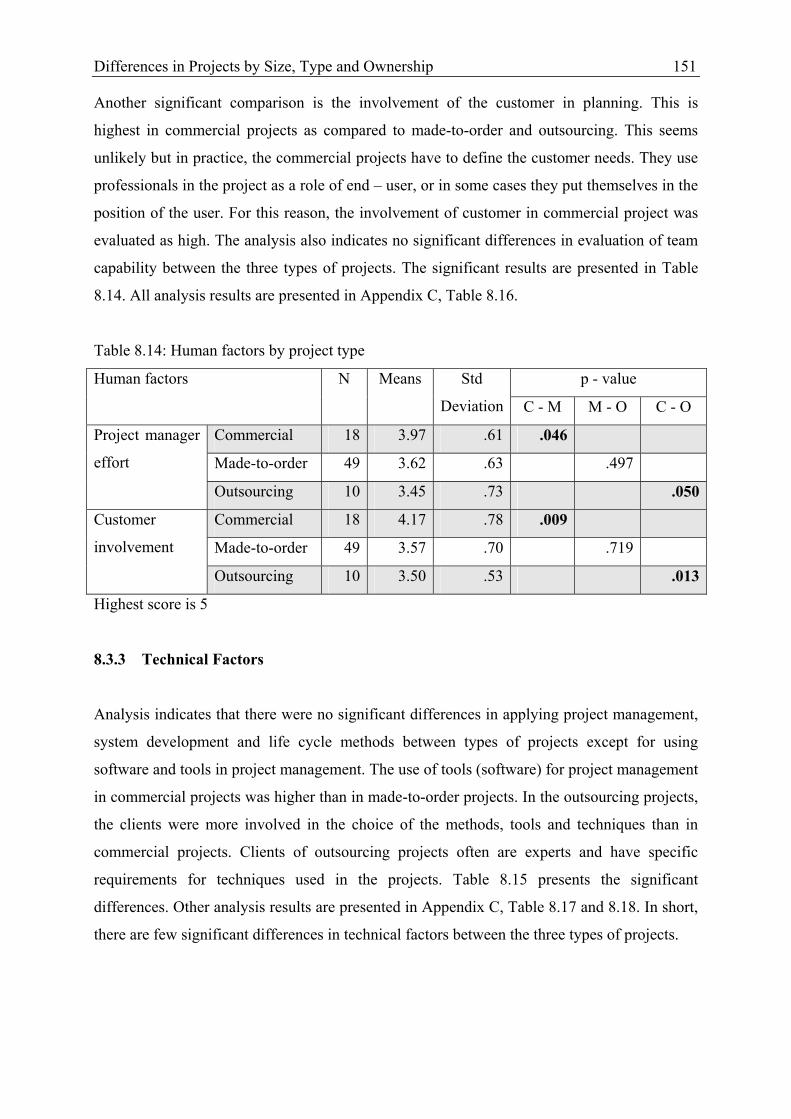
Differences in Projects by Size, Type and Ownership 151
Another significant comparison is the involvement of the customer in planning. This is
highest in commercial projects as compared to made-to-order and outsourcing. This seems
unlikely but in practice, the commercial projects have to define the customer needs. They use
professionals in the project as a role of end – user, or in some cases they put themselves in the
position of the user. For this reason, the involvement of customer in commercial project was
evaluated as high. The analysis also indicates no significant differences in evaluation of team
capability between the three types of projects. The significant results are presented in Table
8.14. All analysis results are presented in Appendix C, Table 8.16.
Table 8.14: Human factors by project type
p - value Human factors N Means Std
Deviation C - M M - O C - O
Commercial 18 3.97 .61 .046
Made-to-order 49 3.62 .63 .497
Project manager
effort
Outsourcing 10 3.45 .73 .050
Commercial 18 4.17 .78 .009
Made-to-order 49 3.57 .70 .719
Customer
involvement
Outsourcing 10 3.50 .53 .013
Highest score is 5
8.3.3 Technical Factors
Analysis indicates that there were no significant differences in applying project management,
system development and life cycle methods between types of projects except for using
software and tools in project management. The use of tools (software) for project management
in commercial projects was higher than in made-to-order projects. In the outsourcing projects,
the clients were more involved in the choice of the methods, tools and techniques than in
commercial projects. Clients of outsourcing projects often are experts and have specific
requirements for techniques used in the projects. Table 8.15 presents the significant
differences. Other analysis results are presented in Appendix C, Table 8.17 and 8.18. In short,
there are few significant differences in technical factors between the three types of projects.

152 Chapter 8
Table 8.15: Technical factors by project type
p - value Technical factors N Means Std
Deviation C - M M - O C - O
Commercial 18 .83 .38 .024
Made-to-order 48 .56 .50 .430
Using software
for project
management Outsourcing 10 .70 .48 .464
Commercial 18 .17 .38 .293
Made-to-order 49 .27 .46 .099
Selection technical
tools and methods
by clients Outsourcing 10 .60 .52 .035
8.3.4 Management Approach
The management approach in projects is considered through the factors of management
support, objectives, communication methods, resource availability, and management style.
Although many aspects of the management approach were assessed, there were no significant
differences between the types of projects. The analysis results are presented in Appendix C,
Table 8.19.
Regarding management support, the analysis indicates that, in general, there were no
significant differences in the top – down and functional support between the three project
types. Analyzing the functional support through the participation of functional departments
during sofware engineering process shows some significant differences. The functional
support in commercial projects is higher than in outsourcing projects (See Table 8.16). This is
because in the commercial projects, software specifications are defined by estimated
requirements. The project team needs information from functional departments like sales,
marketing, or customer service to define the specifications and scope for a commercial
project. Similarly, in made-to-order projects, the project team needs to work closely with
functional departments of the clients to define their requirements. The support of the client’s
functional departments in made-to-order projects is also higher than in outsourcing projects.

Differences in Projects by Size, Type and Ownership 153
Table 8.16 Functional supports by project type
p - value Participation of functional
departments of …
N Means Std
Deviation C - M M - O C - O
Commercial 18 3.89 .68 .078
Made-to-order 49 3.53 .82 .173
Parent
companies
Outsourcing 10 3.20 .63 .014
Commercial 17 3.35 1.41 .513
Made-to-order 48 3.60 1.11 .018
Clients
Outsourcing 10 2.50 1.18 .106
In brief, there were no significant differences in management factors between three project
types. In fact, the management factors are influenced by the parent companies through the
existing policies of human resources, quality management, customer relations, and etc.
Therefore, the management factors will have the same influence on the three types of projects
of a company.
8.3.5 Planning Performance And Project Outcomes
The analysis of planning performance indicated that commercial projects defined
requirements and specifications better than made-to-order and outsourcing projects.
Commercial projects also had a better risk planning than outsourcing projects. The
requirements and specifications of commercial projects are mainly defined by the project
team, not from outside parties. The project team, therefore, can well control software
specifications as well as estimate the risks of their project. The effort spent for planning made-
to-order projects was significantly higher than outsourcing projects. The reason is in made-to-
order projects, the project team has to collaborate with their customers to clearly define the
requirements and software specifications while in outsourcing project, this information is
provided by the client. Table 8.17 presents the analysis results.

154 Chapter 8
Table 8.17: Planning performance of projects by type
p - value N Means Std
Deviation C - M M - O C - O
Commercial 15 27.40 18.83 .390
Made-to-order 48 22.67 16.08 .342
% time for
planning
Outsourcing 10 16.80 17.29 .162
Commercial 10 14.20 12.08 .107
Made-to-order 34 21.93 14.42 .000
% effort for
planning
Outsourcing 7 6.43 3.46 .080
Commercial 18 4.00 .84 .030
Made-to-order 49 3.47 .87 .456
Requirements &
specifications
defining Outsourcing 10 3.20 1.03 .050
Commercial 18 3.61 .98 .439
Made-to-order 49 3.41 .81 .978
Time and effort
estimating
Outsourcing 10 3.40 .84 .556
Commercial 18 4.06 1.06 .356
Made-to-order 49 3.80 .84 .225
Schedule setting
Outsourcing 10 3.30 1.16 .106
Commercial 18 3.44 .92 .356
Made-to-order 49 3.20 .96 .063
Risk analyzing
Outsourcing 10 2.70 .67 .022
There are many project outcomes considered in this analysis. However, there were only
significant differences related in the outcome of meeting specifications defined in different
project types (Table 8.18). The commercial and made-to-order projects were evaluated better
than outsourcing projects in terms of meeting specifications defined in the planning stage. The
clients of outsourcing projects are more professional users or software dealers. Their
requirements and evaluation are harder to satisfy than other clients. The successful
outsourcing projects also did not have a positive evaluation by the parent company like
commercial projects. Other outcomes such as project results in terms of cost and time,
financial and non – financial benefits were not statistically significant between the
commercial, made-to-order and outsourcing projects. All analysis results are presented in
Appendix C, Table 8.20.

Differences in Projects by Size, Type and Ownership 155
Table 8.18: Project outcomes by project type
p - value Project outcomes N Means Std
Deviation C - M M - O C - O
Commercial 18 4.11 .58 .442
Made-to-order 49 3.98 .69 .025
Meet all
specifications
defined in plan stage Outsourcing 10 3.50 .53 .010
8.3.6 Summary
There are few important differences between the three types of projects. Some important
results related to the customer and defining requirements and specifications. The involvement
of the customer in commercial projects was higher than in made-to-order and outsourcing
projects. Defining of customer requirements and product specifications of commercial
projects was also better than other project types.
The other differences between three project types relate to efforts that project managers spent
for planning, the participation of clients in choosing technical methods and techniques applied
in software project, and the support of functional departments. In general, the project manager
effort and the application of technical methods in commercial projects were more than made-
to-order and outsourcing projects. The differences in planning performance and project
outcomes (met product specifications) are related to customer involvement. The customer
involvement was highest in commercial projects. This results in the best of product
specifications satisfaction, and risk analysis of commercial.

156 Chapter 8

157
9
THE RELATIONSHIP BETWEEN PLANNING
FACTORS, PLANNING PERFORMANCE AND
PROJECT OUTCOMES
9.1 INTRODUCTION ........................................................................................................ 158
9.2 DATA ANALYSIS....................................................................................................... 158
9.3 RELIABILITY AND VALIDITY OF MEASURES ................................................... 159
9.3.1 Reliability.......................................................................................................... 159
9.3.2 Content Validity ................................................................................................ 160
9.3.3 Construct Validity ............................................................................................. 160
9.4 CORRELATION ANALYSIS...................................................................................... 162
9.5 MULTIPLE REGRESION ANALYSIS....................................................................... 164
9.5.1 Assumptions in multiple regression analysis .................................................... 164
9.5.2 Estimating the Regression Models.................................................................... 164
9.6 LOGISTIC REGRESSION ANALYSIS...................................................................... 168
9.6.1 Model 1: The relationships between planning factors and planning performance
........................................................................................................................... 168
9.6.2 Model 2: The relationships between planning performance and project success
and outcomes..................................................................................................... 169
9.6.3 Model 3: Relationship between project characteristics and planning performance
........................................................................................................................... 170
9.7 THE IMPACT OF PLANNING FACTORS ON PLANNING PERFORMANCE ..... 170
9.7.1 The Effect Of The Human Factors On Planning Performance ......................... 170
9.7.2 The Effect of Technical Factors on Planning Performance .............................. 172
9.7.3 The Effect of Management Factors On Planning Performance ........................ 174
9.8 THE IMPACT OF PLANNING PERFORMANCE ON PROJECT OUTCOMES..... 176
158 Chapter 9
9.9 THE IMPACT OF PROJECT CHARACTERISTICS ON PLANNING
PERFORMANCE......................................................................................................... 181
9.10 SUMMARY.................................................................................................................. 182
9.1 INTRODUCTION
This chapter presents our main findings. In particular, we disscuss the results of the
correlation and regression analyses and comment a lot of tests of hypotheses in order to verify
the theoretical conjuntures we made. The chapter is completed with the summary of our
findings.
As presented in Chapter Seven, the characteristics of the research sample include the
composition of Vietnamese software companies as well as software projects in terms of
company age, ownership, products, clients and project types, product, client, duration, size (in
terms of the number of people involved in the project team and in different software
engineering tasks). These characteristics are considered in this analysis and discussion about
the findings.
9.2 DATA ANALYSIS
Chapter Four described the model to test the hypotheses that are analyzed in this chapter. The
first model considered the relationships between personnel, technical and management factors
and planning performance. The second model presented the relationships between planning
performance and five project outcomes. The last model also considered the influence of
project characteristics (size and ownership) on the planning performance. Two methods are
employed to test these hypotheses: the classical multiple regression analysis and the binary
logit regression analysis.
The variables used in the analysis of this research are presented in Appendix C, Table 9.1.
Except for the variables that measure a specific value like technical methods applied in the
project, most are operationalized by a multiple-item scale. The most important criterion of the
quality measure is its validity that is, whether the designed measurement is measuring what it
intends to measure (Baker, 1994). It is also important that a measure be consistent, such that
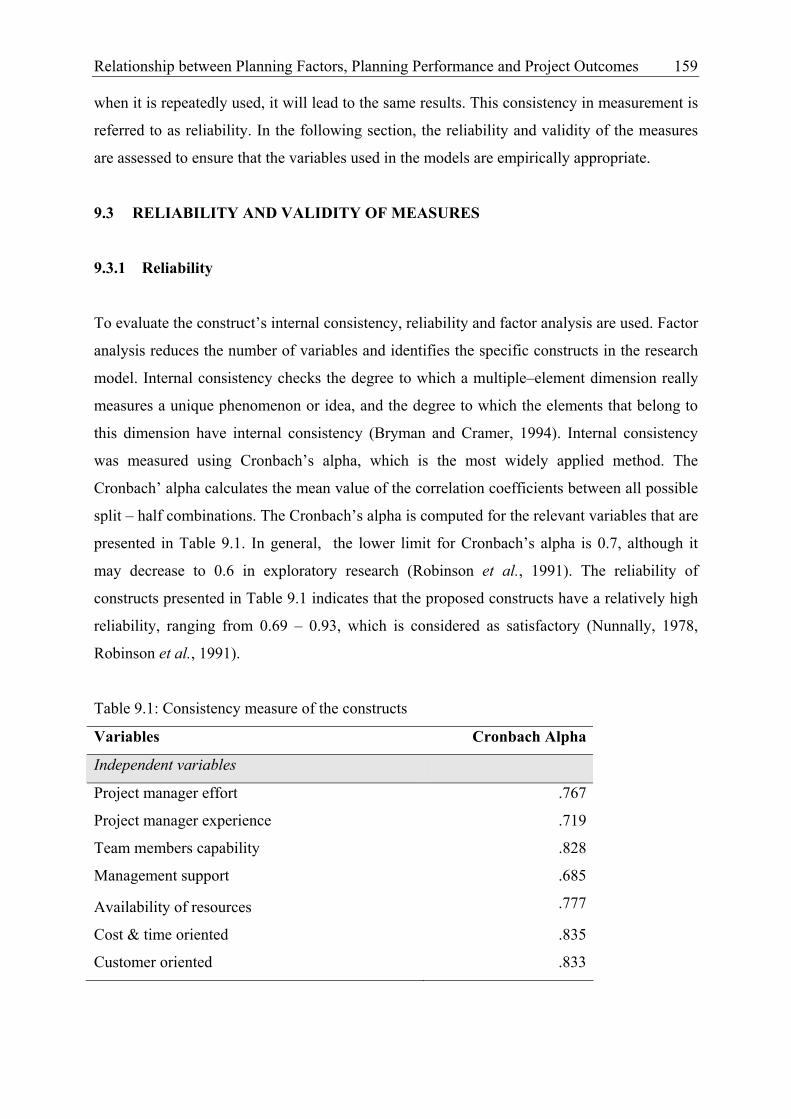
Relationship between Planning Factors, Planning Performance and Project Outcomes
159
when it is repeatedly used, it will lead to the same results. This consistency in measurement is
referred to as reliability. In the following section, the reliability and validity of the measures
are assessed to ensure that the variables used in the models are empirically appropriate.
9.3 RELIABILITY AND VALIDITY OF MEASURES
9.3.1 Reliability
To evaluate the construct’s internal consistency, reliability and factor analysis are used. Factor
analysis reduces the number of variables and identifies the specific constructs in the research
model. Internal consistency checks the degree to which a multiple–element dimension really
measures a unique phenomenon or idea, and the degree to which the elements that belong to
this dimension have internal consistency (Bryman and Cramer, 1994). Internal consistency
was measured using Cronbach’s alpha, which is the most widely applied method. The
Cronbach’ alpha calculates the mean value of the correlation coefficients between all possible
split – half combinations. The Cronbach’s alpha is computed for the relevant variables that are
presented in Table 9.1. In general, the lower limit for Cronbach’s alpha is 0.7, although it
may decrease to 0.6 in exploratory research (Robinson et al., 1991). The reliability of
constructs presented in Table 9.1 indicates that the proposed constructs have a relatively high
reliability, ranging from 0.69 – 0.93, which is considered as satisfactory (Nunnally, 1978,
Robinson et al., 1991).
Table 9.1: Consistency measure of the constructs
Variables Cronbach Alpha
Independent variables
Project manager effort .767
Project manager experience .719
Team members capability .828
Management support .685
Availability of resources .777
Cost & time oriented .835
Customer oriented .833

160 Chapter 9
Dependent variables
Planning performance .769
Success of the project .758
Non- financial benefits of the project .729
Financial benefits of the project .741
9.3.2 Content Validity
Content validity concerns the instrument’s adequacy for the measurement of the concept or
idea that it measures. The measures should represent all the ideas relevant to a conceptual
space (Neuman, 2000). The validity comes from the process to construct the conceptual
framework and specify measurements. In this study, the conceptual framework and
measurements are based on theory and previous studies. Many relevant results from other
studies were reviewed in Chapter Two and Chapter Three providing the foundation for this
study. The summary thereof establishes validity of the content.
9.3.3 Construct Validity
Construct validity relates to measures with multiple indicators. A construct is valid when its
multiple measures operate in similar way and also diverge from opposing constructs. Factor
analysis is conducted to provide evidence for the discriminant and convergent validity of the
measures. The Kaiser Meyer Olkin test of sampling adequacy (KMO) is used to certify that
factor analysis could be applied to the variables of each category. Then principal components
analysis and an oblique rotation were used to extract those factors required to adequately
describe the variables in each category.
The results indicated uni-dimensionality of every construct. Most of the loadings approached
or exceeded 0.8. This provides support for the validity of the measurement. Parameters
estimated by factor analysis are presented in Appendix C, Table 9.2. In the following sections,
the validity of the variables will be analyzed.

Relationship between Planning Factors, Planning Performance and Project Outcomes
161
The validity of planning factors
Planning factors include human, technical and management factors. However, reliability and
validity assessment are only applied for human and management factors because the technical
factors are measured by nominal scale.
The descriptive statistics for the human factors were presented in Chapter Seven, Table 7.3.
The factor analysis identified two items of project manager effort as a single factor that
explains 81% of the variance. The five items that measure the project manager experience is
grouped as a single variable. The eigenvalue is 2.407 to explain 48% of the variance.
Similarly, the factor analysis carried out for three items of team member ability yielded a
single factor that explains 75% of the variance. Because customer involvement is measured
by only one item, factor analysis is not applied.
There are three specific management factors, including management support, project
objectives and resource availability. To increase the valid observations of management
support, the item of “committed sponsor” was excluded because only half of the projects have
sponsors. The factor analysis carried out on the observations of three items of management
support yielded a single factor that explains 51% of the variance. Four items of project
objectives were grouped into two factors including cost and time oriented and customer
oriented with the percentage of total variance is 55% and 31% respectively. Similarly, four
items of variables of Resource availability were also grouped into one factor with the
percentage of total variance is 61. In this analysis, only the “customer oriented” variable had
an average validity based on the percentage of variance; the others had adequate validity.
The validity of planning performance
The planning performance is measured through four items. The result of factor analysis
created only one factor that explains 59% of the variance.
The validity of project results
Project outcomes are considered by different aspects, including six items to measure different
outcomes of the project and four items to measure the success of the projects in different
viewpoints.

162 Chapter 9
Project success is considered through the evaluation of different perspectives of a software
project. Because not all projects have sponsors, the item “Success –from the sponsor point of
view” was excluded. Factor analysis produced only one item, which is called “success of the
project”, that explains 67% of the variance. Factor analysis for six items of project outcomes
produced two factors, called Qualitative benefits or Non-financial benefits that explains 55%
of the variance and Financial benefits that explains 79% of the variance.
9.4 CORRELATION ANALYSIS
Correlation analysis is conducted to consider the relationship between the variables. Table 9.2
presents the results of the correlation analysis between 16 variables, in which the variables
from 1 to 15 are planning factors and variable 16 is planning performance. There is a
significant correlation between planning performance and team members’ ability, project
manager effort, customer involvement, applying project management method, management
support, both project objectives like cost and time oriented and customer oriented and
resource availability. The correlation analysis indicated that, most of human factors are
correlated to planning performance while only one of the technical factors was related. In the
management factors, only management style had no correlation with planning performance.
There are also some correlations between the independent variables. The significant
correlations between the above variables are not considered the causal relationships between
planning factors (independent variables) and planning performance (dependent variable) and
project outcomes (dependent variables).
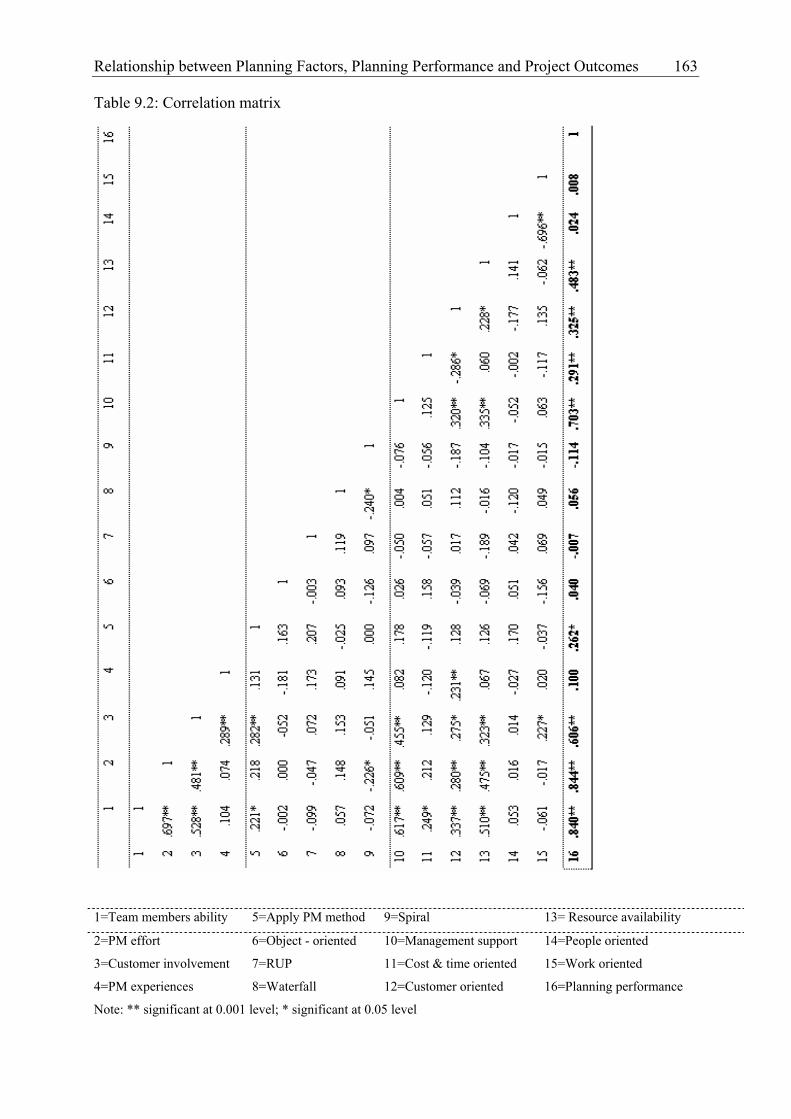
Relationship between Planning Factors, Planning Performance and Project Outcomes
163
Table 9.2: Correlation matrix
1=Team members ability 5=Apply PM method 9=Spiral 13= Resource availability
2=PM effort 6=Object - oriented 10=Management support 14=People oriented
3=Customer involvement 7=RUP 11=Cost & time oriented 15=Work oriented
4=PM experiences 8=Waterfall 12=Customer oriented 16=Planning performance
Note: ** significant at 0.001 level; * significant at 0.05 level

164 Chapter 9
Based on the conceptual framework and the hypotheses developed in Chapter Four, the
regression models, including Models 1, 2 and 3 are tested. Discussion of the qualitative
responses obtained is incorporated with the statistical results since they add clarification to the
findings.
9.5 MULTIPLE REGRESION ANALYSIS
The first technique to examine the hypotheses is multiple regression analysis. This section
also checks if the hypotheses of the clasical multiple linear regression model are tenable or
not and presents estimated the regression models (Model 1 – 3) and their overall fit.
9.5.1 Assumptions in multiple regression analysis
The classical multiple linear regression model supposes the linearity of the functional form,
and the homokedasticity, no correlation, and normality of the error terms. These assumptions
are considered for every model.
We can detect problems of autocorrelation, heteroskedasticity and nonlinerity by considering
the plot of the residual values. If the pattern of the residuals seems random, we can suppose
that there are no such problems. This simple verification was made and, indeed, the scatter
plots of Model 1, 2, and 3, presented in Appendix C, Figures 9.1 – 9.3, don’t signal any
particular problem. Besides, the histograms of the standardized residual (Figures 9.4 – 9.6)
suggest that the normality assumption of the error terms is also met. At least, it seems that we
don’t encouter any multicollinearity problem.
9.5.2 Estimating the Regression Models
This section presents the statistical significant of three regression models. The conclusions of
hypotheses are drawn from the significance of the overall model and the significance of the
regression coefficients.

Relationship between Planning Factors, Planning Performance and Project Outcomes
165
9.5.2.1 Model 1: The relationships between planning factors and planning performance
The Model 1 expresses the relationship between planning performance (dependent variable)
and human, technical and management factors (independent variables). The regression results
in Table 9.3 indicate that, together the sixteen variables explain 86% of the variance in
planning performance (r2 = .855) and the model is statistically significant at the 0.05 level (F-
test). There are 5 independent variables that have significant relationships with planning
performance, including project manager effort, team members’ ability, customer involvement,
management support and cost and time oriented objective. The correlation coefficients are
also shown in Table 9.3.
Table 9.3: Multiple Regression Results of Model 1
(Dependent variable: Planning performance - Degree of freedom: 79)
Independent variables (β) S.E (β) t – value Sig.
(Constant) -1.050 0.459 -2.288 0.025
PM effort 0.442 0.094 4.702 0.000
PM Experiences -0.049 0.062 -0.782 0.437
Team members ability 0.319 0.101 3.144 0.003
Customer involvement 0.134 0.063 2.119 0.038
Apply PM method 0.014 0.078 0.180 0.858
Object - oriented 0.052 0.071 0.725 0.471
RUP 0.072 0.079 0.971 0.335
Waterfall -0.105 0.096 -1.092 0.279
Spiral -0.011 0.093 -0.115 0.909
Management support 0.154 0.066 2.338 0.023
Cost & time oriented 0.118 0.058 2.016 0.048
Customer oriented -0.019 0.105 -0.012 0.858
Resource availability 0.039 0.063 0.615 0.541
People oriented 0.011 0.049 0.224 0.823
Work oriented 0.005 0.043 0.119 0.906
R2 = 0.855 Adjusted R2 = 0.821 F = 25.161 Sig. F = 0.000

166 Chapter 9
9.5.2.2 Model 2: The relationships between planning performance and project success and
outcomes
The effect of planning performance on project outcomes is considered by the Model 2
(including model 2a – model 2e) with the independent variable as planning performance and
dependent variable as project outcomes. Hypotheses H4a – 4e are tested through the use of
these five regression models with different dependent variables and planning performance (as
the independent variable). The results are presented in Table 9.4.
Table 9.4: Multiple Regression Results of Model 2
Independent variables (β) S.E (β) t – value Sig.
Model 2a: Dependent variable: Project success
(Constant) 1.239 .364 3.399 .002
Planning performance .664 .106 6.385 .000
R2 = 0.545 Adjusted R2 = 0.531 F = 39.504 Sig. F = 0.000
Model 2b: Dependent variable: Qualitative benefits
(Constant) 2.876 .236 12.177 .000
Planning performance .347 .066 5.270 .000
R2 = 0.263 Adjusted R2 = 0.253 F = 27.777 Sig. F = 0.000
Model 2c: Dependent variable: Financial benefits
(Constant) 2.191 0.322 6.813 0.000
Planning performance 0.384 0.090 4.288 .000
R2 = 0.191 Adjusted R2 = 0.180 F = 18.387 Sig. F = 0.000
Model 2d: Dependent variable: Completion time
(Constant) 3.753 .481 7.801 .000
Planning performance -.695 .105 -6.631 .000
R2 = 0.360 Adjusted R2 = 0.352 F = 43.965 Sig. F = 0.001
Model 2e: Dependent variable: Completion cost
(Constant) 3.753 .481 7.801 .000
Planning performance -.445 .134 -3.317 .001
R2 = 0.352 Adjusted R2 = 0.124 F = 11.003 Sig. F = 0.001
All five models are statistically significant at the 0.05 level. This result indicates the
significant relationships between all five dependent variables and planning performance. The

Relationship between Planning Factors, Planning Performance and Project Outcomes
167
R2 ranges from 0.124 to 0.531 indicate that the regression models fit to 12.4% to 53.1% of
data. The regression coefficients (β) are also significant. This confirms again the relationships
between planning performance and project success and outcomes.
9.5.2.3 Model 3: The relationship between project characteristics and planning performance
The model 3 is to examine the assumptions of the impacts of project characteristics on
planning performance. These hypotheses are also analyzed by using multiple regression
models. For testing these hypotheses, a new model is developed (Model 3) with two more
independent variables to represent the project size and ownership. These are considered as
dummy variables. The regression analysis is presented in Table 9.5.
Table 9.5: Multiple Regression Results of Model 3
(Dependent variables: Planning performance - Degree of freedom: 68)
Independent variables (β) S.E (β) t – value Sig.
(Constant) -1.204 .467 -2.576 .013
Project manager effort .424 .095 4.483 .000
Project manager experiences -.044 .064 -.694 .491
Team members ability .284 .104 2.718 .009
Customer involvement .168 .068 2.463 .017
Apply PM method .004 .080 .048 .962
Object - oriented .059 .074 .801 .427
RUP .020 .091 .217 .829
Waterfall -.065 .098 -.660 .512
Spiral .039 .101 .385 .702
Management support .194 .070 2.790 .007
Cost and time oriented .208 .095 2.187 .033
Customer oriented -.108 .108 -1.000 .322
Resource availability .087 .066 1.329 .190
People oriented .015 .049 .311 .757
Work oriented .021 .043 .493 .624
Project size .104 .080 1.289 .203
Project ownership .029 .096 .308 .759
R2 = 0.875 Adjusted R2 = 0.836 F = 22.28 Sig. F = 0.000

168 Chapter 9
The regression results in Table 9.6 indicate that, this model is statistically significant at 0.05
level of F – test. This model explains 87.5% the variance in planning performance (r2 = .875).
However, the project characteristic variables do not influence the planning performance (the
regression coefficients are not significant).
9.6 LOGISTIC REGRESSION ANALYSIS
The type of the dependent variable of our models is principally nominal. This fact can conduct
to several difficulties in the estimation. In order to take it into account, we try therefore to
reestimate our models with a logistic regression approach.
To apply the logistic regression analyses for Model 1 – Model 3, the dependent variables,
such as planning performance, project success, qualitative benefits, financial benefit,
completion time, and completion cost were recoded as binary variables, in which 1
represents satisfaction and 0 represents dissatisfaction. The logstic regression model permits
us to estimate the probability of satisfaction. The estimated parameters by the regression are
not always easy to interpret. But nevertheless, we are able to test the pertinence of a model
and its variables. The model is tested by a chi-square test for – 2LL (- 2 log likelihood) and
the Wald statistic permits us to test individual coefficients. The estimated percentage of
prediction is also used to assess the fit of the model.
9.6.1 Model 1: The relationships between planning factors and planning performance
The logistic regression analysis for Model 1 is presented in Table 9.6. The results indicate that
the model is statistically significant. The value of -2LL of 18.563 indicates the good fit of
overall model. However, the Wald statistic indicates that only one independent variable, i.e
the manager’s effort, is significant at a level of 5%.
Table 9.6: Logistic regression analysis for the model 1
Independent variables (β) S.E (β) Wald df Sig.
(Constant) -100.426 40.447 6.165 1 .013
Project manager effort 7.319 3.472 4.444 1 .035
Project manager experiences .667 2.119 .099 1 .753
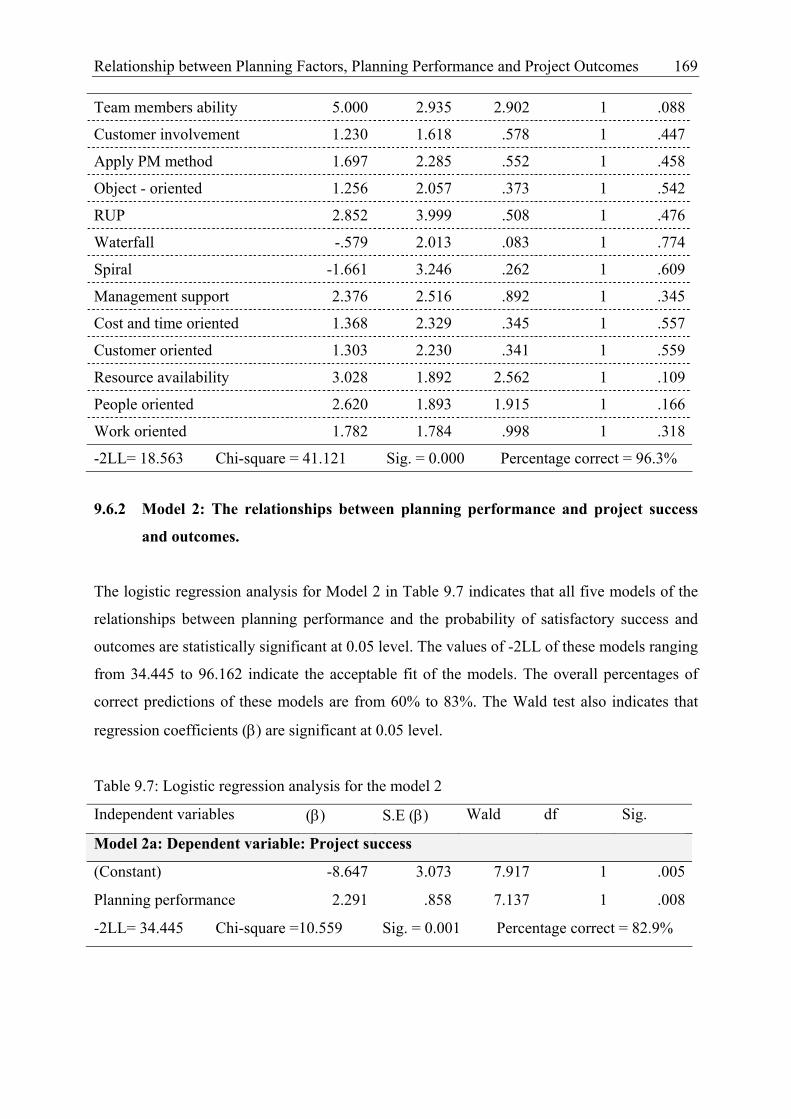
Relationship between Planning Factors, Planning Performance and Project Outcomes
169
Team members ability 5.000 2.935 2.902 1 .088
Customer involvement 1.230 1.618 .578 1 .447
Apply PM method 1.697 2.285 .552 1 .458
Object - oriented 1.256 2.057 .373 1 .542
RUP 2.852 3.999 .508 1 .476
Waterfall -.579 2.013 .083 1 .774
Spiral -1.661 3.246 .262 1 .609
Management support 2.376 2.516 .892 1 .345
Cost and time oriented 1.368 2.329 .345 1 .557
Customer oriented 1.303 2.230 .341 1 .559
Resource availability 3.028 1.892 2.562 1 .109
People oriented 2.620 1.893 1.915 1 .166
Work oriented 1.782 1.784 .998 1 .318
-2LL= 18.563 Chi-square = 41.121 Sig. = 0.000 Percentage correct = 96.3%
9.6.2 Model 2: The relationships between planning performance and project success
and outcomes.
The logistic regression analysis for Model 2 in Table 9.7 indicates that all five models of the
relationships between planning performance and the probability of satisfactory success and
outcomes are statistically significant at 0.05 level. The values of -2LL of these models ranging
from 34.445 to 96.162 indicate the acceptable fit of the models. The overall percentages of
correct predictions of these models are from 60% to 83%. The Wald test also indicates that
regression coefficients (β) are significant at 0.05 level.
Table 9.7: Logistic regression analysis for the model 2
Independent variables (β) S.E (β) Wald df Sig.
Model 2a: Dependent variable: Project success
(Constant) -8.647 3.073 7.917 1 .005
Planning performance 2.291 .858 7.137 1 .008
-2LL= 34.445 Chi-square =10.559 Sig. = 0.001 Percentage correct = 82.9%

170 Chapter 9
Model 2b: Dependent variable: Qualitative benefits
(Constant) -2.806 1.583 3.141 1 .076
Planning performance 1.251 .485 6.650 1 .010
-2LL= 72.092 Chi-square = 7.969 Sig. = 0.005 Percentage correct = 78.8%
Model 2c: Dependent variable: Financial benefits
(Constant) -4.464 1.403 10.127 1 .001
Planning performance 1.105 .381 8.422 1 .004
-2LL= 96.172 Chi-square = 9.678 Sig. = 0.002 Percentage correct = 70%
Model 2d: Dependent variable: Completion time
(Constant) -9.314 2.129 19.136 1 .000
Planning performance 2.683 .610 19.350 1 .000
-2LL= 74.880 Chi-square = 35.973 Sig. = 0.000 Percentage correct = 73.8%
Model 2e: Dependent variable: Completion cost
(Constant) -3.594 1.371 6.869 1 .009
Planning performance 1.190 .398 8.929 1 .003
-2LL= 95.165 Chi-square = 10.685 Sig. = 0.001 Percentage correct = 66.3%
9.6.3 Model 3: Relationship between project characteristics and planning performance
The model 3 was also estimated by a logistic regression model. Unfortunately, the results are
not significant.
9.7 THE IMPACT OF PLANNING FACTORS ON PLANNING PERFORMANCE
The impact of planning factors on planning performance is examined by Model 1. This model
is statistical significant. The meanings of each relationship are discussed in following
sections. Due to the complex of the meaning of coefficient in logistic regression, the
relationships are mainly discussed based on the coefficients in multiple regression models.
9.7.1 The Effect Of The Human Factors On Planning Performance

Relationship between Planning Factors, Planning Performance and Project Outcomes
171
Hypothesis 1a: The positive effect of Project manager effort on planning performance
It is hypothesized that planning performance is better when the project manager puts more
effort on planning. The multiple regression results in Table 9.3 indicate the significant
positive relationship between project manager effort and planning performance supporting
hypothesis 1a. The interviews reveal that project managers usually remember the project in
which they spent more efforts . The study found that the project manager spends about 18% of
their effort and 22% of their time for planning. This is quite high as compared to the findings
of Sauer and Cuthbertson (2003). In their study, the project managers spent about 12.3% of
their time for planning. This difference could come from the variations in project size and
duration. The role of the project manager’s effort to planning performance supports and
complements the findings of previous research, in which the role of project manager is
important for project success (Callahan and Moretton, 2001; Nguyen M, 2003).
Hypothesis 1b: The positive effect of Project manager experiences on planning performance
It is assumed that project managers with more experience will produce the better planning
performance. However, both multiple and logistic regression analysis shows this relationship
is statistically insignificant. Project managers in this study have, on average, three years of
experience in the position of project management and have managed six projects. Although
the project managers highly evaluated the role of their experience for managing the project
team (82.5%) or for communication with customer and defining scope and objectives of
projects (71%), the project manager’s experience is not related to planning performance.
However, there is a significant positive relationship between project manager’s experience
and project success. Appendix C, Table 9.8), demonstrates that project manager’s experience
is important to the overall project rather than only in planning stage.
Hypothesis 1c: The positive effect of Team member ability on planning performance
Project personnel are mostly professional team members. It is assumed that the higher the
team members' capabilities are (in terms of knowledge, experience and attitude), the better the
planning performance they produce. The multiple regression results in Table 9.3 indicate a
significant positive relationship between team member capability and planning performance

172 Chapter 9
(β = .287). The role of team members is also important in producing a good plan. Their
knowledge in system development and requirement analysis contributes much to defining
software specifications, which is necessary to produce an effective plan. This finding also
supports previous studies (Krishnan, 1998; Belout and Gauvreau, 2003).
To achieve a good planning performance, the role of project personnel, including both project
manager as well as team members, is important. With the project managers, the amounts of
efforts spent for planning with team members are their capabilities.
Hypothesis 1d: The positive effect of Customer involvement on planning performance
Customers are considered as external project members. This is because of their close
relationship to the software engineering process. It is assumed that the higher rate of customer
involvement, the better of producing planning performance. The multiple regression results in
Table 9.3 indicate a positive significant relationship between customer involvement and
planning performance (β = .142). Although many project managers said their customers did
not understand deeply the software engineering and sometimes could not define clearly their
requirements, a better plan could be developed with the customer’s involvement. Project
managers explained that the involvement of the customer in the early stage of project helps
the project team understand customer’s needs and capture their requirements. This result is
consistent with the previous studies.
9.7.2 The Effect of Technical Factors on Planning Performance
There are three popular types of methods usually applied in a software project. These are the
project management methods, system development methods and life - cycle methods. This
study assumes that applying the different methods influences planning performance. Many
different system development and life – cycle methods are listed in the survey. The most
frequent methods or techniques are included in regression model.
Hypothesis 2a: The influence of applying project management method on planning
performance

Relationship between Planning Factors, Planning Performance and Project Outcomes
173
It is hypothesized that a project, which applied a specific project management method has
better planning performance. Both the results of multiple and logistic regression do not show
a significant relationship between project management methods applied in project and
planning performance. This hypothesis is not supported. A correlation test (Pearson test)
presented in the Table 9.2, seems to suggest there is a minor correlation between applying
project management method and planning performance (correlation coefficient r = 0.262,
significant at 0.05 level). The results of the regression analyses do not support Hypothesis 2a.
The project managers in this survey indicated that software projects usually apply MS Project
tools. Very few projects apply methods that are specifically designed for software project.
Some companies have designed project management procedures and tools for themselves.
White and Fortune (2002) studied the application of project management techniques and
found that project management software is frequently used in projects. It means that most of
software projects have applied a certain range of project management methods. This could be
the reason why applying project management method does not influence planning
performance.
Hypothesis 2b: The influence of applying a system development method on planning
performance
It is assumed that, applying different system development methods influences the process of
software engineering and planning performance. Theoretically, there are many kinds of
system development methods. This research suggests the two most popular methods: Object –
oriented (29%) and RUP (44%). The regression model (Model 1) uses two of these methods
as the independent variables. The results are shown in Table 9.3. The results do not reveal a
significant relationship between these variables and planning performance. Hypothesis 2b is
not supported.
Hypothesis 2c: The effect of applying life – cycle method on planning performance
It is hypothesized that, applying different system development methods influence the process
of software engineering and planning performance. Verner, Overmyer and McCain (1999)
studied the influence of applying different life-cycle methods on project outcomes. They
found that applying the wrong methodology could lead to project failure. The findings

174 Chapter 9
indicate two methods most applied in software projects are Spiral (20%) and Waterfall (19%).
Two methods were then used as independent variables in the Model 1. The results of both
multiple and logistic regression indicate an insignificant relationship between applying life –
cycle methods (both Waterfall and Spiral).
In fact, the application of project management techniques and methods (including life-cycle
methods) in software companies is not very systematic, except for some big companies. The
software projects usually apply basic tools for project management, meanwhile many project
managers do not know about the life-cycle method. This is the reason why the application of
the methods has not influenced the planning performance and project outcomes.
Not too many researches have studied the role of applying different methods of project
management, while system development and life- cycle are usually used in software projects.
This study does not find support for the relationship between applying these methods and
planning performance.
9.7.3 The Effect of Management Factors On Planning Performance
Many previous studies considered Management as an important factor influencing the project
success. From the conceptual framework, this study examined the relationships between four
management factors, including management support, project objectives, resource availability
and management style, and planning performance.
Hypothesis 3a: The positive effect of management support on planning performance
It is assumed that more management support results in better planning performance.
Management support includes both top managers and functional departments. This
relationship is statistically positive significant in the multiple regression only. This means
more support from top management and functional departments relate to better planning
performance. The important role of management support has been identified in other
researches. Belout and Gauvreau (2003) found that management support is a significant
predictor of project success, not only in the planning stage but also throughout the project.
This hypothesis is supported and the study of Belout and Gauvreau (2003) is confirmed.

Relationship between Planning Factors, Planning Performance and Project Outcomes
175
Hypothesis 3b: The effect of project objectives on planning performance
It is hypothesized that the differences in setting priority project objectives will influence the
planning performance. Abdel-Hamid and Swett (1999) found that the difference in project
goals focused on the “cost and schedule” or “quality and schedule” influenced the project
outcomes. With the given specific software project goals, managers plan and make resource
allocation choices to meet those goals. This study considers the role of planning in the
influence of project objectives on project outcomes. The multiple regression analysis of
Model 1 in Table 9.3 only reveals a significant relationship between the objective of cost and
time orientation and planning performance. The correlation analysis (Pearson test) results in
Table 9.2 show the correlations between both objectives (cost and time oriented and customer
oriented) and planning performance (correlation coefficient r = 0.291 and r = 0.325
respectively, significant p<0.05). Project objectives only partially relate to planning
performance. Hypothesis 2b is partially supported. However, the logistic regression analysis
did not indicate the impact of both objectives on the probability of satisfactory planning
performance.
Considering the relationship between planning factors and project outcomes by multiple
regression analysis, there is the significant relationship between the customer – oriented goal
and qualitative benefits (Appendix C, Table 9.9) and between cost/ time oriented goal and
completion time (Appendix C, Table 9.10). The results imply that the impact of project
objectives on project outcomes is clearer than that on project performance. Planning
performance is not influenced by the project objectives.
Hypothesis 3c: The positive effect of resource availability on planning performance
This study assumed that the higher availability of resources, the better the project manager
could use resources, that is relating to better planning performance. The results of both
multiple and logistic regressions do not indicate a significant relationship between resources
availability – both financial and human availability – and planning performance. The
correlation analysis in Table 9.2, however, indicated a significant correlation between these
variables. The correlation does not appear in the regression model when all variables are
considered together. The hypothesis is not supported.
176 Chapter 9
In fact, most projects are small and the constraint of resources is not a problem (only 18% and
10% projects have low availability of manpower and finance, respectively). Therefore, the
availability of resources does not significantly influence the planning performance.
Hypothesis 3d: The positive effect of people – oriented leadership style on planning
performance
It is hypothesized that the difference in management style of a project will influence planning
performance. Management style in this study refers to the leadership styles. The two most
popular leadership styles are examined, including People oriented and Work oriented. These
variables are included in the regression Model 1.
In a software project, people are the main input developing software products. A people –
oriented leadership style seems to be appropriate for software projects. The effect of this style
considered in the regression Model 1. The analyses by both multiple and logistic, however,
indicates no significant relationship between the people – oriented style and planning
performance or the probability of satisfied planning performance. The relationships between
work – oriented style and planning performance were also analyzed in Table 9.3 and 9.6. The
results indicated no significance relationship. Hypothesis 3d is not supported.
Managers in software projects do not have a consistent management style. In some projects,
they applied both the work – oriented and people - oriented styles. Some other managers
could not identify their management style. This could be the reason why there is no
relationship between management style and planning performance.
9.8 THE IMPACT OF PLANNING PERFORMANCE ON PROJECT OUTCOMES
The discussions of relationships between planning performance and project success and
outcomes tested by models of multiple and logistic regression are presented in this section. It
is assumed that planning performance significantly impacts the evaluation of overall success
of all four project outcomes. The better planning performance relates to more likely project
success in which both financial and qualitative benefits are better, and completion time and
costs are lower. The multiple and logistic regression analyses for each hypothesis are
presented in Tables 9.4 and 9.7. The impact of planning performance is also analyzed deeply

Relationship between Planning Factors, Planning Performance and Project Outcomes
177
by considering planning performance composed into four items, including defining
requirements and specifications, estimating time and effort, scheduling and risk analysis. The
linear multiple regression is carried out for this analysis.
Hypothesis 4a: The planning performance positively effects project success
Project success is evaluated through perception from different perspectives, such as the
project manager, the customer, the parent company and the sponsor. The factor analysis
indicated that these items could be grouped as a uni-dimensional project success variable. The
multiple and logistic regression analyses are conducted between planning and the evaluation
of overall success and project results presented in Table 9.4 and 9.7. These results indicate
the statistically significant relationship. This causal relationship indicates that better planning
performance is related to higher project success.
The analysis for relationship between project success and four aspects of planning is
presented in Table 9.8. This finding indicates two significant relationships between “well
defined requirements and specifications” and “well defined schedule” with project success.
The success of a project depends on these tasks of planning more than other tasks. Based on
the interviews, the skills of project managers in the risk analysis of projects are not good, even
in projects evaluated as the successful ones. This accounts for the insignificant relationship
between project success and the risk analysis of a project.
Table 9.8: Project success and planning tasks
Independent variables (β) S.E (β) t – value Sig.
(Constant) 1.219 0.371 3.285 0.003
Well defined requirements and specifications 0.279 0.084 3.304 0.002
Well estimated time and effort 0.093 0.092 1.006 0.323
Well defined scheduling 0.169 0.078 2.182 0.037
Well analyzed risks 0.123 0.088 1.396 .173
R2 = 0.579 Adjusted R2 = 0.523 F = 0.332 Sig. F = 0.000
Dependent variable: Project success

178 Chapter 9
Hypothesis 4b: The planning performance positively effects qualitative benefits of a project
Qualitative benefits of a software project include results like meeting the product
specifications, customer satisfaction, enhancing the company image and improving the team
members’ ability. The multiple and logistic regression analysis indicated the significant of the
relationship between planning performance and qualitative benefits (Table 9.4 and 9.7) at the
0.05 level. The relationship between planning performance and qualitative benefits is positive
and significant. This section considers the effects of four tasks of planning on the qualitative
benefits. Multiple regression analysis is presented in Table 9.9. The results indicate that there
are two major planning tasks, such as defining requirements and specifications and setting
schedule, that significantly influence the qualitative benefits of a project.
Table 9.9: Qualitative benefits and planning tasks
Independent variables (β) S.E (β) t – value Sig.
(Constant) 2.767 .229 12.056 .000
Well defined requirements and specifications .192 .058 3.277 .002
Well estimated time and effort .102 .067 1.524 .132
Well defined scheduling .140 .055 2.551 .013
Well analyzed risks -.076 .060 -1.257 .213
R2 = 0.350 Adjusted R2 = 0.315 F = 10.077 Sig. F = 0.000
Dependent variable: Qualitative benefits
Hypothesis 4c: The planning performance positively affects financial benefits of a project
The financial benefits of a project are the monetary benefits that a software project achieves
for its parent company or team members. The relationship between planning performance and
this outcome are significant at the 0.05 level by both multiple and logistic regression analyses.
The results indicate that planning performance positively contributes to financial benefits.
Considering this relationship in more detail, the regression results in Table 9.10 show that
better estimates time and effort would lead to higher financial benefits. This result is very
different from the qualitative benefits that were influenced by defining requirements and
specifications and setting the schedule.

Relationship between Planning Factors, Planning Performance and Project Outcomes
179
Table 9.10: Financial benefits and planning tasks
Independent variables (β) S.E (β) t – value Sig.
(Constant) 2.133 0.322 6.632 0.000
Well defined requirements and specifications 0.088 0.082 1.077 0.285
Well estimated time and effort 0.300 0.094 3.185 0.002
Well defined scheduling 0.038 0.077 .501 0.618
Well analyzed risks -0.029 0.085 -.347 0.729
R2 = 0.244 Adjusted R2 = 0.204 F = 6.053 Sig. F = 0.000
Dependent: Financial benefits
Hypothesis 4d: The planning performance negatively affects completion time of a project
The relationship between planning performance and the completion time of a project were
analyzed by the multiple and logistic regression that presented in Table 9.4 and 9.7. The
results indicate that the models are significant at the 0.05 level. Planning performance is
significantly and related to completion time (βmultiple = -.695; βlogistic = 2.683). The better
planning performances result in the quicker completion times. In logistic regression, the better
planning performance relates to higher probability of project finishing on time. The in – depth
analysis for different tasks of planning indicates that the better project outcome in terms of
completion on time is the result of “well estimated time and effort” and “well defined
scheduling”. The significant negative relationship between these items and completion time (β
= - .281 and - .315) in Table 9.11 supports this hypothesis.
Table 9.11: Completion time and planning tasks
Independent variables (β) S.E (β) t – value Sig.
(Constant) 5.017 0.376 13.346 .000
Well defined requirements and specifications -0.027 0.096 -0.284 .777
Well estimated time and effort -0.281 0.110 -2.549 .013
Well defined scheduling -0.315 0.090 -3.507 .001
Well analyzed risks -0.080 0.099 -0.806 .423
R2 = 0.402 Adjusted R2 = 0.370 F = 12.607 Sig. F = 0.000
Dependent variable: Completion time

180 Chapter 9
Hypothesis 4e: The planning performance negatively affects completion cost of a project
The multiple and logistic regression models of the relationship between planning performance
and completion cost are significant at the 0.05 level. The negative relationship (in multiple
regression model) indicates that the better the planning performance is, the lower the project
costs. The logistic regression analysis indicates a similar result, that is the better planning
performance increases the ratio of probability of satisfied and probability of dissatisfied
project in term of cost occurring (positive relationship). The regression results in Table 9.12
clarifies this relationship by multiple regression analysis. The lower completion cost is mainly
the result of the better estimation of project time and effort.
Table 9.12 Completion cost and planning tasks
Independent variables (β) S.E (β) t – value Sig.
(Constant) 3.736 0.472 7.921 0.000
Well defined requirements and specifications 0.089 0.120 0.746 0.458
Well estimated time and effort -0.455 0.138 -3.295 0.002
Well defined scheduling -0.002 0.113 -0.016 0.987
Well analyzed risks -0.087 0.124 -0.700 0.486
R2 = 0.213 Adjusted R2 = 0.171 F = 5.085 Sig. F = 0.001
Dependent variable: Completion cost
In brief, these results confirm the importance of planning related to the overall project
outcomes. The hypotheses 4a – 4e, therefore, are fully supported. Better planning
performance contributes to better outcomes like financial and qualitative benefits. The
important tasks of planning are defining requirements and specifications, estimating project
time and effort and scheduling. The impact of risk analysis on project outcomes is not very
clear. From interviews, risk analysis in software project is evaluated being weak by most
projects (67% projects assessed the risk analysis in their project as inadequate). The role of
the risk analysis in planning should be analyzed more deeply. Its effects can be identified
when there is a diversification of risks performance among projects.
The results of Dvir et al. (2002) also found a positive relationship between project planning
and overall project success evaluated by four measures, including meeting planning goals,
Relationship between Planning Factors, Planning Performance and Project Outcomes
181
end-user benefits, contractor benefits and overall project success. This study not only
confirms, but also compliments their findings by considering more criteria of project success.
Planning performance is a major of explanatory variable in the model. It supports the
influence of the project manager’s effort, team member’ ability, customer involvement and
management support on project success through planning performance.
9.9 THE IMPACT OF PROJECT CHARACTERISTICS ON PLANNING
PERFORMANCE
The project characteristics including size and ownership are assumed to influence the
planning performance of a project. Projects with a different size, or ownership could vary in
planning performance. These relationships are analyzed by multiple regression.
Hypothesis 5a: The negative influence of project size on planning performance
The software projects in this study are classified as of bigger and smaller size group. A
dummy variable called project size was added in the model. The results in Table 9.5 indicate
having no significant relationship between project size and planning performance. There is no
difference in planning performance between software projects by size. Hypothesis H5a is not
supported. The reason is that if the project size in this survey was mostly small, the
differences in project sizes would not be sufficient enough to determine differences in
managing the project or project outcomes.
Hypothesis 5b: The influence of project ownership on planning performance
Software projects are classified related to local or international software companies. The
dummy variable of project ownership is included in the Model 3. The result in Table 9.5
indicates there is no relationship between project ownership and planning performance.
Hypothesis H5b is not supported.
Regression analysis does not indicate any significant relationships between project
characteristics and planning performance. The differences in planning performance of
software projects do not relate to their characteristics. Added variables representing the
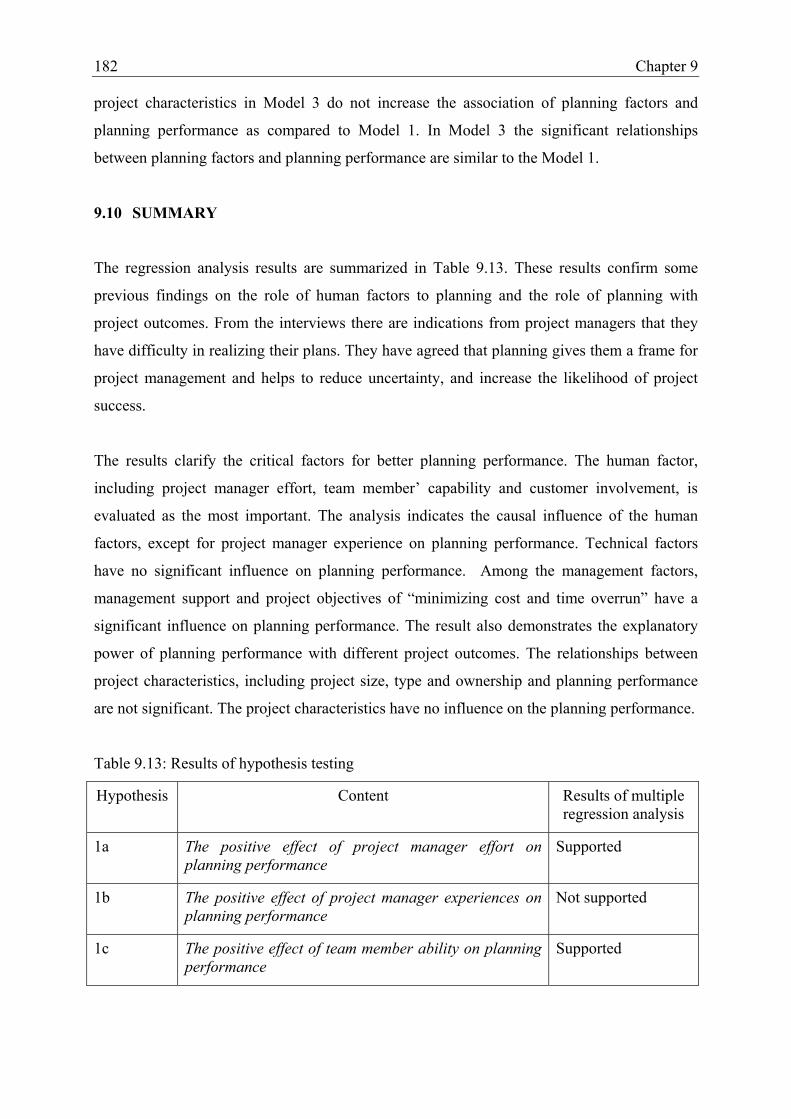
182 Chapter 9
project characteristics in Model 3 do not increase the association of planning factors and
planning performance as compared to Model 1. In Model 3 the significant relationships
between planning factors and planning performance are similar to the Model 1.
9.10 SUMMARY
The regression analysis results are summarized in Table 9.13. These results confirm some
previous findings on the role of human factors to planning and the role of planning with
project outcomes. From the interviews there are indications from project managers that they
have difficulty in realizing their plans. They have agreed that planning gives them a frame for
project management and helps to reduce uncertainty, and increase the likelihood of project
success.
The results clarify the critical factors for better planning performance. The human factor,
including project manager effort, team member’ capability and customer involvement, is
evaluated as the most important. The analysis indicates the causal influence of the human
factors, except for project manager experience on planning performance. Technical factors
have no significant influence on planning performance. Among the management factors,
management support and project objectives of “minimizing cost and time overrun” have a
significant influence on planning performance. The result also demonstrates the explanatory
power of planning performance with different project outcomes. The relationships between
project characteristics, including project size, type and ownership and planning performance
are not significant. The project characteristics have no influence on the planning performance.
Table 9.13: Results of hypothesis testing
Hypothesis Content Results of multiple regression analysis
1a The positive effect of project manager effort on planning performance
Supported
1b The positive effect of project manager experiences on planning performance
Not supported
1c The positive effect of team member ability on planning performance
Supported
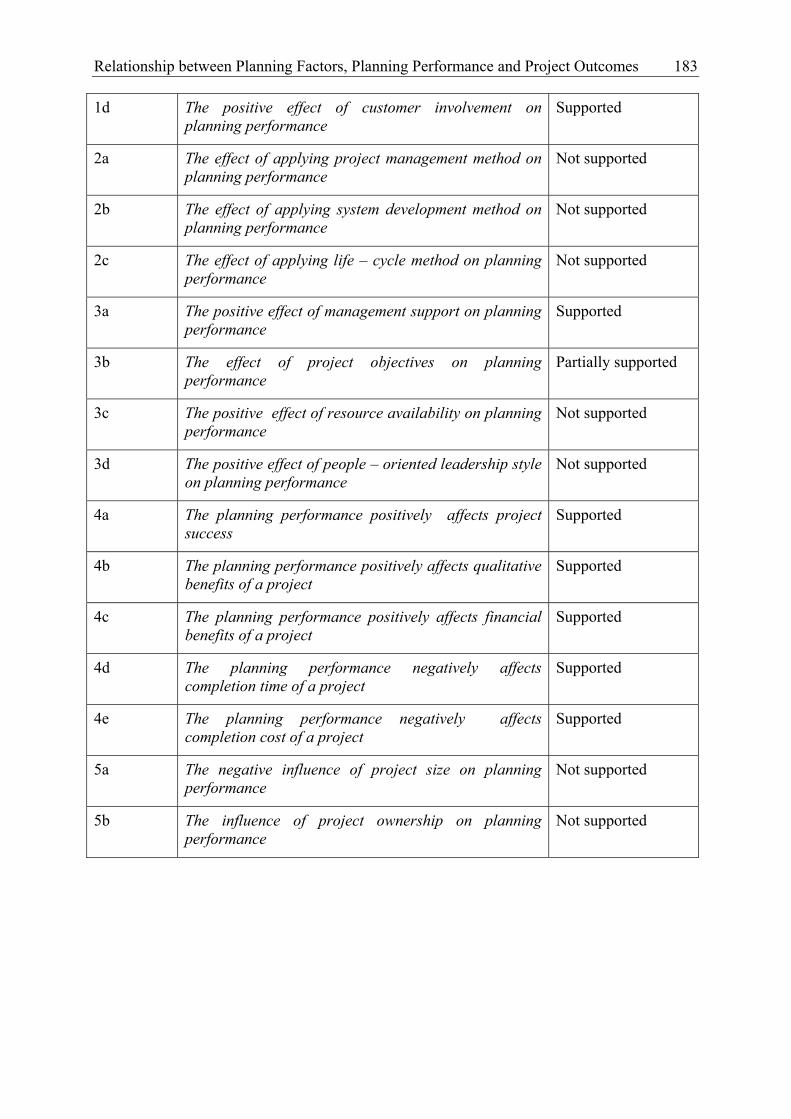
Relationship between Planning Factors, Planning Performance and Project Outcomes
183
1d The positive effect of customer involvement on planning performance
Supported
2a The effect of applying project management method on planning performance
Not supported
2b The effect of applying system development method on planning performance
Not supported
2c The effect of applying life – cycle method on planning performance
Not supported
3a The positive effect of management support on planning performance
Supported
3b The effect of project objectives on planning performance
Partially supported
3c The positive effect of resource availability on planning performance
Not supported
3d The positive effect of people – oriented leadership style on planning performance
Not supported
4a The planning performance positively affects project success
Supported
4b The planning performance positively affects qualitative benefits of a project
Supported
4c The planning performance positively affects financial benefits of a project
Supported
4d The planning performance negatively affects completion time of a project
Supported
4e The planning performance negatively affects completion cost of a project
Supported
5a The negative influence of project size on planning performance
Not supported
5b The influence of project ownership on planning performance
Not supported

184 Chapter 9

185
10
CONCLUSIONS AND MANAGERIAL
IMPLICATIONS
10.1 SUMMARY OF FINDINGS.........................................................................................185
10.1.1 Common Problems In Software Projects In Vietnam .......................................186
10.1.2 Planning In Software Projects ...........................................................................187
10.1.3 Differences In Software Projects By Size, Type And Ownership.....................188
10.1.4 Relationship Between Planning Factors, Planning Performance And Project
Outcomes ........................................................................................................................190
10.2 IMPLICATIONS...........................................................................................................194
10.2.1 Theoretical Implications ....................................................................................194
10.2.2 Managerial Implications ....................................................................................195
10.3 LIMITATIONS OF THE RESEARCH.........................................................................196
10.4 SUGGESTIONS FOR FURTHER STUDY..................................................................197
This chapter presents the theoretical and managerial implications of the empirical findings
along with the discussions and conclusions. The chapter begins with a summary of the
findings, and describes the theoretical and practical implications of the study. The suggestions
for further research issues are also indicated.
10.1 SUMMARY OF FINDINGS
The first finding relating to the explanatory research described the current status of software
project management in Vietnamese software companies. The second finding focused more on
planning in software project management. The third finding analyzed the difference between
186 Chapter 10
projects by size, type and ownership. The last finding tested the relationships that were
proposed in the conceptual framework in Chapter Four.
10.1.1 Common Problems in Software Projects in Vietnam
This finding was drawn from the exploratory study that included data of 55 software projects
in Hochiminh City, the large center of software engineering in Vietnam. The results indicated
that companies size and projects size are small. The project manager’s ability was evaluated
as average. In managing the project, they spent most their time and effort managing personnel
and quality, that were followed by communication and time management. The least effort was
for cost management. The indicators for measuring programmer's productivity were not
standardized in software companies. Therefore, it is difficult to determine the average
productivity of Vietnamese programmers.
The most common problem of software projects was of poor planning. The next was of poor
communication with customers. This study also suggested the common criteria that project
managers have preferred and used for performance. These included, in priority order,
customer satisfaction, quality, and completion on time and within budget.
The statistical analysis did not find any correlation between the project size and results. This
is consistent with the discussion with project managers in the in – depth interviews and the
findings of Aladwani (2002) in the relevant situation of a developing country. The reason for
no relationship was due to the small size of software projects. Although projects had a range
of size, they were still small. This small variation in project size did not influence the project
results.
This research on the common problems of software projects confirmed an important research
issue. This related to planning in software projects. It is necessary to have a better
understanding of planning and its role in project outcomes. Other results such as identifying
the common criteria to specify project results in practice contributed to the literature on
software project management. This study has provided the foundation of the conceptual
framework to assess the role of planning and performance.

Conclusions and Managerial Implications 187
10.1.2 Planning In Software Projects
The in – depth study focused on planning performance, it included 80 software projects. Data
was collected in Hochiminh City and Hanoi – the two main locations of software engineering
in Vietnam. The results of this research were divided into three parts. Firstly, it presented how
planning was implemented in practice. Secondly, the differences between software projects
by size, type and ownership were considered. Lastly, the relationships between planning
factors, planning performance, and project outcomes were analyzed.
The planning in software projects was considered through three aspects: human, technical and
management. Regarding the human resource issues in project planning, three main
stakeholders were considered: the project manager, team members and customers. Although
project managers have had, on average, only three years of experience in a project leader
position, they highly appreciated this experience. The experience and knowledge of
requirement definition and system development of team members were evaluated at an
average level. The involvement of the customer in project planning was also average.
The technical factor was the tools and methods applied in project planning. For project
management, 62% projects applied a specific method. The Rational Rose is a method applied
by many projects. The typical tools were used for time management rather than risk or budget
management. For system development, the common methods are RUP and Object-oriented.
The life-cycle method has been a familiar approach for all project managers. About 65% of
the projects applied the life-cycle method in their software development process. The Spiral
and Waterfall methods were mostly used.
The management approach examined the different aspects in project planning, including
support, goal and scope definition, communication, resource availability and leadership style.
The results indicated that the software project team had good support from the top-manager.
They also had only average support from the functional department. Only about half the
projects were sponsored, but these projects also received commitment from their sponsors.
Defining the goals of the project in planning related to the allocation of resources to match the
goal. This study found that quality and customer satisfaction were more important than other
goals. If there was a trade-off between quality and time or cost, the project managers would
set a higher priority for quality. Communication in projects was also an important issue of
188 Chapter 10
project management. The results indicated that email was the most commonly used method
for communication with the customer and within the project team. This could be a specific
characteristic of software projects. Resource availability appeared to be a minor concern for
all software projects. Comparing between these resources (including manpower, time, budget,
and infrastructure), the availability of manpower was the lowest one evaluated at average
level.
For planning evaluation, the scheduling had the best performance followed by defining
requirements and specifications. Risk analysis had the worst performance. Concerning time
and effort spent for planning, there was substantial variety among projects. On average,
project managers spent 22% of their time and 18% of their effort for planning. This effort was
limited compared to the important role of planning.
Project results were evaluated by multiple criteria. 70% of projects were self-evaluated as
successful (with no difference between the views of the parent company, project team, and
customer). Only 51% of the projects were completed on time and 62% within the planned
budget. The reason for this optimistic evaluation was that the evaluators emphasized the
criteria of quality and customer satisfaction for success rather than more objective criteria.
The results of the evaluation of software projects were consistent with the objective of
customer satisfaction that the project emphasized in the software development process. The
issues relating to this success were the positive assessments of qualitative outcomes, such as
“Meeting designed quality”, “Customer satisfaction”, “Enhancing the company image” and
“Improving the team member capability”.
10.1.3 Differences in Software Projects By Size, Type And Ownership
The differences in size, type and ownership between projects were analyzed. The result
indicated that there were only minor differences in personnel, technical and management
factors and in planning performance between different projects in size. The differences were
significant in terms of outcomes. The smaller projects had significantly more positive
qualitative benefits than the bigger ones.
The difference between projects in foreign software companies and local software ones was
mainly related to clients. The projects of foreign software companies had more overseas

Conclusions and Managerial Implications 189
clients than local companies did. This could be the reason for other differences between
projects in foreign and local companies, like the level of customer involvement and using
email for communication with the customer. The personnel factors in projects of international
companies were perceived better than the projects of local companies, especially related to
project manager effort, and the knowledge and experience of team members. The projects in
international software companies emphasized the goal of “minimizing both cost and
schedule” more than projects in local companies. The projects in international companies
were also well performed in terms of scheduling and doing risk analysis than projects in local
companies. Although there were some significant differences in human and management
factors and planning performance, outcomes of local and international software projects were
not significantly different.
Software projects were also compared by type. There were three types of software projects
like commercial, made-to-order and outsourcing; but having only a few significant
differences. The important differences related to the customer. The commercial projects had
higher customer involvement, better definition of product requirements and specifications as
compared to the other project types.

190 Chapter 10
10.1.4 Relationship Between Planning Factors, Planning Performance And Project
Outcomes
The summary of findings of the relationships between planning factors, planning performance
and project outcomes is presented in Figure 10.1. The hypotheses of relationships were
developed from the conceptual framework and tested through the regression models.
Figure 10.1 Summary of findings
Note:
H (i) = Hypothesis “i”
(ns) = No significant relationship
(+) = Positive relationship
(-) = Negative relationship
(np) = No prediction
β = Regression coefficient
PLANNING
PERFORMANCE
Project manager experiences
Project manager efforts
System development method
(RUP; object – oriented)
Management support
Project objectives
Life-cycle method (Spiral,
Waterfall)
Resource availability
Management styles
Team member capability
Customer involvement
Project mgt. method
Qualitative
benefits
Project success
Financial benefits
Completion time
Completion cost
H1a (+)
(β=.43)
H1b (ns)
H1c (+)
(β=.29)
H2a (ns)
Project size
H5a (ns)
H4a (+)
(β=.49)
H4c (+)
(β=.35)
H4d (-)
(β=.-695)
H4e (-)
(β=.45)
H1d (+)
(β=.14)
H2b (ns)
H2c (ns)
H3a (+)
(β=.29)
H3b (np)
H3c (ns)
H3d (ns)
Project ownership
H5b (ns)
H4b (+)
(β=.35)

Conclusions and Managerial Implications 191
10.1.4.1 Impact of planning factors on planning performance
Based on Figure 10.1, these findings suggest that all project personnel (including project
manager, team members and customer) play an important role in planning performance. The
effort of the project manager has a positive effect on planning performance. The project
manager’s experience relates to the key project outcome (project success). These results
support the findings of Verner, Overmyer and McCain (1999). They found that over half of
the unsuccessful projects had a project manager problem, such as “no experience”;
“insufficient time and effort on planning project”. The positive relationship between project
manager effort for planning and planning performance explained the role of project manager
related to project success. The team members’ knowledge about the definition of
requirements and experience in system development significantly influenced planning
performance. In a previous study, Krishnan (1998) indicated the relationship between higher
capability and experience of the software team, and less defects in a software product. This
finding focuses on the role of team ability in planning. Planning is improved by the better
definition of customer requirements and appropriate product specifications. This result
emphasized the important role of team members in the early stage of the software
development process. An important stakeholder of the software project is the customer. There
was a significant relationship between customer involvement and planning performance: the
higher involvement, the better performance. Verner et al (1999) also indicated how customers
or users affect project failure, including “too little involvement with the user community”.
Kasser and Williams (1998) also ranked “failure to communicate with the customer” as a
major reason of project failure. This result contributes more quantitative support for the role
of customer involvement in better planning performance.
The analysis did not indicate any significant relationship between applying techniques or
methods and planning performance. In practice, applying techniques in software projects is
not very systematic. The software projects usually apply a few common tools for specific
tasks like MS Project for scheduling or spreadsheets for resource allocation, and tracking
progress. Regarding system development methods, object oriented, a basic method, is the
most commonly used. Only 65% of projects applied a particular life-cycle method for
managing the software development process.

192 Chapter 10
Verner et al. (1999) found that the choice of the right life – cycle methodology was a relevant
factor in successful projects. The reason for the non – significant relationship between
applying methods and planning performance in this study may be because of the low level of
application.
The management approach is a complex issue in project management. In this study, it was
considered only in the scope of planning. There was a significant relationship between
management support and planning performance. Management support included the extent of
authority of project manager, the support from functional departments of the software
company as well as the client. Regarding other factors like resource availability, project
objectives and management style there was no significant relationship to planning
performance. In previous studies, the issue of management support was essential. Verner et
al. (1999) concluded management support is the key factor for project success. Callahan and
Moretton (2001) found a negative significant relationship between sales and marketing
involvement in the early development process and software development time. Procaccino et
al. (2002), however, only confirmed the role of a committed sponsor to project success. The
positive significant relationship between management support and planning performance
contributes more empirical confirmation for the role of management support in the literature.
Regarding the project objectives, there was no significant relationship to planning
performance. However, there was evidence of the effect of project objectives on project
outcomes (qualitative benefits and completion time). This result is consistent with the
findings of Abdel-Hamid, Sengupta and Swett (1999).
10.1.4.2 Impact of planning performance on project outcomes
This study found a significant relationship between planning performance and all project
outcomes. These results provided supports for the important role of planning. Moreover, the
influence of each planning task on each project outcome was very specific. There are some
important conclusions. First, better definition of requirements and specifications increases the
likelihood of project success and greater qualitative benefits. Second, better scheduling relates
to project success, increased qualitative benefits and a shorter completion time. Finally, better
estimation of project time and effort results in shorter completion time, lower completion cost
and greater financial benefits.

Conclusions and Managerial Implications 193
These findings confirm the role of planning and project success in previous research on
software project management. Kasser and Williams (1998) ranked “Poor requirements” and
“lack of planning” as important reasons for project failure. Aladwani (2002) also found a
significant relationship between project planning and project success. These findings are
supportive of previous studies.
10.1.4.3 The impact of project characteristics on planning factors and planning performance
Project characteristics were considered as a moderating variable for relationships between
planning factors and planning performance. In this study three project characteristics were
considered, including size, type and ownership. The regression analysis did not indicate any
significant relationship between these project characteristics and planning performance. There
was no moderating effect.
It was hypothesized that the differences in project type categorized as commercial, made-to-
order, and outsourcing, such as the involvement of customer, the effort of project manager,
the support from client’ functional department, etc. would lead to more effective planning
performance and more successful outcomes. However, the analysis did not find any influence
of project type on planning performance. In interviews, the project managers indicated
personnel involved and the management approach used in different project types varied
greatly. However these projects also had a variety of characteristics. In this study no specific
project type had greater chance for success than another. In the literature, this issue has not
been researched and this is the potential direction for further studies.
Project size and project ownership also did not influence the planning performance of a
software project. It was assumed that the big projects would have greater difficulty in
managing personnel, time, customer relationships, and resource allocation. These issues
would also influence planning performance. There was no evidence for this. The reason for
having no significant relationship between project size and planning performance could be
that there were no major differences between large and small projects. Similarly, there were
very little differences between projects in international and local software companies.

194 Chapter 10
10.2 IMPLICATIONS
The implications of this study are considered from both theoretical and practical perspectives.
This analysis indicates the contributions of the study to the literature of software project
management and to the managers in managing the software projects in practice.
10.2.1 Theoretical Implications
The literature review has shown that poor planning is one of most common problems in
software project management. This could be the main cause for the large number of late and
over budget software projects. However, this review also indicated that there is not much
research focused on the planning of software projects or on the factors that influence planning
performance. It is necessary to confirm the role of planning related to the overall success of
the software project, and to specific outcomes like completion time and cost, financial and
qualitative results. The first contribution of this study is the assessment of previous studies.
This review summarized the criteria for project evaluation used in this research, especially
software projects. The common problems in software projects were also presented through
this review. The assessment indicated the problems that previous studies emphasized and the
gaps in the understanding of planning performance and success. It could be a source research
of idea generation for further studies.
The second contribution is the conceptual framework. The conceptual model in this study has
indicated that planning factors do influence planning performance. Planning performance is a
mediator between planning factors and project outcomes. The moderating effects of project
characteristics on the relationship between planning factors and planning performance is
supported in the model.
The influence of project characteristics, including project size, type and ownership on project
planning as control variables was also considered by the conceptual model. The most
important consideration of the model is to examine the direct role of planning performance to
project results. The study has established a theoretical framework for assessing planning
performance and outcomes. This may be used for future research in project management in
other national or industrial contexts.

Conclusions and Managerial Implications 195
The third contribution is the comprehensive analysis. The results of this study have confirmed
the findings of many previous studies, especially the impacts related to human resources in
software projects and the importance of planning. This illustrates the similar characteristics
between management of software projects in other contexts and in the context of a young
industry. The findings of few minor differences between software projects in size, type and
ownership contributed to the characteristics of a software projects. This study provides an
understanding of software project management for both researchers and managers with
different perspectives.
The new point in this study is to examine the role of planning. The result demonstrated the
explanatory power of planning performance with different project outcomes.
10.2.2 Managerial Implications
This study has provided an overview of software project management in the context of an
emerging software industry. This industry is chosen as a key sector for the development of the
economy in Vietnam – a transitional economy because of its competitive advantages. With
supportive policies from the government, software companies now are trying to improve their
performance. The analysis suggests specific guidelines for project managers to improve
planning and for project management in general.
The first implications are related to the role of planning. This study demonstrated the
important influence of planning performance to many outcomes of successful projects.
Planning should be more emphasized by software companies and project managers. Also, the
risk analysis of most software projects was not adequate. Improving this emphasis in planning
could result in better project outcomes. Proactive risk management instead of reacting to risk
is a new concept in software projects. The change in customer requirements is a risk usually
happening in a software project. Many software development methods, like the spiral or
prototyping, were developed to give projects more flexibility adapting to changes in customer
requirements. The new management approach for project management like Rational Unified
Process also provides a guideline for risk management. The relationships between planning
tasks and project outcomes help the project managers to focus on the specific planning task to
get the outcome they want.)

196 Chapter 10
Secondly, to improve the performance of project planning, the important role of human
factors should be considered. The findings indicated the influence of project manager efforts,
team member capability and customer involvement in planning. It suggests that project
managers should spend more effort for planning, especially for defining and controlling the
product specifications. The role of team members also contributed to better planning
performance. In planning, the team members should have good knowledge and experiences in
defining requirements and system development. They were also required to have commitment
and persistent attitudes to work in the uncertain atmosphere of the planning stage. This
capability could be used for selecting team members in the planning stage and for training
human resource. Customers also influenced the planning performance in terms of their
involvement and knowledge. Project managers could develop better planning through
managing the customer relationship, and increasing their involvement to improve the
understanding of customer requirements and to limit unexpected changes. The process of
customer relation building should be established to facilitate the customer relationship
management.
Thirdly, planning performance also is influenced by management support. This finding
suggests that software companies should provide more support to the project team, especially
in planning. The support should come from the top management of the parent company and
from the functional departments or specialist like sales or marketing.
Finally, although this study did not demonstrate the relationship between the application of
technical methods and planning performance, but it did indicate the poor application of
project management and life cycle methods in software projects. This finding should
stimulate software companies and project managers to improve the application of these
methods.
10.3 LIMITATIONS OF THE RESEARCH
The limitations of this study should be noted. It includes projects only in Vietnam, a
developing country in a transitional economy. The software companies chosen as samples are
small and young with average age of only 5.5 years and the average number of employees of
about 40. The characteristics of these samples may prevent generalizing the findings to all
projects of software companies in other developing countries or developed countries. For

Conclusions and Managerial Implications 197
example, the study of Loo (2002) indicated the commonly adopted leadership styles in project
management, including people-oriented, participative, transformational, and situational
leadership. However, the project managers in this study did not know about these styles. This
issue limits the generalization of the findings on leadership styles and planning performance
or project outcomes or a comparison to Loo’s results.
10.4 SUGGESTIONS FOR FURTHER STUDY
This study focused on planning in software projects in a developing country. This research
issues might be extended in other regions in the world. The extension of these research issues
would be a better comparison with a wider range of software projects of international regional
context with different characteristics like size, or type.
It is also necessary to investigate the role of other areas of project management in software
projects like quality management, risk management or conflict management. The problems of
other stages like analysis and design, coding, testing or deploying in software development
are also the issues for further research. The results of the exploratory study also suggest the
important role of communication in project management. The problem of changing
customers’ requirements and the poor understanding of customers’ expectation are evidences
for more emphasis on the impact of project communication on project success
This study failed to support some of the proposed hypotheses related to the effect of applying
techniques or methods and management styles on planning performance. Hence, there is a
need for further study on the influence of different techniques on project results.
This study focused on software development projects in professional software companies.
However, the research issues and the approach of this study could be extended to other kind
of developing organizations such as software development projects of other industries, for
example like consultanting or academic one. It could be also applied to other project types,
like information system project. Further researches may be conducted on the role of planning
in other types of projects.

198 Chapter 10

Bibliography 199
BIBLIOGRAPHY
Abdel-Hamid, Tare; Sengupta, Kishore and Swett, Clint (1999), “The impact of goals on
software project management: an experimental investigation”, MIS Quarterly, Vol. 23,
No.4 pp. 531 – 555.
Aladwani, A., Al-Zufairi,A., Al-Owaihan, A. and Al-Ajmi, R.(1999), “The role of
manning level in information system projects”, Arab Journal of Administrative Sciences,
Vol.6 No. 3, pp. 31 – 34.
Aladwani, A.M. (2002), “IT project uncertainty, planning and success. An empirical
investigation from Kuwait”, Information Technology & People, Vol. 15, No.3, pp.210 –
226.
Abbasi, Ghaleb Y, and Al-Mharmah, Hislam A. (2000), “Project Management Practice by
the public sector in a developing country”, International Journal of Project Management,
Vol. 18, Iss. 2, p.105
Andrews and Ince. (1991) Practical Formal Methods with VDM, McGraw–Hill, London
Asia Pacific Bulletin (2002), No. 62, Asia Pacific Foundation of Canada.
Baker, T.L. (1994), Doing Social Research, International Edition (2nd ed.), McGraw-Hill
Inc.
Badiru A. and and Pulat S. (1995), Comprehensive Project Management, Englewood Cliffs
New Jersey, Prentice Hall, 1995.
Barry, E.J; Mukhopadhyay, T. and Slaughter, S.A. (2002), “Software project duration and
effort: An empirical research”, Information Technology and Management, Vol.3 pp. 113 -
136.

200 Bibliography
Belout, Adnanne and Gauvreau, Clothilde (2003), “Factors influencing project success: the
impact of human resource management”, International Journal of Project Management,
Article in press, April.
Blackburn, J.D., Scudder, G. and Van Wassenhove, L.N., (1996) “Improving speed and
productivity of software development”, INSEAD Working Paper, INSEAD Fontainebeleau,
France.
Boehm, B.W (1981), Software Engineering Economics, Prentice- Hall, Inc., Englewood
Cliffs. NJ.
Boehm et al. (1984), “A software development environment for improving productivity”,
Computer, Vol. 17, pp. 30-42.
Callahan, John and Moretton, Brian (2001), “Reducing software product development
time”, International Journal of Project Management, Vol.19, pp. 59 - 70.
Carroll, Jennie (1995), “The application of total quality management to software
development”, Information technology & People, Vol. 8, No.4, pp. 35 – 47.
Chatzoglou, P.D and Macaulay L.A. (1998), “A Rule- Based approach to developing
software development prediction models”, Automated Software Engineering, Vol. 5 pp.
211 – 243.
Chatzoglou, P.D. and Macaulay L.A., (1997), “The important of human factors in planning
the requirements capture stage of a project”, International Journal of Project Management,
Vol.15, pp. 39 – 53.
Chatzoglou, P.D. and Macaulay L.A. (1996), “A review of existing models for project
planning and estimation and the need for a new approach”, International Journal of
Project Management, Vol.14, pp. 173 - 183.
Bibliography 201
Chatzoglou, P.D., (1997), “Factors affecting completion of the requirement capture stage
of projects with different characteristics, Information and Software Technology, Vol. 39
pp. 627 – 640.
Checkland P.(1981), Software Systems Methodology, Wiley, Chichester
Duvall, L.M. (1995), “A study of software management: The state of practice in the United
States and Japan”, The journal of system and software, Vol. 31, No. 2, pp 109 – 124.
Dvir, Dov; Raz, Tzvi and Shenhar, Aaron J. (2003), “An empirical analysis of relationship
between project planning and project success”, International Journal of Project
Management, Vol.21, pp. 89 – 95.
Eversheim, W. Klocke, F., Pfeifer, T. and Weck, M (1997). Manufacturing excellent in
Global Markets, Chapman and Hall, London,.
Gibbs, W. (1994), “Software’s chronic crisis”, Scientific American, September, pp. 73 –
73.
Gilb, T. (1988), Principles of Software Engineering Management, Addison-Wesley,
Wokingham.
Gong, Beilan; Yen, David C. and Chou, David C. (1998), “A manager’s guide to total
quality software design” Industrial Management & Data Systems, Vol.98, No, 3, pp. 100 –
107.
Graham, J. (1994), “ISO implementations in small”, NORTHCON Technical Conference
Proceedings, pp.40 – 2.
HCA (2006), IT Directory in 2006,
http://www.hca.org.vn/tin_tuc/hd_hoi/nam2006/thang7/vio2006/baocaotoancanh_2006.pdf
HCA (2004), IT Directory in 2004, PC World Vietnam, HCMC General Publication.
202 Bibliography
HCA (2003), IT Directory in 2003, PC World Vietnam, HCMC General Publication.
Hughes, Bob and Cotterell, Mike (2002). Software Project Management, Third edition.
The McGraw – Hill Publishing Company, pp.3.
Humphrey, W.S. (1990), Managing the Software Process, Addison-Wesley, Reading, MA.
Huynh Quang Minh. (2001), “A Study on the Vietnam Software Industry”. International
Conference in Vietnam on management Education for the 21st Century – Managing in the
digital Age, pp.1 – 7.
IEEE (1987) (Revised 1993) Standard for Software Project Management Plans, Chapter 7,
13, IEEE Standard. IEEE.
IEEE (1993) Standards Collection: Software Engineering, IEEE Standard 610. 12-1990.
IEEE.
Jacobson, Ivar; Booch, Grady and Rumbaugh, Jim (1999). Unified Software Development
Process, Addison – Wesley.
Jones, C. (1996). Programming Productivity. MacGraw-Hill.
Jones, G.W. (1990), Software Engineering, John Wiley & Son, New York, NY.
Jones, C. (1986), Programming Productivity, McGraw-Hill, New York, NY.
Jones, Capers (1998), “Software Project management in the twenty – first century”,
American programmer, Vol. XI, No.2; February 1998.
Jones, Capers (1999), “Software Project management in the twenty – first century”,
Software Productivity Research, Inc.; January 1999. Burlington, MA.
Josepth F. Hair, Jr., Rolph E. Anderson, Ronald L. Tatham, William C. Black (1998),
Multivariate Data Analysis, Prentice – Hall International, Inc.

Bibliography 203
Kasser, Joseph and William, Victoria (1998), “What do you mean you can’t tell me if my
project is in trouble”
Kerzner H. (1998), In search of excellent in project management, Van Nostrand Reinhold,
New York, NY..
Krishnan, Mayuram S. (1998), “The role of team factors in software cost and quality: An
empirical analysis”, Information Technology & People, Vol.11, No.1, pp.20 – 35
Kruchten, Philippe (1999), Rational Unified Process – An Introduction, Addison – Wesley.
LaPedus, M. (1996) “Software sales booking in Asia”, Bits: International News and Views,
1 July, Vol.4.
Leszek A. Maciaszek (2001), Requirements Analysis and System Design, Addison –
Wesley.
Loo, Robert (2002), “Working towards best practices in project management: a Canadian
study”, International Journal of Project Management, Vol.20, pp. 93-98.
Martin J. (1991), Rapid Application Development, Macmillan, New York, NY.
Matsumoto, Y. and Ohno, Y, (1989), Japanese Perspectives in Software Engineering,
Addison-Wesley, Singapore
McAdam, Rodney and Fulton, Frances (2002), “The impact of the ISO9000:2000 quality
standards in small software firms”, Managing Service quality, Vol. 12, No.5, pp. 336 –
345.
Moore, James W. (2000), Software Engineering Standards: A User's Road Map, IEEE
Computer Society, Los Alamitos, California, USA.
Morton A. Hirschberg (2004), “Rapid Application Development: A Brief Overview”
Software Tech News, http:// www.softwaretechnews.com/technews2-1/rad.html

204 Bibliography
Mumford, E. and Weir, M. (1979), Computer Systems in Work Design-The ETHICS
Method, Associated Business Press, London.
Munns, A.K. and Bjeirmi, B.F (1996), “The role of project management in achieving
project success”, International Journal of Project Management, Vol. 14, No.2, pp 81 – 87.
Naumann, J.D. and Jenkins, A.M. (1982), “Prototyping: the new paradigm for systems
development”, MIS Quarterly.
Neuman, W. L. (2000), Social Research Method: Qualitative and Quantitative Approaches,
USA: Allyn and Bacon, Edition four.
Naur, P. and B. Randall (eds). (1969), Software Engineering: A Report on a Conference
Sponsored by the NATO Science Committee, NATO.
Nguyen Duc Tri. (2000), Acquisition of Resources from foreign parents by international
joint ventures – The case of Vietnam, Doctoral thesis, Nanyang Business School.
Nguyen, Quynh Mai, (2003), “An empirical research on software project management in
Vietnam”, Conference of Management Education for the 21st Century, September.
Nguyen Trong Duong (2004), “Software Industry Development in Vietnam”,
http://www.iipi.org/activities/forums/softwareconference/Nguyen%20Paper.pdf
Nunnally, J. (1978), Psychometric Theory, New York, Mc. Graw-Hill
Paulk, M.C. (1994), “Comparing ISO 9001 and Capability maturity model for software”,
Software Quality Journal, Vol. 2, pp 245 - 256
Peter F. Drucker. (1999), “Knowledge worker Productivity: The Biggest Challenge”,
California Management Review, Vol.41, No.2.
Pinto JK, Slevin DP (1988), “Project success: definitions and measurement techniques”,
Project management Journal 1988, Vol. 19 (3): 67 – 73

Bibliography 205
PMI (1996), PMI Standards Committee, “A Guide to The Project Management Body of
Knowledge”, Project Management Institute, 1996.
Post and Telecommunication Ministry (2005), “The Vietnam Software Industry
Development Program 2006 – 2010”,
http://www.hca.org.vn/su_kien/sk_HCA/toan_canh_CNTT/nam2005
Pressman, Roger S. (1997). Software Engineering – A practitioner’s approach. Mc.Graw
Hill International Editions.
Procaccino, J.D; Verner, J.M.; Overmyer, S.P. and Darter, M.E. (2002), “Case study:
factors for early prediction of software development success”, Information and Software
Technology, Vol. 44 pp. 53 - 62.
Royce, W.W. (1970), Managing the Development of Large Software Systems: Concepts
and Techniques, WESCON.
Robinson, J.P., P.R. Shaver, and L.S. Wrightsman (1991), “Criteria for Scale Selection and
Evaluation”, Measure of Personality and Social Psychological Attitudes. San Diego,
California, Academic Press.
Russo, Nancy L. & Walz, Diane B (1995), “The use and adaptation of system development
methodologies”, International Resource Management Association, International
Conference, May 21 – 24.
Ratcliff, B. (1987), Software Engineering Principles and Methods, Blackwell Scientific
Publication.
Sauer, Chris and Cuthbertson, Chistine (2003), “The State of IT Project Management in the
UK - the definitive study – Part 2”, Working paper, Templeton College, Oxford University.
Slevin D.P. and Pinto, J.K (1986), “The project implementation profile: new tool for
project managers”, Project Management Journal, Vol. 17 No.4, 1986, pp. 57 – 70.

206 Bibliography
Standish Group (1995), Chaos. http://www.standishgroup.com/chaos.html July 10, 1997.
Thayer, Pyster and Wood (1981), “Major issues in software engineering project
management”, IEEE Transactions on Software Engineering, No.7, pp. 333 – 342.
Tran Lac Hong (2005), “The picture of Vietnamese software businesses in the year of
2005”, http://www.hca.org.vn/su_kien/sk_HCA/toan_canh_CNTT/nam2005
Tran Thang Long (2001), “Development Strategy of a software company in Vietnam”
International Conference in Vietnam on management Education for the 21st Century –
Managing in the digital Age, pp.40 – 51
Tukel, Oya I. and Rom, Walter O. (2001), “An empirical investigation of project
evaluation criteria”, International Journal of Operations & Production Management, Vol.
21, No. 3, 2001, pp. 400 – 416.
VCCI (2000). VCCI – Software Industrial Marker Promotion Report 12/ 2000. Vietnam
Chamber of Commerce and Industry.
Verner J.M., Overmyer S.P., McCain K.W. (1999), “In the 25 years since The Mythical
Man – Month what have we learned about project management?” Information and
Software Technology, Vol. 41, pp. 1021 – 1026.
VIR (2000), “Software export target table”, Vietnam Investment Review, 13/6. http://www.
vnn.vn/english/news/infoteech/13-6-1.htm
VNS (2001), “Vietnam’s software industry face uphill struggle to get competitive”,
Vietnam News, May, 11th, URL: http://www. vnn.vn/english/news/infoteech/11-5-1.htm
Wateridge, John (1998), “How can IS/ IT projects be measured for success?”, International
Journal of Project Management, Vol.16, pp. 59 – 63.

Bibliography 207
Westerveld, E. (2003), “The Project Excellence Model: linking success criteria and critical
success factors”, International Journal of Project Management, Article in press, April.
White, Diana and Fortune, Joyce (2002), “Current practice in project management – An
empirical study”, International Journal of Project Management, Vol.20, Issue 1, pp.1 – 11.
Whittaker, Brenda (1999), “What went wrong? Unsuccessful information technology
projects”, Information Management & Computer Security, Vol. 7, No.1, pp. 23- 29.
Yang, Y. Helio (2001), “Software quality management and ISO 9000 implementation”,
Industrial Management & Data systems, Vol. 101, No. 7, , pp.329 – 338.
Yeo, K.T, (2002) “Critical failure factors in information system projects”, International
Journal of Project Management, Vol.20, pp. 241 - 246.
Yu, W.D, Smith, P. and Huang, S.T. (1990), “Software productivity measurements” AT&T
Technical Journal, May – June, pp. 110 – 20.

208 Bibliography

209
APPENDICES APPENDIX A: QUESTIONNAIRES APPENDIX B: LIST OF SURVEYED COMPANIES APPENDIX C: TABLES & FIGURES

210 Appendix A
APPENDIX A: QUESTIONNAIRES APPENDIX A.1: QUESTIONNAIRES FOR THE EXPLORATORY RESEARCH
(For project leaders or managers in software companies) 1. In managing the project team, how much time do you spend on following works? Very much Very little
1. Team management (staffing; team structure; team communication; team building; conflict resolution; performance appraisals and training)
5 4 3 2 1
2. Communication management (Speed up the relationship between project team and stakeholders)
5 4 3 2 1
3. Risk management (Identify and avoid or mitigate the project risks throughout the life cycle of a project)
5 4 3 2 1
4. Quality management (Implementing the activities, techniques and strategy to ensure that all project activities and work products comply with all relevant standards, procedures and requirements)
5 4 3 2 1
5. Time management (Applying the processes and techniques of time management to ensure the timely completion of the project)
5 4 3 2 1
6. Cost management (Estimating budget; managing and controlling cost in order to ensure that the project is completed within the approved budget)
5 4 3 2 1
2. In average, how many people involved in a project in your company? 3. Which are methods using for measuring productivity in your company? And how much productivity is? Size metrics Function points (FP) - KLOC/man-month ________ - FP/ man-month ________ - defects/ KLOC (thousand lines of code) ________ - defects/ FP ________ - errors/ man-month ________ Others ……………………………... ________ Not measure 4. How often training courses on project management were implemented at your companies (or sent
employees to outside training programs) during last year? - Never - 3 – 5 times/ year - 1 – 2 times/ year - > 5 times/ year 5. Please give your opinion about: Ability of project and team management of managers in your company
Very qualified 5 4 3 2 1 Very unqualified
Teamwork ability of employees/ programmers Very good 5 4 3 2 1 Very bad 6. Does your company forecast the risks of the project in designing (estimate time and cost) and planning stages - Always regardless of size of the project - Sometime, depend on size of project - Never 7. Which types of risk are often occurring in your projects: Very often Never - Risk of changing requirements from customer 5 4 3 2 1 - Risk of poor communication and misunderstanding customer 5 4 3 2 1 - Risk of project team management 5 4 3 2 1 (conflict, lack of support and cooperation, poor management) - Risk of technical complexity 5 4 3 2 1 - Risk of requiring additional resources (personnel, capital, etc.) 5 4 3 2 1 - Others …………………………………………………………………………………............

Appendix A 211
8. Which following quality management systems/ principles are applying (or in process of development) in
your company? - None TQM (Total quality management) - ISO 9000 CMM (Capacity maturity model) - Others: ………………………………………………………………………………………… 9. Have you ever known about applying these quality management systems/ principles in software sector? - None TQM (Total quality management) - ISO 9000 CMM (Capacity maturity model) - Others: ………………………………………………………………………………………… 10. Please evaluate the importance of following software quality attributes in your project. Very important Average Very unimportant 1. Reliability (is the degree to which the product meets its functionality over a measured period of time.)
5 4 3 2 1
2. Modifiability/ extensibility (is the measure of ease enhancing the product; generality and flexibility of product )
5 4 3 2 1
3. Portability (is the measure of effort required to modify and test a product to allow that product to run in an environment other than the one for which it was developed)
5 4 3 2 1
4. Usability (is measure of re-usability of code)
5 4 3 2 1
5. Friendly/ efficiency (is measure the satisfaction of users regardless of their background, tasks performed, and needs )
5 4 3 2 1
11. Give your opinion of the following statements
Strongly Neutral Strongly agree disagree 1. The quality management system is very necessary for software engineering in my company
5 4 3 2 1
2. Current quality management systems for software engineering in the world is not suitable to small and medium size of Vietnamese software companies
5 4 3 2 1
3. Quality of software product is mainly depending on programmer’s ability rather than have or not any quality management system.
5 4 3 2 1
12. Your project estimates time and cost based on:
Experiences Specific software
13. For managing and controlling project time, does your project apply any following technique of time management? - Gantt chart (bar chart) - CPM (Critical part method) - MS Project software - Others ……………………………… - None
THE SUCCESFUL FACTORS OF THE SOFTWARE PROJECT 14. Please rank the following project evaluation criteria in order of importance in your project.
- Completion on planned time - Completion within project - Completion at desired level of quality - Customer satisfaction - Capability improvement for company - Others
15. Average time to complete a software product at your company is: …………………… months 16. How was the result of software projects in the past in your company? :

212 Appendix A
- Percentage of project completed on time …………… % - Percentage of project completed on budgeted cost .…………… % - Percentage of project meet desired quality level ……………. % - Percentage of project met all above criteria ……………. %
17. In your opinion, how do following factors influence the success or failed level of a software project?
3 2 1 0 -1 -2 -3
Increase successes Not influence Increase failure of the project of the project 1. Project management ability of project managers 3 2 1 0 -1 -2 -3 2. Capability of project team members (measured by experiences or ability to meet work requirements)
3 2 1 0 -1 -2 -3
3. Size of project (measured by number of people in a project) 3 2 1 0 -1 -2 -3 4. Complexity of technology applied in the project (complexity means new or unfamiliar)
3 2 1 0 -1 -2 -3
5. Capability to understand customer’s expectation 3 2 1 0 -1 -2 -3 6. Setting up a clear working process 3 2 1 0 -1 -2 -3 7. Creating a comfortable working environment, cooperative and trust atmosphere for all employees.
3 2 1 0 -1 -2 -3
18. Give your opinion of the following statements Strongly disagree Neutral Strongly agree 1. Estimating and planning ability is weakest point of project managers at Vietnamese software companies
1 2 3 4 5
2. Most difficulty in managing software quality is lack of quality standards and quality measuring methods
1 2 3 4 5
3. Project manager lack of knowledge and skills of decision-making and lack of techniques to make project progress become visible.
1 2 3 4 5
4. Insufficient knowledge in related fields and poor communication are biggest problems of Vietnamese team leader that lead to misunderstand customers needs/ expectations
1 2 3 4 5
5. Most difficulty of Vietnamese software companies today are lacking of contracts rather than poor ability of programmers or managers
1 2 3 4 5
GENERAL INFORMATION 19. Personal information:
- Position: …………………………………………………………………. - Education level: ……………………………………………………… - Years of experiences:…………………………..………………………..
20. Company information:
- Company name: …………………………………………………………… - Established year: ………………………………………………………….. - Number of employees: ……………………………………………………. - Average revenue/ year: …………………………………………………….. - Number of KLOC that your company produced in this year (until November 2002)…….
21. The main activities of your companies are (please rank in order of importance of product/ service)
- Producing service software for local companies ____ - Producing package software for local market ____ - Producing package software for foreign market ____ - Outsourcing for foreign companies ____ - Others (please detailed)
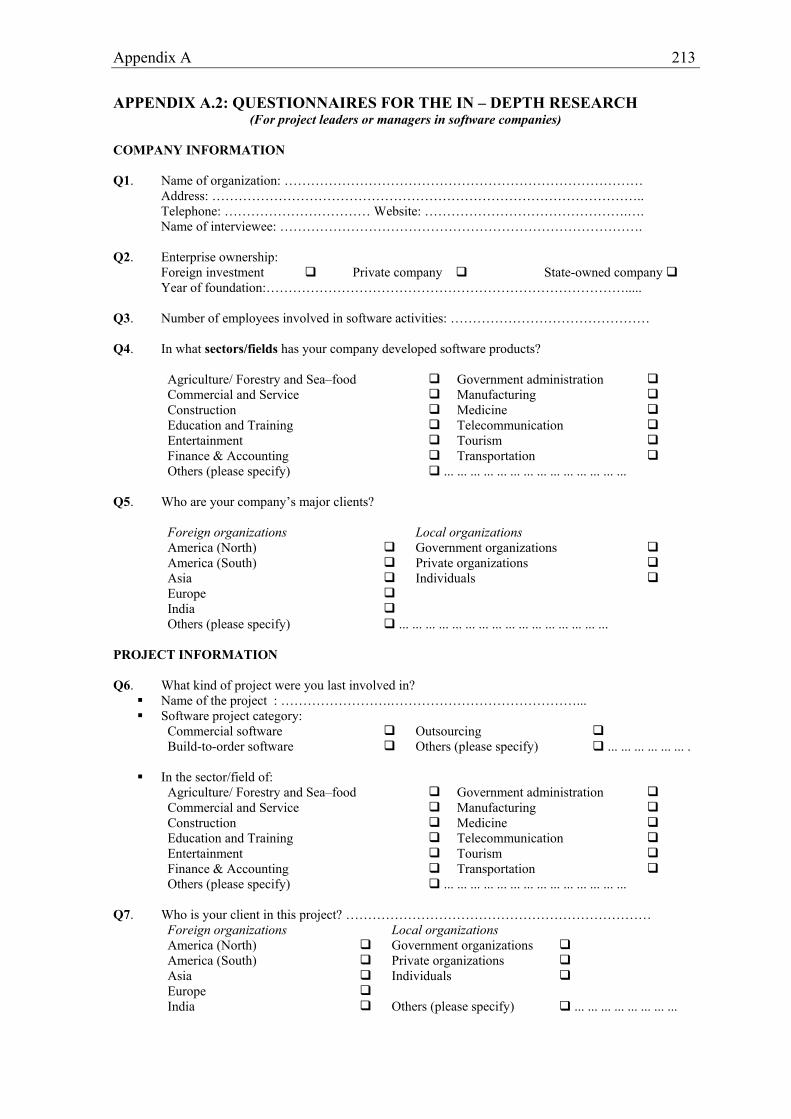
Appendix A 213
APPENDIX A.2: QUESTIONNAIRES FOR THE IN – DEPTH RESEARCH (For project leaders or managers in software companies)
COMPANY INFORMATION Q1. Name of organization: ……………………………………………………………………… Address: …………………………………………………………………………………….. Telephone: …………………………… Website: ……………………………………….…. Name of interviewee: ………………………………………………………………………. Q2. Enterprise ownership: Foreign investment Private company State-owned company Year of foundation:………………………………………………………………………..... Q3. Number of employees involved in software activities: ……………………………………… Q4. In what sectors/fields has your company developed software products?
Agriculture/ Forestry and Sea–food Government administration Commercial and Service Manufacturing Construction Medicine Education and Training Telecommunication Entertainment Tourism Finance & Accounting Transportation Others (please specify) ... ... ... ... ... ... ... ... ... ... ... ... ... ...
Q5. Who are your company’s major clients?
Foreign organizations Local organizations America (North) Government organizations America (South) Private organizations Asia Individuals Europe India Others (please specify) ... ... ... ... ... ... ... ... ... ... ... ... ... ... ... ...
PROJECT INFORMATION Q6. What kind of project were you last involved in?
Name of the project : …………………….……………………………………... Software project category:
Commercial software Outsourcing Build-to-order software Others (please specify) ... ... ... ... ... ... .
In the sector/field of:
Agriculture/ Forestry and Sea–food Government administration Commercial and Service Manufacturing Construction Medicine Education and Training Telecommunication Entertainment Tourism Finance & Accounting Transportation Others (please specify) ... ... ... ... ... ... ... ... ... ... ... ... ... ...
Q7. Who is your client in this project? ……………………………………………………………
Foreign organizations Local organizations America (North) Government organizations America (South) Private organizations Asia Individuals Europe India Others (please specify) ... ... ... ... ... ... ... ...
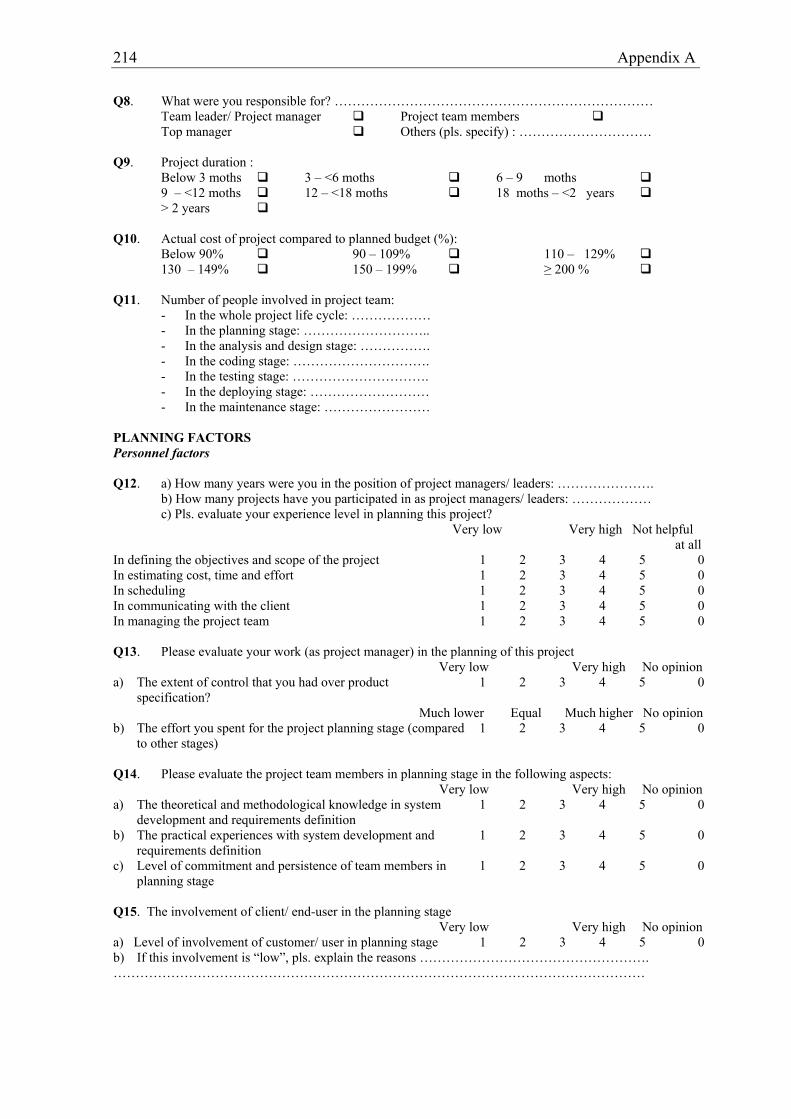
214 Appendix A
Q8. What were you responsible for? ……………………………………………………………… Team leader/ Project manager Project team members Top manager Others (pls. specify) : …………………………
Q9. Project duration :
Below 3 moths 3 – <6 moths 6 – 9 moths 9 – <12 moths 12 – <18 moths 18 moths – <2 years > 2 years
Q10. Actual cost of project compared to planned budget (%):
Below 90% 90 – 109% 110 – 129% 130 – 149% 150 – 199% ≥ 200 %
Q11. Number of people involved in project team:
- In the whole project life cycle: ……………… - In the planning stage: ……………………….. - In the analysis and design stage: ……………. - In the coding stage: …………………………. - In the testing stage: …………………………. - In the deploying stage: ……………………… - In the maintenance stage: ……………………
PLANNING FACTORS Personnel factors Q12. a) How many years were you in the position of project managers/ leaders: …………………. b) How many projects have you participated in as project managers/ leaders: ……………… c) Pls. evaluate your experience level in planning this project? Very low Very high Not helpful at all In defining the objectives and scope of the project 1 2 3 4 5 0 In estimating cost, time and effort 1 2 3 4 5 0 In scheduling 1 2 3 4 5 0 In communicating with the client 1 2 3 4 5 0 In managing the project team 1 2 3 4 5 0 Q13. Please evaluate your work (as project manager) in the planning of this project Very low Very high No opinion a) The extent of control that you had over product
specification? 1 2 3 4 5 0
Much lower Equal Much higher No opinion b) The effort you spent for the project planning stage (compared
to other stages) 1 2 3 4 5 0
Q14. Please evaluate the project team members in planning stage in the following aspects: Very low Very high No opinion a) The theoretical and methodological knowledge in system
development and requirements definition 1 2 3 4 5 0
b) The practical experiences with system development and requirements definition
1 2 3 4 5 0
c) Level of commitment and persistence of team members in planning stage
1 2 3 4 5 0
Q15. The involvement of client/ end-user in the planning stage Very low Very high No opinion a) Level of involvement of customer/ user in planning stage 1 2 3 4 5 0 b) If this involvement is “low”, pls. explain the reasons ……………………………………………. …………………………………………………………………………………………………………

Appendix A 215
Technical factors Q16. The project management methodology/tools Q16.1 Did your project team apply any project management methodology in this project?
Yes (Name of the method:……………………………………………………………) No
Q16.2 This methodology has been formalized by: A local company A foreign company Your company (in-house) Others …………………………
Q16.3 Did your project team use any software to manage this project?
Yes (Name of the software:……………………………………………………………) No
Q16.4 This software has been developed by: A local company A foreign company Your company (in-house) Others ……………………………
Q16.5 What are the software features used to support project management? Never Always Not available Work breakdown structure 1 2 3 4 5 0 Gannt chart 1 2 3 4 5 0 CPM Chart (network) 1 2 3 4 5 0 PERT Chart 1 2 3 4 5 0 Budget management 1 2 3 4 5 0 Handling conflicts 1 2 3 4 5 0 Progress tracking 1 2 3 4 5 0 Weekend modifiers 1 2 3 4 5 0 Overbooking of resources 1 2 3 4 5 0 Workforce assignment 1 2 3 4 5 0 Others 1 2 3 4 5 0 Q17. The system development method Q17.1 Did your project team adopt any of the following system development methods in this project?
Structured approach (SDLC) Object – oriented Prototyping, interactive Rational Unified Process (RUP) Rapid application development (RAD) Agile software development processes Others (please specify) ………………………………………
Q17.2 This methodology has been formalized by:
A local company A foreign company Your company (in-house) Others ……………………………
Q17.3 Did your project team use any tool/ software for effective application that system development
method: Yes (Name of the software:……………………………………………………………) No
Q17.4 This software is developed by:
A local company A foreign company Your company (in-house) Others ……………………………
Q18. Did your project team apply any of the following life-cycle methodology in project planning? Waterfall Prototype None V-process Incremental delivery Spiral Others (pls. specify) ………………………………

216 Appendix A
Q19. Who takes responsibility for the choice of these methodologies/tools? Project manager Client Top manager Others (pls. specify) ………………………………
Management factors Q20. Please describe the management support in your project Strongly Strongly No disagree agree opinion a) The project manager was given full authority to manage the
project 1 2 3 4 5 0
b) The project started with a committed sponsor 1 2 3 4 5 0 c) In the planning stage, delegates of the company functional
departments (sales, marketing, networking, database, etc.) participated actively as project members
1 2 3 4 5 0
d) In the planning stage, delegates of the client’s functional departments participated actively as project members
1 2 3 4 5 0
Q21. In this project, what are the main objectives that your project team pursued? Very Very No unimportant important opinion a) Minimize overruns in both cost and schedule 1 2 3 4 5 0 b) Deliver a quality product and minimize any schedule
overrun 1 2 3 4 5 0
c) Customer satisfaction 1 2 3 4 5 0 d) Minimize cost 1 2 3 4 5 0 e) Others 1 2 3 4 5 0 Q22. Please describe the process of goal definition in this project Strongly Strongly No disagree agree opinion a) In the planning stage there was no conflicting objectives
between the project team and the customer. 1 2 3 4 5 0
b) The project scope was well defined in the planning phase 1 2 3 4 5 0 Q23. The common methods used to communicate with client in this project are: Never Seldom Sometimes Often Always Informal meeting 1 2 3 4 5 Formal meeting 1 2 3 4 5 Email 1 2 3 4 5 Telephone 1 2 3 4 5 Others 1 2 3 4 5 Q24. The common methods used to communicate within the project team in this project are: Never Seldom Sometimes Often Always Informal meeting 1 2 3 4 5 Formal meeting 1 2 3 4 5 Email 1 2 3 4 5 Telephone 1 2 3 4 5 Others 1 2 3 4 5 Q25. The aims of formal, periodic meeting or direct communication within project team are: Strongly Strongly No disagree agree opinion a) To report to senior manager and/ or project sponsor 1 2 3 4 5 0 b) Monitoring progress to detect problems and to indicate remedies planned or in process.
1 2 3 4 5 0
c) To have a bigger-picture awareness (meetings give team members the chance to catch up on what other members in the team have been doing, etc.)
1 2 3 4 5 0

Appendix A 217
d) To force the project team into action to be on schedule (formal meetings are held at clearly defined project milestones)
1 2 3 4 5 0
e) To create peer pressure (based on the commitment of project team members in the meeting)
1 2 3 4 5 0
f) To motivate team spirit, team work 1 2 3 4 5 0 Q26. Describe the leadership style in the project:
Democratic, all the members participate in making decision process To consult project team before project manager makes decision Project manager makes all decision without consulting People-oriented leadership Work-oriented leadership Others………………………………………………………………………….. Unclear
Q27. The level of resources available in the planning stage is: Very low Very high No opinion Manpower 1 2 3 4 5 0 Time 1 2 3 4 5 0 Budget 1 2 3 4 5 0 Infrastructure 1 2 3 4 5 0 Others 1 2 3 4 5 0 PLANNING PERFORMANCE Q28. Please evaluate the project plan Strongly Strongly No disagree agree opinion a) The requirements and specifications were well defined in
planning stage 1 2 3 4 5 0
b) Time and effort for development process were well estimated
1 2 3 4 5 0
c) The project schedule (translation of labor estimates into a calendar) was well defined in planning stage
1 2 3 4 5 0
d) The risk matter were mentioned in project plan 1 2 3 4 5 0 Q29. Time spent for planning work accounts for ………… % of elapsed time Q30. Manpower spent for planning work accounts for ………… % of total employees involved in the
whole project PROJECT OUTCOMES Q31. The completion of the project is Ahead of schedule Over 30% behind schedule
On time Over 50% behind schedule
Q32. The real cost spent for the project Ahead of budget Over 30% cost overrun
Within planned budget Over 50% cost overrun
Q33. Please evaluate the project outcomes in other aspects: Strongly Strongly No disagree agree opinion a) The delivered software product met all specifications
defined in planning stage 1 2 3 4 5 0
b) The project result has satisfied the customer need 1 2 3 4 5 0 c) The project has contributed to enhance your company
image 1 2 3 4 5 0
d) The project has brought the financial benefits to your company
1 2 3 4 5 0

218 Appendix A
e) The project team capability was improved thanks to participate in the project
1 2 3 4 5 0
f) The project team satisfied with financial benefits thanks to participate in the project
1 2 3 4 5 0
g) The project is evaluated as success by the project team 1 2 3 4 5 0 h) The project is evaluated as success by the parent company 1 2 3 4 5 0 i) The project is evaluated as success by the customer 1 2 3 4 5 0 j) The project is evaluated as success by the sponsor 1 2 3 4 5 0

Appendix A 219
APPENDIX A.3: QUESTIONNAIRES FOR IN-DEPTH INTERVIEW (For project leaders or managers in software companies)
COMPANY INFORMATION Q1. Name of organization: ……………………………………………………………………… Address: …………………………………………………………………………………….. Telephone: …………………………… Website: ……………………………………….…. Q2. Enterprise ownership: Foreign investment Local Q3. Number of employees in software activity: ………………………………………………… Q4. What kind of software products that your company has produced?
Medicine Construction Transportation Tourism Telecommunication Agriculture/ Forestry and Sea–food Government administration Education and Training Entertainment Commercial and Service
Finance & Accounting Manufacturing Q5. Who are your company’ main clients? Foreign organizations Local America Private organizations India Government organizations Asia countries End-users Europe countries PROJECT INFORMATION Q6. What kind of project were you last involved in? Name: ……………………………………...
Package software Custom software Service software Others ………………………............
Q7. Who is your client? …………………………………………………………………………… Q8. What were you responsible for? ……………………………………………………………… Q9. The duration of the project: …………………………………………………………………... Q10. The cost of project: …………………………………………………………………………… Q11. The number of people in project team: ……………………………………………………….. PLANNING PROCESS Q12. Identify project scope and objectives
- What are project objectives? - Who are stakeholders in the project? - How to modify the objectives in the light of stakeholder analysis? - How to measure for meeting the objectives? - What is extent of project leader’ power? - How does objectives defining effect on time and effort for setting the project plan? - Does the project leader satisfy with his power in product specifications? Why? - How many years were you in the position of project managers/ leaders? - How many projects have you participated in as project managers/ leaders? - How do these experiences help you in handle the planning of this project?

220 Appendix A
Q13. Identifying project infrastructure
- How did the project select the team members? - Please evaluate the performance of these team members in planning. What their knowledge/
experiences are important for planning? - How were the communication procedures with customers and within project team established? - Did the personnel of sale and marketing department participate in project team? How are their
roles in planning? - Please evaluate the effectiveness of these communication methods.
Q14. Analyze project characteristics
- What was life-cycle method selected to apply in the development process? Why or Why not? - How did the customer’ requirements identified? (how to gather data, examine data, or test
whether the data is enough) - What is involvement of customer in the planning stage? How did it impact on the defining their
requirements? - How did the project define the constraint of resources (such as time, cost, manpower)?
Q15. Identify the project products and activities
- What are project products? What are their quality criteria? How are they identified? - How to define the activities and their relationship involved in the whole product development
process? - Did the project use any planning techniques/ method/ software for defining the project
activities? Why or Why not? - Please evaluate the effectiveness of these techniques
Q16. Estimate effort for each activity
- How was effort defined for each activity? - Did the project use any estimation methods/ software? Why or Why not? - Please evaluate the effectiveness of these methods/ techniques.
Q17. Identify activity risks
- Were the risks matter mentioned in the planning and for every activity? How? - Did the project apply any risk assessment analysis techniques? What is its effectiveness? - How did risks analysis use to revise the estimation effort/ time of each activity and the whole
project? Q18. Allocate resources
- How were resources allocated for project activities? - Did resource constraints effect on this allocation
Q19. Planning revising
- Is project plan reviewed and revised during the development process? Why or Why not? How? - How this revision affect on performance of the project?
Q20. How is your evaluation of the planning performance (requirements defining, time and efforts
estimating, scheduling, etc) of this project? Q21. Time spent for planning work accounts for ………… % of elapsed time Q22. Manpower spent for planning work accounts for ………… % of total employees involved in the
whole project Q23. What are the roles of following factors to produce a good project plan? Rank in order of their
important in this project.

Appendix A 221
- Customer/ user involvement in planning stage - Experiences of project manager - Effort that project manager spent for planning - Experience of team members with system development and with establishing requirements - Technical ability of team members - The using of methods/ techniques/ software in planning - The support of top management - The commitment of sponsor (if available) - The involvement of sales and marketing department in planning - Defining of project objectives - Communication with customer - Communication within the project team members - The level of resource available
Q24. What is the role of planning to the project outcomes? PROJECT OUTCOMES Q25. The completion time of the project
Q26 The real cost spent for the project Q27. Please evaluation the project outcomes in other aspects:
- Quality of products delivered - Customer satisfactions - Organization benefits - Project team satisfaction

222 Appendix A

Appendix B
223
APPENDIX B: LIST OF SURVEYED COMPANIES Appendix B1: LIST OF SURVEYED COMPANIES – EXPLORATORY RESEARH

224 Appendix B
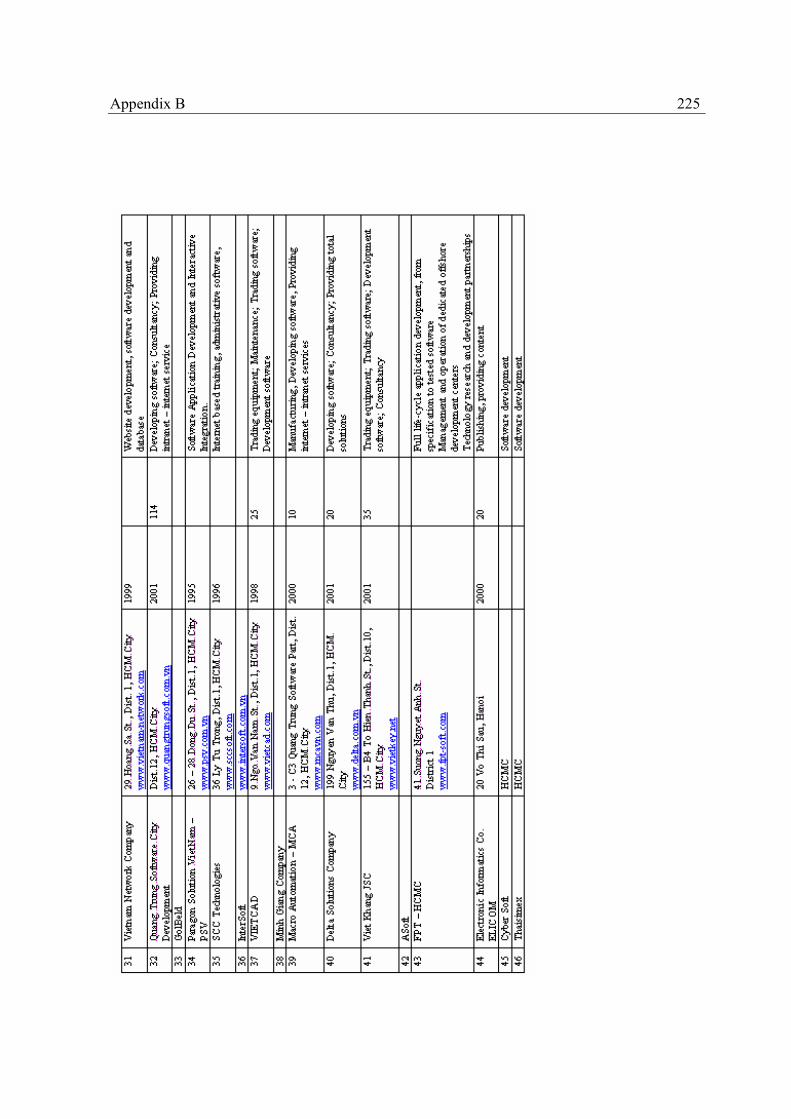
Appendix B
225
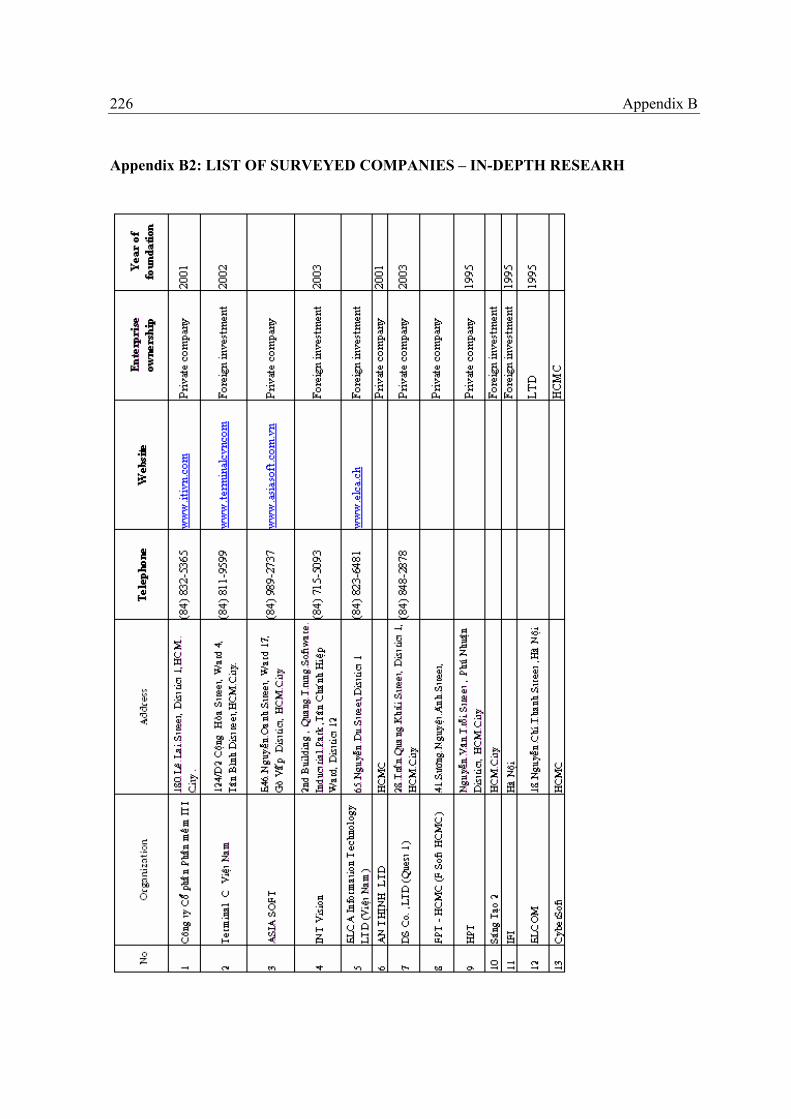
226 Appendix B
Appendix B2: LIST OF SURVEYED COMPANIES – IN-DEPTH RESEARH
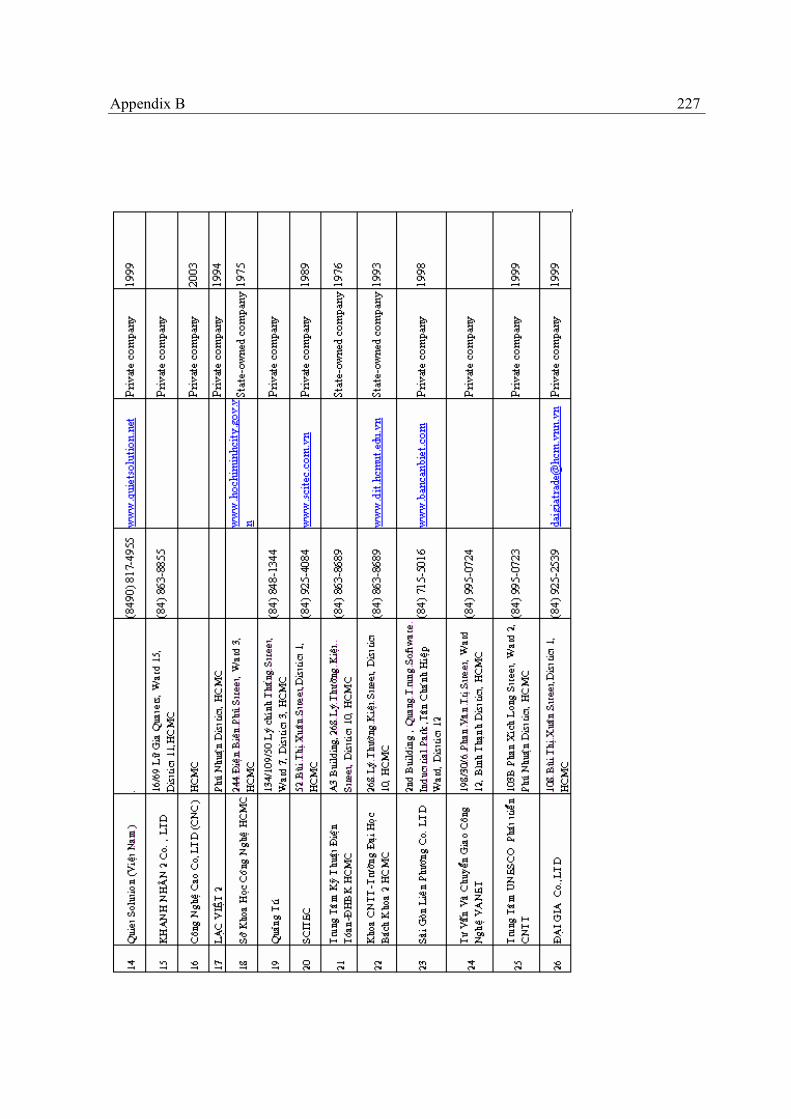
Appendix B
227
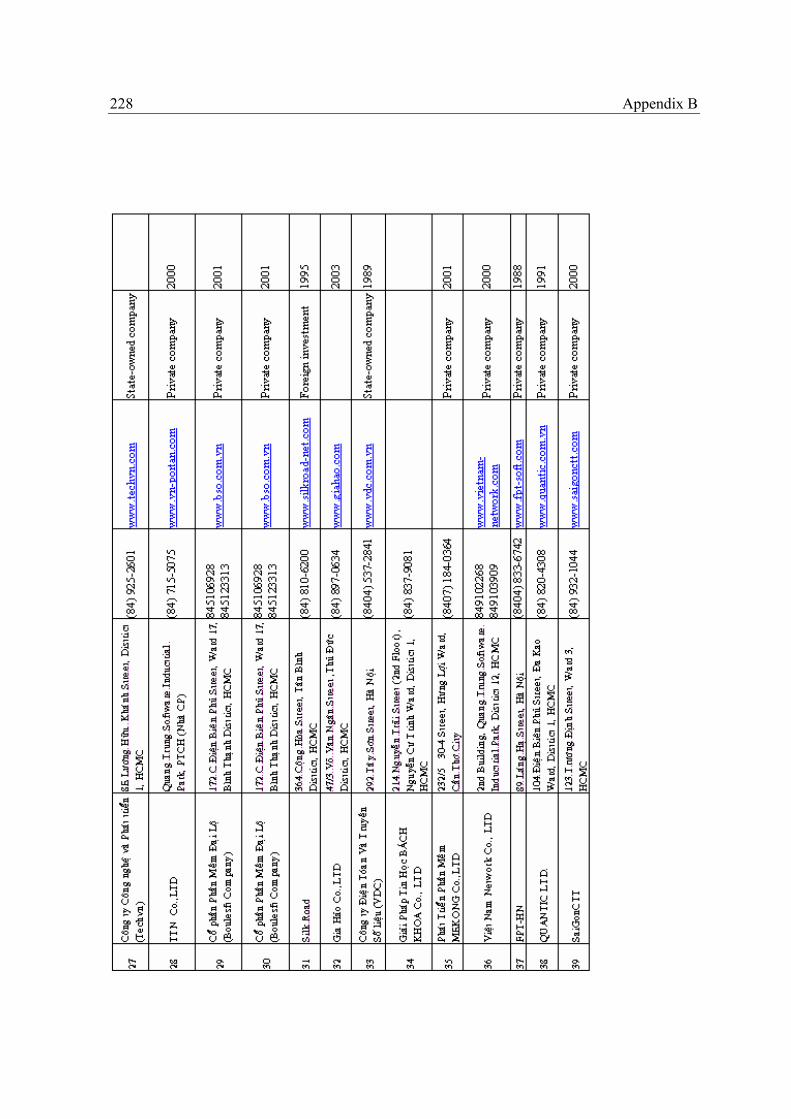
228 Appendix B

Appendix B
229
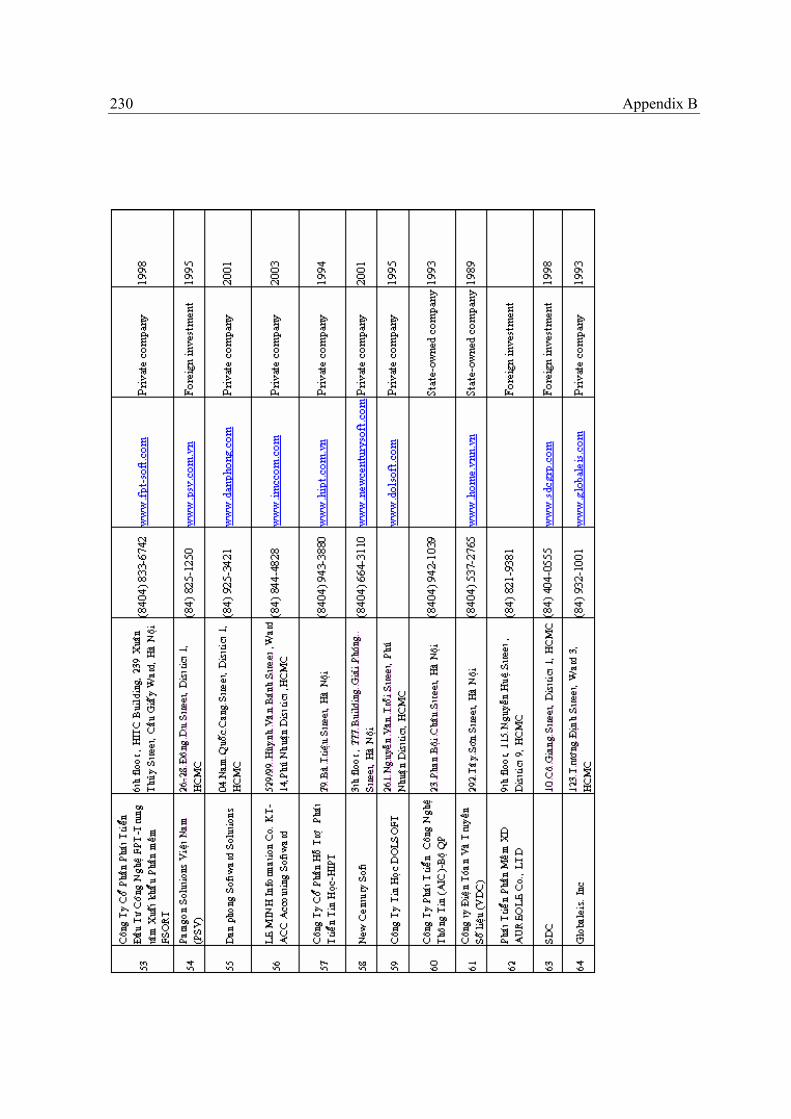
230 Appendix B

Appendix B
231

232 Appendix B
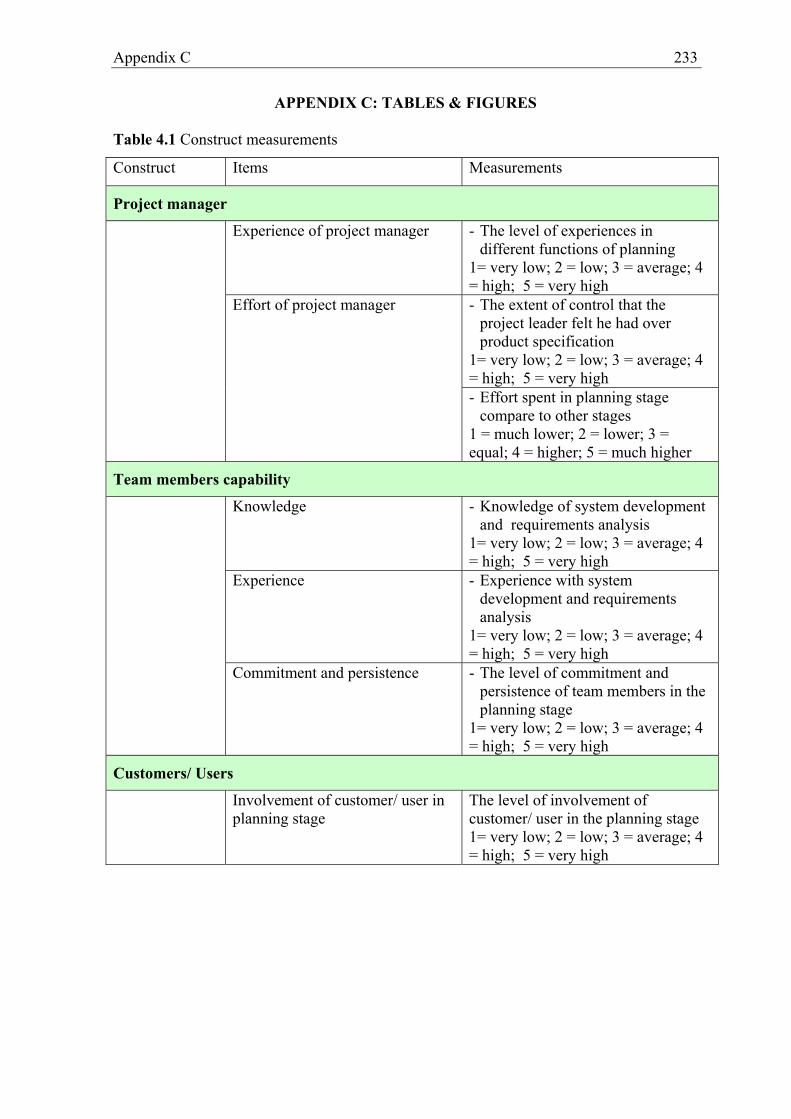
Appendix C
233
APPENDIX C: TABLES & FIGURES Table 4.1 Construct measurements
Construct Items Measurements
Project manager
Experience of project manager
- The level of experiences in different functions of planning
1= very low; 2 = low; 3 = average; 4 = high; 5 = very high - The extent of control that the
project leader felt he had over product specification
1= very low; 2 = low; 3 = average; 4 = high; 5 = very high
Effort of project manager
- Effort spent in planning stage compare to other stages
1 = much lower; 2 = lower; 3 = equal; 4 = higher; 5 = much higher
Team members capability
Knowledge - Knowledge of system development and requirements analysis
1= very low; 2 = low; 3 = average; 4 = high; 5 = very high
Experience - Experience with system development and requirements analysis
1= very low; 2 = low; 3 = average; 4 = high; 5 = very high
Commitment and persistence - The level of commitment and persistence of team members in the planning stage
1= very low; 2 = low; 3 = average; 4 = high; 5 = very high
Customers/ Users
Involvement of customer/ user in planning stage
The level of involvement of customer/ user in the planning stage 1= very low; 2 = low; 3 = average; 4 = high; 5 = very high

234 Appendix C
Technical factors
Use of project management methods
- YES/ NO Project management methods Use of planning tools/ techniques
(WBS, Gantt chart, CPM, PERT, Budget management, Handling conflicts, Progress tracking, Weekend modifiers, Overbooking of resources, Workforce assignment, others)
The use level of following tools/ techniques: 1= never; 2 = sometimes; 3 = average; 4 = frequent; 5 = very frequent
System development methods
Use of system development methods in planning ( Structure approach, Object – oriented, Interactive, Rapid application development, Rational unified process, Agile software development process, others )
- YES/ NO
Life-cycle methodology
Use of life-cycle methodology for planning: (waterfall, V-process, spiral, prototype, incremental delivery, others)
- YES/ NO
Management support
Top management support in planning stage
- The project manager was given full authority to manage the project
1 = very disagree; 2 = disagree; 3 = neutral; 4 = agree; 5 = very agree
Commitment sponsor - The project started with a committed sponsor 1 = very disagree; 2 = disagree; 3 = neutral; 4 = agree; 5 = very agree
Involvement of sale and marketing department in planning stage
- Active participation of the sales and marketing department in planning stage 1 = very disagree; 2 = disagree; 3 = neutral; 4 = agree; 5 = very agree
Involvement of client’ functional department
- Actively participation of client’s functional departments in the planning stage
1 = very disagree; 2 = disagree; 3 = neutral; 4 = agree; 5 = very agree

Appendix C
235
Objectives of project
Project objectives: o Minimize overruns in both
cost and schedule o Deliver a quality product o Customer satisfaction o Minimize cost
- The importance of objectives in the software project:
1 = very unimportant; 2 = unimportant; 3 = neutral; 4 = important; 5 = very important
Project team objective and customer objective
- The project team’ objectives and customer’ objectives were not in any conflict in the planning stage.
1 = very disagree; 2 = disagree; 3 = neutral; 4 = agree; 5 = very agree
Objective/ scope define
Project scope - The project scope was well defined in the planning phase
1 = very disagree; 2 = disagree; 3 = neutral; 4 = agree; 5 = very agree
Available of the resource
Resources available in planning stage (manpower, time, cost, infrastructure)
- The level of resources available 1= very low; 2 = low; 3 = medium; 4 = high; 5 = very high
Management style
- Democratic, all members participate in making decision process
- To consult project team before making decision
- Project manager makes all decision without consulting
- People oriented leadership - Work-oriented leadership
Applying level of management style 1= very low; 2 = low; 3 = medium; 4 = high; 5 = very high
Planning performance
Time for planning % of elapsed time
Effort for planning % of total involved in the whole project - The requirements and specifications
were well defined in the planning stage
1 = very disagree; 2 = disagree; 3 = neutral; 4 = agree; 5 = very agree
Requirements and specifications defining
- The good requirements definition is very important to have a qualify product
1 = very disagree; 2 = disagree; 3 = neutral; 4 = agree; 5 = very agree
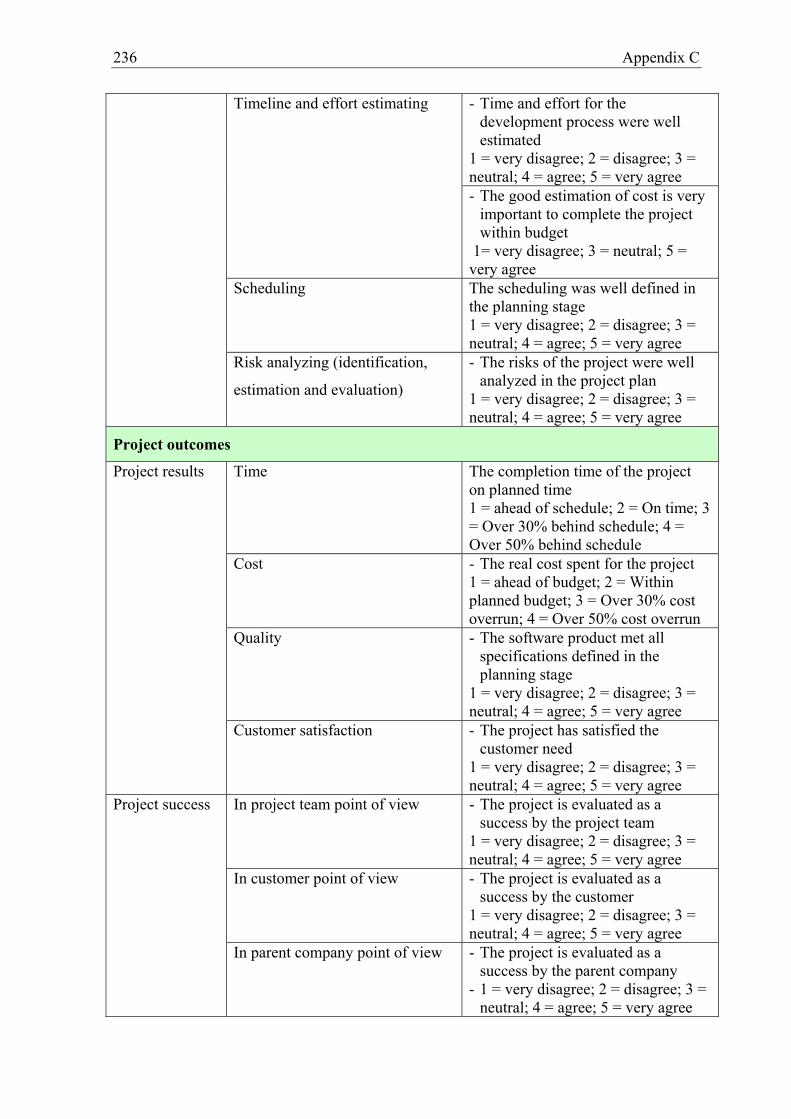
236 Appendix C
- Time and effort for the development process were well estimated
1 = very disagree; 2 = disagree; 3 = neutral; 4 = agree; 5 = very agree
Timeline and effort estimating
- The good estimation of cost is very important to complete the project within budget
1= very disagree; 3 = neutral; 5 = very agree
Scheduling The scheduling was well defined in the planning stage 1 = very disagree; 2 = disagree; 3 = neutral; 4 = agree; 5 = very agree
Risk analyzing (identification,
estimation and evaluation)
- The risks of the project were well analyzed in the project plan
1 = very disagree; 2 = disagree; 3 = neutral; 4 = agree; 5 = very agree
Project outcomes
Time The completion time of the project on planned time 1 = ahead of schedule; 2 = On time; 3 = Over 30% behind schedule; 4 = Over 50% behind schedule
Cost - The real cost spent for the project 1 = ahead of budget; 2 = Within planned budget; 3 = Over 30% cost overrun; 4 = Over 50% cost overrun
Quality - The software product met all specifications defined in the planning stage
1 = very disagree; 2 = disagree; 3 = neutral; 4 = agree; 5 = very agree
Project results
Customer satisfaction - The project has satisfied the customer need
1 = very disagree; 2 = disagree; 3 = neutral; 4 = agree; 5 = very agree
In project team point of view - The project is evaluated as a success by the project team
1 = very disagree; 2 = disagree; 3 = neutral; 4 = agree; 5 = very agree
In customer point of view - The project is evaluated as a success by the customer
1 = very disagree; 2 = disagree; 3 = neutral; 4 = agree; 5 = very agree
Project success
In parent company point of view - The project is evaluated as a success by the parent company
- 1 = very disagree; 2 = disagree; 3 = neutral; 4 = agree; 5 = very agree

Appendix C
237
In the sponsor point of view - The project is evaluated as a success by the sponsor
1 = very disagree; 2 = disagree; 3 = neutral; 4 = agree; 5 = very agree
Experience benefits - The project has enhanced the company image
1 = very disagree; 2 = disagree; 3 = neutral; 4 = agree; 5 = very agree
Organization
benefits
Financial benefits - The project has brought financial benefits to the company
1 = very disagree; 2 = disagree; 3 = neutral; 4 = agree; 5 = very agree
Capability - The project team capability was improved from participating in the project
1 = very disagree; 2 = disagree; 3 = neutral; 4 = agree; 5 = very agree
Project team
satisfaction
Financial benefits - The project team was satisfied with financial benefits from the project
1 = very disagree; 2 = disagree; 3 = neutral; 4 = agree; 5 = very agree
Project characteristics
Project duration 1 = < 6 months 2 = 6 – <12 months 3 = 12 – <18 months 4 = 18 – <24 months 5 = > 24 months
Project type - Commercial - Made to order - Outsourcing
- YES/ NO
Project ownership - Foreign - Local
- YES/ NO
Table 6.1: Correlation between using software for planning and percentage of projects completed on time

238 Appendix C
Correlations
1.000 .313*. .039
55 44.313* 1.000.039 .
44 44
Correlation CoefficientSig. (2-tailed)NCorrelation CoefficientSig. (2-tailed)N
MS project
On planned time
Spearman's rhoMS project
On plannedtime
Correlation is significant at the .05 level (2-tailed).*.
Table 6.2: Correlation between project size and percentage of project success
Correlations
1.000 .274. .091
47 39.274 1.000.091 .
39 42
Correlation CoefficientSig. (2-tailed)NCorrelation CoefficientSig. (2-tailed)N
Project size
All of three criteria
Spearman's rhoProject size
All of threecriteria
Table 6.3: Correlation between project manager’ capability and percentage of project success
Correlations
1.000 .670**. .000
55 42.670** 1.000.000 .
42 42
Correlation CoefficientSig. (2-tailed)NCorrelation CoefficientSig. (2-tailed)N
Project & Teammgt capability
All of three criteria
Spearman's rho
Project &Team mgtcapability
All of threecriteria
Correlation is significant at the .01 level (2-tailed).**.
Table 8.1: Company ownership, age and size of projects by size
N Means Std
Deviation
T - value Significant
Smaller 38 1.89 .65Ownership
Bigger 20 1.65 .59
1.454 .153
Smaller 29 5.76 5.67Age (years)
Bigger 18 5.28 3.77
.349 .729

Appendix C
239
Smaller 37 35.5 46.6Number of employees
(persons) Bigger 20 70.3 89.4
-1.621 .118
Table 8.2: Project types by size
N Means Std
Deviation
T - value Significant
Smaller 47 2.02 .68Project types *
Bigger 24 1.79 .72
1.292 .202
(*) Note: 1 = commercial software, 2 = build to order, 3 = outsourcing
Table 8.3: Project clients by size
Clients *
N Means Std
Deviation
T - value Significant
Smaller 46 .22 .42North America
Bigger 24 .29 .46
-.657 .514
Smaller 46 .02 .15South America
Bigger 24 .04 .20
-.424 .674
Smaller 46 .09 .28Asia
Bigger 24 .13 .34
-.471 .640
Smaller 46 .09 .28Europe
Bigger 24 .29 .46
-1.985 .050
Smaller 46 .46 .50Government
organization Bigger 24 .58 .50
-1.000 .322
Smaller 46 .22 .42Private
organization Bigger 24 .29 .46
-.657 .514
Smaller 46 .04 .21Individuals
Bigger 24 .04 .20
.035 .972
(*) Note: 1 = North America, 2 = South America, 3 = Asian – Pacific, 4 = Europe, 5 = India, 6 = Government
org., 7 = Private org., 8 = Individuals
Table 8.4: Human factors of projects by size
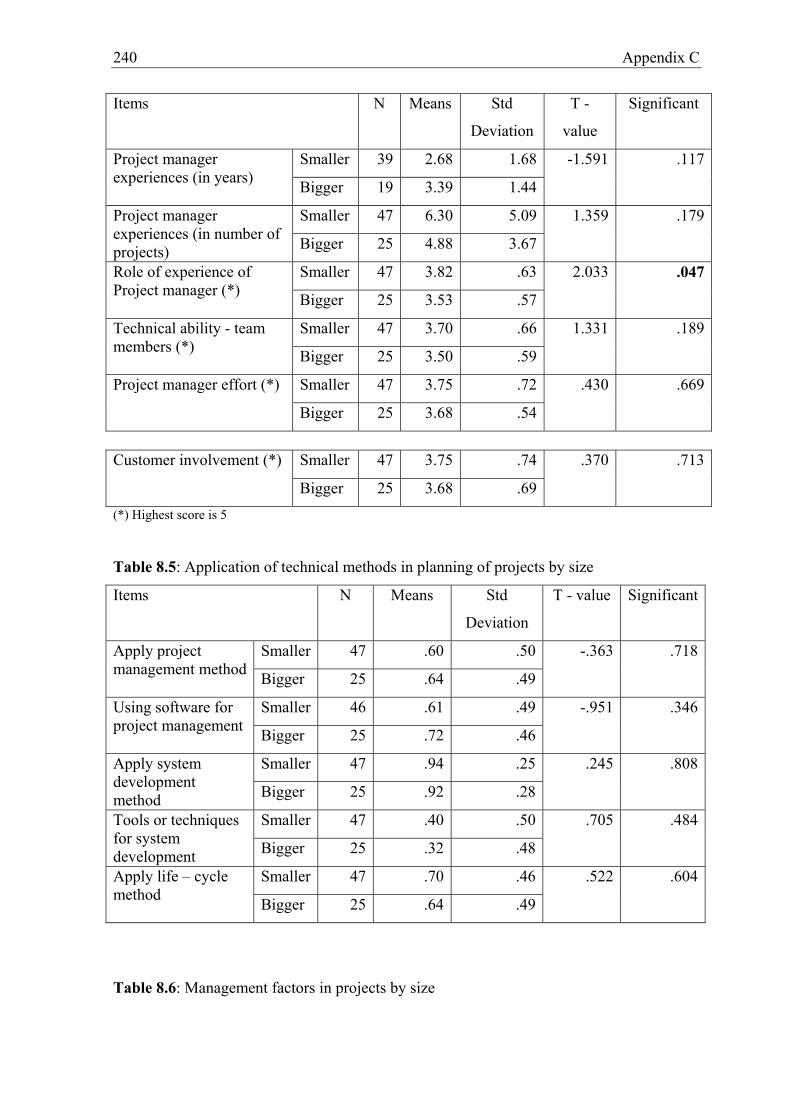
240 Appendix C
Items N Means Std
Deviation
T -
value
Significant
Smaller 39 2.68 1.68Project manager experiences (in years) Bigger 19 3.39 1.44
-1.591
.117
Smaller 47 6.30 5.09Project manager experiences (in number of projects) Bigger 25 4.88 3.67
1.359 .179
Smaller 47 3.82 .63Role of experience of Project manager (*) Bigger 25 3.53 .57
2.033 .047
Smaller 47 3.70 .66Technical ability - team members (*) Bigger 25 3.50 .59
1.331 .189
Smaller 47 3.75 .72Project manager effort (*) Bigger 25 3.68 .54
.430 .669
Smaller 47 3.75 .74Customer involvement (*)
Bigger 25 3.68 .69
.370 .713
(*) Highest score is 5
Table 8.5: Application of technical methods in planning of projects by size
Items N Means Std
Deviation
T - value Significant
Smaller 47 .60 .50Apply project management method Bigger 25 .64 .49
-.363 .718
Smaller 46 .61 .49Using software for project management Bigger 25 .72 .46
-.951 .346
Smaller 47 .94 .25Apply system development method Bigger 25 .92 .28
.245 .808
Smaller 47 .40 .50Tools or techniques for system development Bigger 25 .32 .48
.705 .484
Smaller 47 .70 .46Apply life – cycle method Bigger 25 .64 .49
.522 .604
Table 8.6: Management factors in projects by size

Appendix C
241
Factors N Means Std
Deviation
T - value Significant
Management support
Smaller 47 4.13 .74Top-down support
Bigger 25 4.16 .75
-.176 .861
Smaller 47 3.72 .77Functional support
Bigger 25 3.60 .76
.650 .518
Project objectives
Smaller 47 3.58 .76Cost and time oriented Bigger 25 3.26 .65
1.906 .062
Smaller 47 4.37 .71Customer oriented
Bigger 25 4.36 .53
.083 .934
Communication methods
Smaller 47 3.52 .91Formal meeting
Bigger 25 3.36 .81
.770 .444
Smaller 47 4.16 1.08Email
Bigger 25 4.36 .94
-.815 .418
Resource availability
Smaller 47 3.46 .74Human resource
and time
availability
Bigger 25 3.40 .87
.281 .780
Smaller 47 3.71 .76Financial
availability Bigger 25 3.68 .69
.185 .854
Management style:
Smaller 47 2.47 1.06People oriented
Bigger 25 2.60 1.15
-.475 .637
Smaller 47 3.40 1.17Work oriented
Bigger 25 3.68 1.31
-.879 .384
Smaller 47 2.09 1.12Participative
Bigger 25 2.20 1.04
-.434 .666
Smaller 47 3.87 1.23Consultative
Bigger 25 3.88 1.05
-.028 .978
Table 8.7: Company ownership, age and size of projects by ownership

242 Appendix C
N Means Std
Deviation
T -
value
Significant
International 15 4.47 3.23Age (years)
Local 39 6.03 5.28
-1.314 .196
International 17 2.59 2.35Number of employees
(persons) Local 46 2.89 3.13
-.414 .681
Table 8.8: Project types by ownership
N Means Std
Deviation
T - value Significant
International 23 1.87 .81Types *
Local 56 1.98 .62
-.596 .555
(*) Note: 1 = commercial software, 2 = build to order, 3 = outsourcing
Table 8.9: Project duration and cost of projects by ownership
N Means Std
Deviation
T -
value
Sig.
International 23 3.61 2.06 Duration *
Local 57 3.26 1.72
.711 .482
International 21 2.19 1.17 Cost **
(compared to budget) Local 57 2.46 1.28
-.868 .391
International 22 11.00 5.42 Number of people participated
in the whole project Local 50 9.02 5.47
1.423 .162
(*) 1 = < 3 month, 2 = 3 - <6 months, 3 = 6 – <9 months, 4 = 9 – <12 months, 5 = 12 – <18 months,
6 = 18 – <24 months, 7 = > 24 months
(**) 1 = < 90%, 2 = 90 – 109%, 3 = 110 – 129%, 4 = 130 – 149%, 5 = 150 – 199%, 6 = > 200%
Table 8.10: Application of technical methods in planning of projects by ownership
Items N Means Std
Deviation
T -
value
Sig.
International 23 .65 .49 Apply project management method Local 57 .51 .50
1.180 .245
Using software for International 23 .91 .29 3.994 .000
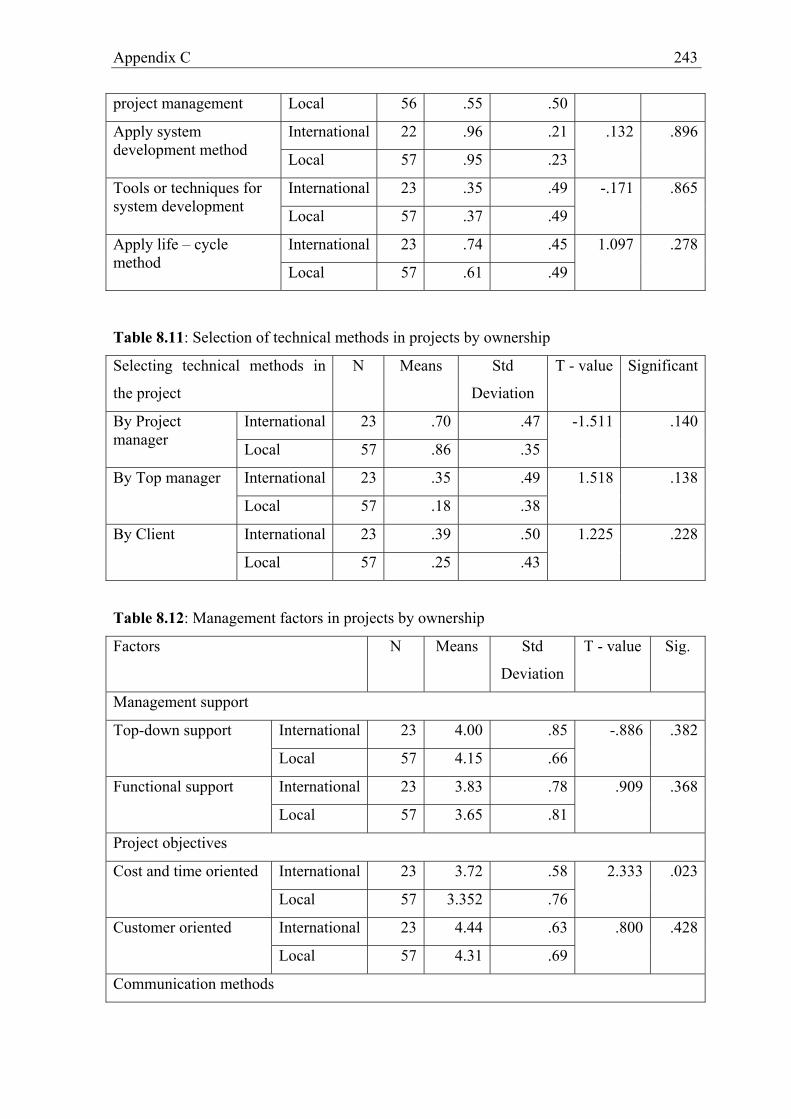
Appendix C
243
project management Local 56 .55 .50
International 22 .96 .21 Apply system development method Local 57 .95 .23
.132 .896
International 23 .35 .49 Tools or techniques for system development Local 57 .37 .49
-.171 .865
International 23 .74 .45 Apply life – cycle method Local 57 .61 .49
1.097 .278
Table 8.11: Selection of technical methods in projects by ownership
Selecting technical methods in
the project
N Means Std
Deviation
T - value Significant
International 23 .70 .47By Project manager Local 57 .86 .35
-1.511 .140
International 23 .35 .49By Top manager
Local 57 .18 .38
1.518 .138
International 23 .39 .50By Client
Local 57 .25 .43
1.225 .228
Table 8.12: Management factors in projects by ownership
Factors N Means Std
Deviation
T - value Sig.
Management support
International 23 4.00 .85 Top-down support
Local 57 4.15 .66
-.886 .382
International 23 3.83 .78 Functional support
Local 57 3.65 .81
.909 .368
Project objectives
International 23 3.72 .58 Cost and time oriented
Local 57 3.352 .76
2.333 .023
International 23 4.44 .63 Customer oriented
Local 57 4.31 .69
.800 .428
Communication methods

244 Appendix C
International 23 3.22 .85 Formal meeting
Local 57 3.52 .92
-1.395 .170
International 23 4.59 .58 Email
Local 57 4.09 1.09
2.650 .010
Resource availability
International 23 3.48 .76 Human resource and
time availability Local 57 3.42 .82
.297 .768
International 23 3.63 .64 Financial availability
Local 57 3.74 .76
-.635 .528
Management style
International 23 2.44 1.04 People oriented
Local 57 2.58 1.12
-.550 .585
International 23 3.70 1.22 Work oriented
Local 57 3.39 1.25
1.019 .314
International 23 2.39 1.16 Participative
Local 57 2.04 1.08
1.268 .212
International 23 3.74 1.10 Consultative
Local 57 3.95 1.19
-.751 .457
Table 8.13: Project outcomes of projects by ownership
Project outcomes N Means Std
Deviation
T – value Sig.
International 23 2.26 .69 Project result in term of
time (*) Local 57 2.58 .84
-1.748 .087
International 23 2.13 .81 Project result in term of
cost (**) Local 57 2.21 .92
-.383 .704
International 23 3.71 .44 Project success
Local 57 3.78 .64
-.540 .591
International 23 3.96 .71 Meet all specifications
defined in plan stage Local 57 3.98 .67
-.151 .881
International 23 4.00 .60 Satisfied customer need
Local 57 3.95 .61
.352 .727
Enhance company image International 23 4.17 .65 .428 .671

Appendix C
245
Local 57 4.11 .65
International 23 4.30 .56 Improve project team
capability Local 57 4.33 .66
-.199 .843
International 23 3.65 .83 Financial benefits to
company Local 57 3.72 .70
-.341 .735
International 23 3.39 .72 Financial benefits to team
members Local 57 3.39 .62
.031 .975
(*): 1 = under planned time, 2 = on planned time, 3 = over 30%, 4 = over 50%
(**): 1 = under planned budget, 2 = on planned budget, 3 = over 30%, 4 = over 50%
Table 8.14: Project clients of projects by type
Significant Project clients N Means Std
Deviation C – M M – O C – O
Commercial 18 .39 .50 .023
Made to order 48 .08 .28 .035
North America
Outsourcing 10 .50 .53 .593
Commercial 18 .11 .32 .019
Made to order 48 .00 .00
South America
Outsourcing 10 .00 .00 .163
Commercial 18 .17 .38 .203
Made to order 48 .04 .20 .273
Asia
Outsourcing 10 .20 .42 .838
Commercial 18 .33 .49 .050
Made to order 48 .08 .28 .880
Europe
Outsourcing 10 .10 .32 .137
Commercial 18 .00 .00
Made to order 48 .00 .00
India
Outsourcing 10 .00 .00
Commercial 18 .56 .51 .731
Made to order 48 .60 .49 .018
Government
organization
Outsourcing 10 .20 .42 .061
Commercial 18 .39 .50 .137 Private
organization Made to order 48 .19 .39 .504

246 Appendix C
Outsourcing 10 .30 .48 .651
Commercial 18 .05 .24 .564
Made to order 48 .02 .14 .457
Individuals
Outsourcing 10 .10 .32 .703
Table 8.15: Project duration, cost and size of projects by type
Significant N Means Std
Deviation C – M M – O C – O
Commercial 18 3.83 1.69 .345
Made to order 49 3.37 1.95 .356
Project duration
(*)
Outsourcing 10 2.90 1.29 .115
Commercial 17 3.00 1.54 .042
Made to order 48 2.13 1.06 .341
Project cost (**)
Outsourcing 10 2.60 1.43 .503
Commercial 17 10.44 5.24 .128
Made to order 43 8.6 5.14 .050
Project size
(number of people
in project team) Outsourcing 9 12.44 6.17 .544(*) 1 = < 3 month, 2 = 3 - <6 months, 3 = 6 – <9 months, 4 = 9 – <12 months, 5 = 12 – <18 months,
6 = 18 – <24 months, 7 = > 24 months
(**) 1 = < 90%, 2 = 90 – 109%, 3 = 110 – 129%, 4 = 130 – 149%, 5 = 150 – 199%, 6 = > 200%
Table 8.16: Human factors in projects by type
Significant Human factors N Means Std
Deviation C - M M - O C - O
Commercial 13 3.62 1.45 .069
Made to order 39 2.68 1.79 .208
Project manager experiences (in years) Outsourcing 9 3.44 1.51 .794
Commercial 18 6.17 5.52 .792
Made to order 49 5.78 4.78 .424
Project manager experiences (in number of projects)
Outsourcing 10 7.5 6.20 .579
Commercial 18 3.83 .57 .320 Role of
experience of Made to order 49 3.67 .59 .783

Appendix C
247
Project manager Outsourcing 10 3.60 .78 .418
Commercial 18 3.76 .64 .287
Made to order 49 3.57 .61 .448
Technical ability - team members
Outsourcing 10 3.67 .78 .191
Commercial 18 3.97 .61 .046
Made to order 49 3.62 .63 .497
Project manager effort
Outsourcing 10 3.45 .73 .050
Commercial 18 4.17 .78 .009
Made to order 49 3.57 .70 .719
Customer
involvement
Outsourcing 10 3.50 .53 .013
Table 8.17: Technical factors in projects by type
Significant Technical factors N Means Std
Deviation C - M M - O C - O
Commercial 18 .56 .51 .974
Made to order 49 .55 .50 .788
Apply project management method Outsourcing 10 .60 .52 .829
Commercial 18 .83 .38 .024
Made to order 48 .56 .50 .430
Using software for project management Outsourcing 10 .70 .48 .464
Commercial 18 .94 .24 .800
Made to order 49 .96 .20 .159
Apply system development method
Outsourcing 9 1.00 .00 .331
Commercial 18 .28 .46 .493
Made to order 49 .37 .49 .119
Tools or techniques for system development Outsourcing 10 .60 .52 .214
Commercial 18 .50 .52 .199
Made to order 49 .67 .47 .412
Apply life – cycle method
Outsourcing 10 .80 .42 .110
Table 8.18 Selection of technical tools and methods in projects by type
N Means Std Significant
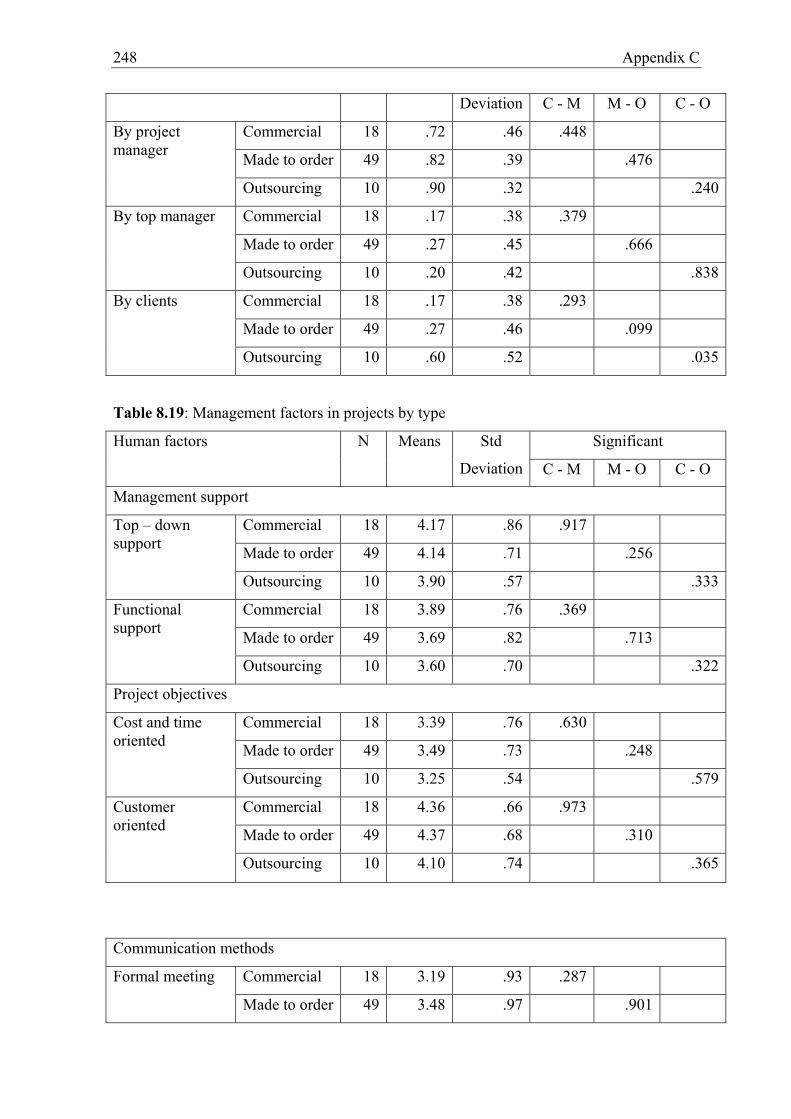
248 Appendix C
Deviation C - M M - O C - O
Commercial 18 .72 .46 .448
Made to order 49 .82 .39 .476
By project manager
Outsourcing 10 .90 .32 .240
Commercial 18 .17 .38 .379
Made to order 49 .27 .45 .666
By top manager
Outsourcing 10 .20 .42 .838
Commercial 18 .17 .38 .293
Made to order 49 .27 .46 .099
By clients
Outsourcing 10 .60 .52 .035
Table 8.19: Management factors in projects by type
Significant Human factors N Means Std
Deviation C - M M - O C - O
Management support
Commercial 18 4.17 .86 .917
Made to order 49 4.14 .71 .256
Top – down support
Outsourcing 10 3.90 .57 .333
Commercial 18 3.89 .76 .369
Made to order 49 3.69 .82 .713
Functional support
Outsourcing 10 3.60 .70 .322
Project objectives
Commercial 18 3.39 .76 .630
Made to order 49 3.49 .73 .248
Cost and time oriented
Outsourcing 10 3.25 .54 .579
Commercial 18 4.36 .66 .973
Made to order 49 4.37 .68 .310
Customer oriented
Outsourcing 10 4.10 .74 .365
Communication methods
Commercial 18 3.19 .93 .287 Formal meeting
Made to order 49 3.48 .97 .901
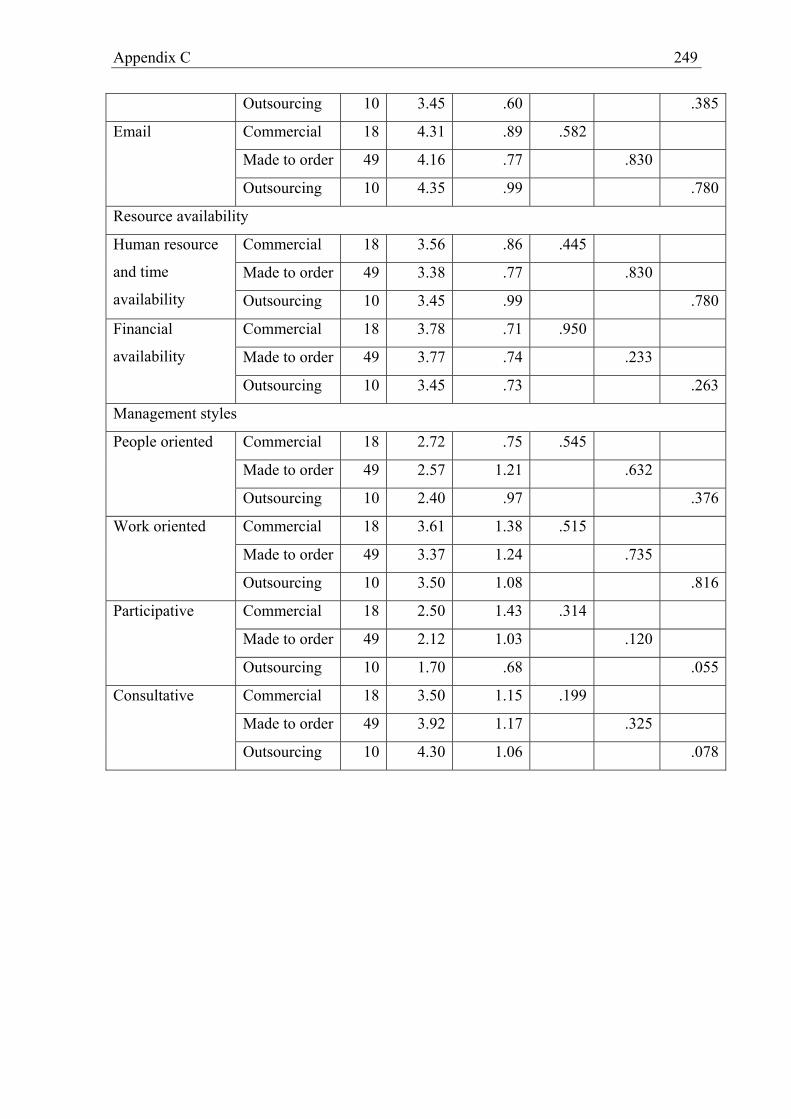
Appendix C
249
Outsourcing 10 3.45 .60 .385
Commercial 18 4.31 .89 .582
Made to order 49 4.16 .77 .830
Outsourcing 10 4.35 .99 .780
Resource availability
Commercial 18 3.56 .86 .445
Made to order 49 3.38 .77 .830
Human resource
and time
availability Outsourcing 10 3.45 .99 .780
Commercial 18 3.78 .71 .950
Made to order 49 3.77 .74 .233
Financial
availability
Outsourcing 10 3.45 .73 .263
Management styles
Commercial 18 2.72 .75 .545
Made to order 49 2.57 1.21 .632
People oriented
Outsourcing 10 2.40 .97 .376
Commercial 18 3.61 1.38 .515
Made to order 49 3.37 1.24 .735
Work oriented
Outsourcing 10 3.50 1.08 .816
Commercial 18 2.50 1.43 .314
Made to order 49 2.12 1.03 .120
Participative
Outsourcing 10 1.70 .68 .055
Commercial 18 3.50 1.15 .199
Made to order 49 3.92 1.17 .325
Consultative
Outsourcing 10 4.30 1.06 .078

250 Appendix C
Table 8.20: Project outcomes of projects by type
Significant N Means Std
Deviation C - M M - O C - O
Commercial 18 2.50 .86 .892
Made to order 49 2.45 .82 .395
Project result in
term of time (*)
Outsourcing 10 2.70 .82 .551
Commercial 18 2.33 1.08 .506
Made to order 49 2.14 .84 .624
Project result in
term of cost (**)
Outsourcing 10 2.00 .82 .368
Commercial 18 3.74 .57 .961
Made to order 49 3.75 .55 .858
Project success
Outsourcing 10 3.70 .79 .888
Commercial 18 4.11 .58 .442
Made to order 49 3.98 .69 .025
Meet all specs.
defined in plan
stage Outsourcing 10 3.50 .53 .010
Commercial 18 3.94 .54 .924
Made to order 49 3.96 .61 .816
Satisfied
customer need
Outsourcing 10 3.90 .74 .869
Commercial 18 4.22 .65 .655
Made to order 49 4.14 .61 .220
Enhance
company image
Outsourcing 10 3.80 .92 .168
Commercial 18 4.22 .88 .580
Made to order 49 4.35 .56 .789
Improve project
team capability
Outsourcing 10 3.20 .79 .765
Commercial 18 3.67 .69 .972
Made to order 49 3.67 .75 .690
Financial benefits
to company
Outsourcing 10 4.30 .48 .694
Commercial 18 3.44 .70 .848
Made to order 49 3.41 .61 .447
Financial benefits to team members
Outsourcing 10 3.70 .67 .426 (*): 1 = under planned time, 2 = on planned time, 3 = over 30%, 4 = over 50%
(**): 1 = under planned budget, 2 = on planned budget, 3 = over 30%, 4 = over 50%

Appendix C
251
Table 9.1: Summary of Variables and measures
Dependent variables Variable description
Planning performance Evaluations the planning performance in terms of:
Requirements and technical specifications
definition; Timeline and effort estimation;
Scheduling and Risk analysis.
Success of the project Evaluations success of the project by customer;
parent company and by customer
Project outcome in term of time Level of completion on time of project
Project outcome in term of cost Level of completion within budget of project
Non-financial benefit of the project Evaluations project outcomes in terms of: quality
delivery; customer satisfaction; company image
enhancement; team member capability
improvement.
Financial benefits of the project Evaluations project outcomes in terms of: financial
benefits to company and to team members
Independent variables Variable description
Human factors
- Project managers experiences
- Project manager effort
- Team members capability
- Customer involvement
Level of PM’s experiences in different functions of
planning
Level of effort spent; extent of control over
product specification
Knowledge – Experience of team members on
system development and requirement analysis;
commitment and persistence
Level of customer involvement in planning
Technical factors: Applying
- Project management method
- System Development method
- Life-cycle method
2 most frequent methods: Object-oriented & RUP
2 most frequent methods: Waterfall & Spiral
Management factors
- Management support
Level of authority of Project manager; level of
participation of functional department in planning

252 Appendix C
- Project objectives
- Leadership and decision making
styles
- Availability of resources
Time & cost oriented; customer oriented
Levels of adopted styles in project management
(People oriented, customer oriented, consulting
before making decision)
Level of availability of human resource & time;
level of availability of budget and infrastructure.

Appendix C
253
Table 9.2. PARAMETER ESTIMATES BY FACTOR ANALYSIS

254 Appendix C
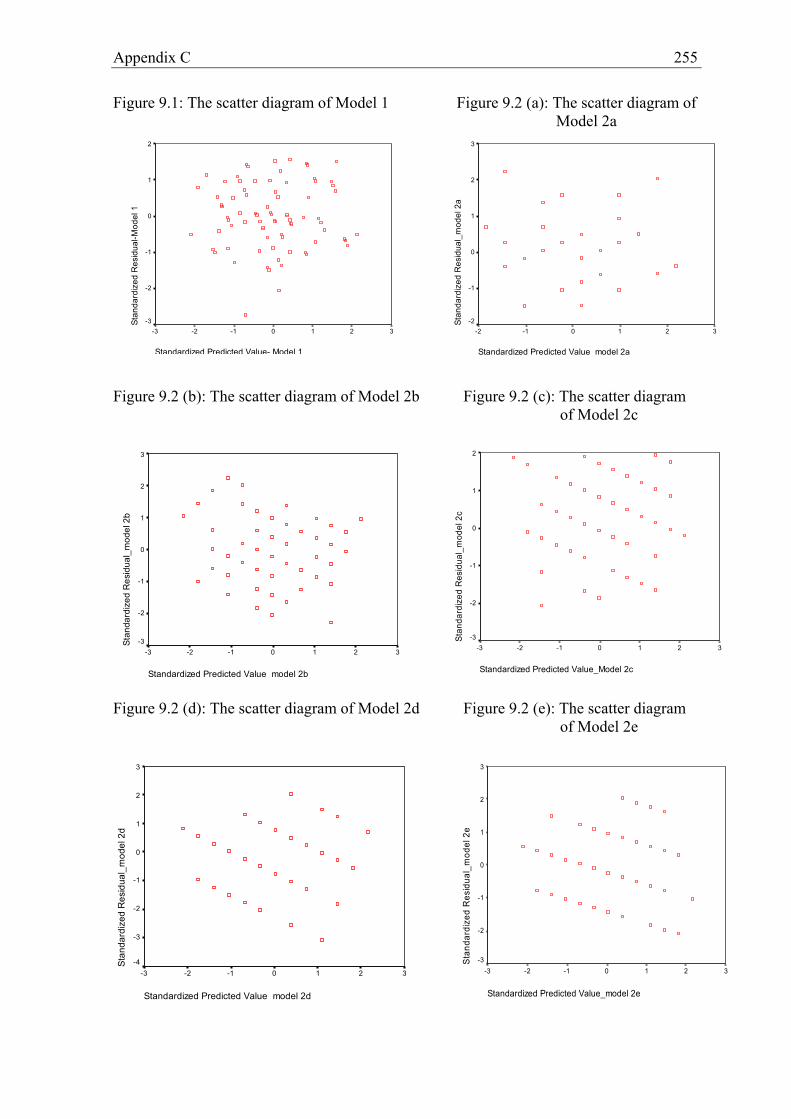
Appendix C
255
Figure 9.1: The scatter diagram of Model 1 Figure 9.2 (a): The scatter diagram of Model 2a
Figure 9.2 (b): The scatter diagram of Model 2b Figure 9.2 (c): The scatter diagram
of Model 2c Figure 9.2 (d): The scatter diagram of Model 2d Figure 9.2 (e): The scatter diagram
of Model 2e
Standardized Predicted Value model 2a
3210-1-2
Stan
dard
ized
Res
idua
l_m
odel
2a
3
2
1
0
-1
-2
Standardized Predicted Value- Model 1
3210-1-2-3
Stan
dard
ized
Res
idua
l-Mod
el 1
2
1
0
-1
-2
-3
Standardized Predicted Value model 2b
3210-1-2-3
Stan
dard
ized
Res
idua
l_m
odel
2b
3
2
1
0
-1
-2
-3
Standardized Predicted Value_Model 2c
3210-1-2-3
Stan
dard
ized
Res
idua
l_m
odel
2c
2
1
0
-1
-2
-3
Standardized Predicted Value model 2d
3210-1-2-3
Stan
dard
ized
Res
idua
l_m
odel
2d
3
2
1
0
-1
-2
-3
-4
Standardized Predicted Value_model 2e
3210-1-2-3
Stan
dard
ized
Res
idua
l_m
odel
2e
3
2
1
0
-1
-2
-3

256 Appendix C
Figure 9.3: The scatter diagram of Model 3 Table 9.3: Spearman Correlation testing for Model 1 Correlation between ABS residual of Model 1 and …
Spearman's rho Correlation
Sig. (2-tailed) N
ABS residual of Model 1 1.000 80 Project manager effort .046 .920 Project manager experiences .061 .720 Team members ability .044 .696 Customer involvement .029 .796 Apply PM method -.001 .992 Object - oriented .063 .580 RUP -.053 .639 Waterfall -.073 .521 Spiral .122 .282 Management support .016 .886 Cost and time oriented .022 .849 Customer oriented .018 .876 Resource availability .096 .395 People oriented .204 .069 Work oriented -.225 .044
* Correlation is significant at the 0.05 level (2-tailed). ** Correlation is significant at the 0.01 level (2-tailed). Table 9.4: Spearman Correlation testing for Model 2 Correlation between ABS residual of …
Spearman's rho Correlation
Sig. (2-tailed) N
ABS residual of Model 2a 1.000 80 Planning performance .176 .117
Standardized Predicted Value_model 3
3210-1-2-3
Stan
dard
ized
Res
idua
l_m
odel
32
1
0
-1
-2
-3

Appendix C
257
ABS residual of Model 2b 1.000 Planning performance -.048 .673 ABS residual of Model 2c 1.000 Planning performance -.048 .673 ABS residual of Model 2d 1.000 Planning performance -.048 .673 ABS residual of Model 2e 1.000 Planning performance -.048 .673
Table 9.5: Spearman Correlation testing for Model 3 Correlation between ABS residual of Model 3 and …
Spearman's rho Correlation
Sig. (2-tailed) N
ABS residual of Model 3 1.000 72 Project manager effort .040 .739 Project manager experiences .012 .921 Team members ability .043 .723 Customer involvement -.050 .678 Apply PM method -.140 .241 Object - oriented .120 .317 RUP -.110 .358 Waterfall -.007 .951 Spiral .052 .662 Management support -.005 .964 Cost and time oriented .050 .675 Customer oriented .100 .402 Resource availability .020 .866 People oriented .279 .017 Work oriented -.289 .014 Project size .211 .075 Project ownership -.022 .856

258 Appendix C
Figure 9.4 Histogram of standardized residual Figure 9.5 Histogram of standardized Model 1 residual - Model 3 Figure 9.6 (a) Histogram of standardized residual Figure 9.6 (b) Histogram of - Model 2a standardized residual - Model 2b Figure 9.6 (c) Histogram of standardized residual Figure 9.6 (d) Histogram of - Model 2c standardized residual - Model 2d
Standardized Residual-Model 1
1.501.25
1.00.75
.50.25
0.00-.25
-.50-.75
-1.00-1.25
-1.50-1.75
-2.00-2.25
-2.50-2.75
14
12
10
8
6
4
2
0
Std. Dev = .90 Mean = 0.00
N = 80.00
Standardized Residual_model 3
1.751.50
1.251.00
.75.50.250.00-.25
-.50-.75
-1.00-1.25
-1.50-1.75
-2.00-2.25
-2.50-2.75
-3.00
12
10
8
6
4
2
0
Std. Dev = .87 Mean = 0.00
N = 72.00
Regression Standardized Residual
2.001.501.00.500.00-.50-1.00-1.50
Dependent Variable: Project success
Freq
uenc
y
10
8
6
4
2
0
Std. Dev = .99 Mean = 0.00
N = 35.00
Regression Standardized Residual
2.252.00
1.751.50
1.251.00
.75.50.250.00-.25
-.50-.75
-1.00-1.25
-1.50-1.75
-2.00-2.25
Dependent Variable: Non-financial benefits
Freq
uenc
y
12
10
8
6
4
2
0
Std. Dev = .99 Mean = 0.00
N = 80.00
Regression Standardized Residual
2.001.50
1.00.50
0.00-.50
-1.00-1.50
-2.00-2.50
-3.00
Dependent variable: Completion Time
Freq
uenc
y
20
10
0
Std. Dev = .99 Mean = 0.00
N = 80.00
Regression Standardized Residual
2.001.50
1.00.50
0.00-.50
-1.00-1.50
-2.00
Dependent Variable: Completion cost
Freq
uenc
y
16
14
12
10
8
6
4
2
0
Std. Dev = .99 Mean = 0.00
N = 80.00
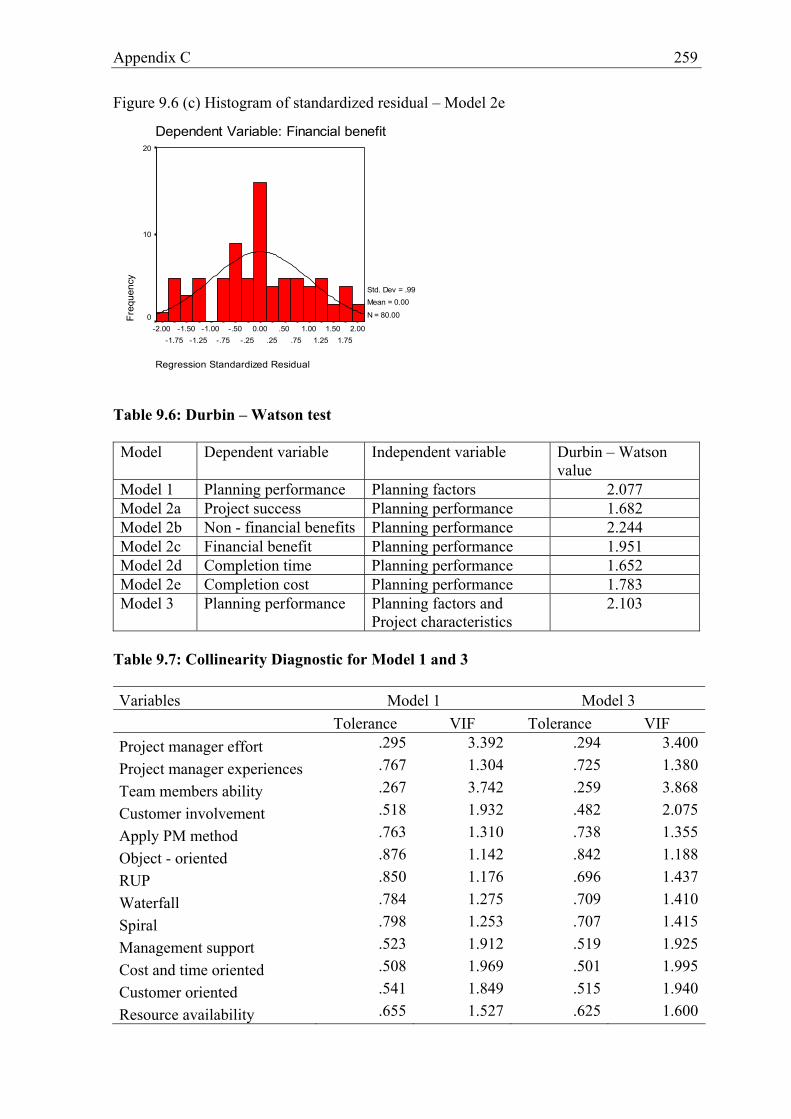
Appendix C
259
Figure 9.6 (c) Histogram of standardized residual – Model 2e Table 9.6: Durbin – Watson test Model Dependent variable Independent variable Durbin – Watson
value Model 1 Planning performance Planning factors 2.077 Model 2a Project success Planning performance 1.682 Model 2b Non - financial benefits Planning performance 2.244 Model 2c Financial benefit Planning performance 1.951 Model 2d Completion time Planning performance 1.652 Model 2e Completion cost Planning performance 1.783 Model 3 Planning performance Planning factors and
Project characteristics 2.103
Table 9.7: Collinearity Diagnostic for Model 1 and 3 Variables Model 1 Model 3 Tolerance VIF Tolerance VIF Project manager effort .295 3.392 .294 3.400
Project manager experiences .767 1.304 .725 1.380
Team members ability .267 3.742 .259 3.868
Customer involvement .518 1.932 .482 2.075
Apply PM method .763 1.310 .738 1.355
Object - oriented .876 1.142 .842 1.188
RUP .850 1.176 .696 1.437
Waterfall .784 1.275 .709 1.410
Spiral .798 1.253 .707 1.415
Management support .523 1.912 .519 1.925
Cost and time oriented .508 1.969 .501 1.995
Customer oriented .541 1.849 .515 1.940
Resource availability .655 1.527 .625 1.600
Regression Standardized Residual
2.001.75
1.501.25
1.00.75
.50.25
0.00-.25
-.50-.75
-1.00-1.25
-1.50-1.75
-2.00
Dependent Variable: Financial benefit Fr
eque
ncy
20
10
0
Std. Dev = .99 Mean = 0.00
N = 80.00
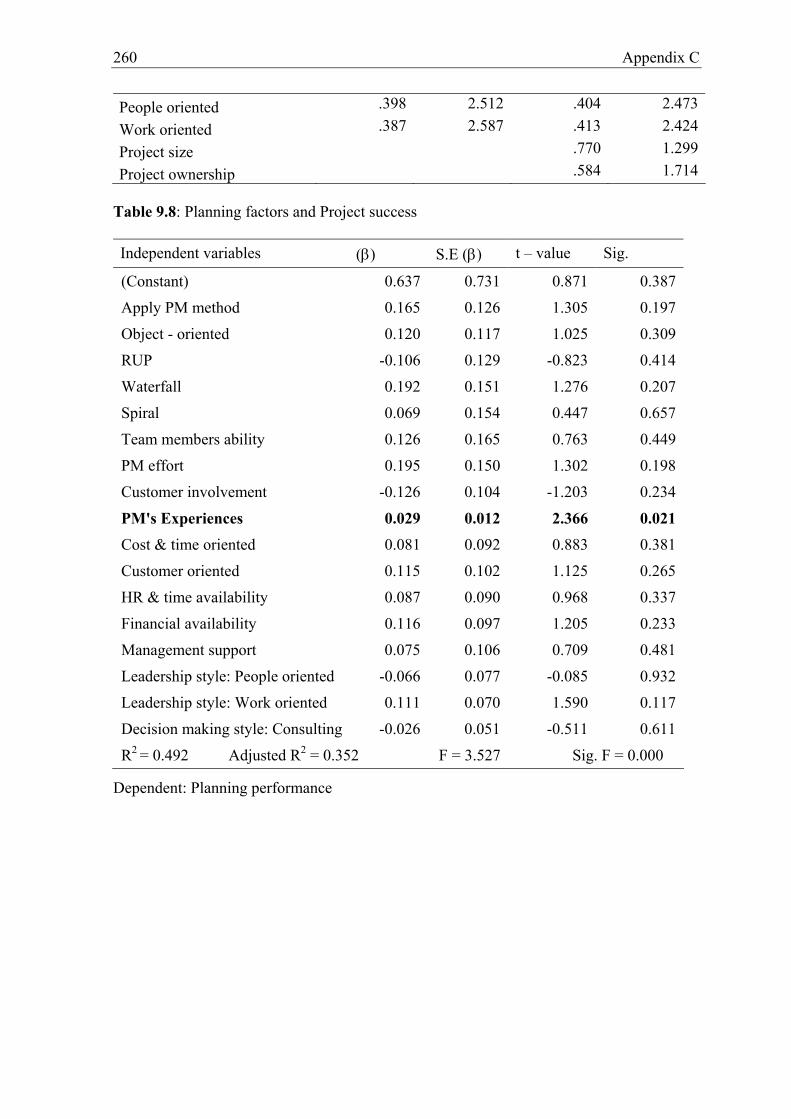
260 Appendix C
People oriented .398 2.512 .404 2.473
Work oriented .387 2.587 .413 2.424
Project size .770 1.299
Project ownership .584 1.714 Table 9.8: Planning factors and Project success Independent variables (β) S.E (β) t – value Sig.
(Constant) 0.637 0.731 0.871 0.387
Apply PM method 0.165 0.126 1.305 0.197
Object - oriented 0.120 0.117 1.025 0.309
RUP -0.106 0.129 -0.823 0.414
Waterfall 0.192 0.151 1.276 0.207
Spiral 0.069 0.154 0.447 0.657
Team members ability 0.126 0.165 0.763 0.449
PM effort 0.195 0.150 1.302 0.198
Customer involvement -0.126 0.104 -1.203 0.234
PM's Experiences 0.029 0.012 2.366 0.021 Cost & time oriented 0.081 0.092 0.883 0.381
Customer oriented 0.115 0.102 1.125 0.265
HR & time availability 0.087 0.090 0.968 0.337
Financial availability 0.116 0.097 1.205 0.233
Management support 0.075 0.106 0.709 0.481
Leadership style: People oriented -0.066 0.077 -0.085 0.932
Leadership style: Work oriented 0.111 0.070 1.590 0.117
Decision making style: Consulting -0.026 0.051 -0.511 0.611
R2 = 0.492 Adjusted R2 = 0.352 F = 3.527 Sig. F = 0.000
Dependent: Planning performance

Appendix C
261
Table 9.9: Regression Results: Planning factors and Qualitative benefits
Independent variables (β) S.E (β) t – value Sig.
(Constant) 1.418 .567 2.502 .015
Technical ability - team members -0.032 .128 -.251 .803
PM effort 0.229 .116 1.972 .053
Customer involvement 0.038 .081 .465 .644
PM's Experiences -0.006 .009 -.649 .519
Apply PM method 0.039 .098 .406 .686
Object - oriented -0.074 .091 -.819 .416
RUP -0.025 .100 -.251 .803
Waterfall 0.042 .117 .344 .732
Spiral .0233 .120 1.947 .056
Management support 0.033 .082 .406 .686
Cost & time oriented 0.057 .071 .792 .431
Customer oriented 0.300 .079 3.788 .000
HR & time availability 0.000 .069 -.010 .992
Financial availability 0.124 .075 1.661 .102
Leadership style: People oriented -0.022 .060 -.369 .713
Leadership style: Work oriented -0.009 .054 -.172 .864
Decision making style: Consulting -0.049 .040 -1.226 .225
R2 = 0.729 Adjusted R2 = 0.532 F = 4.138 Sig. F = 0.000
Dependent: Qualitative benefits

262 Appendix C
Table 9.10: Regression Results: Planning factors and Completion time
Independent variables (β) S.E (β) t – value Sig.
(Constant) 6.305 1.033 6.105 0.000
Team member’s ability -0.457 0.233 -1.957 0.055
PM effort 0.013 0.212 0.063 0.950
Customer involvement 0.097 0.147 0.658 0.513
PM's Experiences -0.007 0.017 -0.429 0.669
Apply PM method -0.177 0.179 -0.990 0.326
Object - oriented 0.035 0.165 0.214 0.832
RUP -0.017 0.182 -0.095 0.924
Waterfall 0.276 0.213 1.295 0.200
Spiral 0.261 0.218 1.199 0.235
Management support -0.126 0.149 -0.843 0.403
Cost & time oriented -0.473 0.130 -3.634 0.001
Customer oriented -0.101 0.144 -0.699 0.487
HR & time availability -0.038 0.127 -0.298 0.766
Financial availability 0.082 0.136 0.601 0.550
Leadership style: People oriented -0.066 0.109 -0.600 0.551
Leadership style: Work oriented -0.047 0.098 -0.479 0.633
Decision making style: Consulting 0.041 0.073 0.569 0.571
R2 = 0.683 Adjusted R2 = 0.497 F = 3.193 Sig. F = 0.000
Dependent: Completion time