planning operation start times for the manufacture of capital products with uncertain processing...
Post on 22-Dec-2015
216 views
TRANSCRIPT

Planning operation start timesfor the manufacture of capital products
with uncertain processing times and resource constraints
D.P. Song, Dr. C.Hicks & Dr. C.F.Earl
Department of MMM Engineering
University of Newcastle upon Tyne
ISAC, Newcastle upon Tyne, on 8-10 Sept., 2000.
Overview
1. Introduction
2. Problem formulation
3. Perturbation Analysis (PA) method
4. Simulated Annealing (SA) method
5. Case studies
6. Conclusions
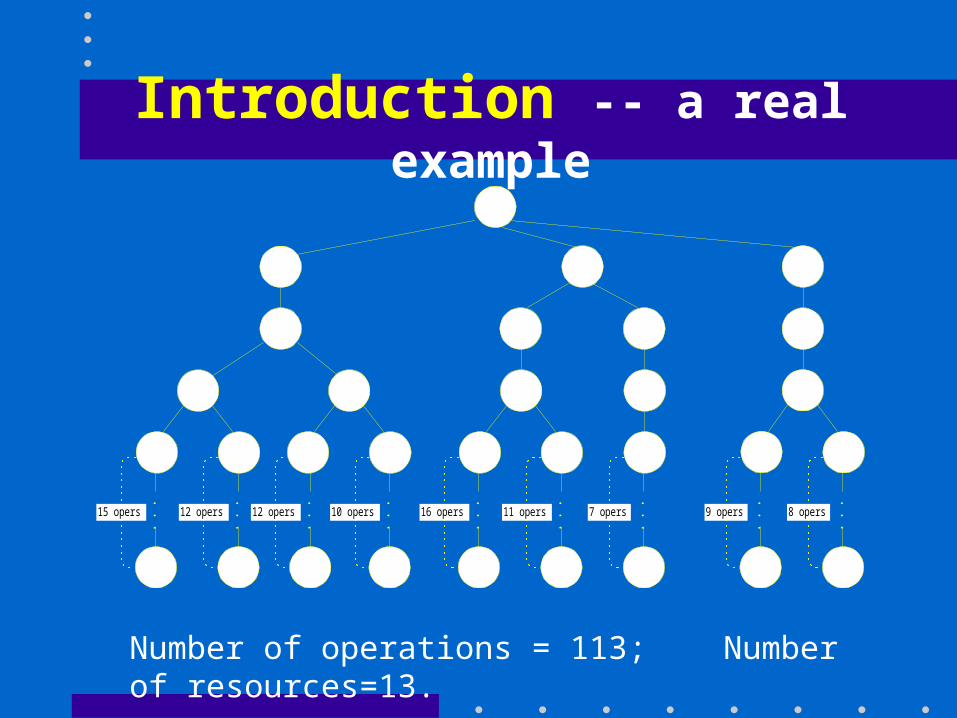
Introduction -- a real example
Number of operations = 113; Number of resources=13.
8 opers
. . .9 opers
. . .7 opers
. . .11 opers
. . .16 opers
. . .12 opers 10 opers
. . .15 opers
. . . 12 opers
. . .
. . .
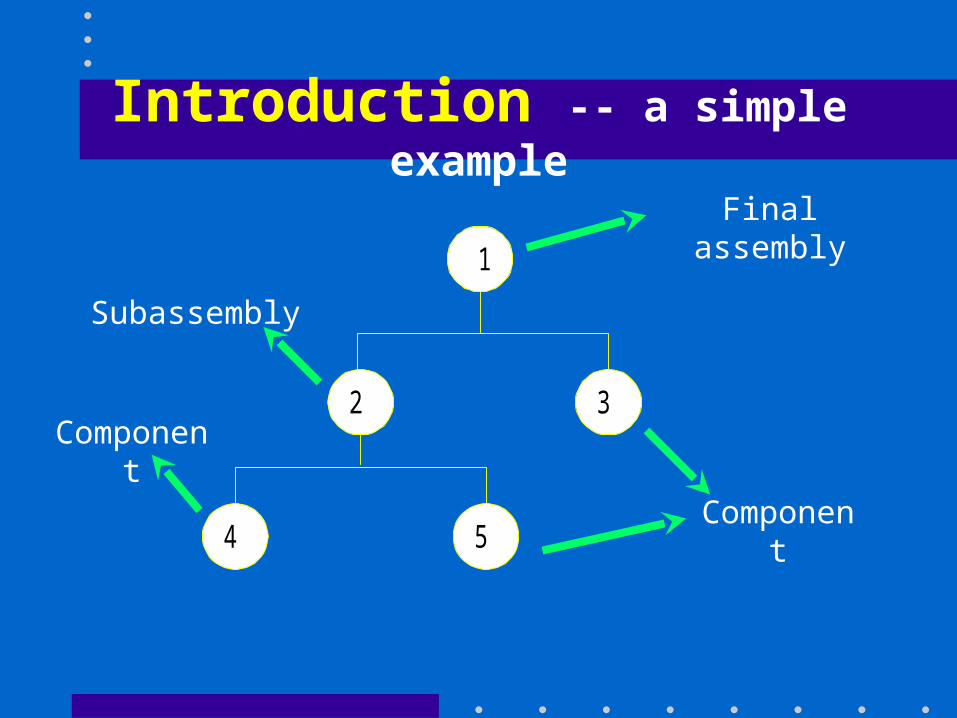
Introduction -- a simple example
1
2 3
54
Final assembly
Component
Component
Subassembly

Introduction -- operation start times
part 4
part 5
part 3
part 2
S 2S 4
S 5
S 3
due dateS 1
part 1
waiting
earliness
waiting
• Si -- part or operation start times
• Result in waiting times if {Si } is not well designed.
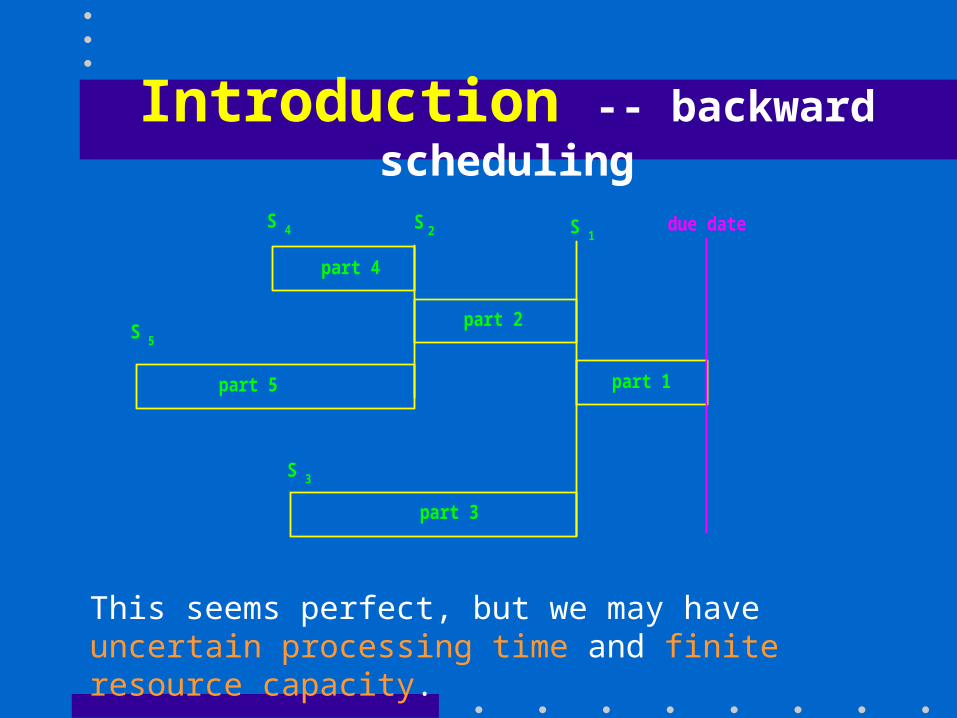
Introduction -- backward scheduling
part 4
part 5
part 3
part 2
S 2S 4
S 5
S 3
due dateS 1
part 1
This seems perfect, but we may have uncertain processing time and finite resource capacity.

Introduction -- uncertainty problem
part 4
part 5
part 3
part 2
S 2S 4
S 5
S 3
due dateS 1
part 1
Distribution of completion time
tardy probability
Uncertainty results in a high probability of tardiness.
Distribution of processing time
part 4
part 5
part 3
part 2
S 2S 4
S 5
S 3
S 1
part 1
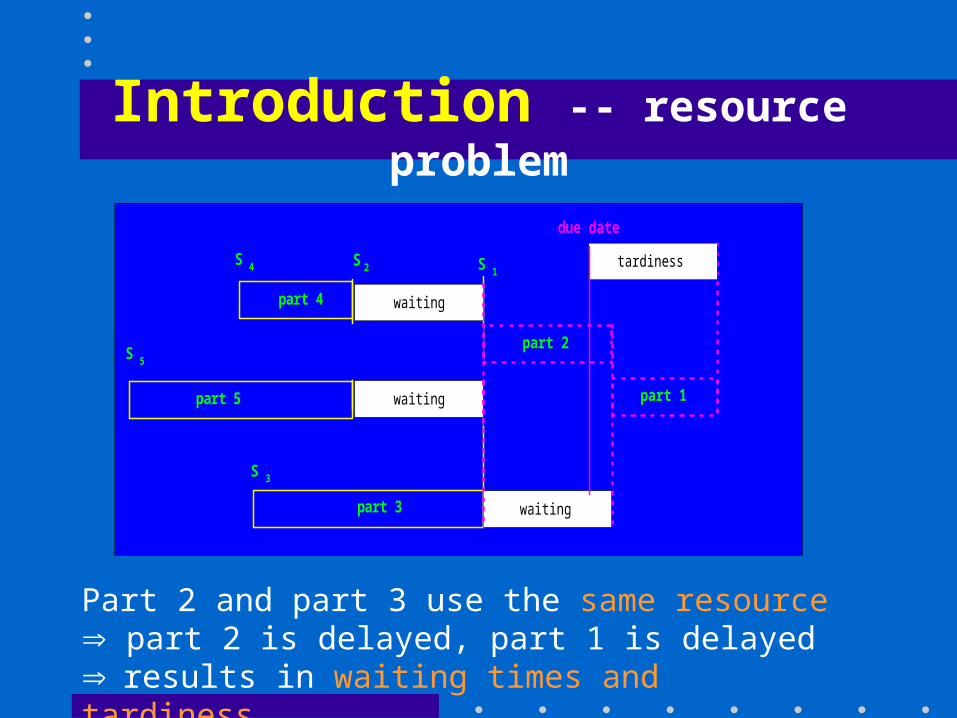
Introduction -- resource problem
Part 2 and part 3 use the same resource part 2 is delayed, part 1 is delayed results in waiting times and tardiness.
part 2
part 1
waiting
waiting
tardiness
waiting
due date
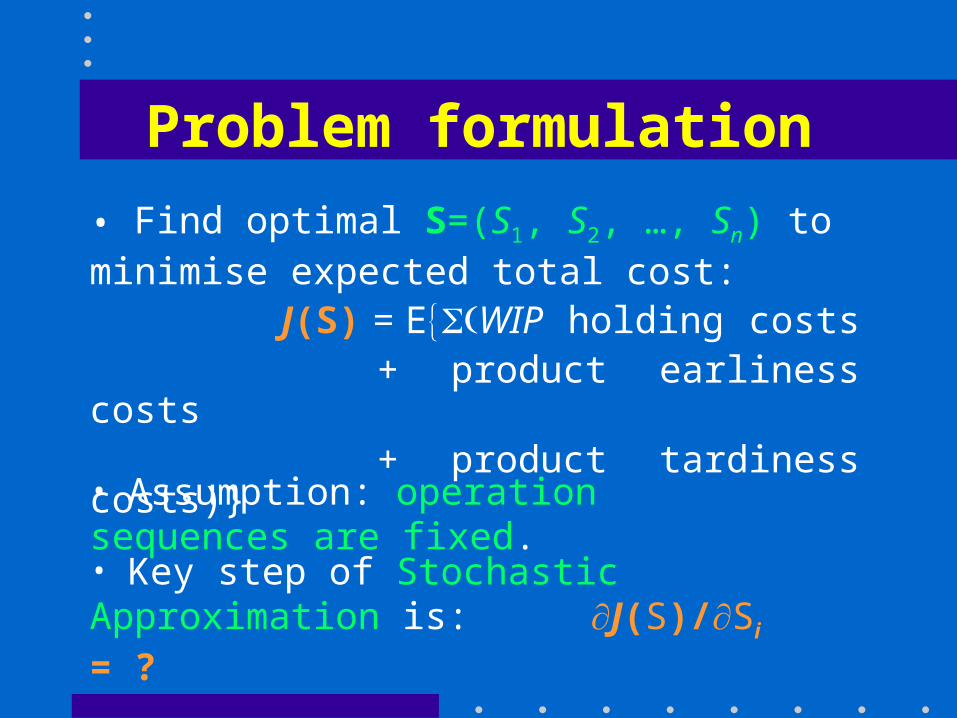
Problem formulation
• Find optimal S=(S1, S2, …, Sn) to minimise expected total cost:
J(S) = EWIP holding costs + product earliness costs + product tardiness costs)}
• Assumption: operation sequences are fixed.
• Key step of Stochastic Approximation is: J(S)/Si = ?

Perturbation analysis -- general problem
• Consider to minimise: J() = EL(,)
J(.) -- system performance index.
L(.) -- sample performance function.
-- a vector of n real parameters.
-- a realization of the set of random sequences.
• PA aims to find an unbiased estimator of gradient -- J()/i , with as little computation as possible.
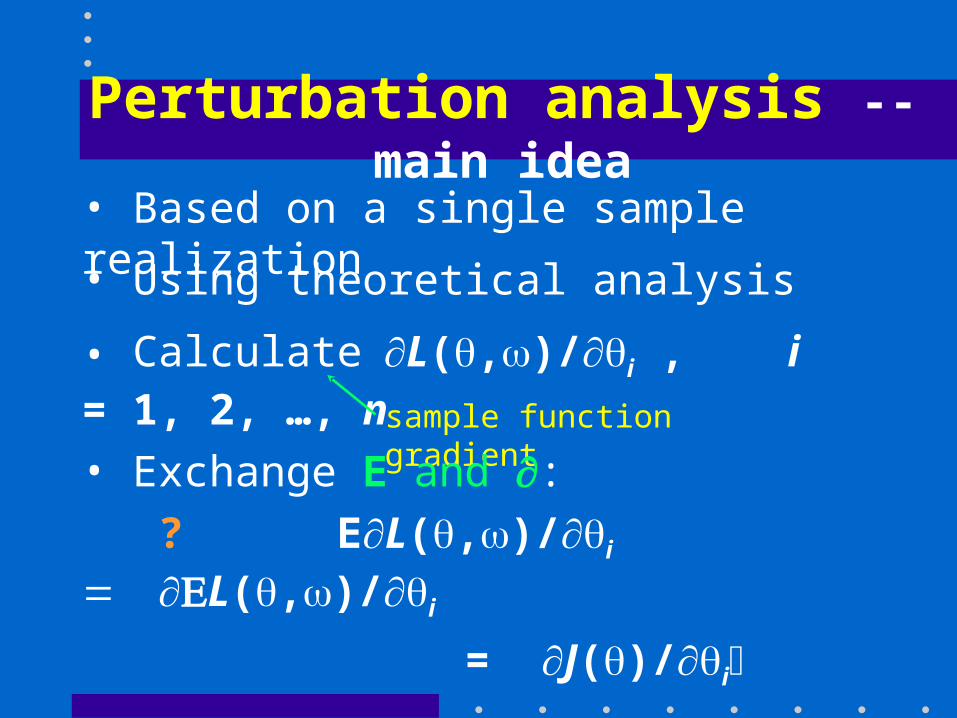
Perturbation analysis -- main idea
• Based on a single sample realization
• Using theoretical analysis
sample function gradient
• CalculateL(,)/i , i = 1, 2, …, n
• Exchange E and :
? EL(,)/i L(,)/i
= J()/i
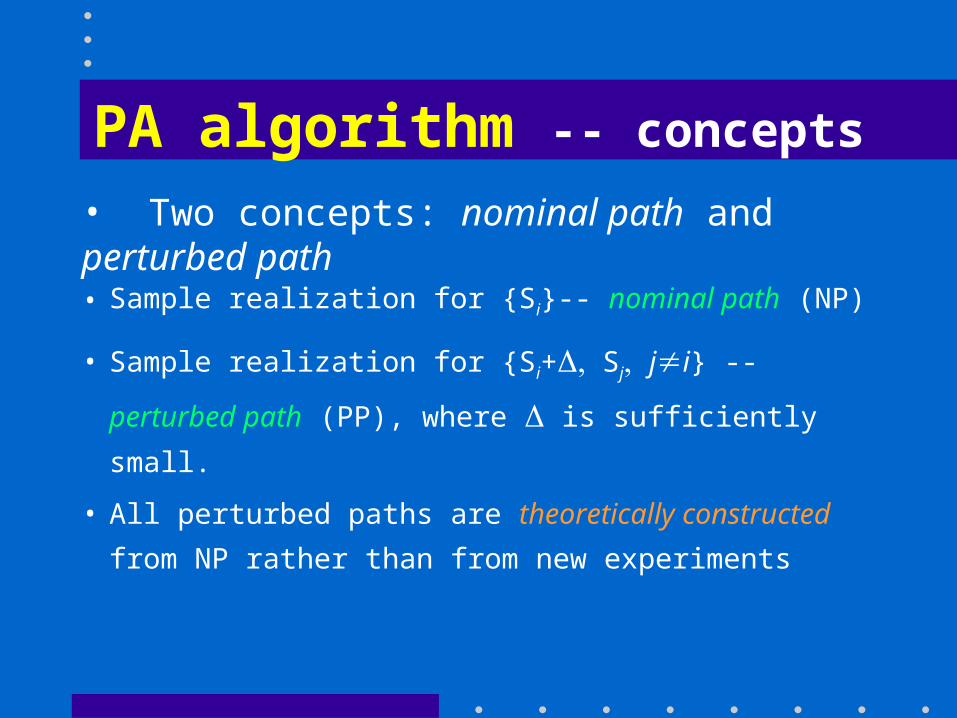
PA algorithm -- concepts
• Sample realization for {Si}-- nominal path (NP)
• Sample realization for {Si+Sj ji} --
perturbed path (PP), where is sufficiently small.
• All perturbed paths are theoretically constructed
from NP rather than from new experiments
• Two concepts: nominal path and perturbed path

PA algorithm -- Perturbation rules
• Perturbation generation rule -- When PP starts to deviate from NP ?
• Perturbation propagation rule -- How the perturbation of one part affects the processing of other parts?
-- along the critical paths
-- along the critical resources
• Perturbation disappearance rule -- When PP and NP overlaps again ?
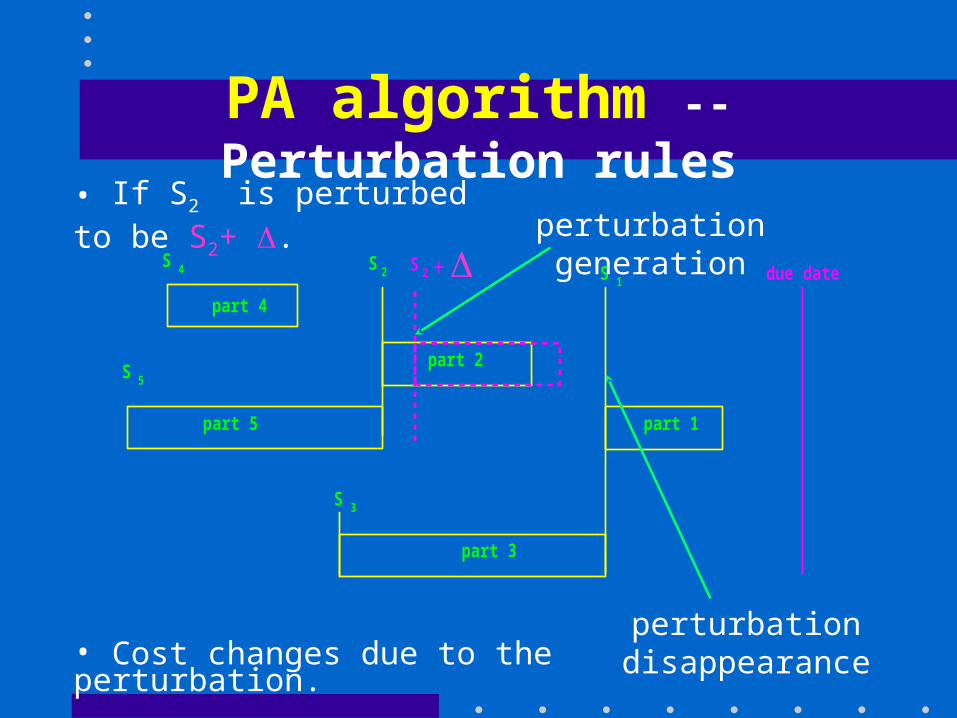
PA algorithm -- Perturbation rules
• Cost changes due to the perturbation.
part 4
part 5
part 3
part 2
S 2S 4
S 5
S 3
due dateS 1
part 1
+S 2
perturbation generation
perturbation disappearance
• If S2 is perturbed to be S2+ .

PA algorithm -- Perturbation rules• If S3 is perturbed to be S3+ .
• Cost changes due to the perturbation.
part 4
part 5
part 3
part 2
S 2S 4
S 5
S 3
due dateS 1
part 1
+S 3
perturbation generation
perturbation propagation
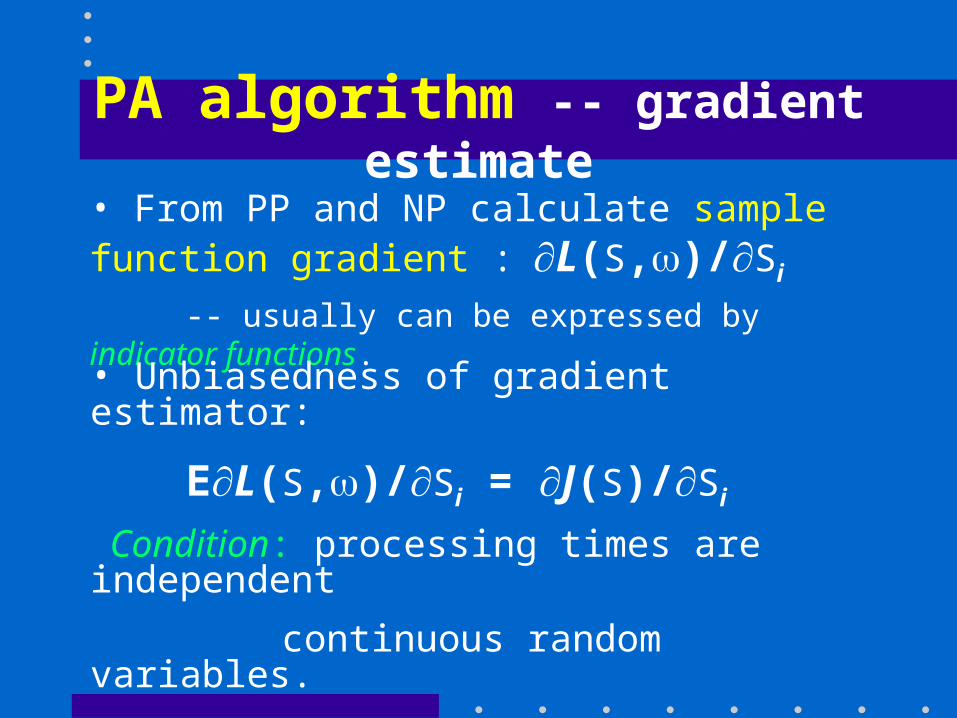
PA algorithm -- gradient estimate
• From PP and NP calculate sample function gradient : L(S,)/Si
-- usually can be expressed by indicator functions.
• Unbiasedness of gradient estimator:
EL(S,)/Si = J(S)/Si
Condition: processing times are independent
continuous random variables.
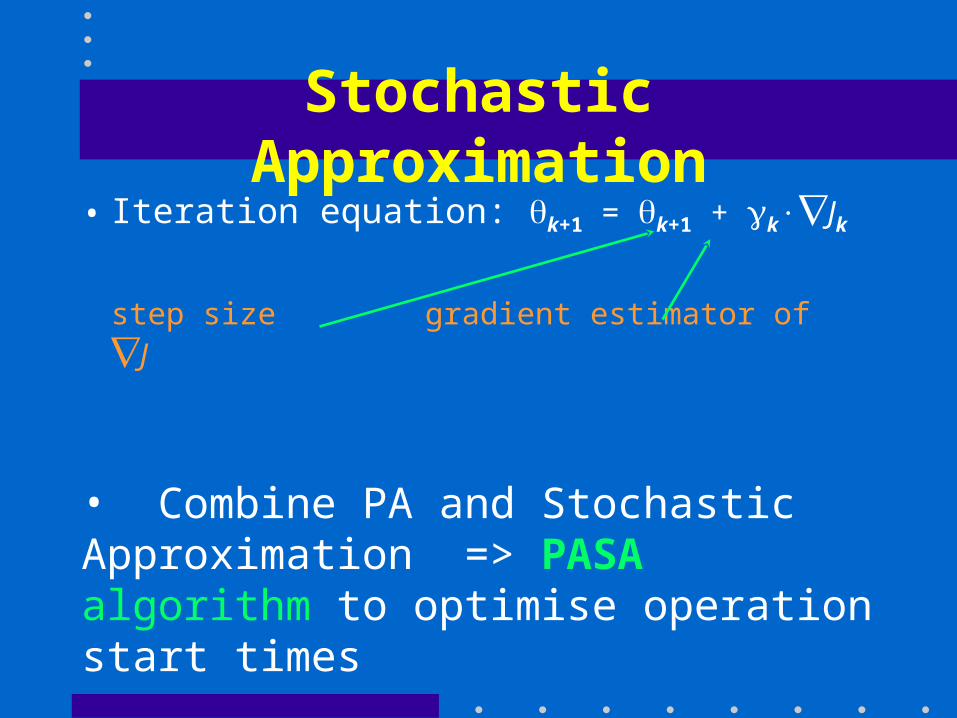
Stochastic Approximation
• Iteration equation: k+1 = k+1 + kJk
step size gradient estimator of J
• Combine PA and Stochastic Approximation => PASA algorithm to optimise operation start times
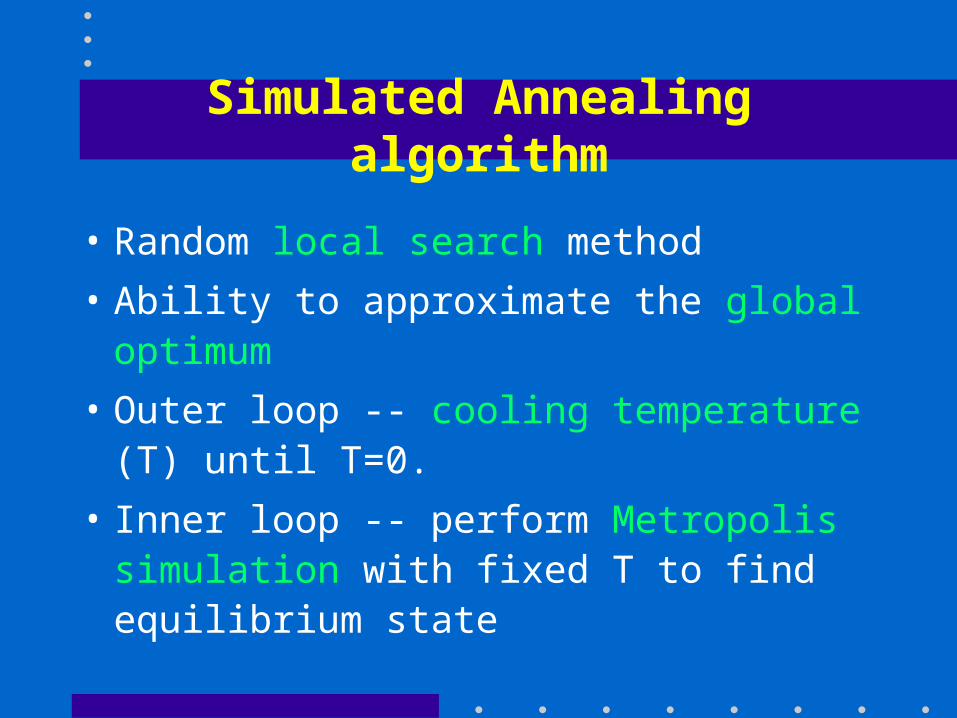
Simulated Annealing algorithm
• Random local search method
• Ability to approximate the global optimum
• Outer loop -- cooling temperature (T) until T=0.
• Inner loop -- perform Metropolis simulation with fixed T to find equilibrium state
Simulated Annealing algorithm
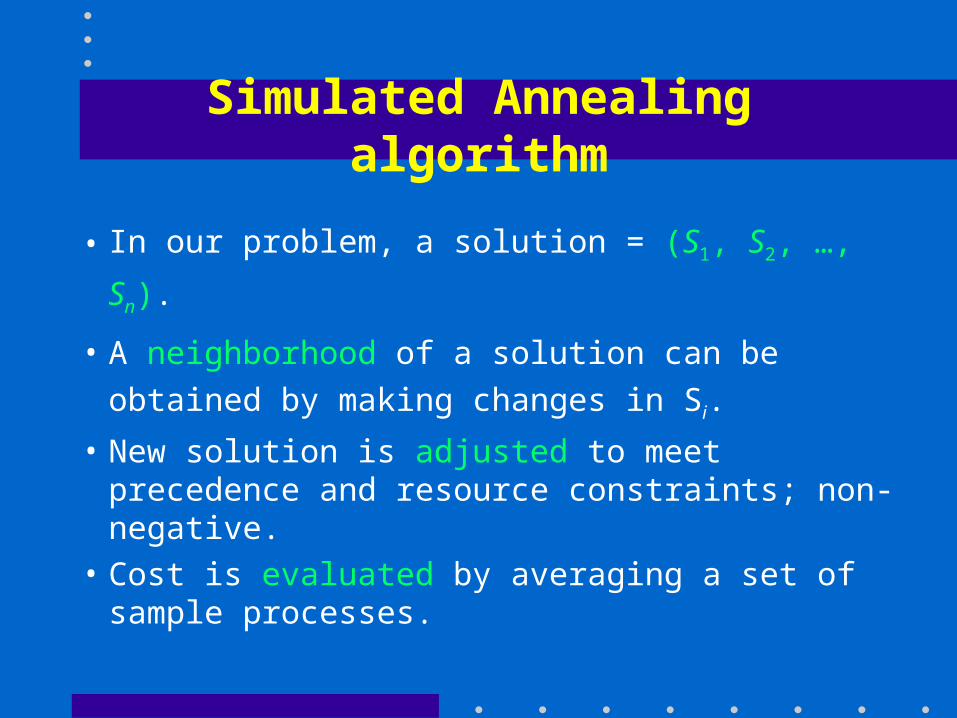
• In our problem, a solution = (S1, S2, …, Sn).
• A neighborhood of a solution can be obtained
by making changes in Si.
• New solution is adjusted to meet precedence and resource constraints; non-negative.
• Cost is evaluated by averaging a set of sample processes.
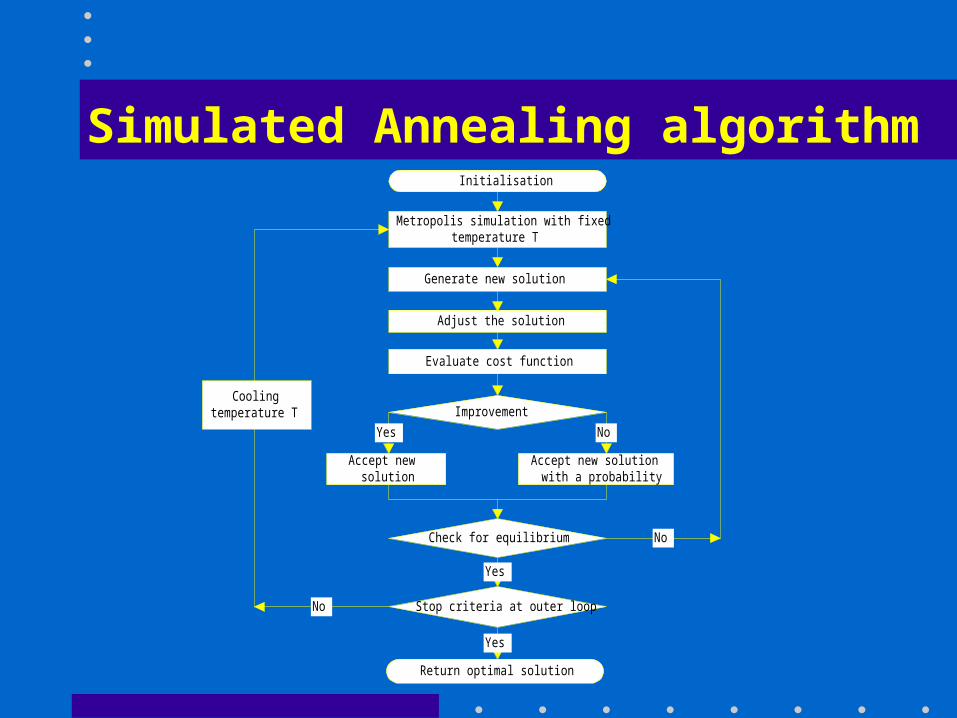
Simulated Annealing algorithmInitialisation
Metropolis simulation with fixedtemperature T
Adjust the solution
Evaluate cost function
Improvement
Accept newsolution
Accept new solutionwith a probability
Check for equilibrium
Stop criteria at outer loop
Return optimal solution
Coolingtemperature T
Yes No
Yes
Yes
No
No
Generate new solution
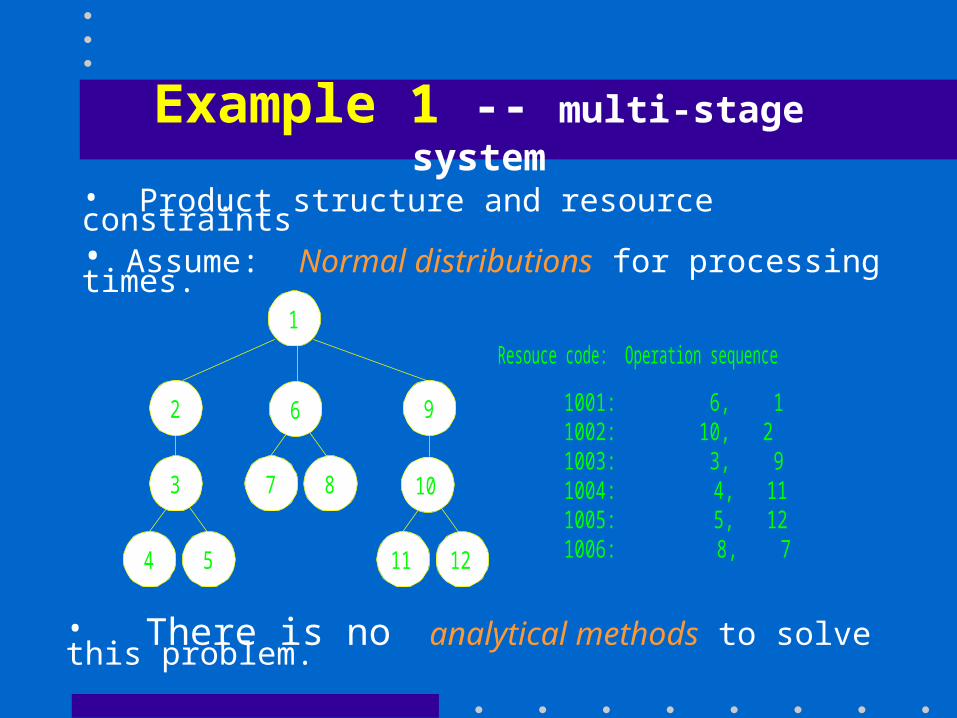
Example 1 -- multi-stage system
• Product structure and resource constraints• Assume: Normal distributions for processing times.
4 5 11 12
3 10
1
2 9
7 8
6
Resouce code: Operation sequence
1001: 6, 11002: 10, 21003: 3, 91004: 4, 111005: 5, 121006: 8, 7
• There is no analytical methods to solve this problem.

Convergence of cost in PASA
J(S)
Using Perturbation Analysis Stochastic Approximation to optimise operation start times.

Euclidean norm of gradient in PASA
• Euclidean norm = ||Jn||

Compare PASA with Simulated Annealing
Compare the convergence of costs over CPU time (second).
Where Simulated Annealing uses four different settings (initial temperature and number for check equilibrium)
Method J(S)
SA1 23.94
SA2 23.93
SA3 23.92
SA4 24.11
----------------
PASA 23.90

Example 2 -- complex system
8 opers
. . .9 opers
. . .7 opers
. . .11 opers
. . .16 opers
. . .12 opers 10 opers
. . .
238
15 opers
. . . 12 opers
. . .
. . .
228
229
230
231 234
226:15 232:12
243 247
242 246
245237
239
226:1 232:1
233:12
233:1
235:10 236:16 240:11
235:1 236:1 240:1
241:7
241:!
244:9
244:1
248:8
248:1
• Complex product structure with Normal distributions.
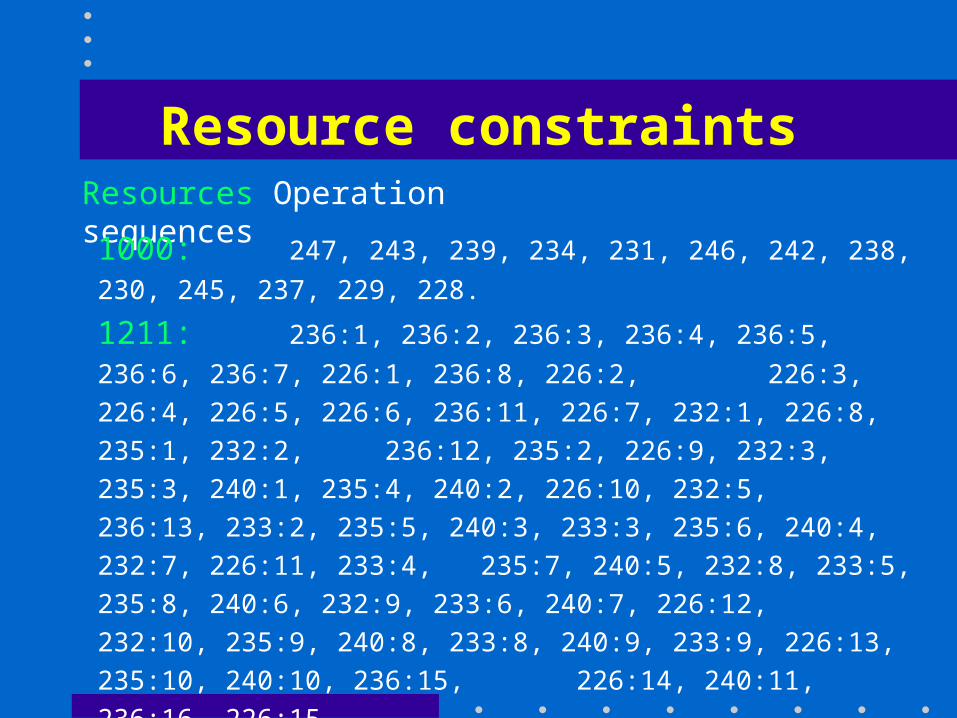
Resource constraintsResources Operation sequences
1000: 247, 243, 239, 234, 231, 246, 242, 238, 230, 245, 237, 229, 228.
1211: 236:1, 236:2, 236:3, 236:4, 236:5, 236:6, 236:7, 226:1, 236:8, 226:2, 226:3, 226:4, 226:5, 226:6, 236:11, 226:7, 232:1, 226:8, 235:1, 232:2, 236:12, 235:2, 226:9, 232:3, 235:3, 240:1, 235:4, 240:2, 226:10, 232:5, 236:13, 233:2, 235:5, 240:3, 233:3, 235:6, 240:4, 232:7, 226:11, 233:4, 235:7, 240:5, 232:8, 233:5, 235:8, 240:6, 232:9, 233:6, 240:7, 226:12, 232:10, 235:9, 240:8, 233:8, 240:9, 233:9, 226:13, 235:10, 240:10, 236:15, 226:14, 240:11, 236:16, 226:15.
1212: 236:9, 236:10, 232:4, 232:6, 236:14, 232:11, 232:12.
1511: 233:1, 233:7, 233:11.
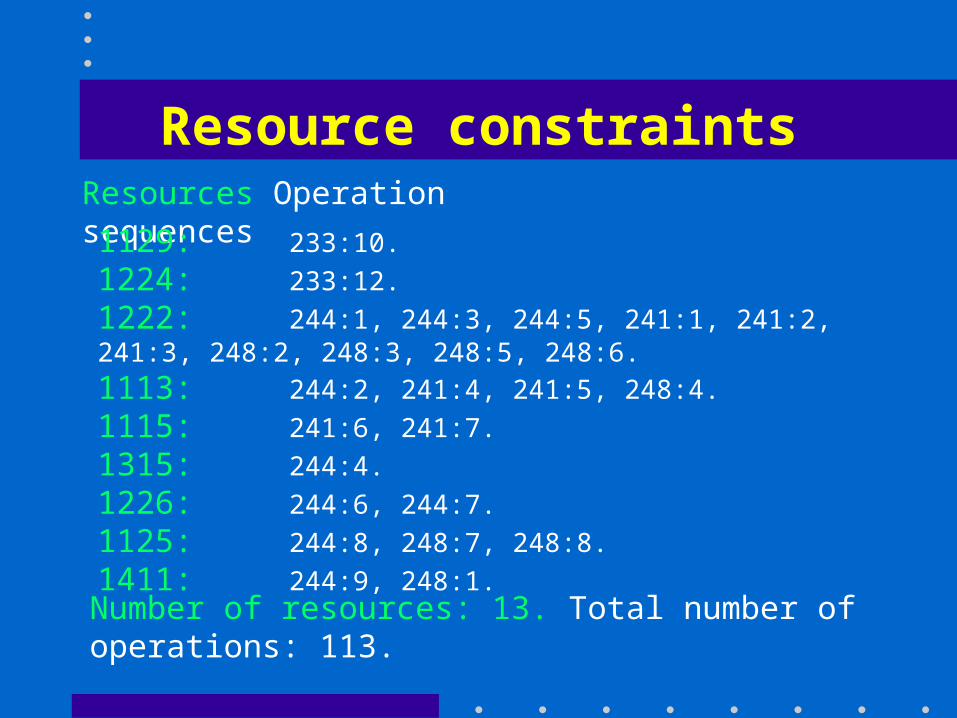
Resource constraintsResources Operation sequences
1129: 233:10. 1224: 233:12. 1222: 244:1, 244:3, 244:5, 241:1, 241:2, 241:3, 248:2, 248:3, 248:5, 248:6.1113: 244:2, 241:4, 241:5, 248:4.1115: 241:6, 241:7.1315: 244:4.1226: 244:6, 244:7.1125: 244:8, 248:7, 248:8.1411: 244:9, 248:1.
Number of resources: 13. Total number of operations: 113.
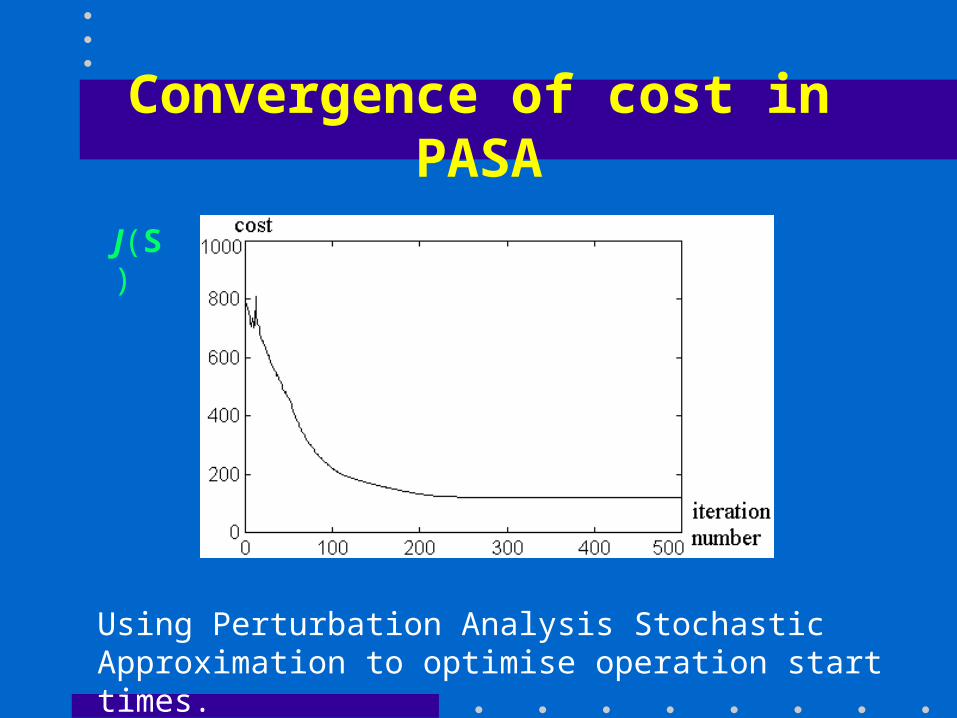
Convergence of cost in PASA
Using Perturbation Analysis Stochastic Approximation to optimise operation start times.
J(S)
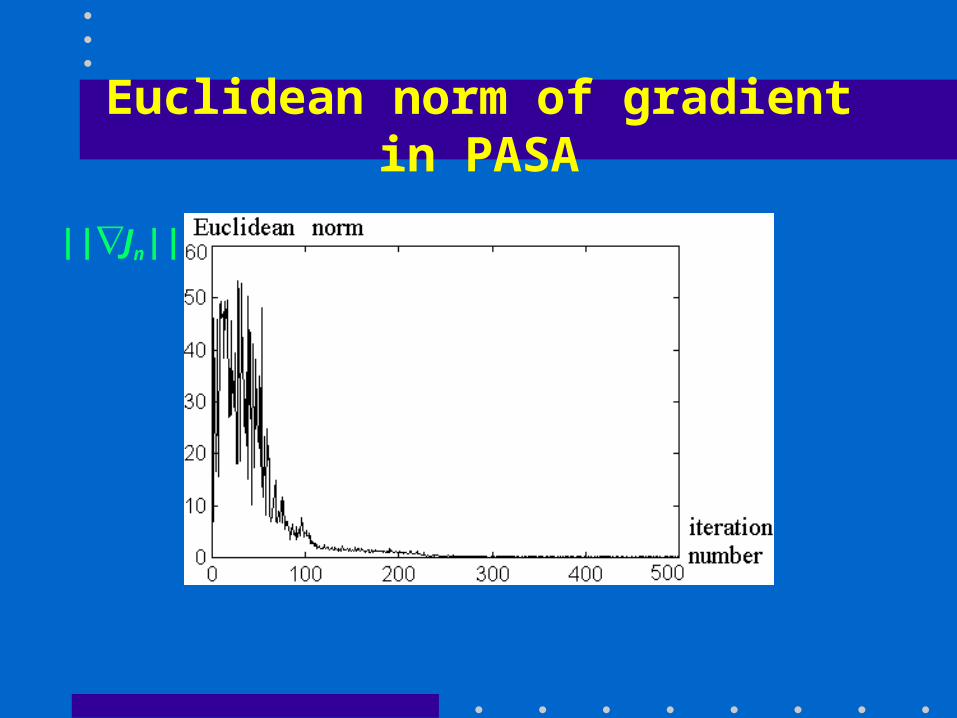
Euclidean norm of gradient in PASA
||Jn||

Compare PASA with Simulated Annealing
Compare the convergence of costs over CPU time (minute).
with four different settingsMethod J(S)
SA1 121.74
SA2 124.60
SA3 121.78
SA4 124.90
----------------
PASA 120.79
Conclusions
• Both PASA and SA can deal with complex systems beyond the ability of analytical methods.
• PASA is much faster and yields better solutions than Simulated Annealing in case studies
• SA is more robust and flexible, does not require any assumption on uncertainty

Further Work
• Optimise both operation sequences and start times
• Integrate Perturbation Analysis with SA or Evolution algorithms
• Extend to dynamic planning problems such as incremental planning and re-planning