planning parameters for terrestrial digital sound …. itu-r bs.2214-1 1 report itu-r bs.2214-1...
TRANSCRIPT

Report ITU-R BS.2214-1 (07/2015)
Planning parameters for terrestrial digital sound broadcasting systems in VHF bands
BS Series
Broadcasting service (sound)

ii Rep. ITU-R BS.2214-1
Foreword
The role of the Radiocommunication Sector is to ensure the rational, equitable, efficient and economical use of the radio-
frequency spectrum by all radiocommunication services, including satellite services, and carry out studies without limit
of frequency range on the basis of which Recommendations are adopted.
The regulatory and policy functions of the Radiocommunication Sector are performed by World and Regional
Radiocommunication Conferences and Radiocommunication Assemblies supported by Study Groups.
Policy on Intellectual Property Right (IPR)
ITU-R policy on IPR is described in the Common Patent Policy for ITU-T/ITU-R/ISO/IEC referenced in Annex 1 of
Resolution ITU-R 1. Forms to be used for the submission of patent statements and licensing declarations by patent holders
are available from http://www.itu.int/ITU-R/go/patents/en where the Guidelines for Implementation of the Common
Patent Policy for ITU-T/ITU-R/ISO/IEC and the ITU-R patent information database can also be found.
Series of ITU-R Reports
(Also available online at http://www.itu.int/publ/R-REP/en)
Series Title
BO Satellite delivery
BR Recording for production, archival and play-out; film for television
BS Broadcasting service (sound)
BT Broadcasting service (television)
F Fixed service
M Mobile, radiodetermination, amateur and related satellite services
P Radiowave propagation
RA Radio astronomy
RS Remote sensing systems
S Fixed-satellite service
SA Space applications and meteorology
SF Frequency sharing and coordination between fixed-satellite and fixed service systems
SM Spectrum management
Note: This ITU-R Report was approved in English by the Study Group under the procedure detailed in
Resolution ITU-R 1.
Electronic Publication
Geneva, 2015
ITU 2015
All rights reserved. No part of this publication may be reproduced, by any means whatsoever, without written permission of ITU.

Rep. ITU-R BS.2214-1 1
REPORT ITU-R BS.2214-1
Planning parameters for terrestrial digital sound
broadcasting systems in VHF bands
(2011-2015)
TABLE OF CONTENTS
Page
Introduction .............................................................................................................................. 4
Annex 1 – Planning parameters for digital terrestrial broadcasting system DRM robustness
mode E in VHF Bands I, II and III ................................................................................. 4
1 Scope .............................................................................................................................. 4
2 Reception modes............................................................................................................. 5
2.1 Fixed reception ................................................................................................... 5
2.2 Portable reception ............................................................................................... 5
2.3 Mobile reception ................................................................................................. 6
3 Correction factors for field-strength predictions ............................................................ 6
3.1 Reference frequencies ......................................................................................... 6
3.2 Antenna gain ....................................................................................................... 7
3.3 Feeder loss .......................................................................................................... 8
3.4 Height loss correction factor ............................................................................... 9
3.5 Building penetration loss .................................................................................... 9
3.6 Allowance for man-made noise .......................................................................... 10
3.7 Implementation loss factor ................................................................................. 12
3.8 Correction factors for location variability .......................................................... 13
3.9 Polarization discrimination ................................................................................. 16
3.10 Calculation of minimum median field-strength level ......................................... 16
4 DRM system parameters ................................................................................................ 18
4.1 Modes and code rates .......................................................................................... 18
4.2 Propagation-related OFDM parameters .............................................................. 19
4.3 Single frequency operation capability ................................................................ 19
4.4 Channel models .................................................................................................. 20

2 Rep. ITU-R BS.2214-1
Page
5 DRM receiver parameters ............................................................................................... 20
5.1 General characteristics ........................................................................................ 20
5.2 Receiver noise figure .......................................................................................... 21
5.3 Receiver noise input power ................................................................................ 21
5.4 Minimum carrier to noise ratio ........................................................................... 21
5.5 Minimum receiver input power level ................................................................. 22
6 DRM planning parameters .............................................................................................. 22
6.1 Minimum median field-strength level ................................................................ 22
6.2 Position of DRM frequencies ............................................................................. 28
6.3 Out-of-band spectrum mask ............................................................................... 29
6.4 Protection ratios .................................................................................................. 32
6.5 Calculation of the resulting sum field strength of interferers ............................. 38
Appendix 1 to Annex 1 – Normative references ...................................................................... 39
1 Symbols and abbreviations ............................................................................................. 39
2 References ...................................................................................................................... 41
Appendix 2 to Annex 1 – Technical references ....................................................................... 42
1 Position of DRM frequencies ......................................................................................... 42
1.1 VHF Band II ....................................................................................................... 42
1.2 VHF Band III ...................................................................................................... 43
2 Computations of correction factors ................................................................................ 46
2.1 Computation of the antenna gain for portable handheld reception ..................... 46
2.2 Computation of man-made noise allowance from the antenna noise factor ....... 47
Annex 2 – Planning parameters for digital terrestrial broadcasting system RAVIS in VHF
Bands I and II ................................................................................................................. 49
1 Reception modes............................................................................................................. 49
1.1 Fixed reception ................................................................................................... 49
1.2 Portable reception ............................................................................................... 49
1.3 Mobile reception ................................................................................................. 50

Rep. ITU-R BS.2214-1 3
Page
2 Correction factors for field-strength predictions ............................................................ 50
2.1 Reference frequency ........................................................................................... 51
2.2 Antenna gain ....................................................................................................... 51
2.3 Feeder loss .......................................................................................................... 52
2.4 Height loss correction factor ............................................................................... 52
2.5 Building penetration loss .................................................................................... 53
2.6 Allowance for man-made noise .......................................................................... 53
2.7 Implementation loss factor ................................................................................. 54
2.8 Location correction factor ................................................................................... 54
3 Calculation of minimum median field-strength level ..................................................... 56
4 Minimum field-strength requirements for RAVIS ......................................................... 57
4.1 System parameters of RAVIS ............................................................................. 57
4.2 RAVIS radio receiver related parameters ........................................................... 58
5 Sharing parameters ......................................................................................................... 78
5.1 Out-of-band emissions ........................................................................................ 78
5.2 Protection ratios .................................................................................................. 79
5.3 Sharing criteria with other services .................................................................... 81
6 References ...................................................................................................................... 82

4 Rep. ITU-R BS.2214-1
Introduction
This Report provides planning parameters for digital terrestrial broadcasting systems G (also known
as DRM+) and RAVIS in VHF Bands. DRM+ is designed for use in VHF Bands I, II and III, RAVIS
is designed for use in VHF Bands I and II.
The report defines a framework for calculating all relevant network planning parameters that are very
similar for both systems.
The system characteristics of digital System G are included in Recommendation ITU-R BS.1114 and
the description of RAVIS is contained in Report ITU-R BT.2049-4.
Annex 1 gives framework and planning parameter for DRM+.
Annex 2 gives framework and planning parameter for RAVIS.
Annex 1
Planning parameters for digital terrestrial broadcasting system DRM
robustness mode E in VHF Bands I, II and III
1 Scope
Digital Radio MondialeTM (DRM) was originally designed by the DRM Consortium as a digital
broadcasting system for the radio bands below 30 MHz and it is standardized as ETSI ES 201 980 [1].
In 2009, DRM was extended by a mode E – called “DRM+” – to use DRM in radio bands up to
174 MHz.
The University of Applied Sciences in Kaiserslautern1 (Germany) and the University of Hannover2
(Germany) successfully conducted laboratory measurements and field trials with DRM in VHF
Band II and in VHF Band III, respectively. Demonstrations were also given successfully in Paris in
VHF Band I by the University of Applied Sciences in Kaiserslautern. Other field trials all over the
world, especially in Brazil, Italy, Sri Lanka, the United Kingdom and in the Republic of Korea, have
completed the tests.
The measurements and field trials have confirmed the technical parameters, and comparisons of
coverage area have been performed between FM in VHF Band II and DRM also as with DAB in VHF
Band III and DRM. In addition, protection ratio measurements have been performed and planning
models have been used to predict coverage. The results from both German sites show that DRM
works well in all VHF bands including VHF Band III.
From these results and based on the therefore relevant ITU Recommendations, this Report defines a
framework for calculating all relevant DRM network planning parameters in all VHF bands. The
focus lies on VHF Band II (87.5-108 MHz) and VHF Band III (174-230 MHz) in ITU Region 1,
however where the values for the VHF Band I (47-68 MHz) are available, they are given.
1 http://www.fh-kl.de; http://www.drm-radio-kl.eu.
2 http://www.ikt.uni-hannover.de/.

Rep. ITU-R BS.2214-1 5
Other frequency allocations in VHF bands assigned to broadcasting services are not exhaustively
covered yet, e.g. areas in ITU Region 1 where allocations of the Wiesbaden T-DAB Agreement 1995
are still used (230-240 MHz) or in some Southern African countries, where the VHF Band III is
allocated to the broadcasting services up to 254 MHz, or the broadcasting bands in ITU Regions 2
and 3, perhaps the OIRT FM band (65.8-74 MHz) or the Japanese FM band (76-90 MHz),
respectively, that can later be adapted. Planning parameters for these unconsidered cases can be
derived or taken from the given values, considering 254 MHz as the international top boundary of the
VHF broadcasting spectrum3.
To calculate the relevant planning parameters minimum median field strength and protection ratios,
firstly receiver and transmitter characteristics, system parameters as well as transmission aspects as
common basis for concrete DRM transmission network planning are determined. All parameters are
either derived or the reference to the source of origin is given. Various typical reception scenarios are
taken into account to match as much as possible planning and prediction scenarios.
2 Reception modes
2.1 Fixed reception
Fixed reception (FX) is defined as reception where a receiving antenna mounted at roof level is used.
It is assumed that near-optimal reception conditions (within a relatively small volume on the roof)
are found when the antenna is installed. In calculating the field-strength levels for fixed antenna
reception, a receiving antenna height of 10 m above ground level is considered to be representative
for the broadcasting service [2].
A location probability of 70% is assumed to obtain a good reception situation.
2.2 Portable reception
In general, portable reception means a reception where a portable receiver with an attached or built-in
antenna is used outdoors or indoors at no less than 1.5 m above ground level.
A location probability of 95% is assumed to obtain a good reception situation.
Two receiving locations will be distinguished:
– Indoor reception with a reception place in a building.
– Outdoor reception with a reception place outside a building.
Within these receiving locations two opposed receiving conditions will be distinguished additionally
due to the great variability of portable reception situations with different receiver-/antenna-types and
also different reception conditions:
– Portable reception: This situation models the reception situation with good reception
conditions for both situations indoor and outdoor, resp., and a receiver with an
omnidirectional VHF antenna pattern as given in GE06 [2].
– Portable handheld reception: This situation models the reception situation with bad
reception conditions and a receiver with an external antenna (for example telescopic antennas
or the cable of wired headsets) as given in EBU-3317 [3].
3 Radio Regulations No. 5.252: in Botswana, Lesotho, Malawi, Mozambique, Namibia, South Africa,
Swaziland, Zambia and Zimbabwe, the bands 230-238 MHz and 246-254 MHz are allocated to the
broadcasting service on a primary basis, subject to agreement obtained under No. 9.21.

6 Rep. ITU-R BS.2214-1
2.2.1 Portable indoor reception
Portable indoor (PI) reception is defined by a portable receiver with stationary power supply and a
built-in (folded)-antenna or with a plug for an external antenna. The receiver is used indoors at no
less than 1.5 m above floor level in rooms on the ground floor and with a window in an external wall.
It is assumed that optimal receiving conditions will be found by moving the antenna up to 0.5 m in
any direction and the portable receiver is not moved during reception and large objects near the
receiver are also not moved [2]. A suburban area is assumed.
2.2.2 Portable outdoor reception
Portable outdoor (PO) reception is defined as reception by a portable receiver with battery supply and
an attached or built-in antenna which is used outdoors at no less than 1.5 m above ground level [2].
A suburban area is assumed in this case.
2.2.3 Portable handheld reception (PI-H, PO-H)
Portable reception is defined as reception by a portable handheld receiver with battery supply and an
external antenna as given in EBU-3317 [3] for both reception situations indoor and outdoor,
respectively. An urban area is assumed in this case.
2.3 Mobile reception
Mobile reception (MO) is defined as reception by a receiver in motion also at high speed with a
matched antenna situated at no less than 1.5 m above ground level or floor level [2]. A rural area with
hilly terrain is assumed in this case.
3 Correction factors for field-strength predictions
Recommendation ITU-R P.1546 forms the basis of a field-strength prediction method applicable for
the broadcasting services amongst other services. Predictions can be made from 30 MHz up to
3 000 MHz within a path distance of 1 to 1 000 km, percentage of time of 1 to 50%, and for various
transmitting antenna heights. The method draws a distinction between paths over land, cold seas and
warm seas, makes due allowance for location variability for land area-service predictions and takes
account of local clutter surrounding the receiving location. It also provides procedures for handling
negative effective transmitting antenna heights and mixed-path propagation (i.e. with combinations
of land and sea).
The wanted field-strength level values predicted (see Recommendation ITU-R P.1546) refer always
to the median value at a receiving location with a receiving antenna in 10 m height above ground
level. This antenna height is a generic value, used as stated only in rural or suburban areas, with
constructions or vegetation below 10 m height. Otherwise the wanted field-strength values are
predicted at the average construction or vegetation height at the receiving location. The true receiving
antenna height influences the height loss correction factor (see § 3.4).
To take into account different receiving modes and circumstances into network planning correction
factors have to be included to carry the minimum receiver input power level (as given in § 5.5) or the
minimum field-strength level over to the median minimum field-strength level for predictions
(see Recommendation ITU-R P.1546) (as given in § 6.1).
3.1 Reference frequencies
The planning parameters and correction factors in this document are calculated for the reference
frequencies given in Table 1.

Rep. ITU-R BS.2214-1 7
TABLE 1
Reference frequencies for calculations
VHF band
(frequency range)
I
(47-68 MHz)
II
(87.5-108 MHz)
III
(174-230 MHz)
Reference frequency (MHz) 65 100 200
3.2 Antenna gain
The antenna gain GD (dBd) references to a half-wave dipole.
3.2.1 Antenna gain for fixed reception
In Recommendation ITU-R BS.599 and GE06, the antenna pattern for fixed reception are given for
both VHF Band II (4 dB) and VHF Band III (7 dB). In ETSI-DVB [4] the antenna pattern for fixed
reception is given for VHF Band I (3 dB).
Taking into account the current use of roof-top antenna systems with omnidirectional dipole antennas
or ground plane antennas for future planning it is recommended that an omnidirectional antenna
pattern with a gain of 0 dBd is used (see Table 2).
TABLE 2
Antenna gain GD for fixed reception
Frequency (MHz) 65 100 200
Antenna gain GD (dBd) 0 0 0
3.2.2 Antenna gain for portable reception
GE06 assumes an omnidirectional VHF antenna pattern with an antenna gain of –2.2 dBd for standard
portable receiver planning, e.g. for DAB reception. From this reference, the antenna gains GD for
portable reception are assumed to –2.2 dBd as given in Table 3.
TABLE 3
Antenna gain GD for portable reception
Frequency (MHz) 65 100 200
Antenna gain GD (dBd) –2.2 –2.2 –2.2
3.2.3 Antenna gain for portable handheld reception
Antenna gains GD for portable handheld reception in VHF Band III (200 MHz) are given by
EBU-3317[3]:
– Receiver integrated antenna: GD = −17 dBd
– External antenna (telescopic or wired headsets): GD = −13 dBd
– Adapted antenna (for mobile reception): GD = −2.2 dBd
The antenna gain for portable handheld reception in VHF Band I and VHF Band II can be calculate
by the computation given in Annex 2, section 0 [KRAUS, 2001]. From it the antenna gains GD (dB)
for portable handheld reception modes with an external antenna are given in Table 4.

8 Rep. ITU-R BS.2214-1
TABLE 4
Antenna gains GD for portable handheld reception
Frequency (MHz) 65 100 200
Gain variation ΔG referenced to 200 MHz (dB) –9.76 –6.02 0.00
Antenna gain GD for receiver integrated antenna (dBd) –26.76 –23.02 –17.00
Antenna gain GD for portable handheld reception (external
antenna, telescopic or wired headsets) (dBd)
–22.76 –19.02 –13.00
3.2.4 Antenna gain for mobile reception
For mobile reception an omnidirectional VHF antenna pattern with an antenna gain GD of
2.2 dBd [2] is assumed, see Table 5.
TABLE 5
Antenna gains GD for mobile reception
Frequency (MHz) 65 100 200
Antenna gain GD for adapted
antenna (mobile reception) (dBd)
–2.2 –2.2 –2.2
3.3 Feeder loss
The feeder loss Lf expresses the signal attenuation from the receiving antenna to the receiver’s RF
input. The feeder loss Lf for fixed reception at 200 MHz is given in GE06 with 2 dB for 10 m cable
length. The frequency dependent cable attenuation per unit length L′f is assumed to be equal to:
200
MHz
10
2dB/m
fL f (1)
with f the frequency (MHz). The feeder loss values per unit length L′f are given in Table 6.
TABLE 6
Feeder loss L′f per unit length
Frequency (MHz) 65 100 200
Feeder loss L′f (dB/m) 0.11 0.14 0.2
The feeder loss Lf is given by:
)(200
MHz
10
2dB)( ml
flLL ff (2)
with l the length of the feeder cable (m).
The cable length l for the different reception modes are given in Table 7, and the feeder losses Lf for
different frequencies and reception modes are given in Table 8.
Rep. ITU-R BS.2214-1 9
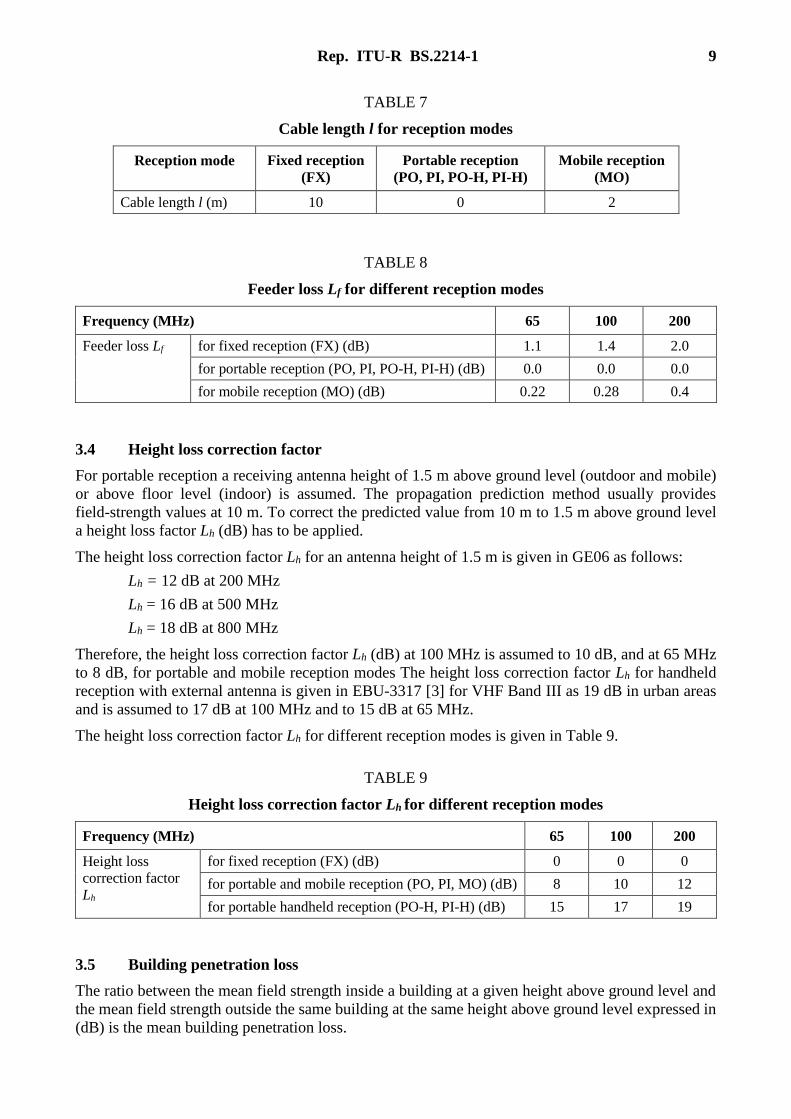
TABLE 7
Cable length l for reception modes
Reception mode Fixed reception
(FX)
Portable reception
(PO, PI, PO-H, PI-H)
Mobile reception
(MO)
Cable length l (m) 10 0 2
TABLE 8
Feeder loss Lf for different reception modes
Frequency (MHz) 65 100 200
Feeder loss Lf for fixed reception (FX) (dB) 1.1 1.4 2.0
for portable reception (PO, PI, PO-H, PI-H) (dB) 0.0 0.0 0.0
for mobile reception (MO) (dB) 0.22 0.28 0.4
3.4 Height loss correction factor
For portable reception a receiving antenna height of 1.5 m above ground level (outdoor and mobile)
or above floor level (indoor) is assumed. The propagation prediction method usually provides
field-strength values at 10 m. To correct the predicted value from 10 m to 1.5 m above ground level
a height loss factor Lh (dB) has to be applied.
The height loss correction factor Lh for an antenna height of 1.5 m is given in GE06 as follows:
Lh = 12 dB at 200 MHz
Lh = 16 dB at 500 MHz
Lh = 18 dB at 800 MHz
Therefore, the height loss correction factor Lh (dB) at 100 MHz is assumed to 10 dB, and at 65 MHz
to 8 dB, for portable and mobile reception modes The height loss correction factor Lh for handheld
reception with external antenna is given in EBU-3317 [3] for VHF Band III as 19 dB in urban areas
and is assumed to 17 dB at 100 MHz and to 15 dB at 65 MHz.
The height loss correction factor Lh for different reception modes is given in Table 9.
TABLE 9
Height loss correction factor Lh for different reception modes
Frequency (MHz) 65 100 200
Height loss
correction factor
Lh
for fixed reception (FX) (dB) 0 0 0
for portable and mobile reception (PO, PI, MO) (dB) 8 10 12
for portable handheld reception (PO-H, PI-H) (dB) 15 17 19
3.5 Building penetration loss
The ratio between the mean field strength inside a building at a given height above ground level and
the mean field strength outside the same building at the same height above ground level expressed in
(dB) is the mean building penetration loss.
10 Rep. ITU-R BS.2214-1
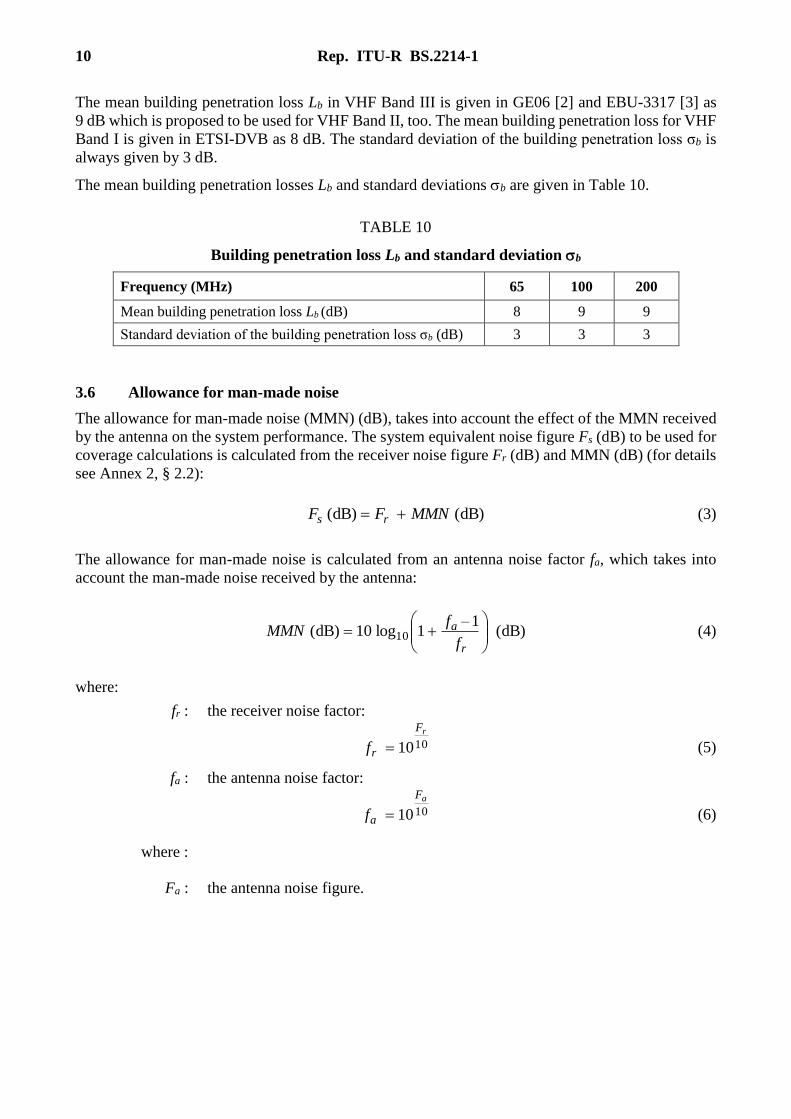
The mean building penetration loss Lb in VHF Band III is given in GE06 [2] and EBU-3317 [3] as
9 dB which is proposed to be used for VHF Band II, too. The mean building penetration loss for VHF
Band I is given in ETSI-DVB as 8 dB. The standard deviation of the building penetration loss σb is
always given by 3 dB.
The mean building penetration losses Lb and standard deviations b are given in Table 10.
TABLE 10
Building penetration loss Lb and standard deviation b
Frequency (MHz) 65 100 200
Mean building penetration loss Lb (dB) 8 9 9
Standard deviation of the building penetration loss σb (dB) 3 3 3
3.6 Allowance for man-made noise
The allowance for man-made noise (MMN) (dB), takes into account the effect of the MMN received
by the antenna on the system performance. The system equivalent noise figure Fs (dB) to be used for
coverage calculations is calculated from the receiver noise figure Fr (dB) and MMN (dB) (for details
see Annex 2, § 2.2):
)dB(dB)( MMNFF rs (3)
The allowance for man-made noise is calculated from an antenna noise factor fa, which takes into
account the man-made noise received by the antenna:
)dB(1–
1log10)dB( 10
r
a
f
fMMN (4)
where:
fr : the receiver noise factor:
1010
rF
rf (5)
fa : the antenna noise factor:
1010
aF
af (6)
where :
Fa : the antenna noise figure.
Rep. ITU-R BS.2214-1 11
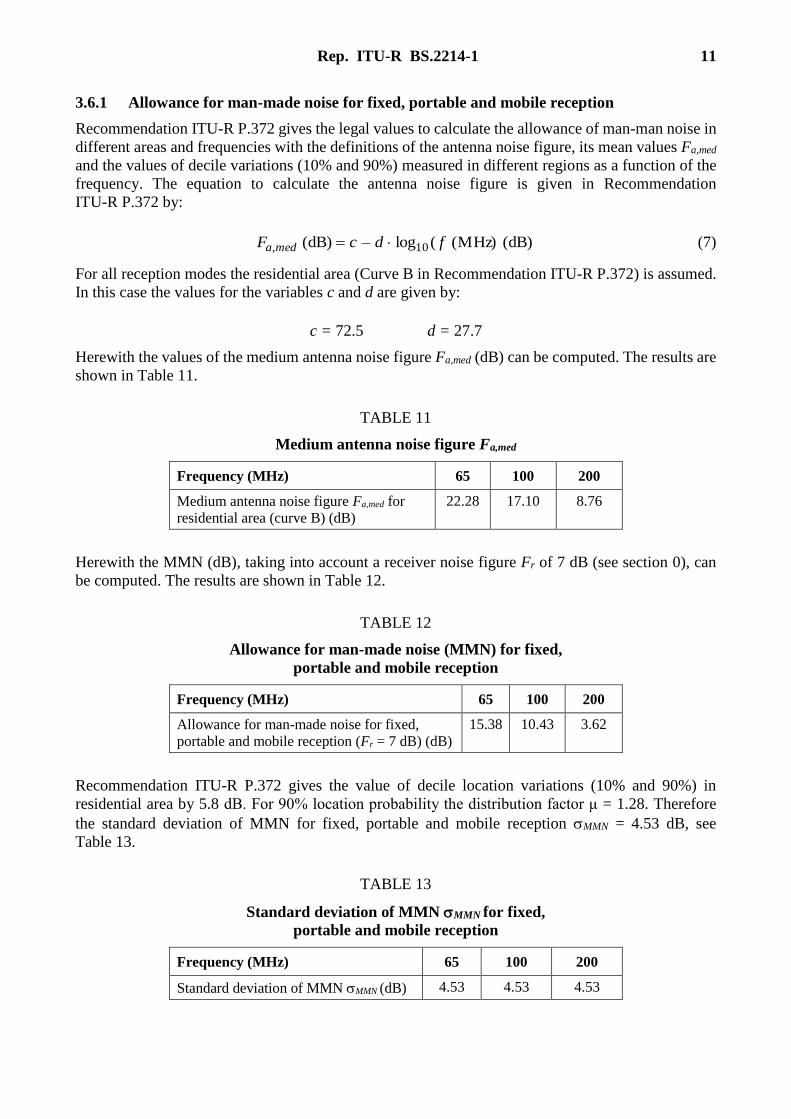
3.6.1 Allowance for man-made noise for fixed, portable and mobile reception
Recommendation ITU-R P.372 gives the legal values to calculate the allowance of man-man noise in
different areas and frequencies with the definitions of the antenna noise figure, its mean values Fa,med
and the values of decile variations (10% and 90%) measured in different regions as a function of the
frequency. The equation to calculate the antenna noise figure is given in Recommendation
ITU-R P.372 by:
)dB()MHz((log–)dB( 10, fdcF meda (7)
For all reception modes the residential area (Curve B in Recommendation ITU-R P.372) is assumed.
In this case the values for the variables c and d are given by:
c = 72.5 d = 27.7
Herewith the values of the medium antenna noise figure Fa,med (dB) can be computed. The results are
shown in Table 11.
TABLE 11
Medium antenna noise figure Fa,med
Frequency (MHz) 65 100 200
Medium antenna noise figure Fa,med for
residential area (curve B) (dB)
22.28 17.10 8.76
Herewith the MMN (dB), taking into account a receiver noise figure Fr of 7 dB (see section 0), can
be computed. The results are shown in Table 12.
TABLE 12
Allowance for man-made noise (MMN) for fixed,
portable and mobile reception
Frequency (MHz) 65 100 200
Allowance for man-made noise for fixed,
portable and mobile reception (Fr = 7 dB) (dB)
15.38 10.43 3.62
Recommendation ITU-R P.372 gives the value of decile location variations (10% and 90%) in
residential area by 5.8 dB. For 90% location probability the distribution factor μ = 1.28. Therefore
the standard deviation of MMN for fixed, portable and mobile reception MMN = 4.53 dB, see
Table 13.
TABLE 13
Standard deviation of MMN MMN for fixed,
portable and mobile reception
Frequency (MHz) 65 100 200
Standard deviation of MMN MMN (dB) 4.53 4.53 4.53

12 Rep. ITU-R BS.2214-1
The standard deviation of MMN has to be considered in the calculation of the combined standard
deviation for the wanted field-strength level (see § 3.8.2).
3.6.2 Allowance for man-made noise for portable handheld reception
The antenna gain is the product of directivity and efficiency. The lowest realistic directivity is the one
of a short dipole (length l << λ) and it has the value 1.5 (1.8 dBi). Any gain lower than 1.8 dBi
(−0.4 dBd) is due to an antenna efficiency η lower than 1. The interference power at the receiver input
is reduced accordingly and the MMN equation is (see Annex 2, § 2.2):
)dB(1–
1log10)dB( 10
r
a
f
fMMN (8)
The efficiency η can be calculated from the antenna gain GD (dB) for gains lower than –0.4 dBd:
10
4.0
10
DG
(9)
The MMN for portable handheld reception, taking the receiver noise figure as 7 dB (see section 0),
are given in Table 14.
TABLE 14
Allowance for man-made noise for portable
handheld reception (external antenna)
Frequency (MHz) 65 100 200
Handheld antenna gain GD (dBd) −22.8 −19 −13
Efficiency η 0.0058 0.0138 0.055
Calculated MMN allowance (dB) 0.42 0.30 0.14
Allowance for man-made noise for portable handheld
reception (dB)
0.0 0.0 0.0
In the further calculations the allowance for man-made noise is specified to 0 dB due to the very low
calculated values.
3.7 Implementation loss factor
Implementation loss of the non-ideal receiver is considered in the calculation of the minimum receiver
input power level with an additional implementation loss factor Li of 3 dB, see Table 15.
TABLE 15
Implementation loss factor Li
Frequency (MHz) 65 100 200
Implementation loss factor Li (dB) 3 3 3
Rep. ITU-R BS.2214-1 13
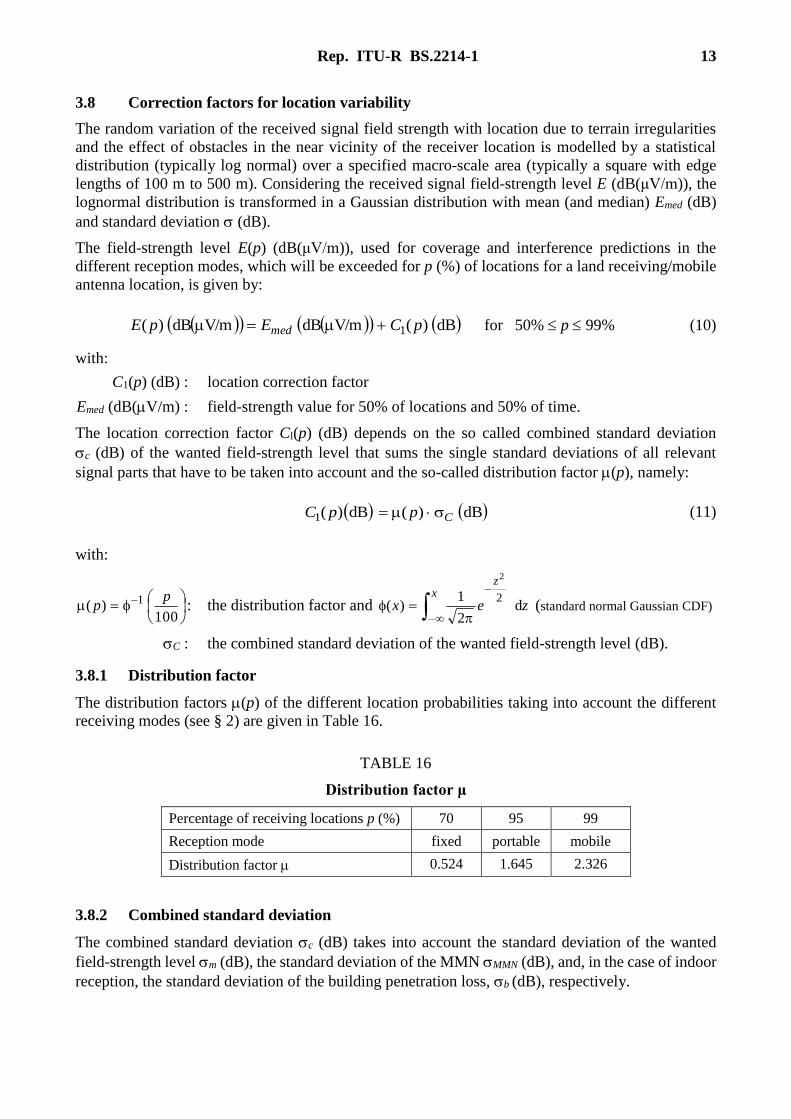
3.8 Correction factors for location variability
The random variation of the received signal field strength with location due to terrain irregularities
and the effect of obstacles in the near vicinity of the receiver location is modelled by a statistical
distribution (typically log normal) over a specified macro-scale area (typically a square with edge
lengths of 100 m to 500 m). Considering the received signal field-strength level E (dB(μV/m)), the
lognormal distribution is transformed in a Gaussian distribution with mean (and median) Emed (dB)
and standard deviation (dB).
The field-strength level E(p) (dB(μV/m)), used for coverage and interference predictions in the
different reception modes, which will be exceeded for p (%) of locations for a land receiving/mobile
antenna location, is given by:
dB)(V/mdBV/mdB)( 1 pCEpE med for 50% p 99% (10)
with:
C1(p) (dB) : location correction factor
Emed (dB(V/m) : field-strength value for 50% of locations and 50% of time.
The location correction factor Cl(p) (dB) depends on the so called combined standard deviation
c (dB) of the wanted field-strength level that sums the single standard deviations of all relevant
signal parts that have to be taken into account and the so-called distribution factor (p), namely:
dB)(dB)(1 CppC (11)
with:
100)( 1– p
p : the distribution factor and zex
zx
d2
1)(
2–
–
2
(standard normal Gaussian CDF)
C : the combined standard deviation of the wanted field-strength level (dB).
3.8.1 Distribution factor
The distribution factors (p) of the different location probabilities taking into account the different
receiving modes (see § 2) are given in Table 16.
TABLE 16
Distribution factor μ
Percentage of receiving locations p (%) 70 95 99
Reception mode fixed portable mobile
Distribution factor 0.524 1.645 2.326
3.8.2 Combined standard deviation
The combined standard deviation c (dB) takes into account the standard deviation of the wanted
field-strength level m (dB), the standard deviation of the MMN MMN (dB), and, in the case of indoor
reception, the standard deviation of the building penetration loss, b (dB), respectively.

14 Rep. ITU-R BS.2214-1
Since the statistics of the received wanted field-strength level for macro-scale, the statistics of the
MMN MMN (dB), and the statistics of the building attenuation can be assumed to be statistically
uncorrelated, the combined standard deviation c (dB) is calculated by:
222dB)( MMNbmc (12)
The values of the standard deviations of the building penetration loss b (dB) and of the MMN
MMN (dB) are given in §§ 3.5 and 3.6, respectively.
The values of standard deviation m (dB) of the wanted field-strength level E are dependent on
frequency and environment, and empirical studies have shown a considerable spread. Representative
values for areas of 500 m 500 m are given by Recommendation ITU-R P.1546 as well as the
expression to calculate the standard deviation σm (dB):
))MHz((log1.3dB)(dB 10 fKm
(13)
where:
K = 1.2, for receivers with antennas below clutter height in urban or suburban
environments for mobile systems with omnidirectional antennas at car-roof
height
K 1.0, for receivers with rooftop antennas near the clutter height
K 0.5, for receivers in rural areas
f : required frequency (MHz).
Furthermore, the following fixed values are given:
m = 8.3 dB for broadcasting, analogue at 100 MHz (i.e. FM)
m = 5.5 dB for broadcasting, digital (more than 1 MHz bandwidth, i.e. DAB)
The standard deviations m (dB) for FM and DAB are given in Table 17 whereas those for DRM in
urban and suburban areas as well as in rural areas are given in Table 18.
TABLE 17
Standard deviation for DAB m,DAB and FM m,FM
Frequency (MHz) 65 100 200
Standard deviation for FM m,FM (dB) – 8.3 –
for DAB m,DAB (dB) – – 5.5
TABLE 18
Standard deviation for DRM σm,DRM
Frequency (MHz) 65 100 200
Standard deviation for
DRM m,DRM
in urban and suburban areas (dB) 3.56 3.80 4.19
in rural areas (dB) 2.86 3.10 3.49
Rep. ITU-R BS.2214-1 15
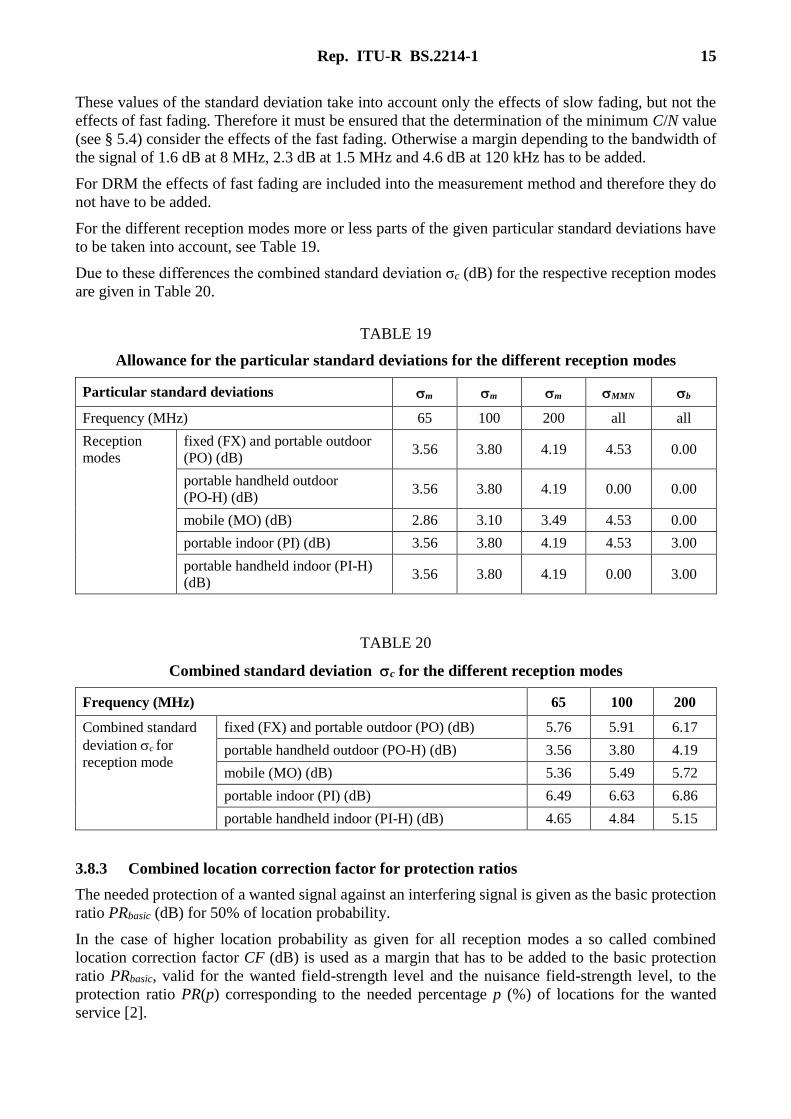
These values of the standard deviation take into account only the effects of slow fading, but not the
effects of fast fading. Therefore it must be ensured that the determination of the minimum C/N value
(see § 5.4) consider the effects of the fast fading. Otherwise a margin depending to the bandwidth of
the signal of 1.6 dB at 8 MHz, 2.3 dB at 1.5 MHz and 4.6 dB at 120 kHz has to be added.
For DRM the effects of fast fading are included into the measurement method and therefore they do
not have to be added.
For the different reception modes more or less parts of the given particular standard deviations have
to be taken into account, see Table 19.
Due to these differences the combined standard deviation σc (dB) for the respective reception modes
are given in Table 20.
TABLE 19
Allowance for the particular standard deviations for the different reception modes
Particular standard deviations m m m MMN b
Frequency (MHz) 65 100 200 all all
Reception
modes
fixed (FX) and portable outdoor
(PO) (dB) 3.56 3.80 4.19 4.53 0.00
portable handheld outdoor
(PO-H) (dB) 3.56 3.80 4.19 0.00 0.00
mobile (MO) (dB) 2.86 3.10 3.49 4.53 0.00
portable indoor (PI) (dB) 3.56 3.80 4.19 4.53 3.00
portable handheld indoor (PI-H)
(dB) 3.56 3.80 4.19 0.00 3.00
TABLE 20
Combined standard deviation c for the different reception modes
Frequency (MHz) 65 100 200
Combined standard
deviation c for
reception mode
fixed (FX) and portable outdoor (PO) (dB) 5.76 5.91 6.17
portable handheld outdoor (PO-H) (dB) 3.56 3.80 4.19
mobile (MO) (dB) 5.36 5.49 5.72
portable indoor (PI) (dB) 6.49 6.63 6.86
portable handheld indoor (PI-H) (dB) 4.65 4.84 5.15
3.8.3 Combined location correction factor for protection ratios
The needed protection of a wanted signal against an interfering signal is given as the basic protection
ratio PRbasic (dB) for 50% of location probability.
In the case of higher location probability as given for all reception modes a so called combined
location correction factor CF (dB) is used as a margin that has to be added to the basic protection
ratio PRbasic, valid for the wanted field-strength level and the nuisance field-strength level, to the
protection ratio PR(p) corresponding to the needed percentage p (%) of locations for the wanted
service [2].
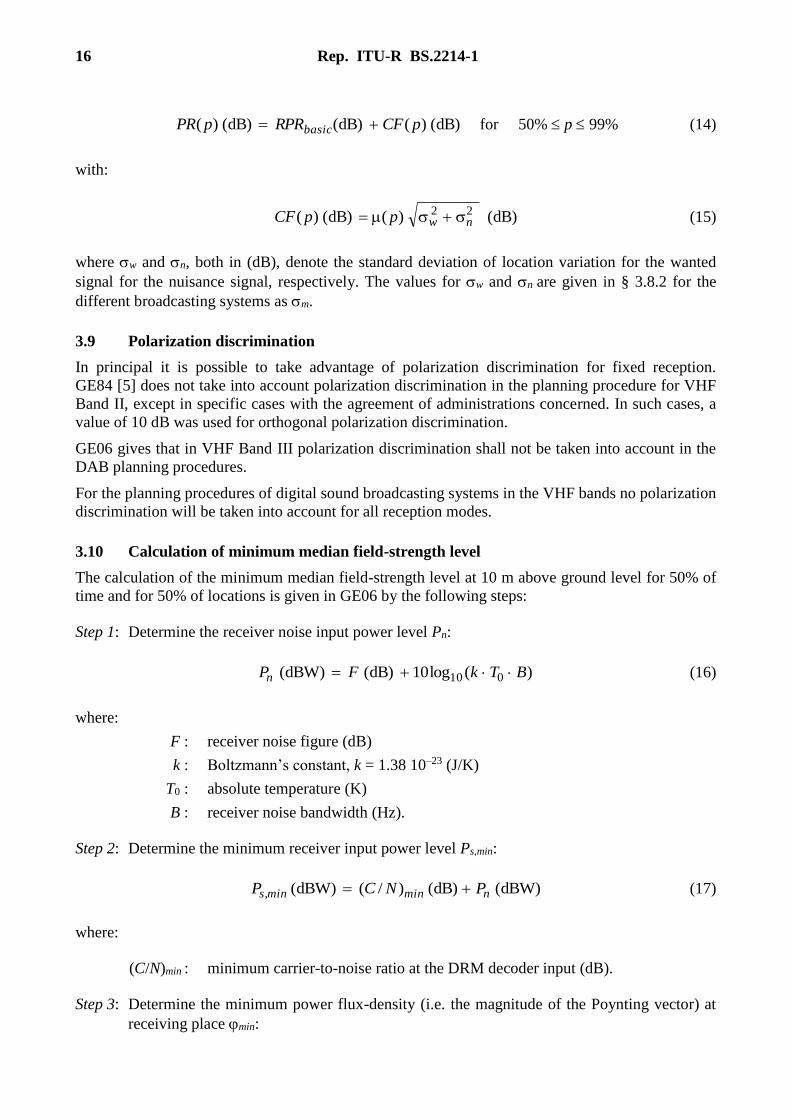
16 Rep. ITU-R BS.2214-1
)dB()()dB()dB()( pCFRPRpPR basic
for 50% p 99% (14)
with:
)dB()()dB()( 22nwppCF (15)
where w and n, both in (dB), denote the standard deviation of location variation for the wanted
signal for the nuisance signal, respectively. The values for w and n are given in § 3.8.2 for the
different broadcasting systems as m.
3.9 Polarization discrimination
In principal it is possible to take advantage of polarization discrimination for fixed reception.
GE84 [5] does not take into account polarization discrimination in the planning procedure for VHF
Band II, except in specific cases with the agreement of administrations concerned. In such cases, a
value of 10 dB was used for orthogonal polarization discrimination.
GE06 gives that in VHF Band III polarization discrimination shall not be taken into account in the
DAB planning procedures.
For the planning procedures of digital sound broadcasting systems in the VHF bands no polarization
discrimination will be taken into account for all reception modes.
3.10 Calculation of minimum median field-strength level
The calculation of the minimum median field-strength level at 10 m above ground level for 50% of
time and for 50% of locations is given in GE06 by the following steps:
Step 1: Determine the receiver noise input power level Pn:
)(log10)dB()dBW( 010 BTkFPn (16)
where:
F : receiver noise figure (dB)
k : Boltzmann’s constant, k = 1.38 10–23 (J/K)
T0 : absolute temperature (K)
B : receiver noise bandwidth (Hz).
Step 2: Determine the minimum receiver input power level Ps,min:
)dBW()dB()/()dBW( nmins,min PNCP (17)
where:
(C/N)min : minimum carrier-to-noise ratio at the DRM decoder input (dB).
Step 3: Determine the minimum power flux-density (i.e. the magnitude of the Poynting vector) at
receiving place min:

Rep. ITU-R BS.2214-1 17
)dB()dBm(–dBW)()dBW/m( 22fas,minmin LAp (18)
where:
Lf : feeder loss (dB)
Aa : effective antenna aperture (dBm2).
)dB()MHz(
300
4
64.1log10)dBm(
22
Da Gf
A
(19)
Step 4: Determine the minimum RMS field-strength level at the location of the receiving
antenna Emin:
V1
V1log20dBlog10)dBW/m(V/mdB 10010
2Fminmin ZE (20)
with:
120
0
00FZ , the characteristic impedance in free space (21)
resulting in:
dB8.145)dBW/m(V/mdB 2minminE (22)
Step 5: Determine the minimum median RMS field-strength level Emed:
For the different receiving scenarios the minimum median RMS field strength is calculated
as follows:
– for fixed reception:
Emed = Emin + Pmmn + Cl (23)
– for portable outdoor and mobile reception:
Emed = Emin + Pmmn + Cl + Lh (24)
– for portable indoor reception:
Emed = Emin + Pmmn + Cl + Lh + Lb (25)
18 Rep. ITU-R BS.2214-1
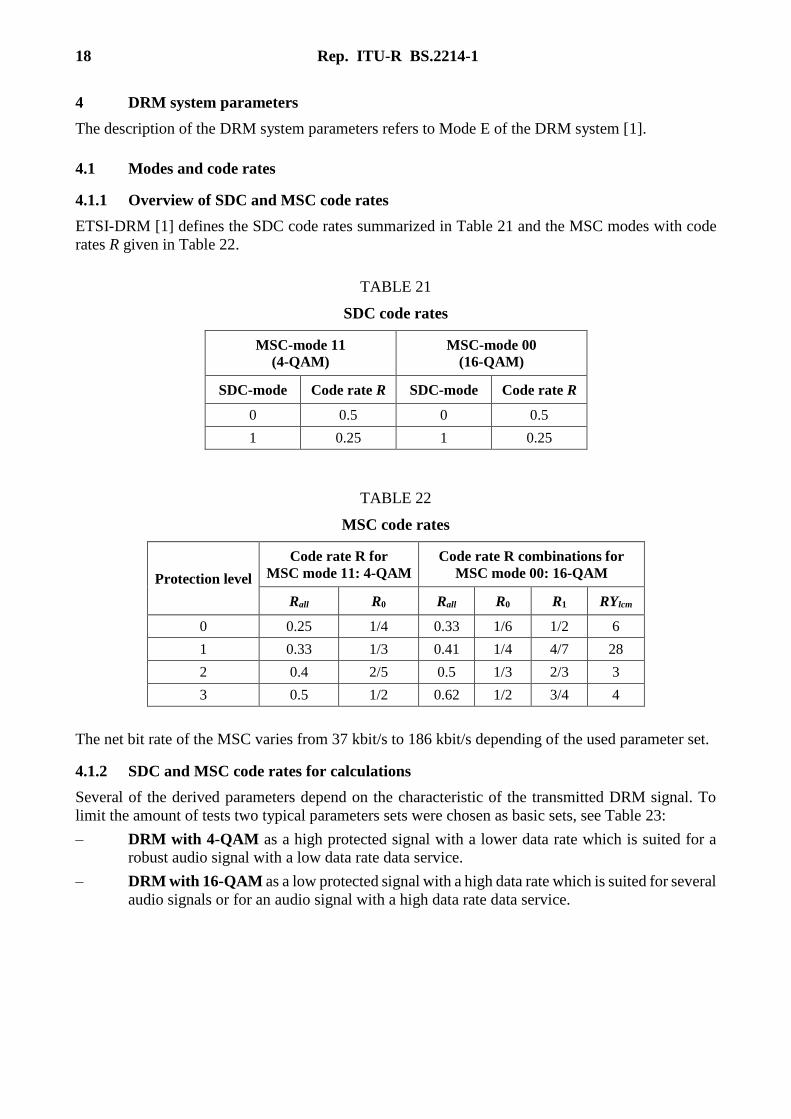
4 DRM system parameters
The description of the DRM system parameters refers to Mode E of the DRM system [1].
4.1 Modes and code rates
4.1.1 Overview of SDC and MSC code rates
ETSI-DRM [1] defines the SDC code rates summarized in Table 21 and the MSC modes with code
rates R given in Table 22.
TABLE 21
SDC code rates
MSC-mode 11
(4-QAM)
MSC-mode 00
(16-QAM)
SDC-mode Code rate R SDC-mode Code rate R
0 0.5 0 0.5
1 0.25 1 0.25
TABLE 22
MSC code rates
Protection level
Code rate R for
MSC mode 11: 4-QAM
Code rate R combinations for
MSC mode 00: 16-QAM
Rall R0 Rall R0 R1 RYlcm
0 0.25 1/4 0.33 1/6 1/2 6
1 0.33 1/3 0.41 1/4 4/7 28
2 0.4 2/5 0.5 1/3 2/3 3
3 0.5 1/2 0.62 1/2 3/4 4
The net bit rate of the MSC varies from 37 kbit/s to 186 kbit/s depending of the used parameter set.
4.1.2 SDC and MSC code rates for calculations
Several of the derived parameters depend on the characteristic of the transmitted DRM signal. To
limit the amount of tests two typical parameters sets were chosen as basic sets, see Table 23:
– DRM with 4-QAM as a high protected signal with a lower data rate which is suited for a
robust audio signal with a low data rate data service.
– DRM with 16-QAM as a low protected signal with a high data rate which is suited for several
audio signals or for an audio signal with a high data rate data service.

Rep. ITU-R BS.2214-1 19
TABLE 23
MSC code rates for calculations
MSC mode 11-4-QAM 00-16-QAM
MSC protection level 1 2
MSC code rate R 1/3 1/2
SDC mode 1 1
SDC code rate R 0.25 0.25
Bit rate approx. 49.7 kbit/s 149.1 kbit/s
4.2 Propagation-related OFDM parameters
The propagation-related OFDM parameters of DRM are given in Table 24.
TABLE 24
OFDM parameters
Elementary time period T 83 1/3 μs
Duration of useful (orthogonal) part Tu = 27 · T 2.25 ms
Duration of guard interval Tg = 3 · T 0.25 ms
Duration of symbol Ts = Tu + Tg 2.5 ms
Tg/Tu 1/9
Duration of transmission frame Tf 100 ms
Number of symbols per frame Ns 40
Channel bandwidth B 96 kHz
Carrier spacing 1/Tu 444 4/9 Hz
Carrier number space Kmin = −106;
Kmax = 106
Unused carriers none
4.3 Single frequency operation capability
DRM transmitter can be operating in single frequency networks (SFN). The maximum transmitter
distance that has to go below to prevent self interferences depends on the length of the OFDM guard
interval.
The maximum transmitter distance is calculated with the maximum echo delay which is given by:
Decho(max) (km) = Tg · c0 (26)
where:
c0 = 300 · 103 (km/s)
Tg = 0.25 (s).
Since the length Tg of the DRM guard interval is 0.25 ms, see Table 24, the maximum echo delay,
and, therefore, the maximum transmitter distance, yields 75 km.
20 Rep. ITU-R BS.2214-1
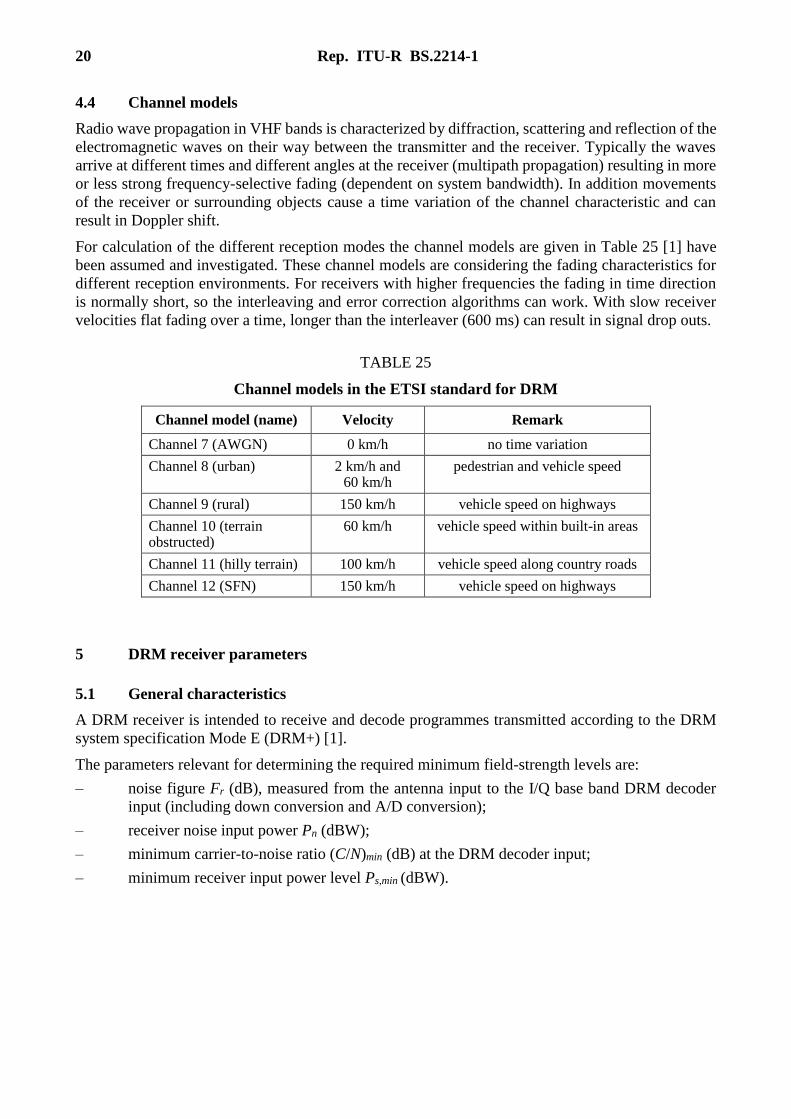
4.4 Channel models
Radio wave propagation in VHF bands is characterized by diffraction, scattering and reflection of the
electromagnetic waves on their way between the transmitter and the receiver. Typically the waves
arrive at different times and different angles at the receiver (multipath propagation) resulting in more
or less strong frequency-selective fading (dependent on system bandwidth). In addition movements
of the receiver or surrounding objects cause a time variation of the channel characteristic and can
result in Doppler shift.
For calculation of the different reception modes the channel models are given in Table 25 [1] have
been assumed and investigated. These channel models are considering the fading characteristics for
different reception environments. For receivers with higher frequencies the fading in time direction
is normally short, so the interleaving and error correction algorithms can work. With slow receiver
velocities flat fading over a time, longer than the interleaver (600 ms) can result in signal drop outs.
TABLE 25
Channel models in the ETSI standard for DRM
Channel model (name) Velocity Remark
Channel 7 (AWGN) 0 km/h no time variation
Channel 8 (urban) 2 km/h and 60 km/h
pedestrian and vehicle speed
Channel 9 (rural) 150 km/h vehicle speed on highways
Channel 10 (terrain obstructed)
60 km/h vehicle speed within built-in areas
Channel 11 (hilly terrain) 100 km/h vehicle speed along country roads
Channel 12 (SFN) 150 km/h vehicle speed on highways
5 DRM receiver parameters
5.1 General characteristics
A DRM receiver is intended to receive and decode programmes transmitted according to the DRM
system specification Mode E (DRM+) [1].
The parameters relevant for determining the required minimum field-strength levels are:
– noise figure Fr (dB), measured from the antenna input to the I/Q base band DRM decoder
input (including down conversion and A/D conversion);
– receiver noise input power Pn (dBW);
– minimum carrier-to-noise ratio (C/N)min (dB) at the DRM decoder input;
– minimum receiver input power level Ps,min (dBW).

Rep. ITU-R BS.2214-1 21
5.2 Receiver noise figure
In GE06 a receiver noise figure of 7 dB is been used for both DVB-T and T-DAB. For having cost
effective DRM receiver solutions the receiver noise figure F is assumed to be Fr = 7 dB too for all
VHF bands, see Table 26.
TABLE 26
Receiver noise figure Fr
Frequency (MHz) 65 100 200
Receiver noise figure Fr (dB) 7 7 7
5.3 Receiver noise input power
With B = 100 kHz and T = 290 K, the thermal receiver noise input power level Pn for DRM Mode E
yields:
dBW98.146–log10dBdBW 010 BTkFP rn (27)
5.4 Minimum carrier to noise ratio
On basis of the channel models in the respective reception mode (see section 0) the required minimum
values of the (C/N)min had been calculated. Therefore effects of the narrow-band system like fast
fading are included in the calculated values of the (C/N)min.
ETSI-DRM gives a required (C/N)min for a transmission in VHF Band II to achieve an average coded
bit error ratio BER = 1 10–4 (bit) after the channel decoder for different channel models, see Table 27.
TABLE 27
(C/N)min with different channel models
(C/N)min (dB) for
Reception mode Channel model 4-QAM, R = 1/3 16-QAM, R = 1/2
Fixed reception Channel 7 (AWGN) 1.3 7.9
Portable reception Channel 8 (urban@60 km/h) 7.3 15.4
Channel 9 (rural) 5.6 13.1
Channel 10 (terrain obstructed) 5.4 12.6
Mobile reception Channel 11 (hilly terrain) 5.5 12.8
Channel 12 (SFN) 5.4 12.3

22 Rep. ITU-R BS.2214-1
5.5 Minimum receiver input power level
Based on the above equations and including the implementation loss factor (see 0), the minimum
receiver input power level at the receiving location can be calculated for both 16-QAM and 4-QAM,
see Table 28 and Table 29.
TABLE 28
Minimum receiver input power level Ps,min for 4-QAM, R = 1/3
Reception mode Fixed Portable Mobile
Receiver noise figure Fr (dB) 7 7 7
Receiver noise input power level Pn (dBW) −146.98 −146.98 −146.98
Representative minimum C/N ratio (C/N)min (dB) 1.3 7.3 5.5
Implementation loss factor Li (dB) 3 3 3
Minimum receiver input power level Ps,min (dBW) −142.68 −136.68 −138.48
TABLE 29
Minimum receiver input power level Ps,min for 16-QAM, R = 1/2
Reception mode Fixed Portable Mobile
Receiver noise figure Fr (dB) 7 7 7
Receiver noise input power level Pn (dBW) −146.98 −146.98 −146.98
Representative minimum C/N ratio (C/N)min (dB) 7.9 15.4 12.8
Implementation loss factor Li (dB) 3 3 3
Minimum receiver input power level Ps,min (dBW) −136.08 −128.58 −131.18
6 DRM planning parameters
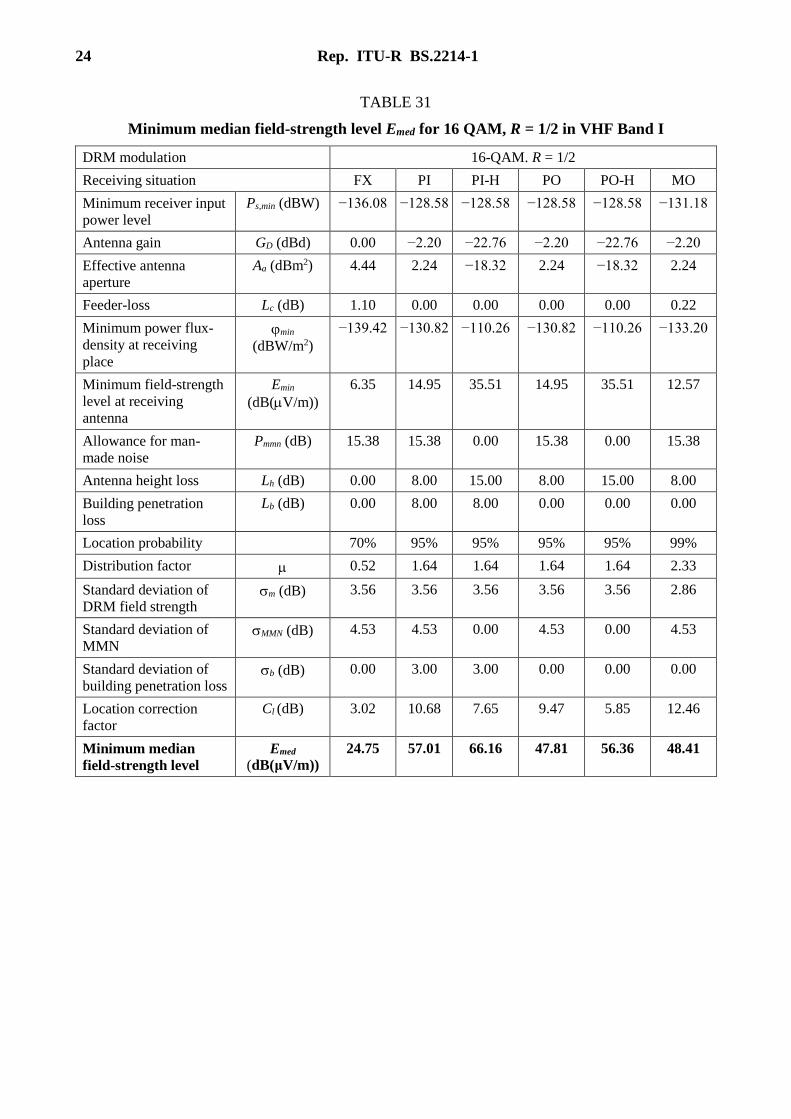
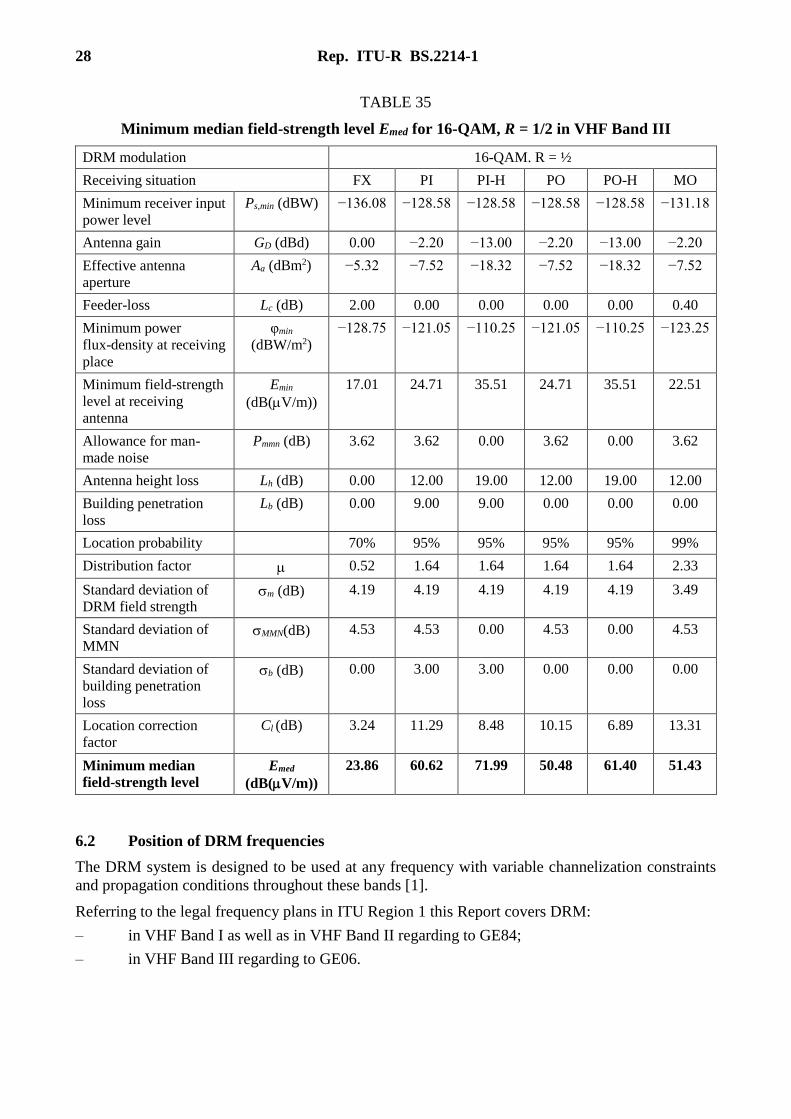
6.1 Minimum median field-strength level
Based on the equations in section 0, the minimum median field-strength level for the respective
reception modes had been calculated for both 16-QAM and 4-QAM, for VHF Bands I, II and III,
see Table 30 to Table 35.

Rep. ITU-R BS.2214-1 23
6.1.1 VHF Band I
TABLE 30
Minimum median field-strength level Emed for 4-QAM, R = 1/3 in VHF Band I
DRM modulation 4-QAM. R = 1/3
Receiving situation FX PI PI-H PO PO-H MO
Minimum receiver input
power level
Ps,min (dBW) −142.68 −136.68 −136.68 −136.68 −136.68 −138.48
Antenna gain GD (dBd) 0.00 −2.20 −22.76 −2.20 −22.76 −2.20
Effective antenna aperture Aa (dBm2) 4.44 2.24 −18.32 2.24 −18.32 2.24
Feeder-loss Lc dB 1.10 0.00 0.00 0.00 0.00 0.22
Minimum power flux-density
at receiving place
φmin
(dBW/m2)
−146.02 −138.92 −118.36 −138.92 −118.36 −140.50
Minimum field-strength level
at receiving antenna
Emin
(dB(μV/m))
−0.25 6.85 27.41 6.85 27.41 5.27
Allowance for man-made
noise
Pmmn (dB) 15.38 15.38 0.00 15.38 0.00 15.38
Antenna height loss Lh (dB) 0.00 8.00 15.00 8.00 15.00 8.00
Building penetration loss Lb (dB) 0.00 8.00 8.00 0.00 0.00 0.00
Location probability 70% 95% 95% 95% 95% 99%
Distribution factor μ 0.52 1.64 1.64 1.64 1.64 2.33
Standard deviation of DRM
field strength
σm (dB) 3.56 3.56 3.56 3.56 3.56 2.86
Standard deviation of MMN σMMN (dB) 4.53 4.53 0.00 4.53 0.00 4.53
Standard deviation of building
penetration loss
σb (dB) 0.00 3.00 3.00 0.00 0.00 0.00
Location correction factor Cl (dB) 3.02 10.68 7.65 9.47 5.85 12.46
Minimum median
field-strength level
Emed
(dB(V/m))
18.15 48.91 58.06 39.71 48.26 41.11
24 Rep. ITU-R BS.2214-1
TABLE 31
Minimum median field-strength level Emed for 16 QAM, R = 1/2 in VHF Band I
DRM modulation 16-QAM. R = 1/2
Receiving situation FX PI PI-H PO PO-H MO
Minimum receiver input
power level
Ps,min (dBW) −136.08 −128.58 −128.58 −128.58 −128.58 −131.18
Antenna gain GD (dBd) 0.00 −2.20 −22.76 −2.20 −22.76 −2.20
Effective antenna
aperture
Aa (dBm2) 4.44 2.24 −18.32 2.24 −18.32 2.24
Feeder-loss Lc (dB) 1.10 0.00 0.00 0.00 0.00 0.22
Minimum power flux-
density at receiving
place
min
(dBW/m2)
−139.42 −130.82 −110.26 −130.82 −110.26 −133.20
Minimum field-strength
level at receiving
antenna
Emin
(dB(V/m))
6.35 14.95 35.51 14.95 35.51 12.57
Allowance for man-
made noise
Pmmn (dB) 15.38 15.38 0.00 15.38 0.00 15.38
Antenna height loss Lh (dB) 0.00 8.00 15.00 8.00 15.00 8.00
Building penetration
loss
Lb (dB) 0.00 8.00 8.00 0.00 0.00 0.00
Location probability 70% 95% 95% 95% 95% 99%
Distribution factor 0.52 1.64 1.64 1.64 1.64 2.33
Standard deviation of
DRM field strength m (dB) 3.56 3.56 3.56 3.56 3.56 2.86
Standard deviation of
MMN MMN (dB) 4.53 4.53 0.00 4.53 0.00 4.53
Standard deviation of
building penetration loss b (dB) 0.00 3.00 3.00 0.00 0.00 0.00
Location correction
factor
Cl (dB) 3.02 10.68 7.65 9.47 5.85 12.46
Minimum median
field-strength level
Emed
(dB(μV/m))
24.75 57.01 66.16 47.81 56.36 48.41

Rep. ITU-R BS.2214-1 25
6.1.2 VHF Band II
TABLE 32
Minimum median field-strength level Emed for 4-QAM, R = 1/3 in VHF Band II
DRM modulation 4-QAM. R = 1/3
Receiving situation FX PI PI-H PO PO-H MO
Minimum receiver
input power level
Ps,min (dBW) −142.68 −136.68 −136.68 −136.68 −136.68 −138.48
Antenna gain GD (dBd) 0.00 −2.20 −19.02 −2.20 −19.02 −2.20
Effective antenna
aperture
Aa (dBm2) 0.70 −1.50 −18.32 −1.50 −18.32 −1.50
Feeder-loss Lc (dB) 1.40 0.00 0.00 0.00 0.00 0.28
Minimum power
flux-density at
receiving place
φmin
(dBW/m2)
−141.97 −135.17 −118.35 −135.17 −118.35 −136.69
Minimum field-
strength level at
receiving antenna
Emin
(dB(μV/m))
3.79 10.59 27.41 10.59 27.41 9.07
Allowance for man-
made noise
Pmmn (dB) 10.43 10.43 0.00 10.43 0.00 10.43
Antenna height loss Lh (dB) 0.00 10.00 17.00 10.00 17.00 10.00
Building penetration
loss
Lb (dB) 0.00 9.00 9.00 0.00 0.00 0.00
Location probability 70% 95% 95% 95% 95% 99%
Distribution factor μ 0.52 1.64 1.64 1.64 1.64 2.33
Standard deviation of
DRM field strength
σm (dB) 3.80 3.80 3.80 3.80 3.80 3.10
Standard deviation of
MMN
σMMN (dB) 4.53 4.53 0.00 4.53 0.00 4.53
Standard deviation of
building penetration
loss
σb (dB) 0.00 3.00 3.00 0.00 0.00 0.00
Location correction
factor
Cl (dB) 3.10 10.91 7.96 9.73 6.25 12.77
Minimum median
field-strength level
Emed
(dB(μV/m))
17.32 50.92 61.37 40.74 50.66 42.27

26 Rep. ITU-R BS.2214-1
TABLE 33
Minimum median field-strength level Emed for 16-QAM, R = 1/2 in VHF Band II
DRM modulation 16-QAM R = 1/2
Receiving situation FX PI PI-H PO PO-H MO
Minimum receiver input
power level
Ps,min (dBW) −136.08 −128.58 −128.58 −128.58 −128.58 −131.18
Antenna gain GD (dBd) 0.00 −2.20 −19.02 −2.20 −19.02 −2.20
Effective antenna
aperture
Aa (dBm2) 0.70 −1.50 −18.32 −1.50 −18.32 −1.50
Feeder-loss Lc (dB) 1.40 0.00 0.00 0.00 0.00 0.28
Minimum power flux-
density at receiving place
φmin
(dBW/m2)
−135.37 −127.07 −110.25 −127.07 −110.25 −129.39
Minimum field-strength
level at receiving antenna
Emin
(dB(μV/m))
10.39 18.69 35.51 18.69 35.51 16.37
Allowance for man-made
noise
Pmmn (dB) 10.43 10.43 0.00 10.43 0.00 10.43
Antenna height loss Lh (dB) 0.00 10.00 17.00 10.00 17.00 10.00
Building penetration loss Lb (dB) 0.00 9.00 9.00 0.00 0.00 0.00
Location probability 70% 95% 95% 95% 95% 99%
Distribution factor μ 0.52 1.64 1.64 1.64 1.64 2.33
Standard deviation of
DRM field strength
σm (dB) 3.80 3.80 3.80 3.80 3.80 3.10
Standard deviation of
MMN
σMMN (dB) 4.53 4.53 0.00 4.53 0.00 4.53
Standard deviation of
building penetration loss
σb (dB) 0.00 3.00 3.00 0.00 0.00 0.00
Location correction
factor
Cl (dB) 3.10 10.91 7.96 9.73 6.25 12.77
Minimum median
field-strength level
Emed
(dB(μV/m))
23.92 59.02 69.47 48.84 58.76 49.57

Rep. ITU-R BS.2214-1 27
6.1.3 VHF Band III
TABLE 34
Minimum median field-strength level Emed for 4-QAM, R = 1/3 in VHF Band III
DRM modulation 4-QAM. R = 1/3
Receiving situation FX PI PI-H PO PO-H MO
Minimum receiver input
power level
Ps,min (dBW) −142.68 −136.68 −136.68 −136.68 −136.68 −138.48
Antenna gain GD (dBd) 0.00 −2.20 −13.00 −2.20 −13.00 −2.20
Effective antenna
aperture
Aa (dBm2) −5.32 −7.52 −18.32 −7.52 −18.32 −7.52
Feeder-loss Lc (dB) 2.00 0.00 0.00 0.00 0.00 0.40
Minimum power
flux-density at receiving
place
min
(dBW/m2)
−135.35 −129.15 −118.35 −129.15 −118.35 −130.55
Minimum field-strength
level at receiving antenna
Emin
(dB(V/m))
10.41 16.61 27.41 16.61 27.41 15.21
Allowance for man-made
noise
Pmmn (dB) 3.62 3.62 0.00 3.62 0.00 3.62
Antenna height loss Lh (dB) 0.00 12.00 19.00 12.00 19.00 12.00
Building penetration loss Lb (dB) 0.00 9.00 9.00 0.00 0.00 0.00
Location probability 70% 95% 95% 95% 95% 99%
Distribution factor 0.52 1.64 1.64 1.64 1.64 2.33
Standard deviation of
DRM field strength m (dB) 4.19 4.19 4.19 4.19 4.19 3.49
Standard deviation of
MMN MMN (dB) 4.53 4.53 0.00 4.53 0.00 4.53
Standard deviation of
building penetration loss b (dB) 0.00 3.00 3.00 0.00 0.00 0.00
Location correction factor Cl (dB) 3.24 11.29 8.48 10.15 6.89 13.31
Minimum median
field-strength level
Emed
(dB(μV/m))
17.26 52.52 63.89 42.38 53.30 44.13
28 Rep. ITU-R BS.2214-1
TABLE 35
Minimum median field-strength level Emed for 16-QAM, R = 1/2 in VHF Band III
DRM modulation 16-QAM. R = ½
Receiving situation FX PI PI-H PO PO-H MO
Minimum receiver input
power level
Ps,min (dBW) −136.08 −128.58 −128.58 −128.58 −128.58 −131.18
Antenna gain GD (dBd) 0.00 −2.20 −13.00 −2.20 −13.00 −2.20
Effective antenna
aperture
Aa (dBm2) −5.32 −7.52 −18.32 −7.52 −18.32 −7.52
Feeder-loss Lc (dB) 2.00 0.00 0.00 0.00 0.00 0.40
Minimum power
flux-density at receiving
place
φmin
(dBW/m2)
−128.75 −121.05 −110.25 −121.05 −110.25 −123.25
Minimum field-strength
level at receiving
antenna
Emin
(dB(V/m))
17.01 24.71 35.51 24.71 35.51 22.51
Allowance for man-
made noise
Pmmn (dB) 3.62 3.62 0.00 3.62 0.00 3.62
Antenna height loss Lh (dB) 0.00 12.00 19.00 12.00 19.00 12.00
Building penetration
loss
Lb (dB) 0.00 9.00 9.00 0.00 0.00 0.00
Location probability 70% 95% 95% 95% 95% 99%
Distribution factor 0.52 1.64 1.64 1.64 1.64 2.33
Standard deviation of
DRM field strength m (dB) 4.19 4.19 4.19 4.19 4.19 3.49
Standard deviation of
MMN MMN(dB) 4.53 4.53 0.00 4.53 0.00 4.53
Standard deviation of
building penetration
loss
b (dB) 0.00 3.00 3.00 0.00 0.00 0.00
Location correction
factor
Cl (dB) 3.24 11.29 8.48 10.15 6.89 13.31
Minimum median
field-strength level
Emed
(dB(V/m))
23.86 60.62 71.99 50.48 61.40 51.43
6.2 Position of DRM frequencies
The DRM system is designed to be used at any frequency with variable channelization constraints
and propagation conditions throughout these bands [1].
Referring to the legal frequency plans in ITU Region 1 this Report covers DRM:
– in VHF Band I as well as in VHF Band II regarding to GE84;
– in VHF Band III regarding to GE06.
Rep. ITU-R BS.2214-1 29
Other areas in the VHF bands assigned for sound broadcasting services, e.g. areas in ITU Region 1
where allocations of the Wiesbaden T-DAB Agreement 1995 are still used (230-240 MHz) or in
southern Africa, where the VHF Band III is allocated to the broadcasting services up to 254 MHz, or
the broadcasting bands in ITU Region 2 and 3, perhaps the OIRT FM band (65.8-74 MHz) or the
Japanese FM band (76-90 MHz), respectively, are not yet covered in this section and can be adapted
later.
6.2.1 VHF Band I and VHF Band II
The DRM centre frequencies are positioned in 100 kHz distance according to the FM frequency grid
in VHF Band II. The nominal carrier frequencies are, in principle, integral multiples of 100 kHz [5].
The DRM system is designed to be used with this raster [1].
The table of centre frequencies of DRM in VHF Band II is given in Annex 2.
On the other hand it has to be considered to allow a spacing of 50 kHz in VHF Band II to achieve the
full potential of the DRM hybrid mode and to alleviate the deployment of new DRM transmitters in
the overcrowded FM band.
6.2.2 VHF Band III
The frequency band of a DAB block has a bandwidth of 1.536 MHz [2] with lower and upper guard
channels to fit into the 7 MHz channels of VHF Band III.
The DRM centre frequencies are positioned in 100 kHz distance beginning by 174.05 MHz and
integral multiples of 100 kHz up to the end of VHF Band III.
The table of the centre frequencies of DRM in VHF Band III in the range from 174 to 230 MHz is
given in Annex 2.
6.3 Out-of-band spectrum mask
The power density spectrum at the transmitter output is important to determine the adjacent channel
interference.
The spectrum characteristics of an OFDM system are given in Recommendation ITU-R SM.328,
Annex 6, Chapter 5.
6.3.1 VHF Band I and VHF Band II
An out-of-band spectrum mask for DRM in VHF Band I and VHF Band II, respectively, as minimum
transmitter requirement is proposed in Fig. 1 and Table 36. The vertices of the symmetric out-of-band
spectrum mask for FM transmitters are given in ETSI-FM [7].
Note that the out-of-band spectrum masks are defined for a resolution bandwidth (RBW) of 1 kHz.

30 Rep. ITU-R BS.2214-1
FIGURE 1
Out-of-band spectrum masks for FM in VHF Band II and DRM in VHF Bands I and II
TABLE 36
Out-of-band spectrum masks for FM in VHF Band II
and DRM in VHF Bands I and II
Spectrum mask
(100 kHz channel)/
relative level for FM
Spectrum mask
(100 kHz channel)/
relative level for DRM
Frequency
offset
(kHz)
Level
(dBc)/
(1 kHz)
Frequency
offset
(kHz)
Level
(dBc)/
(1 kHz)
0 0 0 −20
50 0 50 −20
70 0 70 −50
100 0 100 −70
200 −80 200 −80
300 −85 300 −85
400 −85 400 −85

Rep. ITU-R BS.2214-1 31
6.3.2 VHF Band III
The vertices of the symmetric out-of-band spectrum masks for DAB transmitters are given in
Recommendation ITU-R BS.1660. An out-of-band spectrum mask for DRM is proposed that fits into
the DAB masks, see Fig. 2 and Table 37.
Note that the out-of-band spectrum masks are defined for a resolution bandwidth (RBW) of 4 kHz.
Thus the value of –14 dBr results for DRM.
FIGURE 2
Out-of-band spectrum masks for DAB and DRM in VHF Band III
Report BS.2214-02
–4 –3 –2 –1 0 1 2 3 4
Frequency offset (MHz)
Lev
el (
dB
c in
4 k
Hz)
–80
–60
–40
–20
0
DAB uncritical DAB critical
–140
–120
–100
DAB critical 12D DRM
TABLE 37
Out-of-band spectrum masks for DAB and DRM in VHF Band III
Spectrum mask
(1.54 MHz channel)/
relative level for DAB
Spectrum mask
(100 kHz channel)
relative level for DRM
Frequency
offset
(MHz)
Level (dBc)
(non-critical
cases)
Level (dBc)
(critical
cases)
Level (dBc)
(critical
cases/12D)
Frequency offset
(kHz)
Level
(dBc)
0.77 – −26 −26 0 −14
< 0.97 −26 – – 50 −14
0.97 −56 −71 −78 60 −44
1.75 – −106 – 181.25 −59
2.2 – – −126 200 −74
3.0 −106 −106 −126 300 −79
500 −84

32 Rep. ITU-R BS.2214-1
6.4 Protection ratios
The minimum acceptable ratio between a wanted signal and interfering signals to protect the reception
of the wanted signal is defined as the protection ratio PR (dB). The values of protection ratios are
given as:
– Basic protection ratio PRbasic for a wanted signal interfered with by an unwanted signal at
50% location probability. These values are determined in accordance with Recommendation
ITU-R BS.641.
– Combined location correction factor CF (dB) as a margin that has to be added to the basic
protection ratio for a wanted signal interfered with by an unwanted signal for the calculation
of protection ratios at location probability greater as 50%. The equation for the calculation is
given in section 0.
– Corresponding protection ratio PR(p) for a wanted digital signal interfered with by an
unwanted signal at location probability greater than 50% taking into account the respective
location probability of the corresponding reception modes that have higher protection
requirements due to the higher location probability to be protected.
6.4.1 Protection ratios for DRM
The DRM signal parameters are given in § 4.1.
6.4.1.1 DRM interfered with by DRM
The basic protection ratio PRbasic for DRM is valid for all VHF bands, see Table 38. For the standard
deviation of DRM differs in the respective VHF bands the combined location correction factors CF,
see Table 39, are different in the respective VHF bands as well as the corresponding protection ratios
PR(p), see Table 40 for 4-QAM and Table 41 for 16-QAM.
TABLE 38
Basic protection ratios PRbasic for DRM interfered with by DRM
Frequency offset (kHz) 0 ±100 ±200
DRM (4-QAM, R = 1/3) PRbasic (dB) 4 −16 −40
DRM (16-QAM, R = 1/2) PRbasic (dB) 10 −10 −34
TABLE 39
Combined location correction factor CF for DRM interfered with by DRM
Reference frequency band (MHz) 65 MHz
VHF Band I
100 MHz
VHF Band II
200 MHz
VHF Band III
Location probability p (%) 70 95 99 70 95 99 70 95 99
Combined location correction
factor in urban and suburban
area for fixed and portable
reception
CF
(dB)
2.64 8.27 11.70 2.82 8.84 12.50 3.11 9.75 13.79
Combined location correction
factor in rural area for
mobile reception
CF
(dB)
2.12 6.65 9.40 2.30 7.21 10.20 2.59 8.12 11.49

Rep. ITU-R BS.2214-1 33
TABLE 40
Corresponding protection ratios PR(p) to reception modes
for DRM (4-QAM. R = 1/3) interfered with by DRM
Reference frequency band (MHz) 65 MHz
VHF Band I
Frequency offset (kHz) 0 ±100 ±200
Fixed reception (FX) PR(p) (dB) 6.64 −13.36 −37.36
Portable reception (PO, PI, PO-H, PI-H) PR(p) (dB) 12.27 −7.73 −31.73
Mobile reception (MO) PR(p) (dB) 13.40 −6.60 −30.60
Reference frequency band (MHz) 100 MHz
VHF Band II
Frequency offset (kHz) 0 ±100 ±200
Fixed reception (FX) PR(p) (dB) 6.82 −13.18 −37.18
Portable reception (PO, PI, PO-H, PI-H) PR(p) (dB) 12.84 −7.16 −31.16
Mobile reception (MO) PR(p) (dB) 14.20 −5.80 −29.80
Reference frequency band (MHz) 200 MHz
VHF Band III
Frequency offset (kHz) 0 ±100 ±200
Fixed reception (FX) PR(p) (dB) 7.11 −12.89 −36.89
Portable reception (PO. PI. PO-H. PI-H) PR(p) (dB) 13.75 −6.25 −30.25
Mobile reception (MO) PR(p) (dB) 15.49 −4.51 −28.51
TABLE 41
Corresponding protection ratios PR(p) to reception modes
for DRM (16-QAM. R = 1/2) interfered with by DRM
Reference frequency band (MHz) 65 MHz
VHF Band I
Frequency offset (kHz) 0 ±100 ±200
Fixed reception (FX) PR(p) (dB) 12.64 −7.36 −31.36
Portable reception (PO. PI. PO-H. PI-H) PR(p) (dB) 18.27 −1.73 −25.73
Mobile reception (MO) PR(p) (dB) 19.40 −0.60 −24.60
Reference frequency band (MHz) 100 MHz
VHF Band II
Frequency offset (kHz) 0 ±100 ±200
Fixed reception (FX) PR(p) (dB) 12.82 −7.18 −31.18
Portable reception (PO, PI, PO-H, PI-H) PR(p) (dB) 18.84 −1.16 −25.16
Mobile reception (MO) PR(p) (dB) 20.20 0.20 −23.80
34 Rep. ITU-R BS.2214-1
TABLE 41 (end)
Reference frequency band (MHz) 200 MHz
VHF Band III
Frequency offset (kHz) 0 ±100 ±200
Fixed reception (FX) PR(p) (dB) 13.11 −6.89 −30.89
Portable reception (PO, PI, PO-H, PI-H) PR(p) (dB) 19.75 −0.25 −24.25
Mobile reception (MO) PR(p) (dB) 21.49 1.49 −22.51
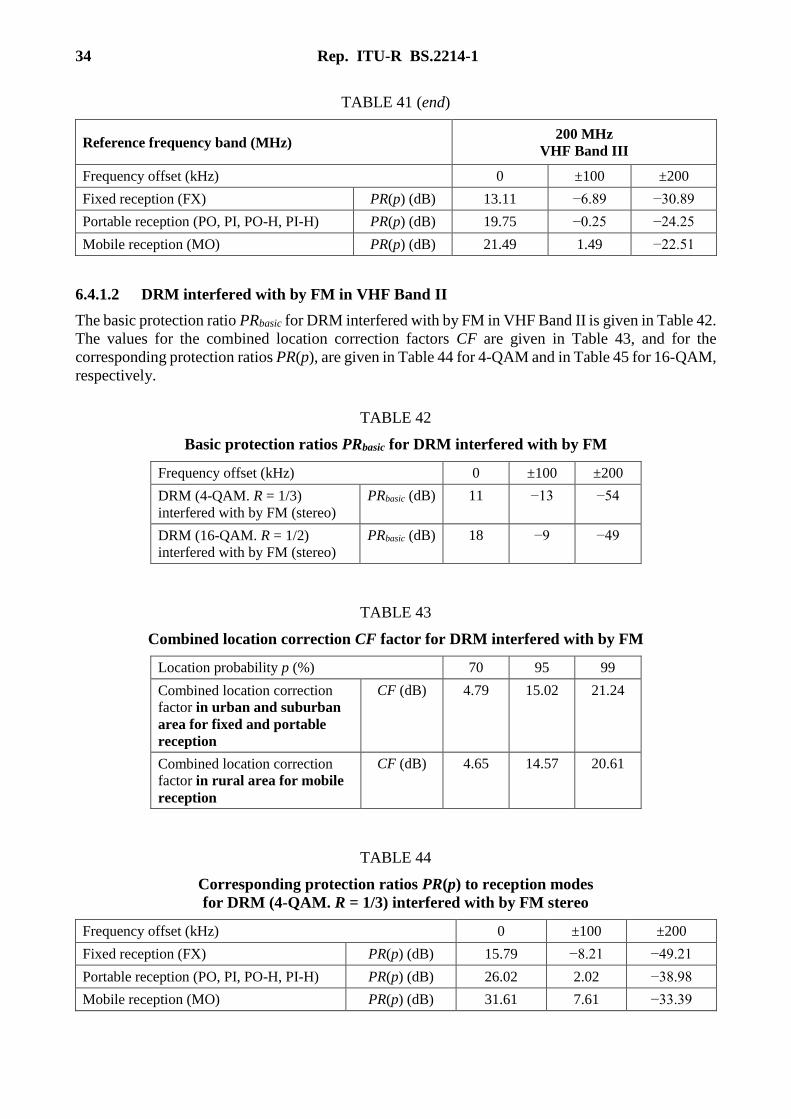
6.4.1.2 DRM interfered with by FM in VHF Band II
The basic protection ratio PRbasic for DRM interfered with by FM in VHF Band II is given in Table 42.
The values for the combined location correction factors CF are given in Table 43, and for the
corresponding protection ratios PR(p), are given in Table 44 for 4-QAM and in Table 45 for 16-QAM,
respectively.
TABLE 42
Basic protection ratios PRbasic for DRM interfered with by FM
Frequency offset (kHz) 0 ±100 ±200
DRM (4-QAM. R = 1/3)
interfered with by FM (stereo)
PRbasic (dB) 11 −13 −54
DRM (16-QAM. R = 1/2)
interfered with by FM (stereo)
PRbasic (dB) 18 −9 −49
TABLE 43
Combined location correction CF factor for DRM interfered with by FM
Location probability p (%) 70 95 99
Combined location correction
factor in urban and suburban
area for fixed and portable
reception
CF (dB) 4.79 15.02 21.24
Combined location correction
factor in rural area for mobile
reception
CF (dB) 4.65 14.57 20.61
TABLE 44
Corresponding protection ratios PR(p) to reception modes
for DRM (4-QAM. R = 1/3) interfered with by FM stereo
Frequency offset (kHz) 0 ±100 ±200
Fixed reception (FX) PR(p) (dB) 15.79 −8.21 −49.21
Portable reception (PO, PI, PO-H, PI-H) PR(p) (dB) 26.02 2.02 −38.98
Mobile reception (MO) PR(p) (dB) 31.61 7.61 −33.39

Rep. ITU-R BS.2214-1 35
TABLE 45
Corresponding protection ratios PR(p) to reception modes
for DRM (16-QAM. R = 1/2) interfered with by FM stereo
Frequency offset (kHz) 0 ±100 ±200
Fixed reception (FX) PR(p) (dB) 22.79 −4.21 −44.21
Portable reception (PO, PI, PO-H, PI-H) PR(p) (dB) 33.02 6.02 −33.98
Mobile reception (MO) PR(p) (dB) 38.61 11.61 −28.39
6.4.1.3 DRM interfered with by DAB in VHF Band III
The basic protection ratio PRbasic for DRM interfered with by DAB in VHF Band III is given in
Table 46. The values for the combined location correction factors CF are given in Table 47, and for
the corresponding protection ratios PR(p), are given in Table 48 for 4-QAM and in Table 49 for
16-QAM, respectively.
TABLE 46
Basic protection ratios PRbasic of DRM interfered with by DAB
Frequency offset (kHz) 0 ±100 ±200
Basic protection ratio for
DRM (4-QAM. R = 1/3)
PRbasic (dB) −7 −36 −40
Basic protection ratio for
DRM (16-QAM. R = 1/2)
PRbasic (dB) −2 −18 −40
TABLE 47
Combined location correction factor CF of DRM interfered with by DAB
Location probability p (%) 70 95 99
Combined location correction factor
in urban and suburban area for
fixed and portable reception
CF (dB) 3.63 11.37 16.09
Combined location correction factor
in rural area for mobile reception
CF (dB) 3.42 10.72 15.16
TABLE 48
Corresponding protection ratios PR(p) to reception modes
for DRM (4-QAM. R = 1/3) interfered with by DAB
Frequency offset (kHz) 0 ±100 ±200
Fixed reception (FX) PR(p) (dB) −3.37 −32.37 −50.37
Portable reception (PO, PI, PO-H, PI-H) PR(p) (dB) 4.37 −24.63 −42.63
Mobile reception (MO) PR(p) (dB) 8.16 −20.84 −38.84
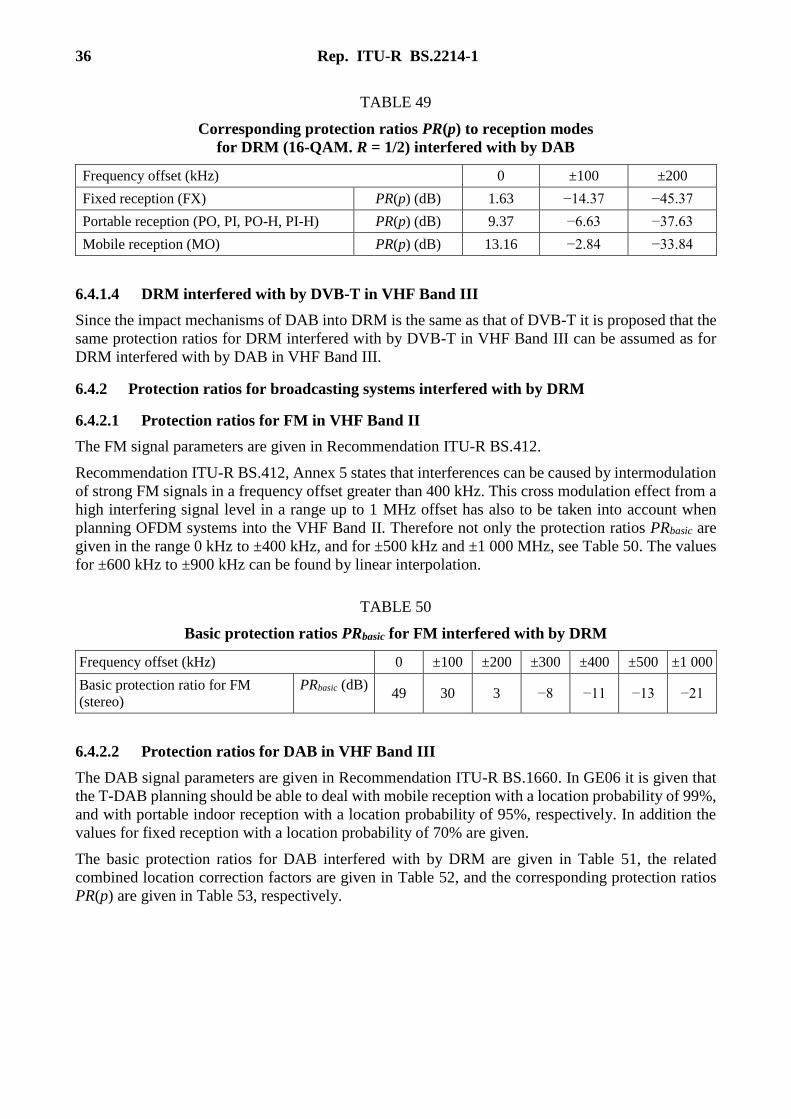
36 Rep. ITU-R BS.2214-1
TABLE 49
Corresponding protection ratios PR(p) to reception modes
for DRM (16-QAM. R = 1/2) interfered with by DAB
Frequency offset (kHz) 0 ±100 ±200
Fixed reception (FX) PR(p) (dB) 1.63 −14.37 −45.37
Portable reception (PO, PI, PO-H, PI-H) PR(p) (dB) 9.37 −6.63 −37.63
Mobile reception (MO) PR(p) (dB) 13.16 −2.84 −33.84
6.4.1.4 DRM interfered with by DVB-T in VHF Band III
Since the impact mechanisms of DAB into DRM is the same as that of DVB-T it is proposed that the
same protection ratios for DRM interfered with by DVB-T in VHF Band III can be assumed as for
DRM interfered with by DAB in VHF Band III.
6.4.2 Protection ratios for broadcasting systems interfered with by DRM
6.4.2.1 Protection ratios for FM in VHF Band II
The FM signal parameters are given in Recommendation ITU-R BS.412.
Recommendation ITU-R BS.412, Annex 5 states that interferences can be caused by intermodulation
of strong FM signals in a frequency offset greater than 400 kHz. This cross modulation effect from a
high interfering signal level in a range up to 1 MHz offset has also to be taken into account when
planning OFDM systems into the VHF Band II. Therefore not only the protection ratios PRbasic are
given in the range 0 kHz to ±400 kHz, and for ±500 kHz and ±1 000 MHz, see Table 50. The values
for ±600 kHz to ±900 kHz can be found by linear interpolation.
TABLE 50
Basic protection ratios PRbasic for FM interfered with by DRM
Frequency offset (kHz) 0 ±100 ±200 ±300 ±400 ±500 ±1 000
Basic protection ratio for FM
(stereo)
PRbasic (dB) 49 30 3 −8 −11 −13 −21
6.4.2.2 Protection ratios for DAB in VHF Band III
The DAB signal parameters are given in Recommendation ITU-R BS.1660. In GE06 it is given that
the T-DAB planning should be able to deal with mobile reception with a location probability of 99%,
and with portable indoor reception with a location probability of 95%, respectively. In addition the
values for fixed reception with a location probability of 70% are given.
The basic protection ratios for DAB interfered with by DRM are given in Table 51, the related
combined location correction factors are given in Table 52, and the corresponding protection ratios
PR(p) are given in Table 53, respectively.
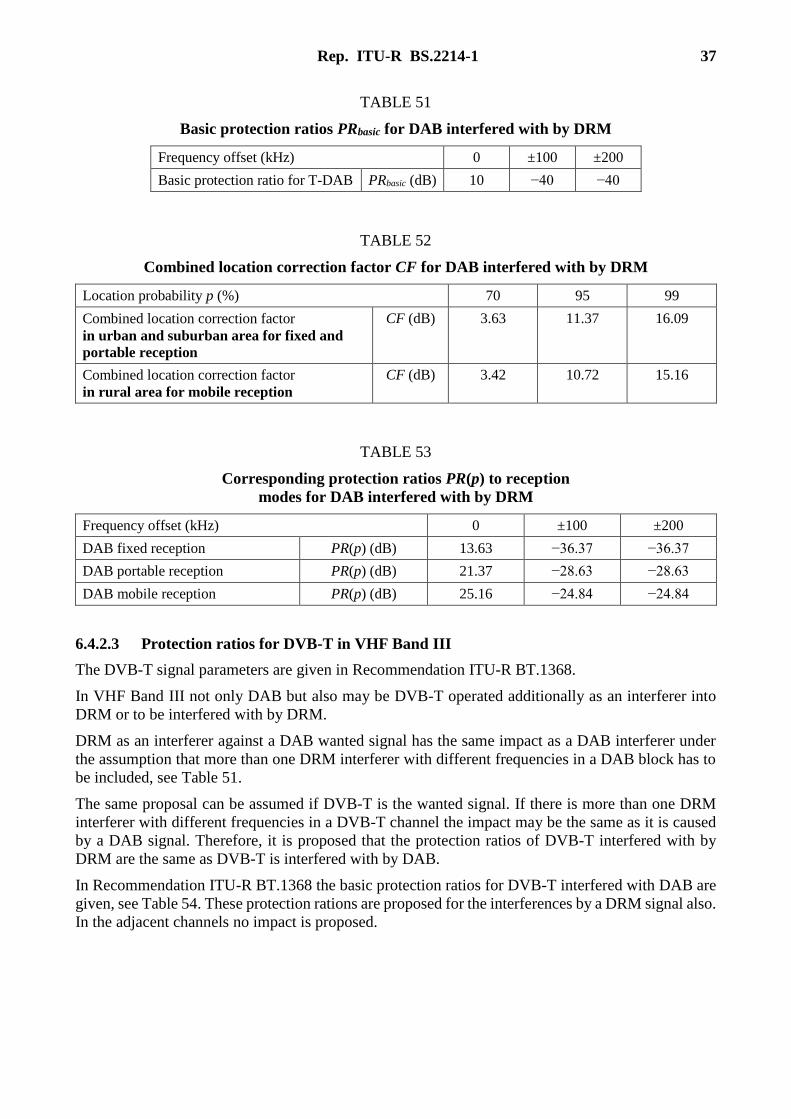
Rep. ITU-R BS.2214-1 37
TABLE 51
Basic protection ratios PRbasic for DAB interfered with by DRM
Frequency offset (kHz) 0 ±100 ±200
Basic protection ratio for T-DAB PRbasic (dB) 10 −40 −40
TABLE 52
Combined location correction factor CF for DAB interfered with by DRM
Location probability p (%) 70 95 99
Combined location correction factor
in urban and suburban area for fixed and
portable reception
CF (dB) 3.63 11.37 16.09
Combined location correction factor
in rural area for mobile reception
CF (dB) 3.42 10.72 15.16
TABLE 53
Corresponding protection ratios PR(p) to reception
modes for DAB interfered with by DRM
Frequency offset (kHz) 0 ±100 ±200
DAB fixed reception PR(p) (dB) 13.63 −36.37 −36.37
DAB portable reception PR(p) (dB) 21.37 −28.63 −28.63
DAB mobile reception PR(p) (dB) 25.16 −24.84 −24.84
6.4.2.3 Protection ratios for DVB-T in VHF Band III
The DVB-T signal parameters are given in Recommendation ITU-R BT.1368.
In VHF Band III not only DAB but also may be DVB-T operated additionally as an interferer into
DRM or to be interfered with by DRM.
DRM as an interferer against a DAB wanted signal has the same impact as a DAB interferer under
the assumption that more than one DRM interferer with different frequencies in a DAB block has to
be included, see Table 51.
The same proposal can be assumed if DVB-T is the wanted signal. If there is more than one DRM
interferer with different frequencies in a DVB-T channel the impact may be the same as it is caused
by a DAB signal. Therefore, it is proposed that the protection ratios of DVB-T interfered with by
DRM are the same as DVB-T is interfered with by DAB.
In Recommendation ITU-R BT.1368 the basic protection ratios for DVB-T interfered with DAB are
given, see Table 54. These protection rations are proposed for the interferences by a DRM signal also.
In the adjacent channels no impact is proposed.

38 Rep. ITU-R BS.2214-1
TABLE 54
Co-channel basic protection ratios PRbasic for DVB-T interfered
with by DAB (Recommendation ITU-R BT.1368) and by DRM
Wanted signal DVB-T
constellation-code rate
PR
(dB)
QPSK-1/2 10
QPSK-2/3 12
QPSK-3/4 14
16-QAM-1/2 15
16-QAM-2/3 18
16-QAM-3/4 20
64-QAM-1/2 20
64-QAM-2/3 24
64-QAM-3/4 26
64-QAM-7/8 31
6.4.3 Protection ratios for other services interfered with by DRM
6.4.3.1 Other services below the radio broadcasting VHF Band II
Below the VHF Band II broadcasting band, land mobile services with security tasks are located.
The interference potential of DRM into these services is not higher as the one of FM signals. Provided
sufficient additional band-pass filtering of the output of the transmitter is applied, the interference
potential of DRM into narrow-band FM (BOS) reception is not substantially higher than that of a
standard FM broadcast signal [8].
6.4.3.2 Other services above the radio broadcasting VHF Band II
Above the VHF Band II broadcasting band, aeronautical radio navigation services are located.
The interference potential of DRM into these services is not higher as the one of FM signals. For
frequency offsets of less than 200 kHz, the interference potential of DRM into VOR and ILS localizer
reception is much less than of a standard FM broadcast signal (up to 30 dB less). For larger frequency
offsets, both signals produce roughly the same interference, provided sufficient additional band-pass
filtering of the output of the transmitter is deployed [8].
6.4.3.3 Other services in the radio broadcasting VHF Band III
The values and the procedures to take into account other services in VHF Band III is given in GE06.
For DRM the same values as for DAB shall be applied.
6.5 Calculation of the resulting sum field strength of interferers
To calculate the resulting interfering sum field-strength level from several signal sources Esum
– in VHF Band I and VHF Band II the simplified multiplication method
(see Report ITU-R BS.945) shall be applied according to GE84,
– in VHF Band III the log-normal methods (see Report ITU-R BS.945) according to the
planning procedures of T-DAB and DVB-T [2] shall be applied.
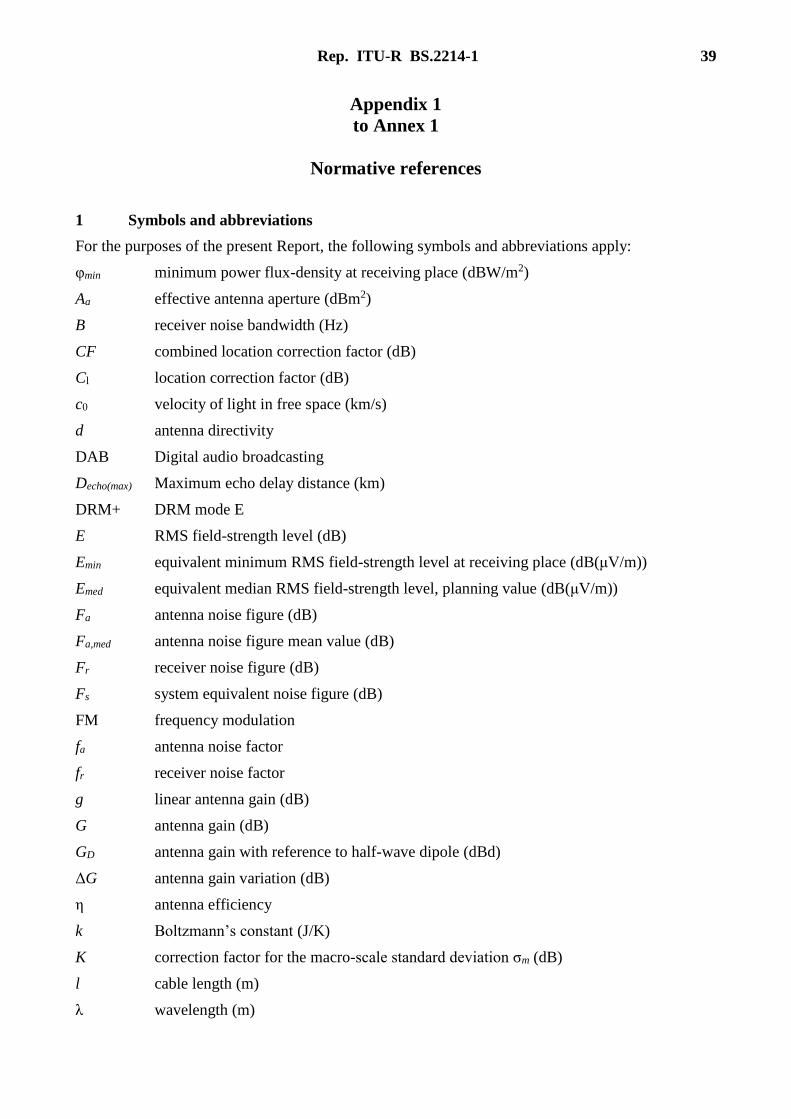
Rep. ITU-R BS.2214-1 39
Appendix 1
to Annex 1
Normative references
1 Symbols and abbreviations
For the purposes of the present Report, the following symbols and abbreviations apply:
φmin minimum power flux-density at receiving place (dBW/m2)
Aa effective antenna aperture (dBm2)
B receiver noise bandwidth (Hz)
CF combined location correction factor (dB)
Cl location correction factor (dB)
c0 velocity of light in free space (km/s)
d antenna directivity
DAB Digital audio broadcasting
Decho(max) Maximum echo delay distance (km)
DRM+ DRM mode E
E RMS field-strength level (dB)
Emin equivalent minimum RMS field-strength level at receiving place (dB(μV/m))
Emed equivalent median RMS field-strength level, planning value (dB(μV/m))
Fa antenna noise figure (dB)
Fa,med antenna noise figure mean value (dB)
Fr receiver noise figure (dB)
Fs system equivalent noise figure (dB)
FM frequency modulation
fa antenna noise factor
fr receiver noise factor
g linear antenna gain (dB)
G antenna gain (dB)
GD antenna gain with reference to half-wave dipole (dBd)
ΔG antenna gain variation (dB)
η antenna efficiency
k Boltzmann’s constant (J/K)
K correction factor for the macro-scale standard deviation σm (dB)
l cable length (m)
λ wavelength (m)
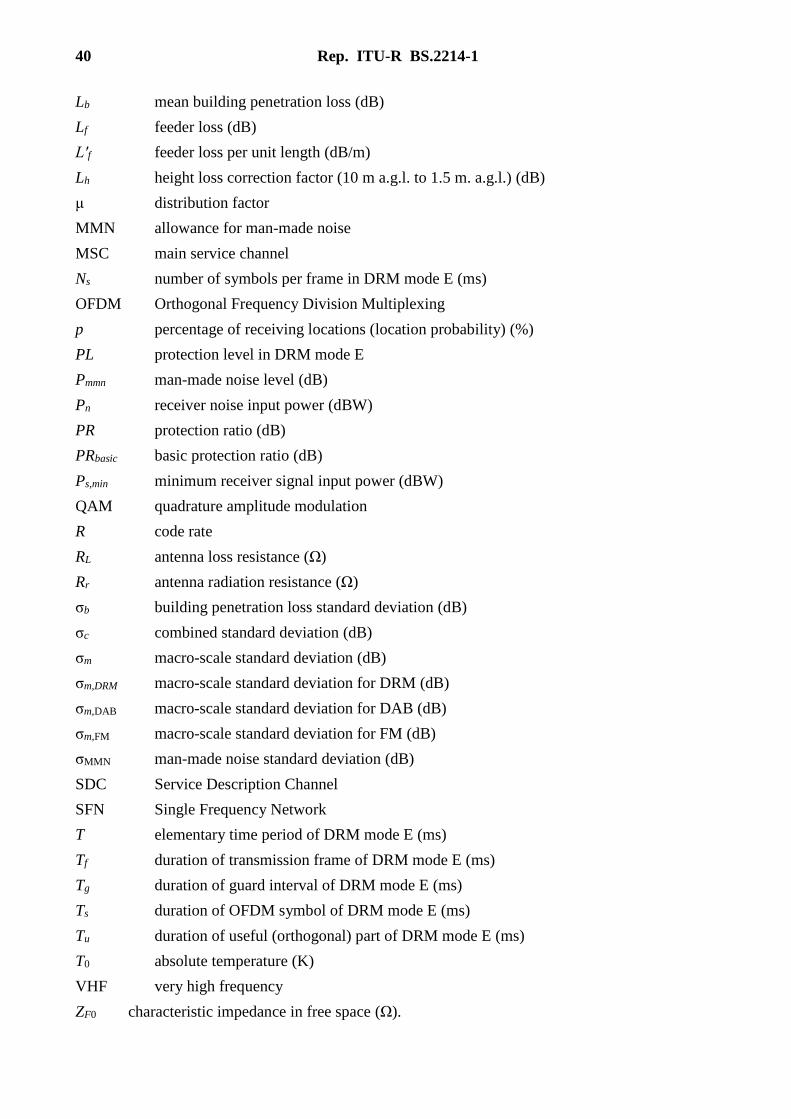
40 Rep. ITU-R BS.2214-1
Lb mean building penetration loss (dB)
Lf feeder loss (dB)
L′f feeder loss per unit length (dB/m)
Lh height loss correction factor (10 m a.g.l. to 1.5 m. a.g.l.) (dB)
μ distribution factor
MMN allowance for man-made noise
MSC main service channel
Ns number of symbols per frame in DRM mode E (ms)
OFDM Orthogonal Frequency Division Multiplexing
p percentage of receiving locations (location probability) (%)
PL protection level in DRM mode E
Pmmn man-made noise level (dB)
Pn receiver noise input power (dBW)
PR protection ratio (dB)
PRbasic basic protection ratio (dB)
Ps,min minimum receiver signal input power (dBW)
QAM quadrature amplitude modulation
R code rate
RL antenna loss resistance (Ω)
Rr antenna radiation resistance (Ω)
σb building penetration loss standard deviation (dB)
σc combined standard deviation (dB)
σm macro-scale standard deviation (dB)
σm,DRM macro-scale standard deviation for DRM (dB)
σm,DAB macro-scale standard deviation for DAB (dB)
σm,FM macro-scale standard deviation for FM (dB)
σMMN man-made noise standard deviation (dB)
SDC Service Description Channel
SFN Single Frequency Network
T elementary time period of DRM mode E (ms)
Tf duration of transmission frame of DRM mode E (ms)
Tg duration of guard interval of DRM mode E (ms)
Ts duration of OFDM symbol of DRM mode E (ms)
Tu duration of useful (orthogonal) part of DRM mode E (ms)
T0 absolute temperature (K)
VHF very high frequency
ZF0 characteristic impedance in free space (Ω).

Rep. ITU-R BS.2214-1 41
2 References
[1] ETSI EN 201 980; Digital Radio Mondiale (DRM); System Specification.
[2] GE06 – Final Acts of the Regional Radiocommunication Conference for planning of the digital
terrestrial broadcasting service in parts of Regions 1 and 3, in the frequency bands 174-230 MHz and
470-862 MHz (RRC-06) Annex 3: Technical basis and characteristics.
[3] EBU-TECH 3317 [July, 2007] Planning parameters for hand held reception concerning the use of
DVB-H and T-DMB in Bands III, IV, V and the 1.5 GHz band.
[4] ETSI TR 101 190; Digital Video Broadcasting (DVB); Implementation guidelines for DVB terrestrial
services; Transmission aspects.
[5] GE84 – Final Acts of the Regional Administrative Conference for the Planning of VHF Sound
Broadcasting (Region 1 and Part of Region 3); Geneva 1984.
[6] ECC Working Group Frequency Management Project Team FM PT45, Digital Broadcasting Issues;
Initial first draft for a supplement to the ECC report 141 on future possibilities for the digitalisation
of Band II; Technical Elements and Parameters for Digital Terrestrial Broadcasting in Band II.
[7] ETSI EN 302 018-2; Electromagnetic compatibility and Radio spectrum Matters (ERM);
Transmitting equipment for the Frequency Modulated (FM) sound broadcasting service.
[8] Documentation G531/00328/07 [September, 2007] Compatibility Measurements DRM120, DRM
and HD Radio interfering with FM Broadcast, Narrowband FM (BOS) and Aeronautical
Radionavigation, German Network Agency and University of Applied Science of Kaiserslautern.
[9] KRAUS, J.D. [December, 2001] Antennas, Mc Graw Hill College; 3rd revised edition.
Recommendations and Reports ITU-R
Recommendation ITU-R BS.412-9, Planning standards for terrestrial FM sound broadcasting at VHF.
Recommendation ITU-R BS.599, Directivity of antennas for the reception of sound broadcasting in
band 8 (VHF).
Recommendation ITU-R BS.641, Determination of radio-frequency protection ratios for frequency-modulated
sound broadcasting.
Recommendation ITU-R BS.1660-3, Technical basis for planning of terrestrial digital sound broadcasting in
the VHF band.
Recommendation ITU-R BT.1368-8, Planning criteria for digital terrestrial television services in the
VHF/UHF bands.
Recommendation ITU-R P.372-8, Radio Noise.
Recommendation ITU-R P.1546-4, Method for point-to-area predictions for terrestrial services in the
frequency range 30 MHz to 3 000 MHz.
Recommendation ITU-R SM.328-11, Spectra and bandwidth of emissions.
Report ITU-R BS.945-2, Methods for the assessment of multiple interference.
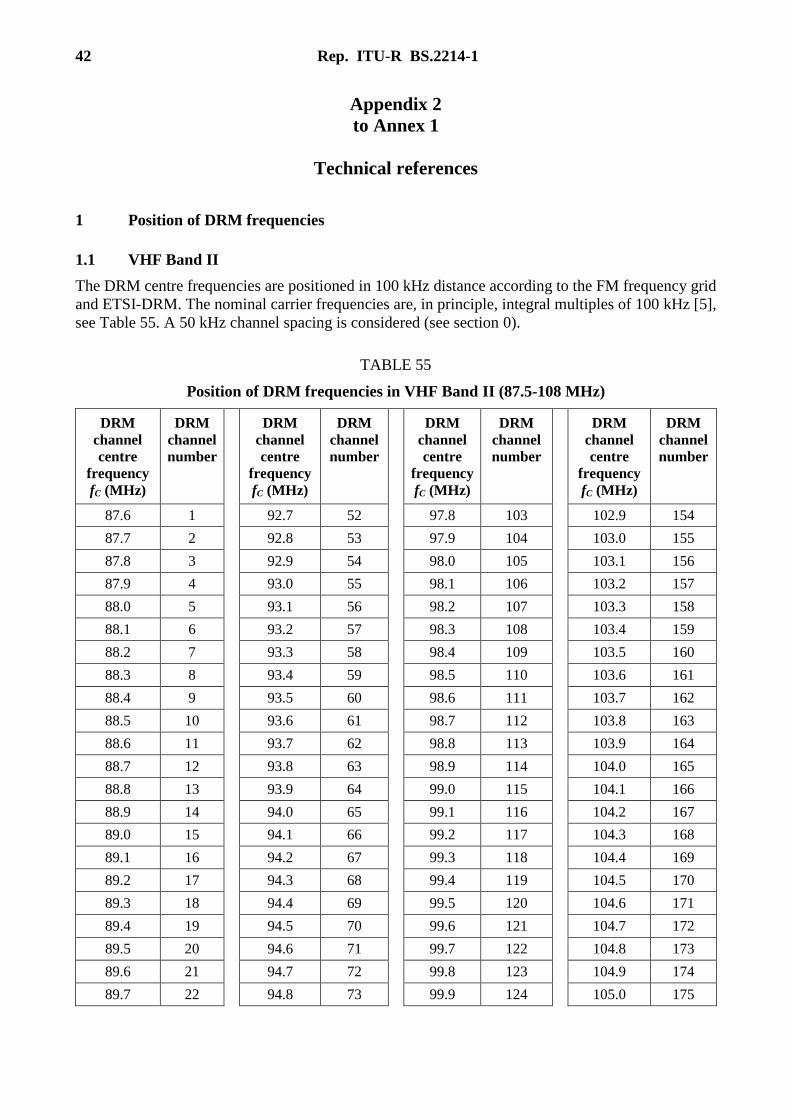
42 Rep. ITU-R BS.2214-1
Appendix 2
to Annex 1
Technical references
1 Position of DRM frequencies
1.1 VHF Band II
The DRM centre frequencies are positioned in 100 kHz distance according to the FM frequency grid
and ETSI-DRM. The nominal carrier frequencies are, in principle, integral multiples of 100 kHz [5],
see Table 55. A 50 kHz channel spacing is considered (see section 0).
TABLE 55
Position of DRM frequencies in VHF Band II (87.5-108 MHz)
DRM
channel
centre
frequency
fC (MHz)
DRM
channel
number
DRM
channel
centre
frequency
fC (MHz)
DRM
channel
number
DRM
channel
centre
frequency
fC (MHz)
DRM
channel
number
DRM
channel
centre
frequency
fC (MHz)
DRM
channel
number
87.6 1 92.7 52 97.8 103 102.9 154
87.7 2 92.8 53 97.9 104 103.0 155
87.8 3 92.9 54 98.0 105 103.1 156
87.9 4 93.0 55 98.1 106 103.2 157
88.0 5 93.1 56 98.2 107 103.3 158
88.1 6 93.2 57 98.3 108 103.4 159
88.2 7 93.3 58 98.4 109 103.5 160
88.3 8 93.4 59 98.5 110 103.6 161
88.4 9 93.5 60 98.6 111 103.7 162
88.5 10 93.6 61 98.7 112 103.8 163
88.6 11 93.7 62 98.8 113 103.9 164
88.7 12 93.8 63 98.9 114 104.0 165
88.8 13 93.9 64 99.0 115 104.1 166
88.9 14 94.0 65 99.1 116 104.2 167
89.0 15 94.1 66 99.2 117 104.3 168
89.1 16 94.2 67 99.3 118 104.4 169
89.2 17 94.3 68 99.4 119 104.5 170
89.3 18 94.4 69 99.5 120 104.6 171
89.4 19 94.5 70 99.6 121 104.7 172
89.5 20 94.6 71 99.7 122 104.8 173
89.6 21 94.7 72 99.8 123 104.9 174
89.7 22 94.8 73 99.9 124 105.0 175

Rep. ITU-R BS.2214-1 43
TABLE 55 (end)
DRM
channel
centre
frequency
fC (MHz)
DRM
channel
number
DRM
channel
centre
frequency
fC (MHz)
DRM
channel
number
DRM
channel
centre
frequency
fC (MHz)
DRM
channel
number
DRM
channel
centre
frequency
fC (MHz)
DRM
channel
number
89.8 23 94.9 74 100.0 125 105.1 176
89.9 24 95.0 75 100.1 126 105.2 177
90.0 25 95.1 76 100.2 127 105.3 178
90.1 26 95.2 77 100.3 128 105.4 179
90.2 27 95.3 78 100.4 129 105.5 180
90.3 28 95.4 79 100.5 130 105.6 181
90.4 29 95.5 80 100.6 131 105.7 182
90.5 30 95.6 81 100.7 132 105.8 183
90.6 31 95.7 82 100.8 133 105.9 184
90.7 32 95.8 83 100.9 134 106.0 185
90.8 33 95.9 84 101.0 135 106.1 186
90.9 34 96.0 85 101.1 136 106.2 187
91.0 35 96.1 86 101.2 137 106.3 188
91.1 36 96.2 87 101.3 138 106.4 189
91.2 37 96.3 88 101.4 139 106.5 190
91.3 38 96.4 89 101.5 140 106.6 191
91.4 39 96.5 90 101.6 141 106.7 192
91.5 40 96.6 91 101.7 142 106.8 193
91.6 41 96.7 92 101.8 143 106.9 194
91.7 42 96.8 93 101.9 144 107.0 195
91.8 43 96.9 94 102.0 145 107.1 196
91.9 44 97.0 95 102.1 146 107.2 197
92.0 45 97.1 96 102.2 147 107.3 198
92.1 46 97.2 97 102.3 148 107.4 199
92.2 47 97.3 98 102.4 149 107.5 200
92.3 48 97.4 99 102.5 150 107.6 201
92.4 49 97.5 100 102.6 151 107.7 202
92.5 50 97.6 101 102.7 152 107.8 203
92.6 51 97.7 102 102.8 153 107.9 204
1.2 VHF Band III
The frequency band of a DAB block has a bandwidth of 1.536 MHz with lower and upper guard
channels to fit into the 7 MHz channels of VHF Band III. The DRM centre frequencies are positioned
in 100 kHz distance beginning by 174.05 MHz and integral multiples of 100 kHz up to 229.95 MHz,
see Table 56.

44 Rep. ITU-R BS.2214-1
The nomenclature of the DRM channel identifier is given by:
(No. of the VHF channel) – (No. of the DRM channel suffix in the VHF channel),
e.g. for the first DRM channel in this table is the identifier “5-1”.
TABLE 56
Position of DRM frequencies in VHF Band III (174-230 MHz)
DRM
channel
suffix
DRM channel centre frequency fC (MHz) in VHF channel (number)
5 6 7 8 9 10 11 12
1 174.050 181.050 188.050 195.050 202.050 209.050 216.050 223.050
2 174.150 181.150 188.150 195.150 202.150 209.150 216.150 223.150
3 174.250 181.250 188.250 195.250 202.250 209.250 216.250 223.250
4 174.350 181.350 188.350 195.350 202.350 209.350 216.350 223.350
5 174.450 181.450 188.450 195.450 202.450 209.450 216.450 223.450
6 174.550 181.550 188.550 195.550 202.550 209.550 216.550 223.550
7 174.650 181.650 188.650 195.650 202.650 209.650 216.650 223.650
8 174.750 181.750 188.750 195.750 202.750 209.750 216.750 223.750
9 174.850 181.850 188.850 195.850 202.850 209.850 216.850 223.850
10 174.950 181.950 188.950 195.950 202.950 209.950 216.950 223.950
11 175.050 182.050 189.050 196.050 203.050 210.050 217.050 224.050
12 175.150 182.150 189.150 196.150 203.150 210.150 217.150 224.150
13 175.250 182.250 189.250 196.250 203.250 210.250 217.250 224.250
14 175.350 182.350 189.350 196.350 203.350 210.350 217.350 224.350
15 175.450 182.450 189.450 196.450 203.450 210.450 217.450 224.450
16 175.550 182.550 189.550 196.550 203.550 210.550 217.550 224.550
17 175.650 182.650 189.650 196.650 203.650 210.650 217.650 224.650
18 175.750 182.750 189.750 196.750 203.750 210.750 217.750 224.750
19 175.850 182.850 189.850 196.850 203.850 210.850 217.850 224.850
20 175.950 182.950 189.950 196.950 203.950 210.950 217.950 224.950
21 176.050 183.050 190.050 197.050 204.050 211.050 218.050 225.050
22 176.150 183.150 190.150 197.150 204.150 211.150 218.150 225.150
23 176.250 183.250 190.250 197.250 204.250 211.250 218.250 225.250
24 176.350 183.350 190.350 197.350 204.350 211.350 218.350 225.350
25 176.450 183.450 190.450 197.450 204.450 211.450 218.450 225.450
26 176.550 183.550 190.550 197.550 204.550 211.550 218.550 225.550
27 176.650 183.650 190.650 197.650 204.650 211.650 218.650 225.650
28 176.750 183.750 190.750 197.750 204.750 211.750 218.750 225.750
29 176.850 183.850 190.850 197.850 204.850 211.850 218.850 225.850
30 176.950 183.950 190.950 197.950 204.950 211.950 218.950 225.950
31 177.050 184.050 191.050 198.050 205.050 212.050 219.050 226.050
32 177.150 184.150 191.150 198.150 205.150 212.150 219.150 226.150
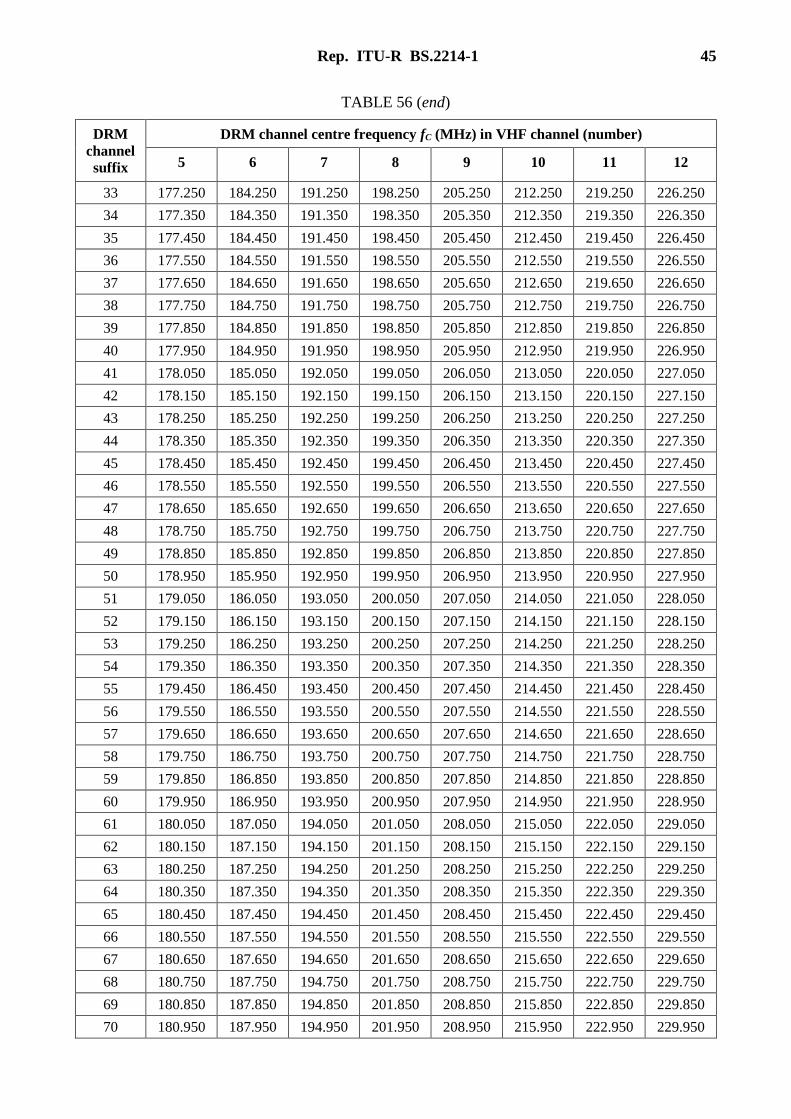
Rep. ITU-R BS.2214-1 45
TABLE 56 (end)
DRM
channel
suffix
DRM channel centre frequency fC (MHz) in VHF channel (number)
5 6 7 8 9 10 11 12
33 177.250 184.250 191.250 198.250 205.250 212.250 219.250 226.250
34 177.350 184.350 191.350 198.350 205.350 212.350 219.350 226.350
35 177.450 184.450 191.450 198.450 205.450 212.450 219.450 226.450
36 177.550 184.550 191.550 198.550 205.550 212.550 219.550 226.550
37 177.650 184.650 191.650 198.650 205.650 212.650 219.650 226.650
38 177.750 184.750 191.750 198.750 205.750 212.750 219.750 226.750
39 177.850 184.850 191.850 198.850 205.850 212.850 219.850 226.850
40 177.950 184.950 191.950 198.950 205.950 212.950 219.950 226.950
41 178.050 185.050 192.050 199.050 206.050 213.050 220.050 227.050
42 178.150 185.150 192.150 199.150 206.150 213.150 220.150 227.150
43 178.250 185.250 192.250 199.250 206.250 213.250 220.250 227.250
44 178.350 185.350 192.350 199.350 206.350 213.350 220.350 227.350
45 178.450 185.450 192.450 199.450 206.450 213.450 220.450 227.450
46 178.550 185.550 192.550 199.550 206.550 213.550 220.550 227.550
47 178.650 185.650 192.650 199.650 206.650 213.650 220.650 227.650
48 178.750 185.750 192.750 199.750 206.750 213.750 220.750 227.750
49 178.850 185.850 192.850 199.850 206.850 213.850 220.850 227.850
50 178.950 185.950 192.950 199.950 206.950 213.950 220.950 227.950
51 179.050 186.050 193.050 200.050 207.050 214.050 221.050 228.050
52 179.150 186.150 193.150 200.150 207.150 214.150 221.150 228.150
53 179.250 186.250 193.250 200.250 207.250 214.250 221.250 228.250
54 179.350 186.350 193.350 200.350 207.350 214.350 221.350 228.350
55 179.450 186.450 193.450 200.450 207.450 214.450 221.450 228.450
56 179.550 186.550 193.550 200.550 207.550 214.550 221.550 228.550
57 179.650 186.650 193.650 200.650 207.650 214.650 221.650 228.650
58 179.750 186.750 193.750 200.750 207.750 214.750 221.750 228.750
59 179.850 186.850 193.850 200.850 207.850 214.850 221.850 228.850
60 179.950 186.950 193.950 200.950 207.950 214.950 221.950 228.950
61 180.050 187.050 194.050 201.050 208.050 215.050 222.050 229.050
62 180.150 187.150 194.150 201.150 208.150 215.150 222.150 229.150
63 180.250 187.250 194.250 201.250 208.250 215.250 222.250 229.250
64 180.350 187.350 194.350 201.350 208.350 215.350 222.350 229.350
65 180.450 187.450 194.450 201.450 208.450 215.450 222.450 229.450
66 180.550 187.550 194.550 201.550 208.550 215.550 222.550 229.550
67 180.650 187.650 194.650 201.650 208.650 215.650 222.650 229.650
68 180.750 187.750 194.750 201.750 208.750 215.750 222.750 229.750
69 180.850 187.850 194.850 201.850 208.850 215.850 222.850 229.850
70 180.950 187.950 194.950 201.950 208.950 215.950 222.950 229.950

46 Rep. ITU-R BS.2214-1
2 Computations of correction factors
2.1 Computation of the antenna gain for portable handheld reception
The antenna (linear) gain g is the product of directivity d and efficiency η [9].
dg (28)
For lossless antennas the efficiency equals one and the gain equals the directivity.
Portable handheld reception antennas are very lossy, and therefore the gain is much lower than
directivity. They are also short linear antennas, with small dimensions compared to wavelength, and
have a constant directivity of about 1.5 (1.8 dBi or –0.4 dBd). The gain changes with frequency only
due to efficiency.
To estimate the efficiency change with frequency a transmitting antenna is considered. That leads to
the values for a receiving antenna also, because antennas are reciprocal; their directivity, efficiency
and gain are the same as receiving or transmitting antenna [9].
To transfer the maximum energy from a port to an antenna or vice versa the antenna has to be matched
to the port impedance. A matched antenna has an equivalent series circuit with radiation resistance
Rr, antenna loss resistance and a matching circuit loss resistance. We consider the reactive part of the
serial impedance as zero. The radiation resistance is small and the transmitted energy is dissipated
mostly in the antenna loss resistance and the matching circuit. Only the energy in Rr is radiated.
Combining all losses in RL the antenna efficiency:
L
r
Lr
r
R
R
RR
R
(29)
Rr can be neglected in the denominator, because Rr is much lower than RL.
For the antenna length l << λ the radiation resistance magnitude is proportional to the square of the
antenna length l relative to wavelength λ [KRAUS, 2001]:
22
flkl
kRr (30)
where λ was substituted by c/f, with c the light velocity.
If the antenna dimension is not changed, and it is considered that the losses in the antenna and the
matching circuit does not change significantly in the frequency range of interest, the efficiency η2 at
a frequency f2, compared to the efficiency η1 at a frequency f1, changes as follows:
1
2
2
1
2
1
2
G
G
f
f
(31)
The same is true for the gain G (dB), since the directivity does not change.

Rep. ITU-R BS.2214-1 47
Changing the frequency from f1 to f2 the gain changes with:
)dB(log201
210
f
fG (32)
2.2 Computation of man-made noise allowance from the antenna noise factor
Definition of the antenna noise factor
An antenna for terrestrial communications with efficiency one receives from its environment, no
matter what shape its receiving diagram has, thermal noise with a power n:
kTBn
where:
k : Boltzmann’s constant (J/K)
T : environment temperature (K)
B : bandwidth (Hz).
If the antenna receives in the same bandwidth B Gaussian noise like man-made noise with a power i,
the total power received is:
inpa
We can define an antenna noise factor fa as:
n
i
n
in
n
pf aa
1
and an antenna noise figure Fa given in dB [9]:
)(log10 10 aa fF
The man-made noise allowance for coverage calculations
In a link budget used for coverage calculations, the receiver is taken into account by its noise figure
Fr. It can be shown, that the effect of the man-made noise i received by the antenna is equivalent to
an increase of the receiver noise figure Fr by an amount MMN in dB, called man-made noise
allowance.
If the antenna does not receive man-made noise, the total equivalent noise at a receiver input is:
npp r
with:
p : power sum (W)
pr : receiver noise corresponding to the noise figure and the bandwidth (W)
n : thermal noise (kTB) (W)
fr : receiver noise factor calculated from the noise figure
1010
rF
rf
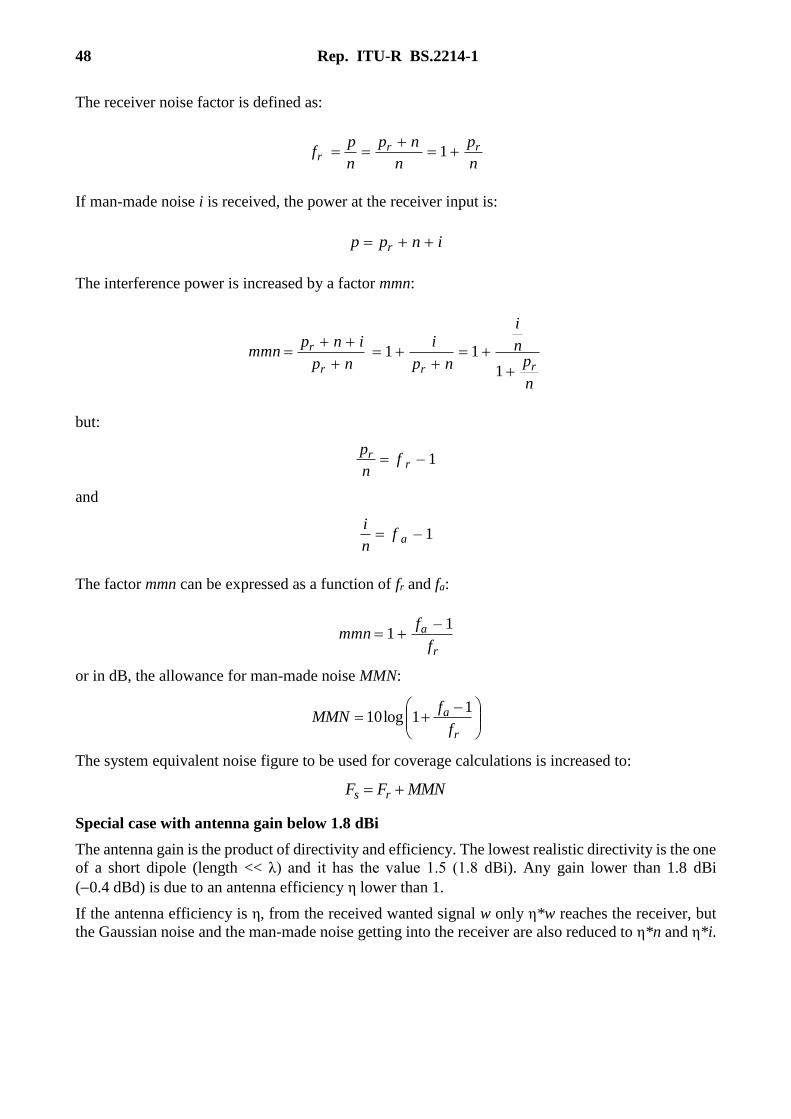
48 Rep. ITU-R BS.2214-1
The receiver noise factor is defined as:
n
p
n
np
n
pf rrr
1
If man-made noise i is received, the power at the receiver input is:
inpp r
The interference power is increased by a factor mmn:
n
pn
i
np
i
np
inpmmn
rrr
r
1
11
but:
1–rr f
n
p
and
1–afn
i
The factor mmn can be expressed as a function of fr and fa:
r
a
f
fmmn
1–1
or in dB, the allowance for man-made noise MMN:
r
a
f
fMMN
11log10
The system equivalent noise figure to be used for coverage calculations is increased to:
MMNFF rs
Special case with antenna gain below 1.8 dBi
The antenna gain is the product of directivity and efficiency. The lowest realistic directivity is the one
of a short dipole (length << λ) and it has the value 1.5 (1.8 dBi). Any gain lower than 1.8 dBi
(0.4 dBd) is due to an antenna efficiency η lower than 1.
If the antenna efficiency is η, from the received wanted signal w only η*w reaches the receiver, but
the Gaussian noise and the man-made noise getting into the receiver are also reduced to η*n and η*i.

Rep. ITU-R BS.2214-1 49
The interference power at the receiver input is increased due to man-made noise interference i by the
factor mmn:
n
pn
npnp
npmmn
r
i
r
i
r
ir
1
11
r
a
f
fMMN
11log10
The efficiency η can be calculated from the antenna gain GD, for gains lower than −0.4 dBd:
10
4.0
10
DG
Annex 2
Planning parameters for digital terrestrial broadcasting
system RAVIS in VHF Bands I and II
1 Reception modes
Three different basic reception modes can be distinguished, fixed, portable and mobile, with four
subdivisions in the portable reception mode.
1.1 Fixed reception
Fixed reception (FX) is defined as reception where a receiving antenna mounted at roof level is used.
In calculating the field-strength levels for fixed antenna reception, a receiving antenna height of 10 m
above ground level is assumed. A location probability of 70% is assumed to obtain a good reception
situation.
1.2 Portable reception
In general, portable reception means a reception where a portable receiver with an attached or built-
in antenna is used outdoors or indoors at no less than 1.5 m above ground level. A location probability
of 95% is assumed to obtain a good reception situation.
Two receiving locations will be distinguished:
– Indoor reception with a reception place in a building;
– Outdoor reception with a reception place outside a building.
Within these receiving locations two opposed receiving conditions will be distinguished additionally
due to the great variability of portable reception situations with different receiver-/antenna-types and
also different reception conditions:
– Portable reception: This situation models the reception situation with good reception
conditions for both indoor and outdoor situations and a receiver with an omnidirectional VHF
antenna pattern. A suburban area is assumed in this case.
50 Rep. ITU-R BS.2214-1
– Portable handheld reception: This situation models the reception situation under difficult
conditions using a receiver with an external ad hoc antenna (e.g. wire to an earpiece). An
urban area is assumed in this case.
1.2.1 Portable outdoor reception
Portable outdoor (PO) reception is defined as reception by a portable receiver with battery supply and
an attached or built-in antenna. The receiving antenna height is assumed to be 1.5 m above ground
level.
1.2.2 Portable indoor reception
Portable indoor (PI) reception is defined by a portable receiver with stationary power supply and a
build-in (folded) antenna or with a plug for an external antenna. The receiver is used indoors at no
less than 1.5 m above floor level in rooms on the ground floor and with a window in an external wall.
It is assumed that optimal receiving conditions will be found by moving the antenna up to 0.5 m in
any direction and the portable receiver is not moved during reception and large objects near the
receiver are also not moved.
1.2.3 Portable handheld indoor and outdoor reception (PI-H, PO-H)
These portable reception modes are defined as reception by a portable handheld receiver with battery
supply and an external antenna as given in EBU-TECH 3317 [1] for both reception situations indoor
and outdoor, respectively.
1.3 Mobile reception
Mobile reception (MO) is defined as reception by a receiver in motion also at high speed (up to
300 km/h) with a matched antenna situated at no less than 1.5 m above ground level. In order to
guarantee good reception a location probability of 99% is required.
2 Correction factors for field-strength predictions
Recommendation ITU-R P.1546 – Method for point-to-area predictions for terrestrial services in the
frequency range 30 MHz to 3 000 MHz, forms the basis of a field-strength prediction method
applicable for the broadcasting services amongst other services. Predictions can be made from
30 MHz up to 3 000 MHz within a path distance of 1 to 1 000 km; percentage of time of 1 to 50%;
and for various transmitting antenna heights. The method draws a distinction between paths over land,
cold seas and warm seas, makes due allowance for location variability for land area-service
predictions and takes account of local clutter surrounding the receiving location. It also provides
procedures for handling negative effective transmitting antenna heights and mixed-path propagation
(i.e. with combinations of land and sea).
The wanted field-strength level values predicted with Recommendation ITU-R P.1546 refer always
to the median value at a receiving location with a receiving antenna in 10 m high above ground level.
This antenna height is a generic value, used as stated only in rural or suburban areas, with
constructions or vegetation below 10 m height. Otherwise the wanted field-strength values are
predicted at the average construction or vegetation height at the receiving location. The true receiving
antenna height influences the height loss correction factor.
To take into account different receiving modes and circumstances into network planning correction
factors have to be included to carry the minimum receiver input power level or the minimum field-
strength level over to the median minimum field-strength level for predictions with
Recommendation ITU-R P.1546.

Rep. ITU-R BS.2214-1 51
2.1 Reference frequency
The planning parameters and correction factors for the VHF Bands I and II are calculated for the
reference frequencies given in Table 57.
TABLE 57
Reference frequencies
VHF band I (47-74 MHz) II (87.5-108 MHz)
Reference frequency (MHz) 65 100
2.2 Antenna gain
The antenna gain GD (dBd) references to a half-wave dipole.
2.2.1 Antenna gain for fixed reception
GE84 provides a figure of antenna gain for FM fixed reception (FX) only. For future planning of
digital systems it is recommended that an omnidirectional antenna pattern with a gain of 0 dBd is
used.
2.2.2 Antenna gain for portable reception (PO, PI)
Following the provisions of GE06 an antenna gain of –2.2 dBd for standard portable receiver planning
is assumed.
2.2.3 Antenna gain for portable handheld reception (PO-H, PI-H)
The antenna gain in VHF Bands I and II can be calculated from the antenna gain GD in VHF Band III
(reference frequency 200 MHz) starting from the figures as given by EBU-TECH 3317 [1].
Receiver integrated antenna for Band III: GD = −17 dBd
External antenna (telescopic or wired headsets) in Band III: GD = −13 dBd
Adapted antenna (for mobile reception) in Band III: GD = −2.2 dBd
Antenna gain at another reference frequency can be calculated according the equation:
121012 /log20 fffGfG DD
The antenna gains GD for portable handheld reception modes with an external antenna in VHF
Bands I, II and III are given in Table 58.
TABLE 58
Antenna gain for portable handheld reception
Frequency (MHz) 65 100 200
Antenna gain GD for external
antenna (dBd) –22.76 –19.02 −13

52 Rep. ITU-R BS.2214-1
2.2.4 Antenna gain for mobile reception
Following the provisions of GE06 an antenna gain of −2.2 dBd for mobile receiver planning is
assumed.
2.3 Feeder loss
The feeder loss Lf expresses the signal attenuation from the receiving antenna to the receiver’s RF
input. The same calculation methodology as in GE06 is proposed. The feeder loss Lf for fixed
reception at 200 MHz is given in with 2 dB for 10 m cable length. The cable attenuation Lf depending
on frequency f and cable length l is given by the following equation:
1(MHz)200
MHz)(
(m) 10
)dB(2/dB
fmL f
The proposed cable length l for the different reception modes and the respective feeder losses Lf for
the different reference frequencies and reception modes are given in Table 59.
TABLE 59
Feeder loss Lf for different reception modes
Reception mode
FX PO, PI, PO-H, PI-H MO
Cable length l (m) 10 0 2
Feeder loss Lf at 65 MHz (dB) 1.14 0.0 0.23
Feeder loss Lf at 100 MHz (dB) 1.4 0.0 0.28
Feeder loss Lf at 200 MHz (dB) 2.0 0.0 0.4
2.4 Height loss correction factor
For portable reception a receiving antenna height of 1.5 m above ground level (outdoor and mobile)
or above floor level (indoor) is assumed. The propagation prediction method usually provides
field-strength values at 10 m. To correct the predicted value from 10 m to 1.5 m above ground level
a height loss factor Lh (dB) has to be applied. Height loss can be calculated using
Recommendation ITU-R P.1546. The height loss correction factor Lh for all reception modes is given
in Table 60.
TABLE 60
Height loss correction factor Lh for different reception modes
Frequency (MHz) 65 100 200
Height loss correction factor Lh FX (dB) 0.0 0.0 0.0
PO, PO-H, PI, PI-H, MO (dB) 8.0 10.0 12.0

Rep. ITU-R BS.2214-1 53
2.5 Building penetration loss
The ratio between the mean field strength inside a building at a given height above ground level and
the mean field strength outside the same building at the same height above ground level expressed in
(dB) is the mean building penetration loss. The mean building penetration loss Lb in VHF Band III is
given in EBU-TECH 3317 [1] as 9 dB, which is proposed to be used for VHF Bands I and II, too.
The standard deviation of the building penetration loss σb is always given by 3 dB.
2.6 Allowance for man-made noise
2.6.1 Allowance for man-made noise for fixed, portable and mobile reception
The allowance for man-made noise (MMN) (dB), takes into account the effect of the man-made noise
received by the antenna on the system performance.
The allowance for man-made noise is calculated from an antenna noise factor fa, which takes into
account the man-made noise received by the antenna:
)dB(1–
1log10)dB( 10
r
a
f
fMMN
where fr is the receiver noise factor, 1010
rF
rf , and fa is the antenna noise factor, 1010
aF
rf , Fr (dB) is
the receiver noise figure, Fa (dB) is the antenna noise figure.
The definition of the antenna noise figure and its mean values Fa,med measured in rural, suburban and
urban regions as a function of the frequency are given in Recommendation ITU-R P.372 – Radio
noise. The equation to calculate the antenna noise figure in suburban (residential) regions is given in
Recommendation ITU-R P.372:
)dB(MHzlog7.27–5.72 10, fF meda
Changing the frequency from f1 to f2, the antenna noise figure changes with:
)dB(MHz
MHzlog7.27dB–dBdB
2
11012
f
fFFF aaa
In GE06, MMN at 200 MHz is considered to be 2 dB and the receiver noise figure Fr is given as 7 dB
for T-DAB radios. Herewith the antenna noise factor Fa at 200 MHz can be calculated by 5.92 dB as
reference value. This is basis to deduce MMN for different frequencies and fixed, portable, and
mobile reception as given in Table 61.
TABLE 61
Man-made noise allowance (MMN) for fixed, portable and mobile reception
Frequency (MHz) 65 100 200
Receiver noise figure Fr (dB) 7 7 7
Antenna noise figure Fa (dB) 19.44 14.26 5.92
MMN (dB) 12.63 7.87 1.99

54 Rep. ITU-R BS.2214-1
2.6.2 Allowance for man-made noise for portable handheld reception
The antenna gain is the product of directivity and efficiency. The lowest realistic directivity is the one
of a short dipole (length l << λ) and it has the value –0.4 dBd. Any gain lower than –0.4 dBd is due
to an antenna efficiency η lower than 1. The interference power at the receiver input is reduced
accordingly and the MMN equation is:
dB1log10dB1–
10
r
a
f
fMMN
The efficiency η can be calculated from the antenna gain GD, for gains lower than –0.4 dBd:
10
4.0
10
dG
Because the efficiency of the antenna for portable handheld reception is very low (< 0.01), it is
possible to neglect the allowance for man-made noise in the case of portable handheld reception
(MMN = 0 dB).
2.7 Implementation loss factor
Implementation loss of the non-ideal receiver is considered in the calculation of the minimum receiver
input power level with an additional implementation loss factor Li of 3 dB. This value takes into
account the characteristics of today’s receivers.
2.8 Location correction factor
The random variation of the received signal field strength with location due to terrain irregularities
and the effect of obstacles in the near vicinity of the receiver location is modelled by a statistical
distribution (typically log normal) over a specified macro-scale area (typically a square with an edge
length of 100 m to 500 m). Field-strength predictions according to ITU-R are usually provided for
50% of time and 50% of locations. In order to derive the field-strength value that is exceeded with a
higher location probability a location correction factor is applied as given in equation:
dBV/mdBV/mdB pCEpE lmed
where Cl (p) is the location correction factor, Emed (dB(V/m)) is the field-strength value for 50% of
locations and 50% of time.
The location correction factor depends on the standard deviation σ of the signal and the so-called
distribution factor (p):
)(dB ppCl
The values for the standard deviation can be calculated by applying the following expression [2]:
MHzlog3.1dBdB 10 fK
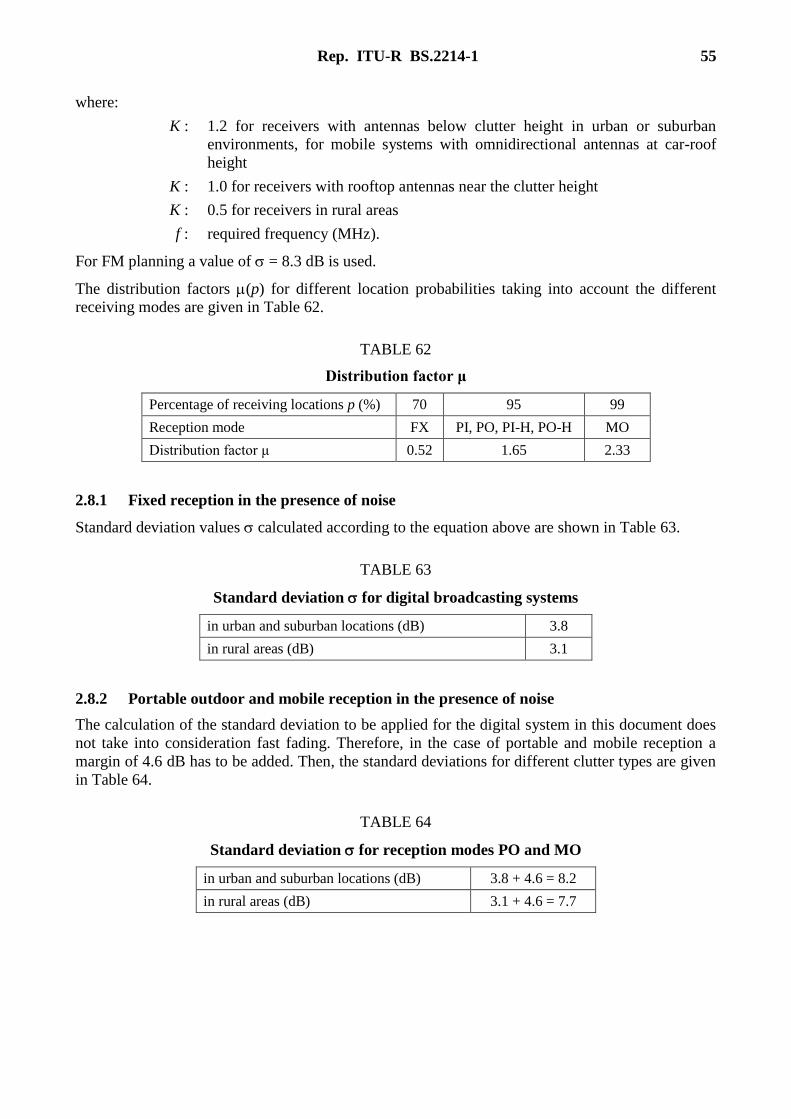
Rep. ITU-R BS.2214-1 55
where:
K : 1.2 for receivers with antennas below clutter height in urban or suburban
environments, for mobile systems with omnidirectional antennas at car-roof
height
K : 1.0 for receivers with rooftop antennas near the clutter height
K : 0.5 for receivers in rural areas
f : required frequency (MHz).
For FM planning a value of = 8.3 dB is used.
The distribution factors (p) for different location probabilities taking into account the different
receiving modes are given in Table 62.
TABLE 62
Distribution factor μ
Percentage of receiving locations p (%) 70 95 99
Reception mode FX PI, PO, PI-H, PO-H MO
Distribution factor μ 0.52 1.65 2.33
2.8.1 Fixed reception in the presence of noise
Standard deviation values calculated according to the equation above are shown in Table 63.
TABLE 63
Standard deviation for digital broadcasting systems
in urban and suburban locations (dB) 3.8
in rural areas (dB) 3.1
2.8.2 Portable outdoor and mobile reception in the presence of noise
The calculation of the standard deviation to be applied for the digital system in this document does
not take into consideration fast fading. Therefore, in the case of portable and mobile reception a
margin of 4.6 dB has to be added. Then, the standard deviations for different clutter types are given
in Table 64.
TABLE 64
Standard deviation for reception modes PO and MO
in urban and suburban locations (dB) 3.8 + 4.6 = 8.2
in rural areas (dB) 3.1 + 4.6 = 7.7

56 Rep. ITU-R BS.2214-1
2.8.3 Portable indoor reception in the presence of noise
In case of portable indoor reception the statistics of building penetration has to be considered, too. It
is assumed that the field strength and the building penetration are statistically independent variables,
both following a log-normal distribution. Their standard deviations are called and b, respectively.
Hence, a combined standard deviation c results which can be calculated according to:
22dB bc
3 Calculation of minimum median field-strength level
According to [4] the following steps have to be followed in order to calculate the minimum median
field strength:
Step 1: Determine the receiver noise input power level Pn:
Τ010 dBWlog10dBdBW BkTFpn
where:
F : receiver noise figure (dB)
k : Boltzmann’s constant, k = 1.38 10−23 (J/K)
T0 : absolute temperature (K)
B : receiver noise bandwidth (Hz).
Step 2: Determine the minimum receiver input power level Ps,min:
dBWdB/dBW nmins,min PNCP
where:
(C/N)min : minimum carrier-to-noise ratio at the decoder input.
Step 3: Determine the minimum power flux-density at receiving place min:
dB)dBm(–dBW)m/dBW( 22fas,minmin LAP
where:
Aa : effective antenna aperture (dBm2)
Lf : feeder loss (dB).
Aa = GD (dBd) + 10 · log(1.64 · λ2/4π)
where:
λ : wavelength (m), λ = 3 m for 100 MHz, λ = 4.62 m for 65 MHz.

Rep. ITU-R BS.2214-1 57
Step 4: Determine the minimum RMS field-strength level at the location of the receiving antenna
Emin:
dB8.145dBW/m
1
1log20dBlog10dBW/mm/VdB 2
100102
minFminminV
VZE
where:
120
0
00FZ – the characteristic impedance in free space.
Setp 5: Determine the minimum median RMS field-strength level Emed :
bhlMMNminmed LLCPEE
4 Minimum field-strength requirements for RAVIS
The system RAVIS is designed for digital broadcasting in VHF Bands I and II. The system is
nationally standardized in the Russian Federation [6]. Main characteristics and features of RAVIS
can be found in Report ITU-R BT.2049-4 – Broadcasting of multimedia and data applications for
mobile reception.
4.1 System parameters of RAVIS
4.1.1 RAVIS signal parameters
RAVIS supports three types of radio channel bandwidth: 100, 200 and 250 kHz.
RAVIS supports three different coding rates for logical channel of main service: 1/2, 2/3 and 3/4.
RAVIS supports three different modulation types for logical channel of main service: QPSK,
16-QAM and 64-QAM.
Rounded bit rates for different combinations of system parameters are given in Table 65.
TABLE 65
Bit rates for RAVIS
Modulation
type Code rate
Bit rate (kbit/s)
100 kHz channel 200 kHz channel 250 kHz channel
QPSK 1/2 80 160 200
2/3 100 210 270
3/4 120 240 300
16-QAM 1/2 150 320 400
2/3 210 420 530
3/4 230 470 600
64-QAM 1/2 230 470 600
2/3 310 630 800
3/4 350 710 900
Main OFDM parameters of RAVIS signal are given in Table 66.

58 Rep. ITU-R BS.2214-1
TABLE 66
OFDM parameters of RAVIS
Channel bandwidth B 100 kHz 200 kHz 250 kHz
Number of curriers 215 439 553
Number of information curriers 196 400 504
Distance between first and last curriers 95.1 kHz 194.7 kHz 245.3 kHz
Carrier spacing 1/Tu 4 000/9 Hz = 444 4/9 Hz
Duration of useful part of symbol Tu 2.25 ms
Duration of guard interval Tg 281.25 ms
Duration of symbol Ts = Tu + Tg 2.53125 ms
Tg/Tu 1/8
Duration of transmission frame Tf 103.8 ms
Number of symbols per frame Ns 41
4.1.2 SFN operation capabilities
RAVIS can operate in single frequency networks (SFN). The maximum transmitter distance that has
to go below to prevent self interferences depends on the length of the OFDM guard interval. The
maximum transmitter distance is calculated through the multiplication of velocity of light
(3 · 105 km/s) by guard interval duration (~0.28 ms for RAVIS). So maximum transmitter distance is
about 84 km.
4.2 RAVIS radio receiver related parameters
4.2.1 Minimum C/N ratio in different channel models
Required (C/N)min for a transmission in VHF Band II to achieve an average coded bit error ratio
BER = 1 10−4 (bit) after the channel decoder for system parameters and different channel models
are given in Tables 67 to 69. Channel models correspond to the models from [5], Annex B.2.
Channel 7 (AWGN) models fixed reception mode, channel 8 (Urban) models portable reception
mode, channel 11 (Hilly terrain) models mobile reception mode.
TABLE 67
(C/N)min for RAVIS with 100 kHz channel bandwidth
Channel model/
reception mode
(C/N)min (dB)
QPSK 16-QAM 64-QAM
R = 1/2 R = 2/3 R = 3/4 R = 1/2 R = 2/3 R = 3/4 R = 1/2 R = 2/3 R = 3/4
Channel 7
(AWGN)/fixed
reception
5.30 6.00 6.60 8.90 10.90 12.10 13.50 15.90 17.30
Channel 8 (urban)/
portable reception 11.30 12.00 12.60 16.40 17.40 18.50 22.50 24.90 26.30
Channel 11 (hilly
terrain)/mobile
reception
9.50 10.20 10.80 13.80 14.80 15.90 19.10 21.50 22.90

Rep. ITU-R BS.2214-1 59
TABLE 68
(C/N)min for RAVIS with 200 kHz channel bandwidth
Channel model/
reception mode
(C/N)min (dB)
QPSK 16-QAM 64-QAM
R = 1/2 R = 2/3 R = 3/4 R = 1/2 R = 2/3 R = 3/4 R = 1/2 R = 2/3 R = 3/4
Channel 7
(AWGN)/fixed
reception
4.90 5.80 6.40 8.70 10.70 11.90 13.30 15.80 17.20
Channel 8 (urban)/
portable reception 11.90 12.80 13.40 17.20 18.20 19.30 23.30 25.80 27.20
Channel 11 (hilly
terrain)/mobile
reception
10.10 11.00 11.60 14.60 15.60 16.70 19.90 22.40 23.80
TABLE 69
(C/N)min for RAVIS with 250 kHz channel bandwidth
Channel model
/reception mode
(C/N)min (dB)
QPSK 16-QAM 64-QAM
R = 1/2 R = 2/3 R = 3/4 R = 1/2 R = 2/3 R = 3/4 R = 1/2 R = 2/3 R = 3/4
Channel 7 (AWGN)
/fixed reception 5.10 5.80 6.40 8.70 10.70 11.90 13.20 15.70 17.20
Channel 8 (urban)
/portable reception 14.10 14.80 15.40 19.20 20.20 21.30 25.20 27.70 29.20
Channel 11 (hilly
terrain)/mobile
reception
12.30 13.00 13.60 16.60 17.60 18.70 21.80 24.30 25.80
4.2.2 Minimum wanted field strength used for planning
The receiver noise figure F = 7 dB is used in GE06 for both DVB-T and T-DAB. Receiver noise
figure F for RAVIS is assumed to be F = 7 dB, too.
Based on the parameters and equations set above, the minimum median field-strength level for
different reception modes and frequency Bands I and II can be calculated for all sets of RAVIS system
parameters, as shown in Tables 70 to 87.

60 Rep. ITU-R BS.2214-1
TABLE 70
Minimum median field-strength level Emed for 100 kHz channel
bandwidth and QPSK modulation in Band I
Reception mode FX PI PI-H PO PO-H MO
Receiver noise figure F (dB) 7.00 7.00 7.00 7.00 7.00 7.00
Receiver noise input
power
Pn (dBW) −146.98 −146.98 −146.98 −146.98 −146.98 −146.98
Minimum C/N ratio (C/N)min
(dB)
R = 1/2 5.30 11.30 11.30 11.30 11.30 9.50
R = 2/3 6.00 12.00 12.00 12.00 12.00 10.20
R = 3/4 6.60 12.60 12.60 12.60 12.60 10.80
Implementation loss Li (dB) 3.00 3.00 3.00 3.00 3.00 3.00
Minimum receiver input
power level
Ps,min (dBW) R = 1/2 −138.68 −132.68 −132.68 −132.68 −132.68 −134.48
R = 2/3 −137.98 −131.98 −131.98 −131.98 −131.98 −133.78
R = 3/4 −137.38 −131.38 −131.38 −131.38 −131.38 −133.18
Antenna gain Gd (dBd) 0.00 −2.20 −22.76 −2.20 −22.76 −2.20
Effective antenna
aperture
Aa (dBm2) 4.44 2.24 −18.32 2.24 −18.32 2.24
Feeder-loss Lf (dB) 1.14 0.00 0.00 0.00 0.00 0.23
Minimum power
flux-density at receiving
place
min
(dBW/m2)
R = 1/2 −141.98 −134.92 −114.36 −134.92 −114.36 −136.49
R = 2/3 −141.28 −134.22 −113.66 −134.22 −113.66 −135.79
R = 3/4 −140.68 −133.62 −113.06 −133.62 −113.06 −135.19
Minimum field-strength
level at receiving antenna
Emin
(dB(µV/m))
R = 1/2 3.82 10.88 31.44 10.88 31.44 9.31
R = 2/3 4.52 11.58 32.14 11.58 32.14 10.01
R = 3/4 5.12 12.18 32.74 12.18 32.74 10.61
Allowance for man-made
noise
PMMN (dB) 12.63 12.63 0.00 12.63 0.00 12.63
Location probability p (%) 70.00 95.00 95.00 95.00 95.00 99.00
Distribution factor 0.52 1.65 1.65 1.65 1.65 2.33
Standard deviation of
field strength (dB) 3.80 3.80 3.80 8.20 8.20 8.20
Standard deviation of
building penetration loss b (dB) 0.00 3.00 3.00 0.00 0.00 0.00
Combined standard
deviation of field
strength
c (dB) 3.80 4.84 4.84 8.20 8.20 8.20
Location correction
factor
Cl (dB) 1.98 7.99 7.99 13.53 13.53 19.11
Antenna height loss Lh (dB) 0.00 8.00 8.00 8.00 8.00 8.00
Building penetration loss Lb (dB) 0.00 9.00 9.00 0.00 0.00 0.00
Minimum median
field-strength level
Emed
(dB(µV/m))
R = 1/2 18.43 48.50 56.43 45.04 52.97 49.05
R = 2/3 19.13 49.20 57.13 45.74 53.67 49.75
R = 3/4 19.73 49.80 57.73 46.34 54.27 50.35

Rep. ITU-R BS.2214-1 61
TABLE 71
Minimum median field-strength level Emed for 100 kHz channel
bandwidth and QPSK modulation in Band II
Reception mode FX PI PI−H PO PO−H MO
Receiver noise figure F (dB) 7.00 7.00 7.00 7.00 7.00 7.00
Receiver noise input
power
Pn (dBW) −146.98 −146.98 −146.98 −146.98 −146.98 −146.98
Minimum C/N ratio (C/N)min
(dB)
R = 1/2 5.30 11.30 11.30 11.30 11.30 9.50
R = 2/3 6.00 12.00 12.00 12.00 12.00 10.20
R = 3/4 6.60 12.60 12.60 12.60 12.60 10.80
Implementation loss Li (dB) 3.00 3.00 3.00 3.00 3.00 3.00
Minimum receiver input
power level
Ps,min (dBW) R = 1/2 −138.68 −132.68 −132.68 −132.68 −132.68 −134.48
R = 2/3 −137.98 −131.98 −131.98 −131.98 −131.98 −133.78
R = 3/4 −137.38 −131.38 −131.38 −131.38 −131.38 −133.18
Antenna gain Gd (dBd) 0.00 −2.20 −19.02 −2.20 −19.02 −2.20
Effective antenna
aperture
Aa (dBm2) 0.70 −1.50 −18.32 −1.50 −18.32 −1.50
Feeder-loss Lf (dB) 1.40 0.00 0.00 0.00 0.00 0.28
Minimum power
flux-density at receiving
place
min
(dBW/m2)
R = 1/2 −137.98 −131.18 −114.36 −131.18 −114.36 −132.70
R = 2/3 −137.28 −130.48 −113.66 −130.48 −113.66 −132.00
R = 3/4 −136.68 −129.88 −113.06 −129.88 −113.06 −131.40
Minimum field-strength
level at receiving
antenna
Emin
(dB(µV/m))
R = 1/2 7.82 14.62 31.44 14.62 31.44 13.10
R = 2/3 8.52 15.32 32.14 15.32 32.14 13.80
R = 3/4 9.12 15.92 32.74 15.92 32.74 14.40
Allowance for
man-made noise
PMMN (dB) 7.87 7.87 0.00 7.87 0.00 7.87
Location probability p (%) 70.00 95.00 95.00 95.00 95.00 99.00
Distribution factor 0.52 1.65 1.65 1.65 1.65 2.33
Standard deviation of
field strength (dB) 3.80 3.80 3.80 8.20 8.20 8.20
Standard deviation of
building penetration loss b (dB) 0.00 3.00 3.00 0.00 0.00 0.00
Combined standard
deviation of field
strength
c (dB) 3.80 4.84 4.84 8.20 8.20 8.20
Location correction
factor
Cl (dB) 1.98 7.99 7.99 13.53 13.53 19.11
Antenna height loss Lh (dB) 0.00 10.00 10.00 10.00 10.00 10.00
Building penetration loss Lb (dB) 0.00 9.00 9.00 0.00 0.00 0.00
Minimum median
field-strength level
Emed
(dB(µV/m))
R = 1/2 17.67 49.48 58.43 46.02 54.97 50.08
R = 2/3 18.37 50.18 59.13 46.72 55.67 50.78
R = 3/4 18.97 50.78 59.73 47.32 56.27 51.38

62 Rep. ITU-R BS.2214-1
TABLE 72
Minimum median field-strength level Emed for 100 kHz channel
bandwidth and 16-QAM modulation in Band I
Reception mode FX PI PI−H PO PO−H MO
Receiver noise figure F (dB) 7.00 7.00 7.00 7.00 7.00 7.00
Receiver noise input
power
Pn (dBW) −146.98 −146.98 −146.98 −146.98 −146.98 −146.98
Minimum C/N ratio (C/N)min (dB) R = 1/2 8.90 16.40 16.40 16.40 16.40 13.80
R = 2/3 10.90 17.40 17.40 17.40 17.40 14.80
R = 3/4 12.10 18.50 18.50 18.50 18.50 15.90
Implementation loss Li (dB) 3.00 3.00 3.00 3.00 3.00 3.00
Minimum receiver input
power level
Ps,min (dBW) R = 1/2 −135.08 −127.58 −127.58 −127.58 −127.58 −130.18
R = 2/3 −133.08 −126.58 −126.58 −126.58 −126.58 −129.18
R = 3/4 −131.88 −125.48 −125.48 −125.48 −125.48 −128.08
Antenna gain Gd (dBd) 0.00 −2.20 −22.76 −2.20 −22.76 −2.20
Effective antenna
aperture
Aa (dBm2) 4.44 2.24 −18.32 2.24 −18.32 2.24
Feeder-loss Lf (dB) 1.14 0.00 0.00 0.00 0.00 0.23
Minimum power
flux-density at receiving
place
min
(dBW/m2)
R = 1/2 −138.38 −129.82 −109.26 −129.82 −109.26 −132.19
R = 2/3 −136.38 −128.82 −108.26 −128.82 −108.26 −131.19
R = 3/4 −135.18 −127.72 −107.16 −127.72 −107.16 −130.09
Minimum field-strength
level at receiving
antenna
Emin
(dB(V/m))
R = 1/2 7.42 15.98 36.54 15.98 36.54 13.61
R = 2/3 9.42 16.98 37.54 16.98 37.54 14.61
R = 3/4 10.62 18.08 38.64 18.08 38.64 15.71
Allowance for man-made
noise
PMMN (dB) 12.63 12.63 0.00 12.63 0.00 12.63
Location probability p (%) 70.00 95.00 95.00 95.00 95.00 99.00
Distribution factor 0.52 1.65 1.65 1.65 1.65 2.33
Standard deviation of
field strength (dB) 3.80 3.80 3.80 8.20 8.20 8.20
Standard deviation of
building penetration loss b (dB) 0.00 3.00 3.00 0.00 0.00 0.00
Combined standard
deviation of field strength c (dB) 3.80 4.84 4.84 8.20 8.20 8.20
Location correction
factor
Cl (dB) 1.98 7.99 7.99 13.53 13.53 19.11
Antenna height loss Lh (dB) 0.00 8.00 8.00 8.00 8.00 8.00
Building penetration loss Lb 0.00 9.00 9.00 0.00 0.00 0.00
Minimum median
field-strength level
Emed
(dB(V/m))
R = 1/2 22.03 53.60 61.53 50.14 58.07 53.35
R = 2/3 24.03 54.60 62.53 51.14 59.07 54.35
R = 3/4 25.23 55.70 63.63 52.24 60.17 55.45
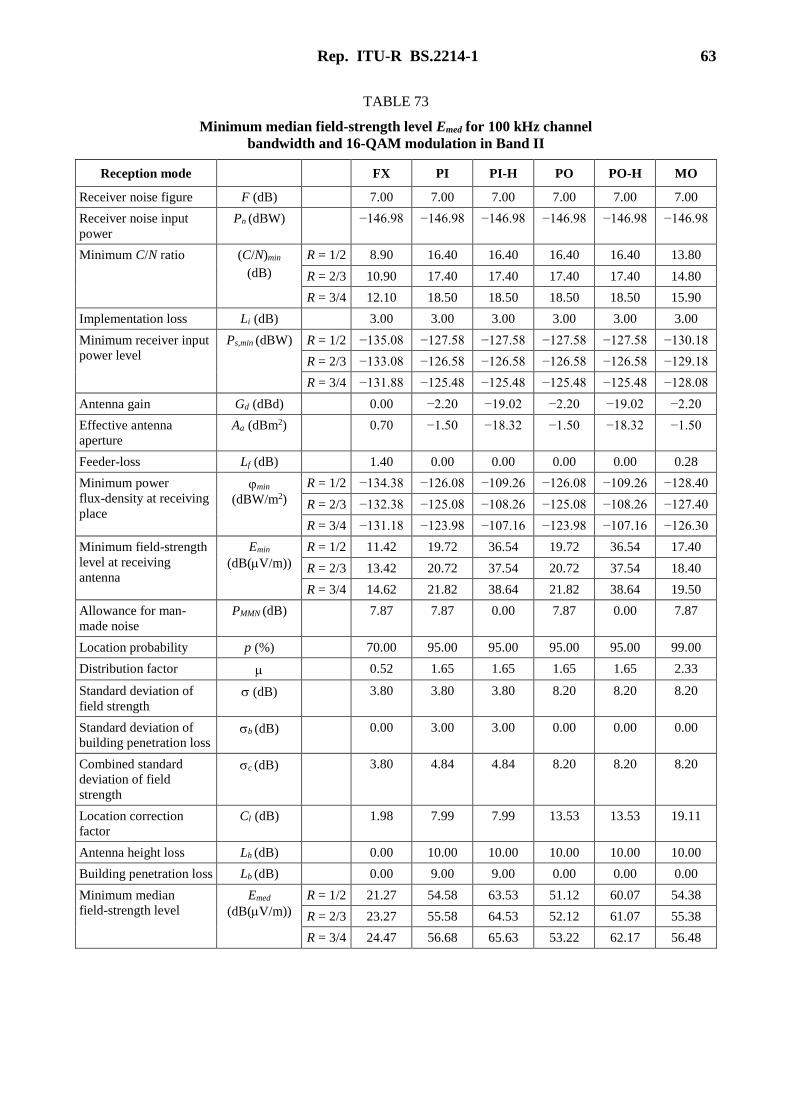
Rep. ITU-R BS.2214-1 63
TABLE 73
Minimum median field-strength level Emed for 100 kHz channel
bandwidth and 16-QAM modulation in Band II
Reception mode FX PI PI-H PO PO-H MO
Receiver noise figure F (dB) 7.00 7.00 7.00 7.00 7.00 7.00
Receiver noise input
power
Pn (dBW) −146.98 −146.98 −146.98 −146.98 −146.98 −146.98
Minimum C/N ratio (C/N)min
(dB)
R = 1/2 8.90 16.40 16.40 16.40 16.40 13.80
R = 2/3 10.90 17.40 17.40 17.40 17.40 14.80
R = 3/4 12.10 18.50 18.50 18.50 18.50 15.90
Implementation loss Li (dB) 3.00 3.00 3.00 3.00 3.00 3.00
Minimum receiver input
power level
Ps,min (dBW) R = 1/2 −135.08 −127.58 −127.58 −127.58 −127.58 −130.18
R = 2/3 −133.08 −126.58 −126.58 −126.58 −126.58 −129.18
R = 3/4 −131.88 −125.48 −125.48 −125.48 −125.48 −128.08
Antenna gain Gd (dBd) 0.00 −2.20 −19.02 −2.20 −19.02 −2.20
Effective antenna
aperture
Aa (dBm2) 0.70 −1.50 −18.32 −1.50 −18.32 −1.50
Feeder-loss Lf (dB) 1.40 0.00 0.00 0.00 0.00 0.28
Minimum power
flux-density at receiving
place
min
(dBW/m2)
R = 1/2 −134.38 −126.08 −109.26 −126.08 −109.26 −128.40
R = 2/3 −132.38 −125.08 −108.26 −125.08 −108.26 −127.40
R = 3/4 −131.18 −123.98 −107.16 −123.98 −107.16 −126.30
Minimum field-strength
level at receiving
antenna
Emin
(dB(V/m))
R = 1/2 11.42 19.72 36.54 19.72 36.54 17.40
R = 2/3 13.42 20.72 37.54 20.72 37.54 18.40
R = 3/4 14.62 21.82 38.64 21.82 38.64 19.50
Allowance for man-
made noise
PMMN (dB) 7.87 7.87 0.00 7.87 0.00 7.87
Location probability p (%) 70.00 95.00 95.00 95.00 95.00 99.00
Distribution factor 0.52 1.65 1.65 1.65 1.65 2.33
Standard deviation of
field strength (dB) 3.80 3.80 3.80 8.20 8.20 8.20
Standard deviation of
building penetration loss b (dB) 0.00 3.00 3.00 0.00 0.00 0.00
Combined standard
deviation of field
strength
c (dB) 3.80 4.84 4.84 8.20 8.20 8.20
Location correction
factor
Cl (dB) 1.98 7.99 7.99 13.53 13.53 19.11
Antenna height loss Lh (dB) 0.00 10.00 10.00 10.00 10.00 10.00
Building penetration loss Lb (dB) 0.00 9.00 9.00 0.00 0.00 0.00
Minimum median
field-strength level
Emed
(dB(V/m))
R = 1/2 21.27 54.58 63.53 51.12 60.07 54.38
R = 2/3 23.27 55.58 64.53 52.12 61.07 55.38
R = 3/4 24.47 56.68 65.63 53.22 62.17 56.48

64 Rep. ITU-R BS.2214-1
TABLE 74
Minimum median field-strength level Emed for 100 kHz channel
bandwidth and 64-QAM modulation in Band I
Reception mode FX PI PI-H PO PO-H MO
Receiver noise figure F (dB) 7.00 7.00 7.00 7.00 7.00 7.00
Receiver noise input
power
Pn (dBW) −146.98 −146.98 −146.98 −146.98 −146.98 −146.98
Minimum C/N ratio (C/N)min (dB) R = 1/2 13.50 22.50 22.50 22.50 22.50 19.10
R = 2/3 15.90 24.90 24.90 24.90 24.90 21.50
R = 3/4 17.30 26.30 26.30 26.30 26.30 22.90
Implementation loss Li (dB) 3.00 3.00 3.00 3.00 3.00 3.00
Minimum receiver input
power level
Ps,min (dBW) R = 1/2 −130.48 −121.48 −121.48 −121.48 −121.48 −124.88
R = 2/3 −128.08 −119.08 −119.08 −119.08 −119.08 −122.48
R = 3/4 −126.68 −117.68 −117.68 −117.68 −117.68 −121.08
Antenna gain Gd (dBd) 0.00 −2.20 −22.76 −2.20 −22.76 −2.20
Effective antenna
aperture
Aa (dBm2) 4.44 2.24 −18.32 2.24 −18.32 2.24
Feeder-loss Lf (dB) 1.14 0.00 0.00 0.00 0.00 0.23
Minimum power
flux-density at receiving
place
min
(dBW/m2)
R = 1/2 −133.78 −123.72 −103.16 −123.72 −103.16 −126.89
R = 2/3 −131.38 −121.32 −100.76 −121.32 −100.76 −124.49
R = 3/4 −129.98 −119.92 −99.36 −119.92 −99.36 −123.09
Minimum field-strength
level at receiving
antenna
Emin
(dB(V/m))
R = 1/2 12.02 22.08 42.64 22.08 42.64 18.91
R = 2/3 14.42 24.48 45.04 24.48 45.04 21.31
R = 3/4 15.82 25.88 46.44 25.88 46.44 22.71
Allowance for man-
made noise
PMMN (dB) 12.63 12.63 0.00 12.63 0.00 12.63
Location probability p (%) 70.00 95.00 95.00 95.00 95.00 99.00
Distribution factor 0.52 1.65 1.65 1.65 1.65 2.33
Standard deviation of
field strength (dB) 3.80 3.80 3.80 8.20 8.20 8.20
Standard deviation of
building penetration loss b (dB) 0.00 3.00 3.00 0.00 0.00 0.00
Combined standard
deviation of field
strength
c (dB) 3.80 4.84 4.84 8.20 8.20 8.20
Location correction
factor
Cl (dB) 1.98 7.99 7.99 13.53 13.53 19.11
Antenna height loss Lh (dB) 0.00 8.00 8.00 8.00 8.00 8.00
Building penetration loss Lb (dB) 0.00 9.00 9.00 0.00 0.00 0.00
Minimum median field-
strength level
Emed
(dB(V/m))
R = 1/2 26.63 59.70 67.63 56.24 64.17 58.65
R = 2/3 29.03 62.10 70.03 58.64 66.57 61.05
R = 3/4 30.43 63.50 71.43 60.04 67.97 62.45

Rep. ITU-R BS.2214-1 65
TABLE 75
Minimum median field-strength level Emed for 100 kHz channel
bandwidth and 64-QAM modulation in Band II
Reception mode FX PI PI-H PO PO-H MO
Receiver noise figure F (dB) 7.00 7.00 7.00 7.00 7.00 7.00
Receiver noise input
power
Pn (dBW) −146.98 −146.98 −146.98 −146.98 −146.98 −146.98
Minimum C/N ratio (C/N)min
(dB)
R = 1/2 13.50 22.50 22.50 22.50 22.50 19.10
R = 2/3 15.90 24.90 24.90 24.90 24.90 21.50
R = 3/4 17.30 26.30 26.30 26.30 26.30 22.90
Implementation loss Li (dB) 3.00 3.00 3.00 3.00 3.00 3.00
Minimum receiver
input power level
Ps,min (dBW) R = 1/2 −130.48 −121.48 −121.48 −121.48 −121.48 −124.88
R = 2/3 −128.08 −119.08 −119.08 −119.08 −119.08 −122.48
R = 3/4 −126.68 −117.68 −117.68 −117.68 −117.68 −121.08
Antenna gain Gd (dBd) 0.00 −2.20 −19.02 −2.20 −19.02 −2.20
Effective antenna
aperture
Aa (dBm2) 0.70 −1.50 −18.32 −1.50 −18.32 −1.50
Feeder-loss Lf (dB) 1.40 0.00 0.00 0.00 0.00 0.28
Minimum power flux-
density at receiving
place
min (dBW/m2) R = 1/2 −129.78 −119.98 −103.16 −119.98 −103.16 −123.10
R = 2/3 −127.38 −117.58 −100.76 −117.58 −100.76 −120.70
R = 3/4 −125.98 −116.18 −99.36 −116.18 −99.36 −119.30
Minimum field-
strength level at
receiving antenna
Emin
(dB(µV/m))
R = 1/2 16.02 25.82 42.64 25.82 42.64 22.70
R = 2/3 18.42 28.22 45.04 28.22 45.04 25.10
R = 3/4 19.82 29.62 46.44 29.62 46.44 26.50
Allowance for
man-made noise
PMMN (dB) 7.87 7.87 0.00 7.87 0.00 7.87
Location probability p (%) 70.00 95.00 95.00 95.00 95.00 99.00
Distribution factor 0.52 1.65 1.65 1.65 1.65 2.33
Standard deviation of
field strength (dB) 3.80 3.80 3.80 8.20 8.20 8.20
Standard deviation of
building penetration
loss
b (dB) 0.00 3.00 3.00 0.00 0.00 0.00
Combined standard
deviation of field
strength
c (dB) 3.80 4.84 4.84 8.20 8.20 8.20
Location correction
factor
Cl (dB) 1.98 7.99 7.99 13.53 13.53 19.11
Antenna height loss Lh (dB) 0.00 10.00 10.00 10.00 10.00 10.00
Building penetration
loss
Lb (dB) 0.00 9.00 9.00 0.00 0.00 0.00
Minimum median
field-strength level
Emed
(dB(V/m))
R = 1/2 25.87 60.68 69.63 57.22 66.17 59.68
R = 2/3 28.27 63.08 72.03 59.62 68.57 62.08
R = 3/4 29.67 64.48 73.43 61.02 69.97 63.48

66 Rep. ITU-R BS.2214-1
TABLE 76
Minimum median field-strength level Emed for 200 kHz channel
bandwidth and QPSK modulation in Band I
Reception mode FX PI PI-H PO PO-H MO
Receiver noise figure F (dB) 7.00 7.00 7.00 7.00 7.00 7.00
Receiver noise input
power
Pn (dBW) −143.97 −143.97 −143.97 −143.97 −143.97 −143.97
Minimum C/N ratio (C/N)min (dB) R = 1/2 4.90 11.90 11.90 11.90 11.90 10.10
R = 2/3 5.80 12.80 12.80 12.80 12.80 11.00
R = 3/4 6.40 13.40 13.40 13.40 13.40 11.60
Implementation loss Li (dB) 3.00 3.00 3.00 3.00 3.00 3.00
Minimum receiver input
power level
Ps,min (dBW) R = 1/2 −136.07 −129.07 −129.07 −129.07 −129.07 −130.87
R = 2/3 −135.17 −128.17 −128.17 −128.17 −128.17 −129.97
R = 3/4 −134.57 −127.57 −127.57 −127.57 −127.57 −129.37
Antenna gain Gd (dBd) 0.00 −2.20 −22.76 −2.20 −22.76 −2.20
Effective antenna aperture Aa (dBm2) 4.44 2.24 −18.32 2.24 −18.32 2.24
Feeder-loss Lf (dB) 1.14 0.00 0.00 0.00 0.00 0.23
Minimum power
flux-density at receiving
place
φmin
(dBW/m2)
R = 1/2 −139.37 −131.31 −110.75 −131.31 −110.75 −132.88
R = 2/3 −138.47 −130.41 −109.85 −130.41 −109.85 −131.98
R = 3/4 −137.87 −129.81 −109.25 −129.81 −109.25 −131.38
Minimum field-strength
level at receiving antenna
Emin
(dB(V/m))
R = 1/2 6.43 14.49 35.05 14.49 35.05 12.92
R = 2/3 7.33 15.39 35.95 15.39 35.95 13.82
R = 3/4 7.93 15.99 36.55 15.99 36.55 14.42
Allowance for man-made
noise
PMMN (dB) 12.63 12.63 0.00 12.63 0.00 12.63
Location probability p (%) 70.00 95.00 95.00 95.00 95.00 99.00
Distribution factor 0.52 1.65 1.65 1.65 1.65 2.33
Standard deviation of field
strength (dB) 3.80 3.80 3.80 8.20 8.20 8.20
Standard deviation of
building penetration loss b (dB) 0.00 3.00 3.00 0.00 0.00 0.00
Combined standard
deviation of field strength c (dB) 3.80 4.84 4.84 8.20 8.20 8.20
Location correction factor Cl (dB) 1.98 7.99 7.99 13.53 13.53 19.11
Antenna height loss Lh (dB) 0.00 8.00 8.00 8.00 8.00 8.00
Building penetration loss Lb (dB) 0.00 9.00 9.00 0.00 0.00 0.00
Minimum median field-
strength level
Emed
(dB(V/m))
R = 1/2 21.04 52.11 60.04 48.65 56.58 52.66
R = 2/3 21.94 53.01 60.94 49.55 57.48 53.56
R = 3/4 22.54 53.61 61.54 50.15 58.08 54.16
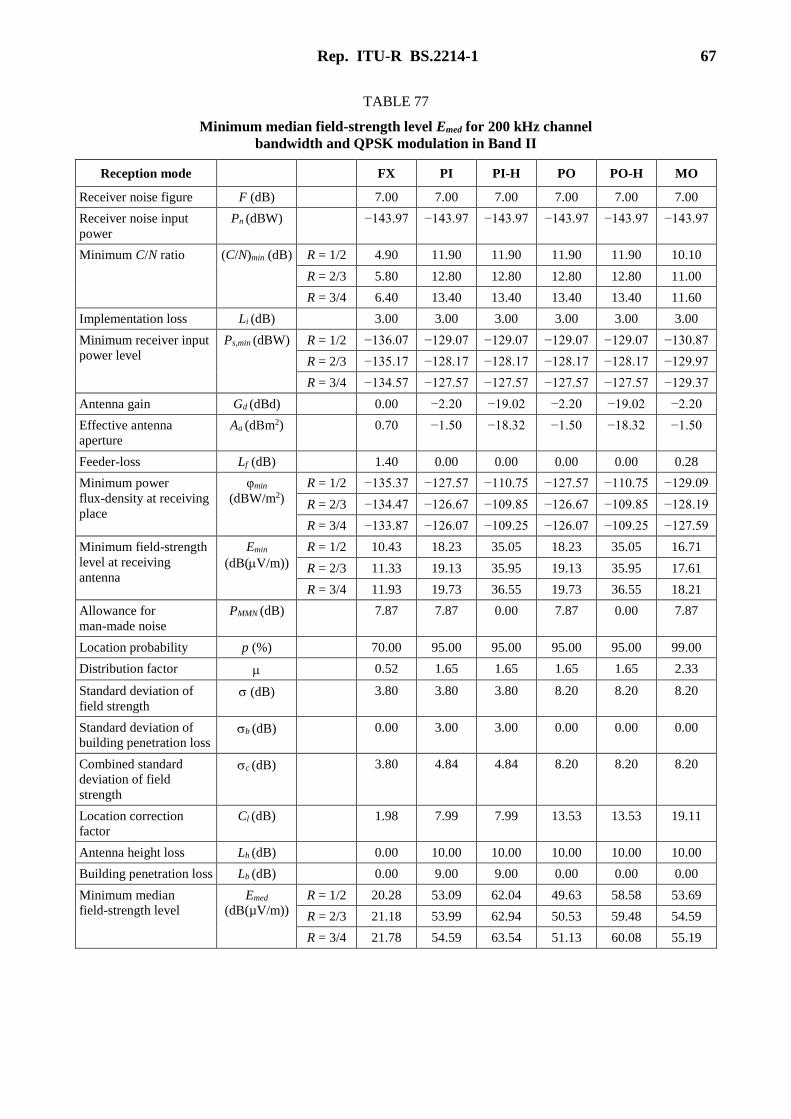
Rep. ITU-R BS.2214-1 67
TABLE 77
Minimum median field-strength level Emed for 200 kHz channel
bandwidth and QPSK modulation in Band II
Reception mode FX PI PI-H PO PO-H MO
Receiver noise figure F (dB) 7.00 7.00 7.00 7.00 7.00 7.00
Receiver noise input
power
Pn (dBW) −143.97 −143.97 −143.97 −143.97 −143.97 −143.97
Minimum C/N ratio (C/N)min (dB) R = 1/2 4.90 11.90 11.90 11.90 11.90 10.10
R = 2/3 5.80 12.80 12.80 12.80 12.80 11.00
R = 3/4 6.40 13.40 13.40 13.40 13.40 11.60
Implementation loss Li (dB) 3.00 3.00 3.00 3.00 3.00 3.00
Minimum receiver input
power level
Ps,min (dBW) R = 1/2 −136.07 −129.07 −129.07 −129.07 −129.07 −130.87
R = 2/3 −135.17 −128.17 −128.17 −128.17 −128.17 −129.97
R = 3/4 −134.57 −127.57 −127.57 −127.57 −127.57 −129.37
Antenna gain Gd (dBd) 0.00 −2.20 −19.02 −2.20 −19.02 −2.20
Effective antenna
aperture
Aa (dBm2) 0.70 −1.50 −18.32 −1.50 −18.32 −1.50
Feeder-loss Lf (dB) 1.40 0.00 0.00 0.00 0.00 0.28
Minimum power
flux-density at receiving
place
φmin
(dBW/m2)
R = 1/2 −135.37 −127.57 −110.75 −127.57 −110.75 −129.09
R = 2/3 −134.47 −126.67 −109.85 −126.67 −109.85 −128.19
R = 3/4 −133.87 −126.07 −109.25 −126.07 −109.25 −127.59
Minimum field-strength
level at receiving
antenna
Emin
(dB(V/m))
R = 1/2 10.43 18.23 35.05 18.23 35.05 16.71
R = 2/3 11.33 19.13 35.95 19.13 35.95 17.61
R = 3/4 11.93 19.73 36.55 19.73 36.55 18.21
Allowance for
man-made noise
PMMN (dB) 7.87 7.87 0.00 7.87 0.00 7.87
Location probability p (%) 70.00 95.00 95.00 95.00 95.00 99.00
Distribution factor 0.52 1.65 1.65 1.65 1.65 2.33
Standard deviation of
field strength (dB) 3.80 3.80 3.80 8.20 8.20 8.20
Standard deviation of
building penetration loss b (dB) 0.00 3.00 3.00 0.00 0.00 0.00
Combined standard
deviation of field
strength
c (dB) 3.80 4.84 4.84 8.20 8.20 8.20
Location correction
factor
Cl (dB) 1.98 7.99 7.99 13.53 13.53 19.11
Antenna height loss Lh (dB) 0.00 10.00 10.00 10.00 10.00 10.00
Building penetration loss Lb (dB) 0.00 9.00 9.00 0.00 0.00 0.00
Minimum median
field-strength level
Emed
(dB(µV/m))
R = 1/2 20.28 53.09 62.04 49.63 58.58 53.69
R = 2/3 21.18 53.99 62.94 50.53 59.48 54.59
R = 3/4 21.78 54.59 63.54 51.13 60.08 55.19

68 Rep. ITU-R BS.2214-1
TABLE 78
Minimum median field-strength level Emed for 200 kHz channel
bandwidth and 16-QAM modulation in Band I
Reception mode FX PI PI-H PO PO-H MO
Receiver noise figure F (dB) 7.00 7.00 7.00 7.00 7.00 7.00
Receiver noise input
power
Pn (dBW) −143.97 −143.97 −143.97 −143.97 −143.97 −143.97
Minimum C/N ratio (C/N)min
(dB)
R = 1/2 8.70 17.20 17.20 17.20 17.20 14.60
R = 2/3 10.70 18.20 18.20 18.20 18.20 15.60
R = 3/4 11.90 19.30 19.30 19.30 19.30 16.70
Implementation loss Li (dB) 3.00 3.00 3.00 3.00 3.00 3.00
Minimum receiver input
power level
Ps,min (dBW) R = 1/2 −132.27 −123.77 −123.77 −123.77 −123.77 −126.37
R = 2/3 −130.27 −122.77 −122.77 −122.77 −122.77 −125.37
R = 3/4 −129.07 −121.67 −121.67 −121.67 −121.67 −124.27
Antenna gain Gd (dBd) 0.00 −2.20 −22.76 −2.20 −22.76 −2.20
Effective antenna
aperture
Aa (dBm2) 4.44 2.24 −18.32 2.24 −18.32 2.24
Feeder-loss Lf (dB) 1.14 0.00 0.00 0.00 0.00 0.23
Minimum power flux-
density at receiving
place
min
(dBW/m2)
R = 1/2 −135.57 −126.01 −105.45 −126.01 −105.45 −128.38
R = 2/3 −133.57 −125.01 −104.45 −125.01 −104.45 −127.38
R = 3/4 −132.37 −123.91 −103.35 −123.91 −103.35 −126.28
Minimum field-strength
level at receiving
antenna
Emin
(dB(V/m))
R = 1/2 10.23 19.79 40.35 19.79 40.35 17.42
R = 2/3 12.23 20.79 41.35 20.79 41.35 18.42
R = 3/4 13.43 21.89 42.45 21.89 42.45 19.52
Allowance for
man-made noise
PMMN (dB) 12.63 12.63 0.00 12.63 0.00 12.63
Location probability p (%) 70.00 95.00 95.00 95.00 95.00 99.00
Distribution factor 0.52 1.65 1.65 1.65 1.65 2.33
Standard deviation of
field strength (dB) 3.80 3.80 3.80 8.20 8.20 8.20
Standard deviation of
building penetration loss b (dB) 0.00 3.00 3.00 0.00 0.00 0.00
Combined standard
deviation of field
strength
c (dB) 3.80 4.84 4.84 8.20 8.20 8.20
Location correction
factor
Cl (dB) 1.98 7.99 7.99 13.53 13.53 19.11
Antenna height loss Lh (dB) 0.00 8.00 8.00 8.00 8.00 8.00
Building penetration loss Lb (dB) 0.00 9.00 9.00 0.00 0.00 0.00
Minimum median
field-strength level
Emed
(dB(V/m))
R = 1/2 24.84 57.41 65.34 53.95 61.88 57.16
R = 2/3 26.84 58.41 66.34 54.95 62.88 58.16
R = 3/4 28.04 59.51 67.44 56.05 63.98 59.26

Rep. ITU-R BS.2214-1 69
TABLE 79
Minimum median field-strength level Emed for 200 kHz channel
bandwidth and 16-QAM modulation in Band II
Reception mode FX PI PI-H PO PO-H MO
Receiver noise figure F (dB) 7.00 7.00 7.00 7.00 7.00 7.00
Receiver noise input
power
Pn (dBW) −143.97 −143.97 −143.97 −143.97 −143.97 −143.97
Minimum C/N ratio (C/N)min (dB) R = 1/2 8.70 17.20 17.20 17.20 17.20 14.60
R = 2/3 10.70 18.20 18.20 18.20 18.20 15.60
R = 3/4 11.90 19.30 19.30 19.30 19.30 16.70
Implementation loss Li (dB) 3.00 3.00 3.00 3.00 3.00 3.00
Minimum receiver input
power level
Ps min (dBW) R = 1/2 −132.27 −123.77 −123.77 −123.77 −123.77 −126.37
R = 2/3 −130.27 −122.77 −122.77 −122.77 −122.77 −125.37
R = 3/4 −129.07 −121.67 −121.67 −121.67 −121.67 −124.27
Antenna gain Gd (dBd) 0.00 −2.20 −19.02 −2.20 −19.02 −2.20
Effective antenna
aperture
Aa (dBm2) 0.70 −1.50 −18.32 −1.50 −18.32 −1.50
Feeder-loss Lf (dB) 1.40 0.00 0.00 0.00 0.00 0.28
Minimum power
flux-density at receiving
place
φmin
(dBW/m2)
R = 1/2 −131.57 −122.27 −105.45 −122.27 −105.45 −124.59
R = 2/3 −129.57 −121.27 −104.45 −121.27 −104.45 −123.59
R = 3/4 −128.37 −120.17 −103.35 −120.17 −103.35 −122.49
Minimum field-strength
level at receiving
antenna
Emin
(dB(V/m))
R = 1/2 14.23 23.53 40.35 23.53 40.35 21.21
R = 2/3 16.23 24.53 41.35 24.53 41.35 22.21
R = 3/4 17.43 25.63 42.45 25.63 42.45 23.31
Allowance for man-
made noise
PMMN (dB) 7.87 7.87 0.00 7.87 0.00 7.87
Location probability p (%) 70.00 95.00 95.00 95.00 95.00 99.00
Distribution factor 0.52 1.65 1.65 1.65 1.65 2.33
Standard deviation of
field strength (dB) 3.80 3.80 3.80 8.20 8.20 8.20
Standard deviation of
building penetration loss b (dB) 0.00 3.00 3.00 0.00 0.00 0.00
Combined standard
deviation of field
strength
c (dB) 3.80 4.84 4.84 8.20 8.20 8.20
Location correction
factor
Cl (dB) 1.98 7.99 7.99 13.53 13.53 19.11
Antenna height loss Lh (dB) 0.00 10.00 10.00 10.00 10.00 10.00
Building penetration loss Lb (dB) 0.00 9.00 9.00 0.00 0.00 0.00
Minimum median
field-strength level
Emed
(dB(V/m))
R = 1/2 24.08 58.39 67.34 54.93 63.88 58.19
R = 2/3 26.08 59.39 68.34 55.93 64.88 59.19
R = 3/4 27.28 60.49 69.44 57.03 65.98 60.29

70 Rep. ITU-R BS.2214-1
TABLE 80
Minimum median field-strength level Emed for 200 kHz channel
bandwidth and 64-QAM modulation in Band I
Reception mode FX PI PI-H PO PO-H MO
Receiver noise figure F (dB) 7.00 7.00 7.00 7.00 7.00 7.00
Receiver noise input
power
Pn (dBW) −143.97 −143.97 −143.97 −143.97 −143.97 −143.97
Minimum C/N ratio (C/N)min (dB) R = 1/2 13.30 23.30 23.30 23.30 23.30 19.90
R = 2/3 15.80 25.80 25.80 25.80 25.80 22.40
R = 3/4 17.20 27.20 27.20 27.20 27.20 23.80
Implementation loss Li (dB) 3.00 3.00 3.00 3.00 3.00 3.00
Minimum receiver input
power level
Ps,min (dBW) R = 1/2 −127.67 −117.67 −117.67 −117.67 −117.67 −121.07
R = 2/3 −125.17 −115.17 −115.17 −115.17 −115.17 −118.57
R = 3/4 −123.77 −113.77 −113.77 −113.77 −113.77 −117.17
Antenna gain Gd (dBd) 0.00 −2.20 −22.76 −2.20 −22.76 −2.20
Effective antenna
aperture
Aa (dBm2) 4.44 2.24 −18.32 2.24 −18.32 2.24
Feeder-loss Lf (dB) 1.14 0.00 0.00 0.00 0.00 0.23
Minimum power
flux-density at receiving
place
min
(dBW/m2)
R = 1/2 −130.97 −119.91 −99.35 −119.91 −99.35 −123.08
R = 2/3 −128.47 −117.41 −96.85 −117.41 −96.85 −120.58
R = 3/4 −127.07 −116.01 −95.45 −116.01 −95.45 −119.18
Minimum field-strength
level at receiving
antenna
Emin
(dB(V/m))
R = 1/2 14.83 25.89 46.45 25.89 46.45 22.72
R = 2/3 17.33 28.39 48.95 28.39 48.95 25.22
R = 3/4 18.73 29.79 50.35 29.79 50.35 26.62
Allowance for
man-made noise
PMMN (dB) 12.63 12.63 0.00 12.63 0.00 12.63
Location probability p (%) 70.00 95.00 95.00 95.00 95.00 99.00
Distribution factor 0.52 1.65 1.65 1.65 1.65 2.33
Standard deviation of
field strength (dB) 3.80 3.80 3.80 8.20 8.20 8.20
Standard deviation of
building penetration loss b (dB) 0.00 3.00 3.00 0.00 0.00 0.00
Combined standard
deviation of field
strength
c (dB) 3.80 4.84 4.84 8.20 8.20 8.20
Location correction
factor
Cl (dB) 1.98 7.99 7.99 13.53 13.53 19.11
Antenna height loss Lh (dB) 0.00 8.00 8.00 8.00 8.00 8.00
Building penetration loss Lb (dB) 0.00 9.00 9.00 0.00 0.00 0.00
Minimum median
field-strength level
Emed
(dB(V/m))
R = 1/2 29.44 63.51 71.44 60.05 67.98 62.46
R = 2/3 31.94 66.01 73.94 62.55 70.48 64.96
R = 3/4 33.34 67.41 75.34 63.95 71.88 66.36

Rep. ITU-R BS.2214-1 71
TABLE 81
Minimum median field-strength level Emed for 200 kHz channel
bandwidth and 64-QAM modulation in Band II
Reception mode FX PI PI-H PO PO-H MO
Receiver noise figure F (dB) 7.00 7.00 7.00 7.00 7.00 7.00
Receiver noise input
power
Pn (dBW) −143.97 −143.97 −143.97 −143.97 −143.97 −143.97
Minimum C/N ratio (C/N)min (dB) R = 1/2 13.30 23.30 23.30 23.30 23.30 19.90
R = 2/3 15.80 25.80 25.80 25.80 25.80 22.40
R = 3/4 17.20 27.20 27.20 27.20 27.20 23.80
Implementation loss Li (dB) 3.00 3.00 3.00 3.00 3.00 3.00
Minimum receiver input
power level
Ps,min (dBW) R = 1/2 −127.67 −117.67 −117.67 −117.67 −117.67 −121.07
R = 2/3 −125.17 −115.17 −115.17 −115.17 −115.17 −118.57
R = 3/4 −123.77 −113.77 −113.77 −113.77 −113.77 −117.17
Antenna gain Gd (dBd) 0.00 −2.20 −19.02 −2.20 −19.02 −2.20
Effective antenna
aperture
Aa (dBm2) 0.70 −1.50 −18.32 −1.50 −18.32 −1.50
Feeder-loss Lf (dB) 1.40 0.00 0.00 0.00 0.00 0.28
Minimum power
flux-density at receiving
place
φmin
(dBW/m2)
R = 1/2 −126.97 −116.17 −99.35 −116.17 −99.35 −119.29
R = 2/3 −124.47 −113.67 −96.85 −113.67 −96.85 −116.79
R = 3/4 −123.07 −112.27 −95.45 −112.27 −95.45 −115.39
Minimum field-strength
level at receiving
antenna
Emin
(dB(µV/m))
R = 1/2 18.83 29.63 46.45 29.63 46.45 26.51
R = 2/3 21.33 32.13 48.95 32.13 48.95 29.01
R = 3/4 22.73 33.53 50.35 33.53 50.35 30.41
Allowance for man-
made noise
PMMN (dB) 7.87 7.87 0.00 7.87 0.00 7.87
Location probability p (%) 70.00 95.00 95.00 95.00 95.00 99.00
Distribution factor µ 0.52 1.65 1.65 1.65 1.65 2.33
Standard deviation of
field strength
σ (dB) 3.80 3.80 3.80 8.20 8.20 8.20
Standard deviation of
building penetration loss
σb (dB) 0.00 3.00 3.00 0.00 0.00 0.00
Combined standard
deviation of field
strength
σc (dB) 3.80 4.84 4.84 8.20 8.20 8.20
Location correction
factor
Cl (dB) 1.98 7.99 7.99 13.53 13.53 19.11
Antenna height loss Lh (dB) 0.00 10.00 10.00 10.00 10.00 10.00
Building penetration loss Lb (dB) 0.00 9.00 9.00 0.00 0.00 0.00
Minimum median
field-strength level
Emed
(dBµV/m)
R = 1/2 28.68 64.49 73.44 61.03 69.98 63.49
R = 2/3 31.18 66.99 75.94 63.53 72.48 65.99
R = 3/4 32.58 68.39 77.34 64.93 73.88 67.39

72 Rep. ITU-R BS.2214-1
TABLE 82
Minimum median field-strength level Emed for 250 kHz channel
bandwidth and QPSK modulation in Band I
Reception mode FX PI PI-H PO PO-H MO
Receiver noise figure F (dB) 7.00 7.00 7.00 7.00 7.00 7.00
Receiver noise input
power
Pn (dBW) −143.00 −143.00 −143.00 −143.00 −143.00 −143.00
Minimum C/N ratio (C/N)min
(dB)
R = 1/2 5.10 14.10 14.10 14.10 14.10 12.30
R = 2/3 5.80 14.80 14.80 14.80 14.80 13.00
R = 3/4 6.40 15.40 15.40 15.40 15.40 13.60
Implementation loss Li (dB) 3.00 3.00 3.00 3.00 3.00 3.00
Minimum receiver input
power level
Ps,min
(dBW)
R = 1/2 −134.90 −125.90 −125.90 −125.90 −125.90 −127.70
R = 2/3 −134.20 −125.20 −125.20 −125.20 −125.20 −127.00
R = 3/4 −133.60 −124.60 −124.60 −124.60 −124.60 −126.40
Antenna gain Gd (dBd) 0.00 −2.20 −22.76 −2.20 −22.76 −2.20
Effective antenna
aperture
Aa (dBm2) 4.44 2.24 −18.32 2.24 −18.32 2.24
Feeder-loss Lf (dB) 1.14 0.00 0.00 0.00 0.00 0.23
Minimum power
flux-density at receiving
place
min
(dBW/m2)
R = 1/2 −138.20 −128.14 −107.58 −128.14 −107.58 −129.71
R = 2/3 −137.50 −127.44 −106.88 −127.44 −106.88 −129.01
R = 3/4 −136.90 −126.84 −106.28 −126.84 −106.28 −128.41
Minimum field-strength
level at receiving
antenna
Emin
(dB(V/m))
R = 1/2 7.60 17.66 38.22 17.66 38.22 16.09
R = 2/3 8.30 18.36 38.92 18.36 38.92 16.79
R = 3/4 8.90 18.96 39.52 18.96 39.52 17.39
Allowance for man-
made noise
PMMN (dB) 12.63 12.63 0.00 12.63 0.00 12.63
Location probability p (%) 70.00 95.00 95.00 95.00 95.00 99.00
Distribution factor 0.52 1.65 1.65 1.65 1.65 2.33
Standard deviation of
field strength (dB) 3.80 3.80 3.80 8.20 8.20 8.20
Standard deviation of
building penetration loss b (dB) 0.00 3.00 3.00 0.00 0.00 0.00
Combined standard
deviation of field
strength
c (dB) 3.80 4.84 4.84 8.20 8.20 8.20
Location correction
factor
Cl (dB) 1.98 7.99 7.99 13.53 13.53 19.11
Antenna height loss Lh (dB) 0.00 8.00 8.00 8.00 8.00 8.00
Building penetration loss Lb (dB) 0.00 9.00 9.00 0.00 0.00 0.00
Minimum median
field-strength level
Emed
(dB(V/m))
R = 1/2 22.20 55.28 63.21 51.82 59.75 55.82
R = 2/3 22.90 55.98 63.91 52.52 60.45 56.52
R = 3/4 23.50 56.58 64.51 53.12 61.05 57.12
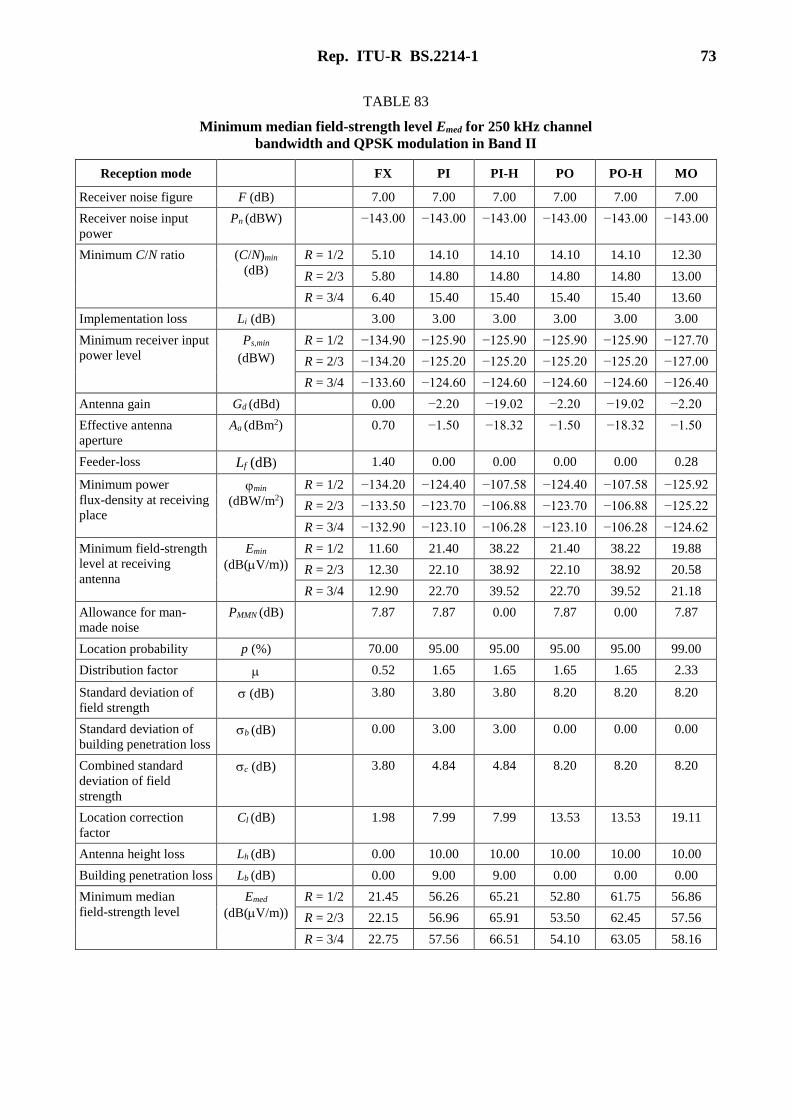
Rep. ITU-R BS.2214-1 73
TABLE 83
Minimum median field-strength level Emed for 250 kHz channel
bandwidth and QPSK modulation in Band II
Reception mode FX PI PI-H PO PO-H MO
Receiver noise figure F (dB) 7.00 7.00 7.00 7.00 7.00 7.00
Receiver noise input
power
Pn (dBW) −143.00 −143.00 −143.00 −143.00 −143.00 −143.00
Minimum C/N ratio (C/N)min
(dB)
R = 1/2 5.10 14.10 14.10 14.10 14.10 12.30
R = 2/3 5.80 14.80 14.80 14.80 14.80 13.00
R = 3/4 6.40 15.40 15.40 15.40 15.40 13.60
Implementation loss Li (dB) 3.00 3.00 3.00 3.00 3.00 3.00
Minimum receiver input
power level
Ps,min
(dBW)
R = 1/2 −134.90 −125.90 −125.90 −125.90 −125.90 −127.70
R = 2/3 −134.20 −125.20 −125.20 −125.20 −125.20 −127.00
R = 3/4 −133.60 −124.60 −124.60 −124.60 −124.60 −126.40
Antenna gain Gd (dBd) 0.00 −2.20 −19.02 −2.20 −19.02 −2.20
Effective antenna
aperture
Aa (dBm2) 0.70 −1.50 −18.32 −1.50 −18.32 −1.50
Feeder-loss Lf (dB) 1.40 0.00 0.00 0.00 0.00 0.28
Minimum power
flux-density at receiving
place
min
(dBW/m2)
R = 1/2 −134.20 −124.40 −107.58 −124.40 −107.58 −125.92
R = 2/3 −133.50 −123.70 −106.88 −123.70 −106.88 −125.22
R = 3/4 −132.90 −123.10 −106.28 −123.10 −106.28 −124.62
Minimum field-strength
level at receiving
antenna
Emin
(dB(V/m))
R = 1/2 11.60 21.40 38.22 21.40 38.22 19.88
R = 2/3 12.30 22.10 38.92 22.10 38.92 20.58
R = 3/4 12.90 22.70 39.52 22.70 39.52 21.18
Allowance for man-
made noise
PMMN (dB) 7.87 7.87 0.00 7.87 0.00 7.87
Location probability p (%) 70.00 95.00 95.00 95.00 95.00 99.00
Distribution factor 0.52 1.65 1.65 1.65 1.65 2.33
Standard deviation of
field strength (dB) 3.80 3.80 3.80 8.20 8.20 8.20
Standard deviation of
building penetration loss b (dB) 0.00 3.00 3.00 0.00 0.00 0.00
Combined standard
deviation of field
strength
c (dB) 3.80 4.84 4.84 8.20 8.20 8.20
Location correction
factor
Cl (dB) 1.98 7.99 7.99 13.53 13.53 19.11
Antenna height loss Lh (dB) 0.00 10.00 10.00 10.00 10.00 10.00
Building penetration loss Lb (dB) 0.00 9.00 9.00 0.00 0.00 0.00
Minimum median
field-strength level
Emed
(dB(V/m))
R = 1/2 21.45 56.26 65.21 52.80 61.75 56.86
R = 2/3 22.15 56.96 65.91 53.50 62.45 57.56
R = 3/4 22.75 57.56 66.51 54.10 63.05 58.16
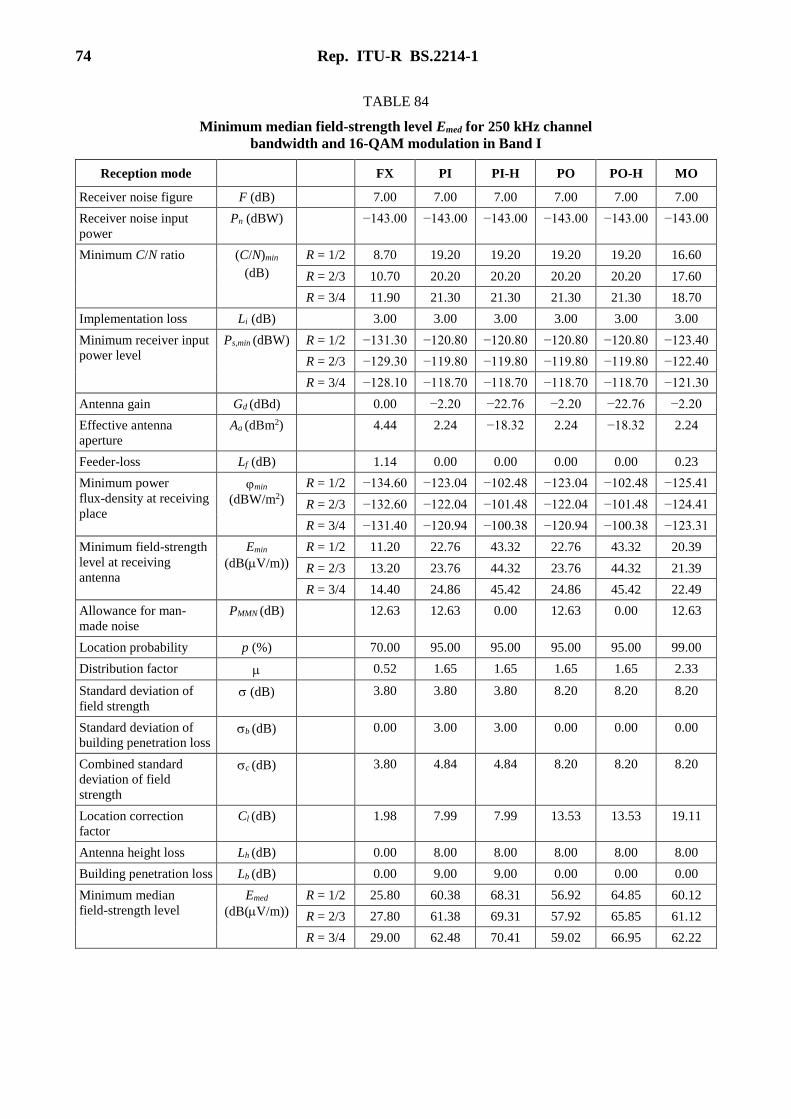
74 Rep. ITU-R BS.2214-1
TABLE 84
Minimum median field-strength level Emed for 250 kHz channel
bandwidth and 16-QAM modulation in Band I
Reception mode FX PI PI-H PO PO-H MO
Receiver noise figure F (dB) 7.00 7.00 7.00 7.00 7.00 7.00
Receiver noise input
power
Pn (dBW) −143.00 −143.00 −143.00 −143.00 −143.00 −143.00
Minimum C/N ratio (C/N)min
(dB)
R = 1/2 8.70 19.20 19.20 19.20 19.20 16.60
R = 2/3 10.70 20.20 20.20 20.20 20.20 17.60
R = 3/4 11.90 21.30 21.30 21.30 21.30 18.70
Implementation loss Li (dB) 3.00 3.00 3.00 3.00 3.00 3.00
Minimum receiver input
power level
Ps,min (dBW) R = 1/2 −131.30 −120.80 −120.80 −120.80 −120.80 −123.40
R = 2/3 −129.30 −119.80 −119.80 −119.80 −119.80 −122.40
R = 3/4 −128.10 −118.70 −118.70 −118.70 −118.70 −121.30
Antenna gain Gd (dBd) 0.00 −2.20 −22.76 −2.20 −22.76 −2.20
Effective antenna
aperture
Aa (dBm2) 4.44 2.24 −18.32 2.24 −18.32 2.24
Feeder-loss Lf (dB) 1.14 0.00 0.00 0.00 0.00 0.23
Minimum power
flux-density at receiving
place
min
(dBW/m2)
R = 1/2 −134.60 −123.04 −102.48 −123.04 −102.48 −125.41
R = 2/3 −132.60 −122.04 −101.48 −122.04 −101.48 −124.41
R = 3/4 −131.40 −120.94 −100.38 −120.94 −100.38 −123.31
Minimum field-strength
level at receiving
antenna
Emin
(dB(V/m))
R = 1/2 11.20 22.76 43.32 22.76 43.32 20.39
R = 2/3 13.20 23.76 44.32 23.76 44.32 21.39
R = 3/4 14.40 24.86 45.42 24.86 45.42 22.49
Allowance for man-
made noise
PMMN (dB) 12.63 12.63 0.00 12.63 0.00 12.63
Location probability p (%) 70.00 95.00 95.00 95.00 95.00 99.00
Distribution factor 0.52 1.65 1.65 1.65 1.65 2.33
Standard deviation of
field strength (dB) 3.80 3.80 3.80 8.20 8.20 8.20
Standard deviation of
building penetration loss b (dB) 0.00 3.00 3.00 0.00 0.00 0.00
Combined standard
deviation of field
strength
c (dB) 3.80 4.84 4.84 8.20 8.20 8.20
Location correction
factor
Cl (dB) 1.98 7.99 7.99 13.53 13.53 19.11
Antenna height loss Lh (dB) 0.00 8.00 8.00 8.00 8.00 8.00
Building penetration loss Lb (dB) 0.00 9.00 9.00 0.00 0.00 0.00
Minimum median
field-strength level
Emed
(dB(V/m))
R = 1/2 25.80 60.38 68.31 56.92 64.85 60.12
R = 2/3 27.80 61.38 69.31 57.92 65.85 61.12
R = 3/4 29.00 62.48 70.41 59.02 66.95 62.22
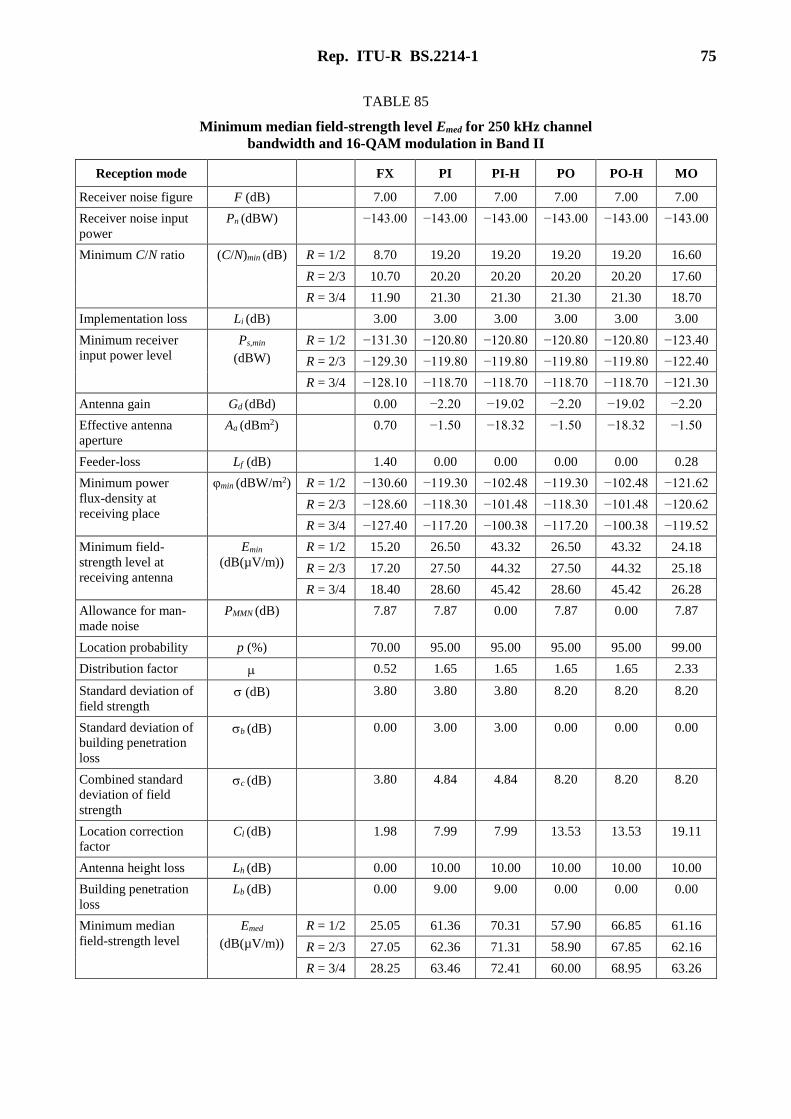
Rep. ITU-R BS.2214-1 75
TABLE 85
Minimum median field-strength level Emed for 250 kHz channel
bandwidth and 16-QAM modulation in Band II
Reception mode FX PI PI-H PO PO-H MO
Receiver noise figure F (dB) 7.00 7.00 7.00 7.00 7.00 7.00
Receiver noise input
power
Pn (dBW) −143.00 −143.00 −143.00 −143.00 −143.00 −143.00
Minimum C/N ratio (C/N)min (dB) R = 1/2 8.70 19.20 19.20 19.20 19.20 16.60
R = 2/3 10.70 20.20 20.20 20.20 20.20 17.60
R = 3/4 11.90 21.30 21.30 21.30 21.30 18.70
Implementation loss Li (dB) 3.00 3.00 3.00 3.00 3.00 3.00
Minimum receiver
input power level
Ps,min
(dBW)
R = 1/2 −131.30 −120.80 −120.80 −120.80 −120.80 −123.40
R = 2/3 −129.30 −119.80 −119.80 −119.80 −119.80 −122.40
R = 3/4 −128.10 −118.70 −118.70 −118.70 −118.70 −121.30
Antenna gain Gd (dBd) 0.00 −2.20 −19.02 −2.20 −19.02 −2.20
Effective antenna
aperture
Aa (dBm2) 0.70 −1.50 −18.32 −1.50 −18.32 −1.50
Feeder-loss Lf (dB) 1.40 0.00 0.00 0.00 0.00 0.28
Minimum power
flux-density at
receiving place
φmin (dBW/m2) R = 1/2 −130.60 −119.30 −102.48 −119.30 −102.48 −121.62
R = 2/3 −128.60 −118.30 −101.48 −118.30 −101.48 −120.62
R = 3/4 −127.40 −117.20 −100.38 −117.20 −100.38 −119.52
Minimum field-
strength level at
receiving antenna
Emin
(dB(µV/m))
R = 1/2 15.20 26.50 43.32 26.50 43.32 24.18
R = 2/3 17.20 27.50 44.32 27.50 44.32 25.18
R = 3/4 18.40 28.60 45.42 28.60 45.42 26.28
Allowance for man-
made noise
PMMN (dB) 7.87 7.87 0.00 7.87 0.00 7.87
Location probability p (%) 70.00 95.00 95.00 95.00 95.00 99.00
Distribution factor 0.52 1.65 1.65 1.65 1.65 2.33
Standard deviation of
field strength (dB) 3.80 3.80 3.80 8.20 8.20 8.20
Standard deviation of
building penetration
loss
b (dB) 0.00 3.00 3.00 0.00 0.00 0.00
Combined standard
deviation of field
strength
c (dB) 3.80 4.84 4.84 8.20 8.20 8.20
Location correction
factor
Cl (dB) 1.98 7.99 7.99 13.53 13.53 19.11
Antenna height loss Lh (dB) 0.00 10.00 10.00 10.00 10.00 10.00
Building penetration
loss
Lb (dB) 0.00 9.00 9.00 0.00 0.00 0.00
Minimum median
field-strength level
Emed
(dB(µV/m))
R = 1/2 25.05 61.36 70.31 57.90 66.85 61.16
R = 2/3 27.05 62.36 71.31 58.90 67.85 62.16
R = 3/4 28.25 63.46 72.41 60.00 68.95 63.26

76 Rep. ITU-R BS.2214-1
TABLE 86
Minimum median field-strength level Emed for 250 kHz channel
bandwidth and 64-QAM modulation in Band I
Reception mode FX PI PI-H PO PO-H MO
Receiver noise figure F (dB) 7.00 7.00 7.00 7.00 7.00 7.00
Receiver noise input
power
Pn (dBW) −143.00 −143.00 −143.00 −143.00 −143.00 −143.00
Minimum C/N ratio (C/N)min
(dB)
R = 1/2 13.20 25.20 25.20 25.20 25.20 21.80
R = 2/3 15.70 27.70 27.70 27.70 27.70 24.30
R = 3/4 17.20 29.20 29.20 29.20 29.20 25.80
Implementation loss Li (dB) 3.00 3.00 3.00 3.00 3.00 3.00
Minimum receiver input
power level
Ps,min
(dBW)
R = 1/2 −126.80 −114.80 −114.80 −114.80 −114.80 −118.20
R = 2/3 −124.30 −112.30 −112.30 −112.30 −112.30 −115.70
R = 3/4 −122.80 −110.80 −110.80 −110.80 −110.80 −114.20
Antenna gain Gd (dBd) 0.00 −2.20 −22.76 −2.20 −22.76 −2.20
Effective antenna
aperture
Aa (dBm2) 4.44 2.24 −18.32 2.24 −18.32 2.24
Feeder-loss Lf (dB) 1.14 0.00 0.00 0.00 0.00 0.23
Minimum power
flux-density at receiving
place
min
(dBW/m2)
R = 1/2 −130.10 −117.04 −96.48 −117.04 −96.48 −120.21
R = 2/3 −127.60 −114.54 −93.98 −114.54 −93.98 −117.71
R = 3/4 −126.10 −113.04 −92.48 −113.04 −92.48 −116.21
Minimum field-strength
level at receiving
antenna
Emin
(dB(V/m))
R = 1/2 15.70 28.76 49.32 28.76 49.32 25.59
R = 2/3 18.20 31.26 51.82 31.26 51.82 28.09
R = 3/4 19.70 32.76 53.32 32.76 53.32 29.59
Allowance for man-
made noise
PMMN (dB) 12.63 12.63 0.00 12.63 0.00 12.63
Location probability p (%) 70.00 95.00 95.00 95.00 95.00 99.00
Distribution factor 0.52 1.65 1.65 1.65 1.65 2.33
Standard deviation of
field strength (dB) 3.80 3.80 3.80 8.20 8.20 8.20
Standard deviation of
building penetration loss b (dB) 0.00 3.00 3.00 0.00 0.00 0.00
Combined standard
deviation of field
strength
c (dB) 3.80 4.84 4.84 8.20 8.20 8.20
Location correction
factor
Cl (dB) 1.98 7.99 7.99 13.53 13.53 19.11
Antenna height loss Lh (dB) 0.00 8.00 8.00 8.00 8.00 8.00
Building penetration loss Lb (dB) 0.00 9.00 9.00 0.00 0.00 0.00
Minimum median
field-strength level
Emed
(dB(V/m))
R = 1/2 30.30 66.38 74.31 62.92 70.85 65.32
R = 2/3 32.80 68.88 76.81 65.42 73.35 67.82
R = 3/4 34.30 70.38 78.31 66.92 74.85 69.32

Rep. ITU-R BS.2214-1 77
TABLE 87
Minimum median field-strength level Emed for 250 kHz channel
bandwidth and 64-QAM modulation in Band II
Reception mode FX PI PI-H PO PO-H MO
Receiver noise figure F (dB) 7.00 7.00 7.00 7.00 7.00 7.00
Receiver noise input
power
Pn (dBW) −143.00 −143.00 −143.00 −143.00 −143.00 −143.00
Minimum C/N ratio (C/N)min
(dB)
R = 1/2 13.20 25.20 25.20 25.20 25.20 21.80
R = 2/3 15.70 27.70 27.70 27.70 27.70 24.30
R = 3/4 17.20 29.20 29.20 29.20 29.20 25.80
Implementation loss Li (dB) 3.00 3.00 3.00 3.00 3.00 3.00
Minimum receiver input
power level
Ps,min
(dBW)
R = 1/2 −126.80 −114.80 −114.80 −114.80 −114.80 −118.20
R = 2/3 −124.30 −112.30 −112.30 −112.30 −112.30 −115.70
R = 3/4 −122.80 −110.80 −110.80 −110.80 −110.80 −114.20
Antenna gain Gd (dBd) 0.00 −2.20 −19.02 −2.20 −19.02 −2.20
Effective antenna
aperture
Aa (dBm2) 0.70 −1.50 −18.32 −1.50 −18.32 −1.50
Feeder-loss Lf (dB) 1.40 0.00 0.00 0.00 0.00 0.28
Minimum power
flux-density at receiving
place
min
(dBW/m2)
R = 1/2 −126.10 −113.30 −96.48 −113.30 −96.48 −116.42
R = 2/3 −123.60 −110.80 −93.98 −110.80 −93.98 −113.92
R = 3/4 −122.10 −109.30 −92.48 −109.30 −92.48 −112.42
Minimum field-strength
level at receiving
antenna
Emin
(dB(V/m))
R = 1/2 19.70 32.50 49.32 32.50 49.32 29.38
R = 2/3 22.20 35.00 51.82 35.00 51.82 31.88
R = 3/4 23.70 36.50 53.32 36.50 53.32 33.38
Allowance for man-
made noise
PMMN (dB) 7.87 7.87 0.00 7.87 0.00 7.87
Location probability p (%) 70.00 95.00 95.00 95.00 95.00 99.00
Distribution factor 0.52 1.65 1.65 1.65 1.65 2.33
Standard deviation of
field strength (dB) 3.80 3.80 3.80 8.20 8.20 8.20
Standard deviation of
building penetration loss b(dB) 0.00 3.00 3.00 0.00 0.00 0.00
Combined standard
deviation of field
strength
c (dB) 3.80 4.84 4.84 8.20 8.20 8.20
Location correction
factor
Cl (dB) 1.98 7.99 7.99 13.53 13.53 19.11
Antenna height loss Lh 0.00 10.00 10.00 10.00 10.00 10.00
Building penetration loss Lb 0.00 9.00 9.00 0.00 0.00 0.00
Minimum median
field-strength level
Emed
(dB(V/m))
R = 1/2 29.55 67.36 76.31 63.90 72.85 66.36
R = 2/3 32.05 69.86 78.81 66.40 75.35 68.86
R = 3/4 33.55 71.36 80.31 67.90 76.85 70.36

78 Rep. ITU-R BS.2214-1
5 Sharing parameters
5.1 Out-of-band emissions
The spectrum masks for RAVIS transmission (for three types of channel bandwidth) compared to
spectrum mask for analogue FM (according to ETSI EN 302 018-1 [7]) are given in Tables 88-91 and
Fig. 3. RAVIS spectrum masks are fitting into analogue FM spectrum mask.
TABLE 88
Spectrum mask for FM transmission
Frequency offset (kHz) Level (dBc)/(1 kHz)
0 0
100 0
200 −80
300 −85
400 −85
TABLE 89
Spectrum mask for RAVIS transmission,
100 kHz channel bandwidth
Frequency offset (kHz) Level (dBc)/(1 kHz)
0 −20
50 −20
70 −50
100 −70
200 −80
300 −85
400 −85
TABLE 90
Spectrum mask for RAVIS transmission,
200 kHz channel bandwidth
Frequency offset (kHz) Level (dBc)/(1 kHz)
0 −23
100 −23
120 −50
150 −70
200 −80
300 −85
400 −85

Rep. ITU-R BS.2214-1 79
TABLE 91
Spectrum mask for RAVIS transmission,
250 kHz channel bandwidth
Frequency offset (kHz) Level (dBc)/(1 kHz)
0 −24
125 −24
145 −50
175 −70
200 −80
300 −85
400 −85
FIGURE 3
Spectrum mask for RAVIS and FM transmission
5.2 Protection ratios
5.2.1 Protection ratios for FM
Basic protection ratios for FM interfered with by RAVIS are given in Table 92.
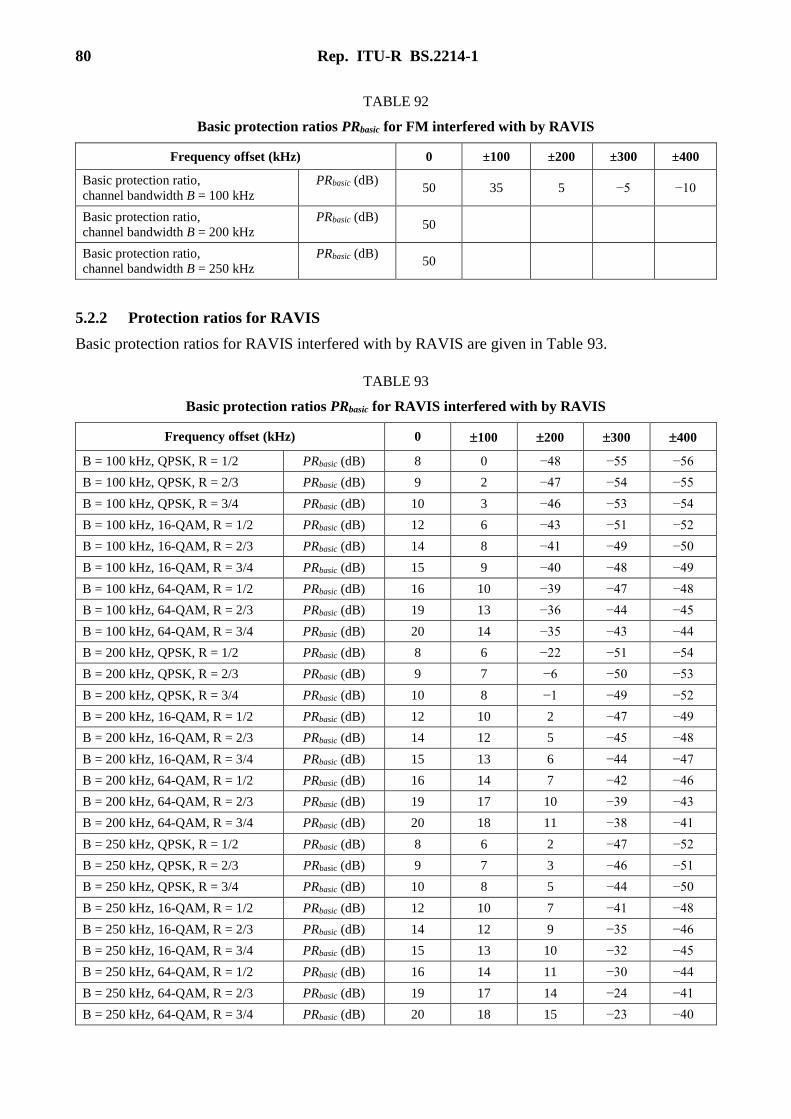
80 Rep. ITU-R BS.2214-1
TABLE 92
Basic protection ratios PRbasic for FM interfered with by RAVIS
Frequency offset (kHz) 0 ±100 ±200 ±300 ±400
Basic protection ratio,
channel bandwidth B = 100 kHz
PRbasic (dB) 50 35 5 −5 −10
Basic protection ratio,
channel bandwidth B = 200 kHz
PRbasic (dB) 50
Basic protection ratio,
channel bandwidth B = 250 kHz
PRbasic (dB) 50
5.2.2 Protection ratios for RAVIS
Basic protection ratios for RAVIS interfered with by RAVIS are given in Table 93.
TABLE 93
Basic protection ratios PRbasic for RAVIS interfered with by RAVIS
Frequency offset (kHz) 0 100 200 300 400
B = 100 kHz, QPSK, R = 1/2 PRbasic (dB) 8 0 −48 −55 −56
B = 100 kHz, QPSK, R = 2/3 PRbasic (dB) 9 2 −47 −54 −55
B = 100 kHz, QPSK, R = 3/4 PRbasic (dB) 10 3 −46 −53 −54
B = 100 kHz, 16-QAM, R = 1/2 PRbasic (dB) 12 6 −43 −51 −52
B = 100 kHz, 16-QAM, R = 2/3 PRbasic (dB) 14 8 −41 −49 −50
B = 100 kHz, 16-QAM, R = 3/4 PRbasic (dB) 15 9 −40 −48 −49
B = 100 kHz, 64-QAM, R = 1/2 PRbasic (dB) 16 10 −39 −47 −48
B = 100 kHz, 64-QAM, R = 2/3 PRbasic (dB) 19 13 −36 −44 −45
B = 100 kHz, 64-QAM, R = 3/4 PRbasic (dB) 20 14 −35 −43 −44
B = 200 kHz, QPSK, R = 1/2 PRbasic (dB) 8 6 −22 −51 −54
B = 200 kHz, QPSK, R = 2/3 PRbasic (dB) 9 7 −6 −50 −53
B = 200 kHz, QPSK, R = 3/4 PRbasic (dB) 10 8 −1 −49 −52
B = 200 kHz, 16-QAM, R = 1/2 PRbasic (dB) 12 10 2 −47 −49
B = 200 kHz, 16-QAM, R = 2/3 PRbasic (dB) 14 12 5 −45 −48
B = 200 kHz, 16-QAM, R = 3/4 PRbasic (dB) 15 13 6 −44 −47
B = 200 kHz, 64-QAM, R = 1/2 PRbasic (dB) 16 14 7 −42 −46
B = 200 kHz, 64-QAM, R = 2/3 PRbasic (dB) 19 17 10 −39 −43
B = 200 kHz, 64-QAM, R = 3/4 PRbasic (dB) 20 18 11 −38 −41
B = 250 kHz, QPSK, R = 1/2 PRbasic (dB) 8 6 2 −47 −52
B = 250 kHz, QPSK, R = 2/3 PRbasic (dB) 9 7 3 −46 −51
B = 250 kHz, QPSK, R = 3/4 PRbasic (dB) 10 8 5 −44 −50
B = 250 kHz, 16-QAM, R = 1/2 PRbasic (dB) 12 10 7 −41 −48
B = 250 kHz, 16-QAM, R = 2/3 PRbasic (dB) 14 12 9 −35 −46
B = 250 kHz, 16-QAM, R = 3/4 PRbasic (dB) 15 13 10 −32 −45
B = 250 kHz, 64-QAM, R = 1/2 PRbasic (dB) 16 14 11 −30 −44
B = 250 kHz, 64-QAM, R = 2/3 PRbasic (dB) 19 17 14 −24 −41
B = 250 kHz, 64-QAM, R = 3/4 PRbasic (dB) 20 18 15 −23 −40

Rep. ITU-R BS.2214-1 81
Basic protection ratios for RAVIS interfered with by FM are given in Table 94.
TABLE 94
Basic protection ratios PRbasic for RAVIS interfered with by RAVIS
Frequency offset (kHz) 0 100 200 300 400
B = 100 kHz, QPSK, R = 1/2 PRbasic (dB) 8 28 20 −55 −56
B = 100 kHz, QPSK, R = 2/3 PRbasic (dB) 9 29 22 −54 −55
B = 100 kHz, QPSK, R = 3/4 PRbasic (dB) 10 30 23 −53 −54
B = 100 kHz, 16-QAM, R = 1/2 PRbasic (dB) 12 29 25 −51 −52
B = 100 kHz, 16-QAM, R = 2/3 PRbasic (dB) 14 26 27 −49 −50
B = 100 kHz, 16-QAM, R = 3/4 PRbasic (dB) 15 25 28 −48 −49
B = 100 kHz, 64-QAM, R = 1/2 PRbasic (dB) 16 24 29 −47 −48
B = 100 kHz, 64-QAM, R = 2/3 PRbasic (dB) 19 21 32 −44 −45
B = 100 kHz, 64-QAM, R = 3/4 PRbasic (dB) 20 20 33 −43 −44
B = 200 kHz, QPSK, R = 1/2 PRbasic (dB) 8 30 26 −51 −54
B = 200 kHz, QPSK, R = 2/3 PRbasic (dB) 9 31 27 −49 −53
B = 200 kHz, QPSK, R = 3/4 PRbasic (dB) 10 32 28 −48 −51
B = 200 kHz, 16-QAM, R = 1/2 PRbasic (dB) 12 34 30 −46 −49
B = 200 kHz, 16-QAM, R = 2/3 PRbasic (dB) 14 36 32 −45 −47
B = 200 kHz, 16-QAM, R = 3/4 PRbasic (dB) 15 37 33 −44 −46
B = 200 kHz, 64-QAM, R = 1/2 PRbasic (dB) 16 38 34 −43 −45
B = 200 kHz, 64-QAM, R = 2/3 PRbasic (dB) 19 41 37 −40 −42
B = 200 kHz, 64-QAM, R = 3/4 PRbasic (dB) 20 42 38 −39 −39
B = 250 kHz, QPSK, R = 1/2 PRbasic (dB) 8 30 27 −45 −52
B = 250 kHz, QPSK, R = 2/3 PRbasic (dB) 9 31 28 7 −51
B = 250 kHz, QPSK, R = 3/4 PRbasic (dB) 10 32 29 16 −50
B = 250 kHz, 16-QAM, R = 1/2 PRbasic (dB) 12 34 31 20 −48
B = 250 kHz, 16-QAM, R = 2/3 PRbasic (dB) 14 36 33 23 −46
B = 250 kHz, 16-QAM, R = 3/4 PRbasic (dB) 15 37 34 24 −45
B = 250 kHz, 64-QAM, R = 1/2 PRbasic (dB) 16 38 35 25 −44
B = 250 kHz, 64-QAM, R = 2/3 PRbasic (dB) 19 41 38 28 −41
B = 250 kHz, 64-QAM, R = 3/4 PRbasic (dB) 20 42 39 30 −40
5.3 Sharing criteria with other services
The potential interference from RAVIS to the services in adjacent frequency ranges (for example, to
aeronautical radionavigation service in the band above 108.0 MHz) is not higher as the one of
analogue FM service.

82 Rep. ITU-R BS.2214-1
6 References
[1] ETSI ES 201 980: Digital Radio Mondiale (DRM); System Specification.
[2] GE06 – Final Acts of the Regional Radiocommunication Conference for planning of the digital
terrestrial broadcasting service in parts of Regions 1 and 3, in the frequency bands 174-230 MHz and
470-862 MHz (RRC-06) Annex 3: Technical basis and characteristics.
[3] EBU-TECH 3317 [July, 2007] Planning parameters for hand held reception concerning the use of
DVB-H and T-DMB in Bands III, IV, V and the 1.5 GHz band.
[5] GE84 – Final Acts of the Regional Administrative Conference for the Planning of VHF Sound
Broadcasting (Region 1 and Part of Region 3); Geneva 1984.
[7] ETSI EN 302 018-1: Electromagnetic compatibility and Radio spectrum Matters (ERM);
Transmitting equipment for the Frequency Modulated (FM) sound broadcasting service.
GOST R 54309-2011, Realtime audiovisual information system (RAVIS). Framing structure, channel
coding and modulation for digital terrestrial narrowband broadcasting system for VHF band.
Technical specification.
______________