planning to evaluate earned, social/digital media campaigns … · planning to evaluate earned,...
TRANSCRIPT
Planning to Evaluate Earned, Social/Digital Media Campaigns
OSH Media Network WebinarFebruary 18, 2016
@SherryEmery
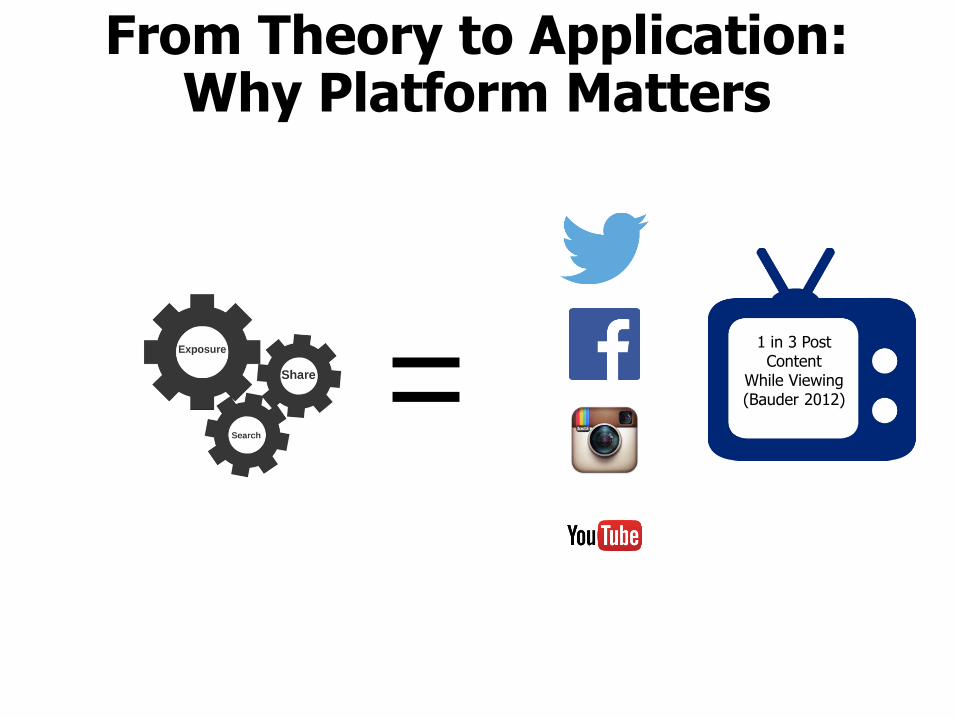
From Theory to Application: Why Platform Matters
=1 in 3 Post Content
While Viewing(Bauder 2012)
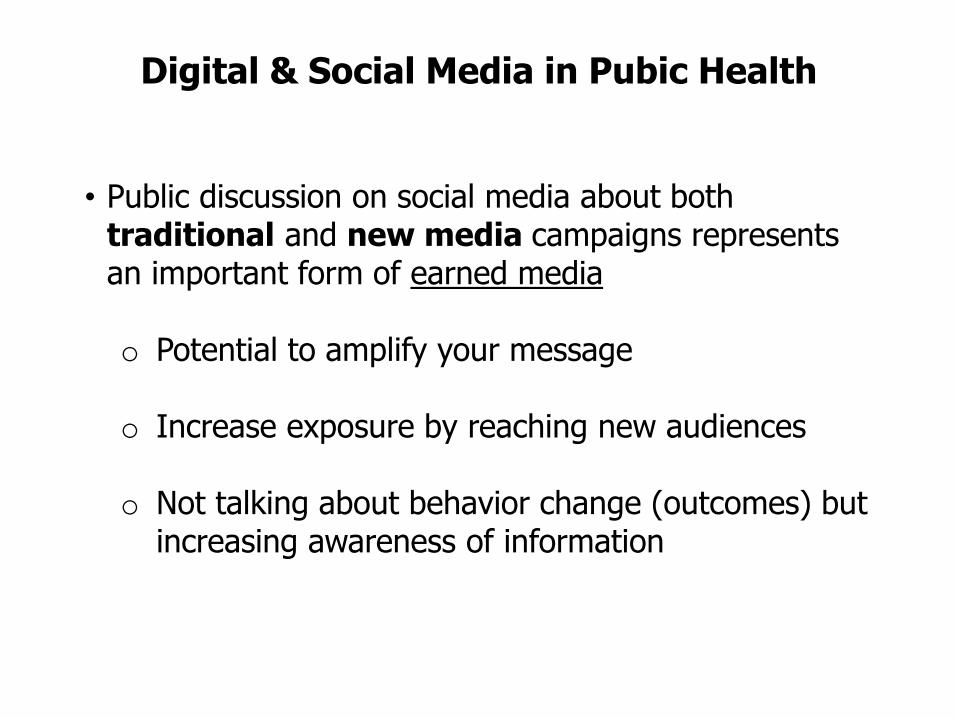
Digital & Social Media in Pubic Health
• Public discussion on social media about both traditional and new media campaigns represents an important form of earned media
o Potential to amplify your message
o Increase exposure by reaching new audiences
o Not talking about behavior change (outcomes) but increasing awareness of information
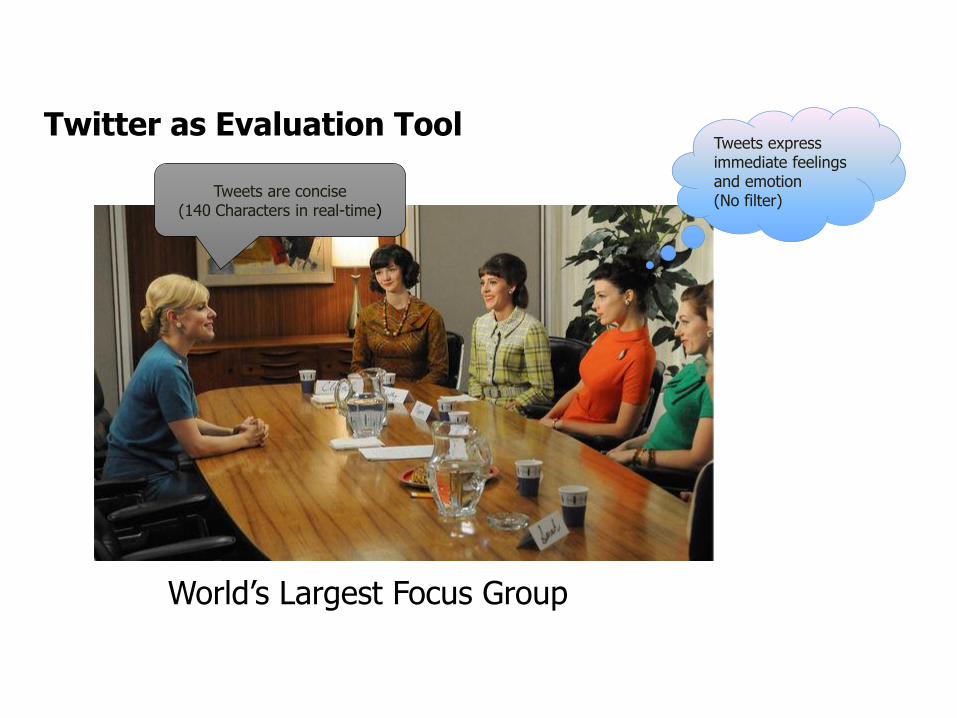
Twitter as Evaluation Tool
World’s Largest Focus Group
Tweets are concise (140 Characters in real-time)
Tweets express immediate feelings and emotion (No filter)
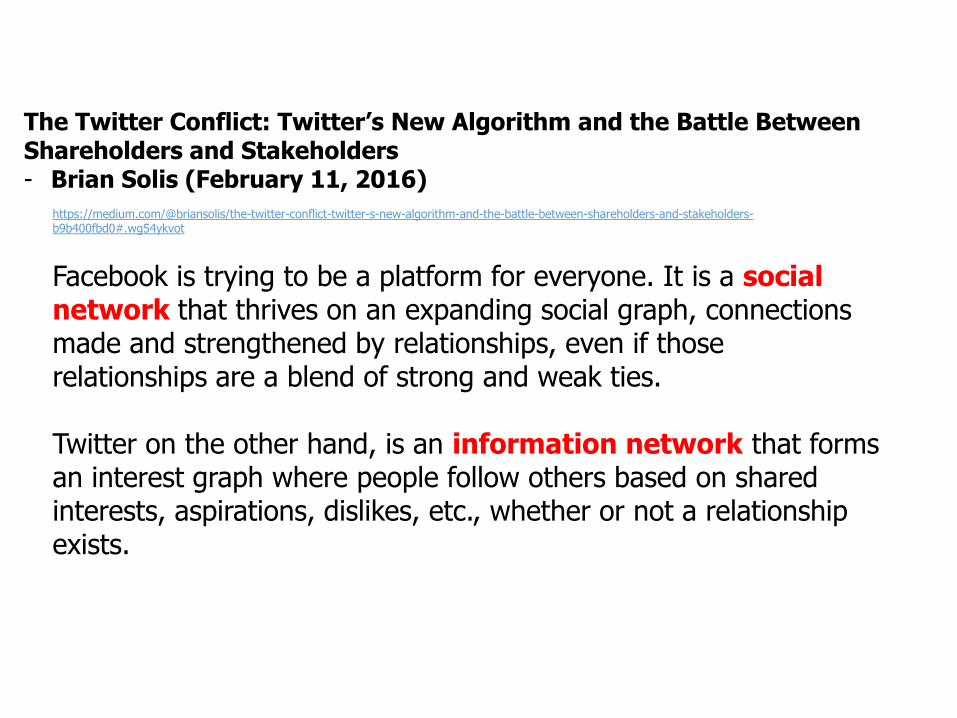
Facebook is trying to be a platform for everyone. It is a social network that thrives on an expanding social graph, connections made and strengthened by relationships, even if those relationships are a blend of strong and weak ties.
Twitter on the other hand, is an information network that forms an interest graph where people follow others based on shared interests, aspirations, dislikes, etc., whether or not a relationship exists.
The Twitter Conflict: Twitter’s New Algorithm and the Battle Between Shareholders and Stakeholders- Brian Solis (February 11, 2016)
https://medium.com/@briansolis/the-twitter-conflict-twitter-s-new-algorithm-and-the-battle-between-shareholders-and-stakeholders-b9b400fbd0#.wg54ykvot
@EmanHAly
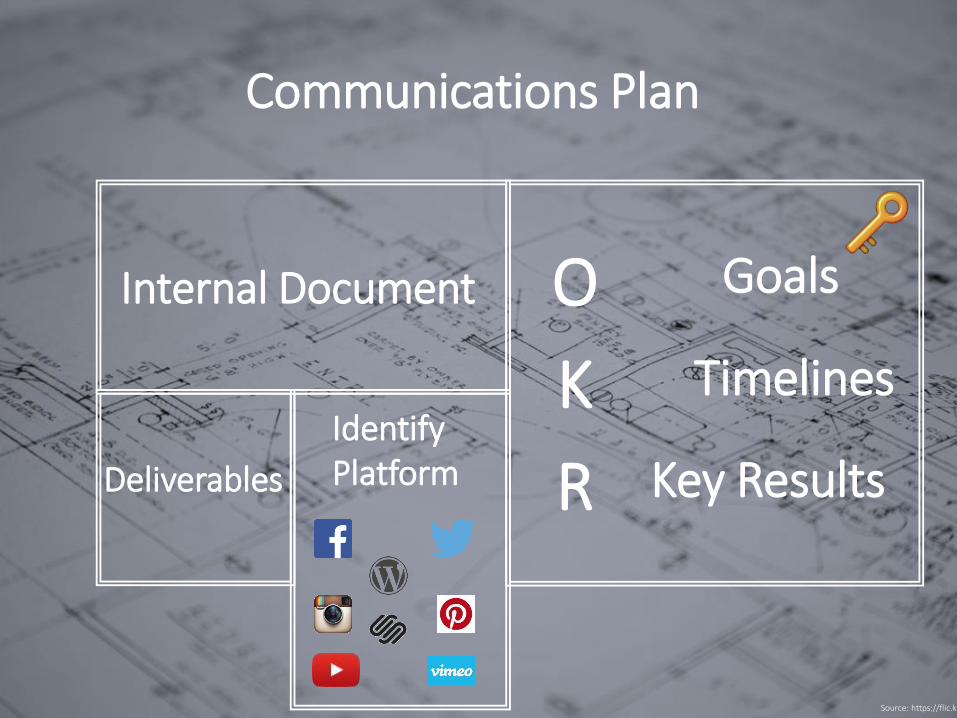
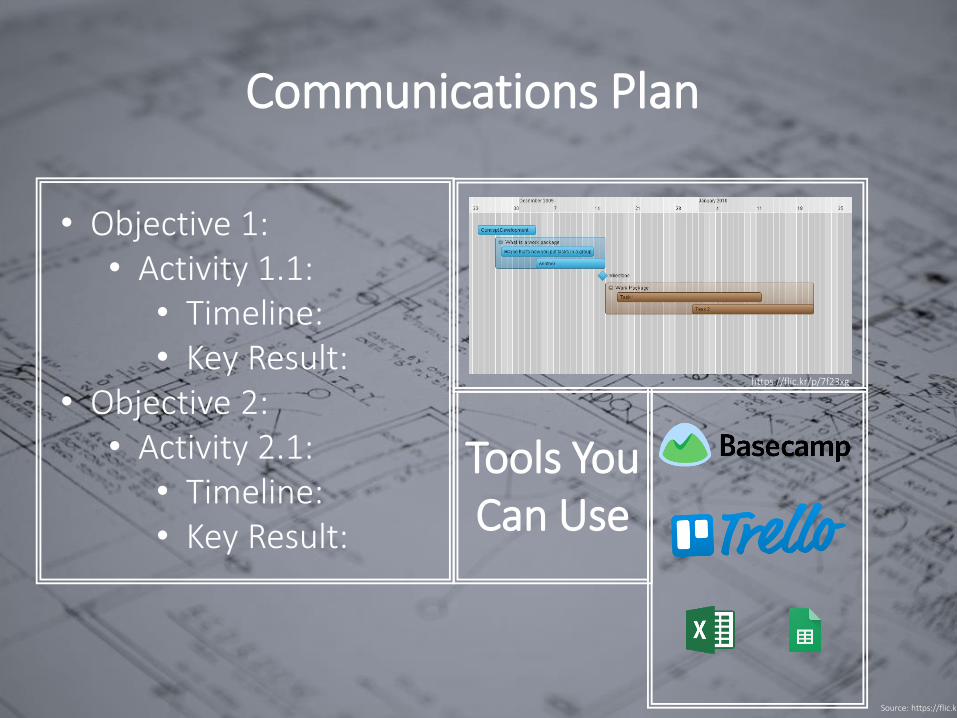
Communications Plan
Source: https://flic.kr/p/6K9jC4
Internal Document O
K
R
Goals
Timelines
Key ResultsDeliverables
IdentifyPlatform
Communications Plan
Source: https://flic.kr/p/6K9jC4
Tools You Can Use
• Objective 1:• Activity 1.1:
• Timeline: • Key Result:
• Objective 2:• Activity 2.1:
• Timeline: • Key Result:
https://flic.kr/p/7f23xg
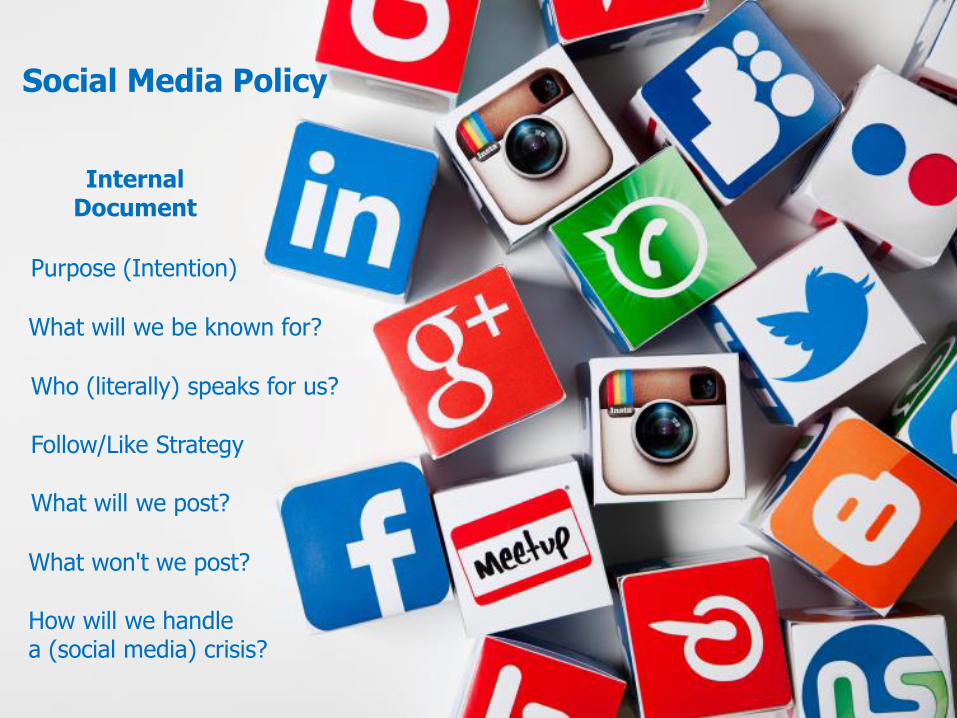
Purpose (Intention)
What will we be known for?
Who (literally) speaks for us?
Follow/Like Strategy
What will we post?
What won't we post?
How will we handle a (social media) crisis?
Social Media Policy
InternalDocument
Source: https://flic.kr/p/opGxp5
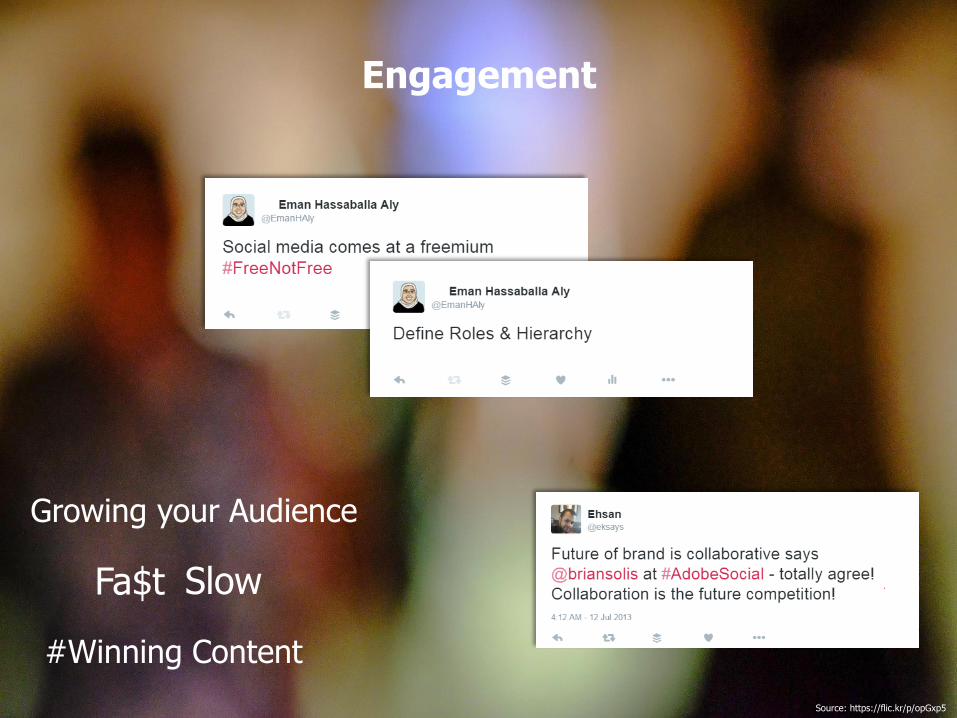
Engagement
Growing your Audience
SlowFa$t
#Winning Content
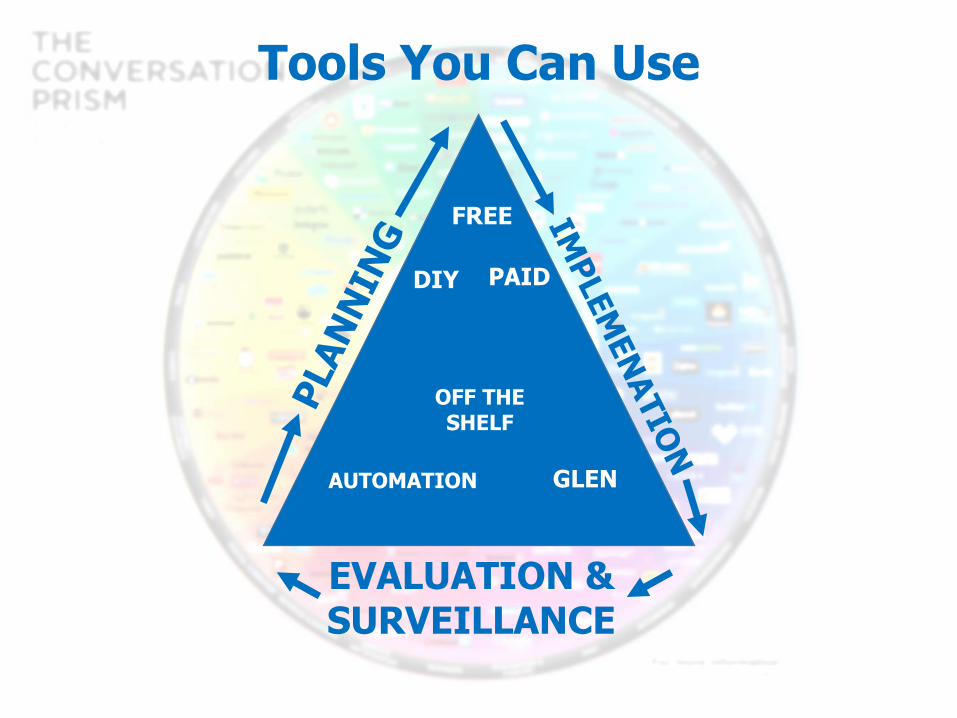
EVALUATION &SURVEILLANCE
Tools You Can Use
DIY
OFF THESHELF
AUTOMATION
FREE
PAID
GLEN
@GlenSzczypka
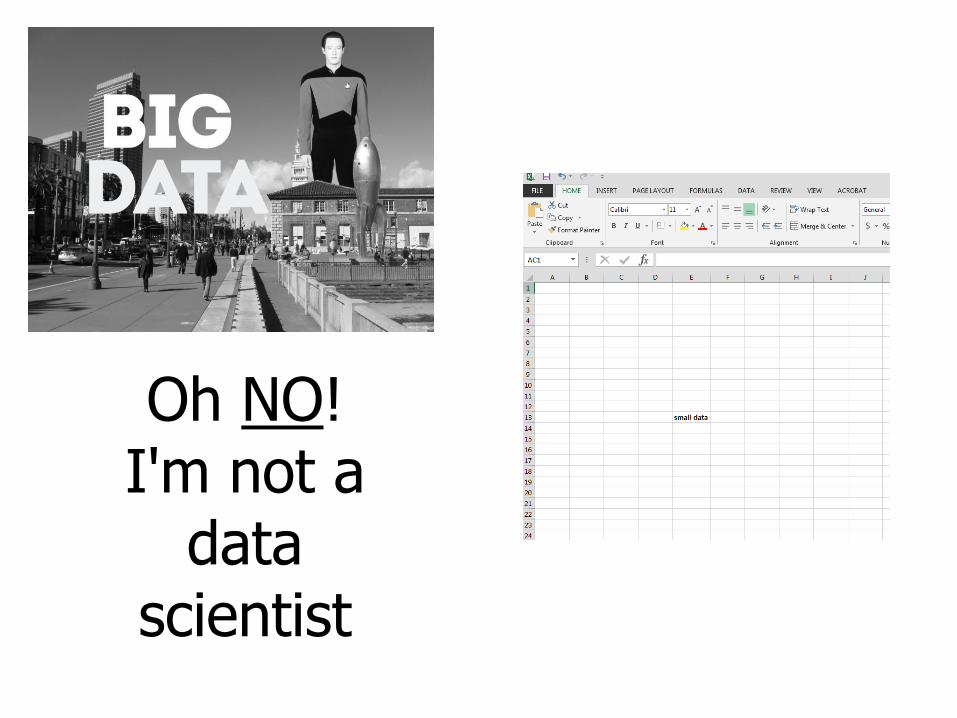
Oh NO! I'm not a
data scientist
Why Data Science Needs Subject Matter Expertise: Data Have Meaning- Bob Hayes (February 1, 2016)http://businessoverbroadway.com/why-data-science-needs-subject-matter-expertise-data-have-meaning
The Meaning of Your Data
Data are more than a string of numbers. They have meaning. They represent something of interest.
Every time we use a metric, we need to ask, "What does that number mean? What does it measure?“
You need subject matter experts to help evaluate your measures.
You are the subject matter experts of your data
Social Media Evaluation in Pubic Health
• By gaining a better understanding of how much the general public is talking about a media campaign, and what they are saying, can provide useful feedback :
o Identify particular barriers to message acceptance by specific populations
o Determine which messages are resonate best
o Develop specific messages for future social media campaigns and traditional media efforts that might have a greater impact
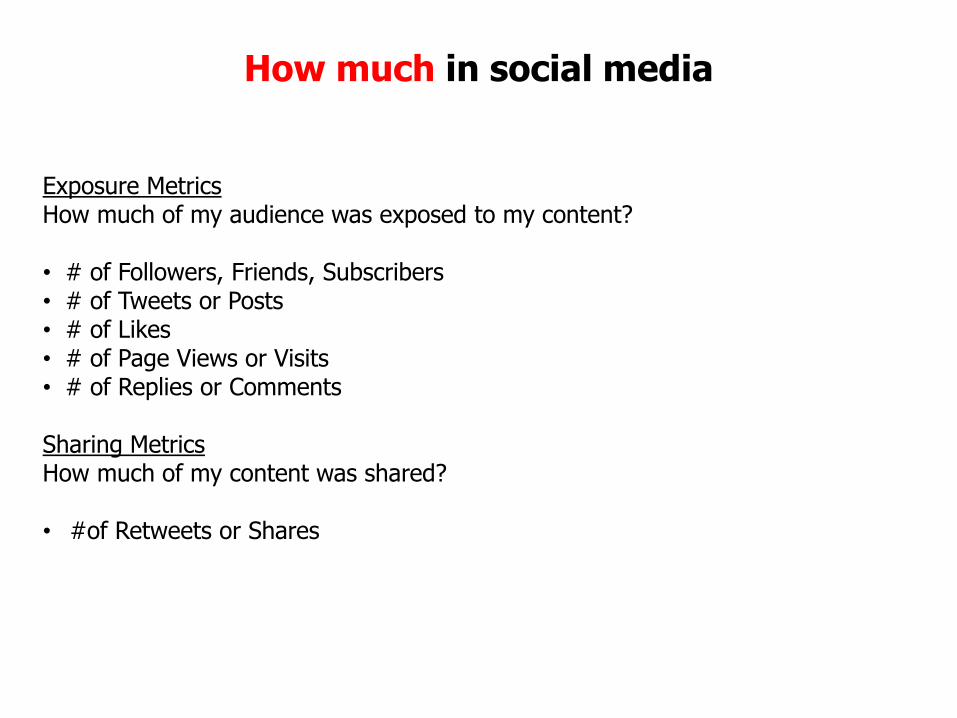
How much in social media
Exposure Metrics How much of my audience was exposed to my content?
• # of Followers, Friends, Subscribers • # of Tweets or Posts• # of Likes• # of Page Views or Visits• # of Replies or Comments
Sharing Metrics How much of my content was shared?
• #of Retweets or Shares
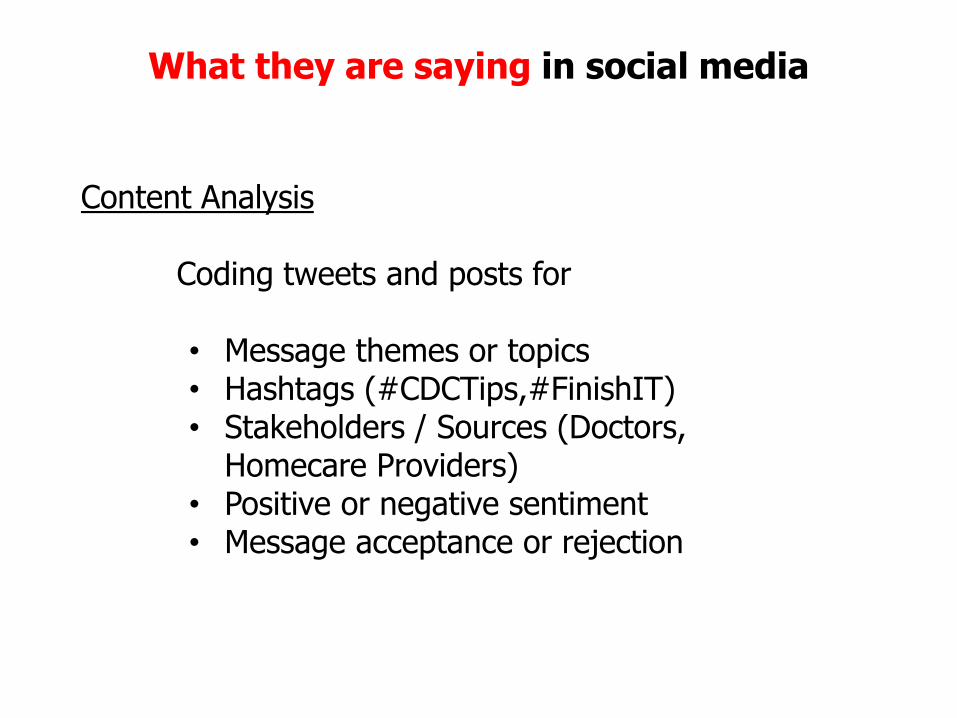
What they are saying in social media
Content Analysis
Coding tweets and posts for
• Message themes or topics• Hashtags (#CDCTips,#FinishIT)• Stakeholders / Sources (Doctors,
Homecare Providers)• Positive or negative sentiment• Message acceptance or rejection
Categorizing Engagement for Effective Messaging
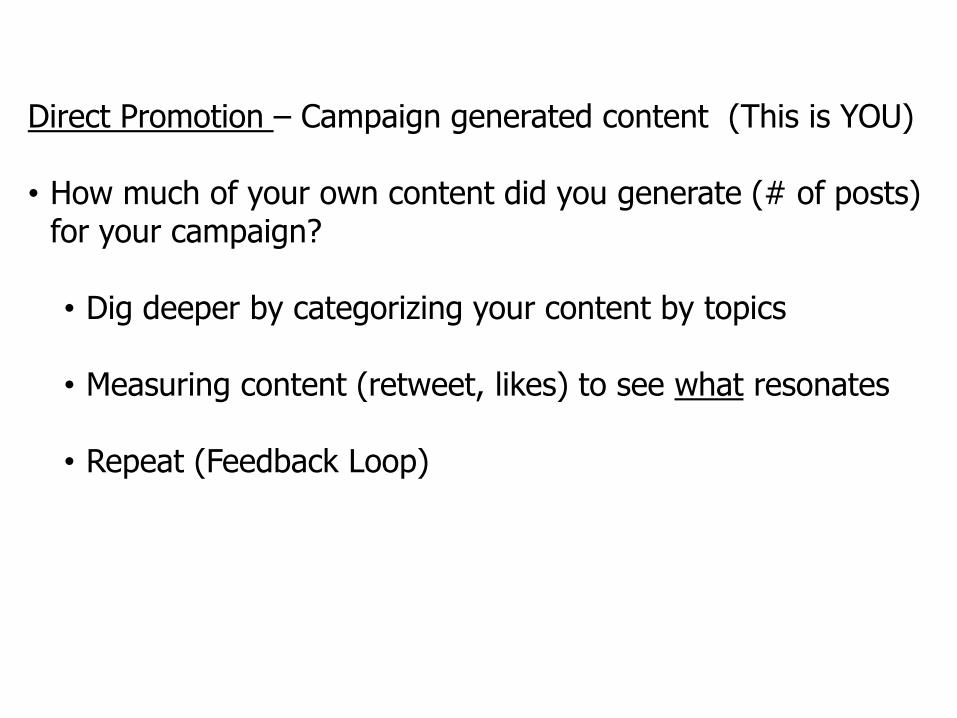
Direct Promotion – Campaign generated content (This is YOU)
• How much of your own content did you generate (# of posts) for your campaign?
• Dig deeper by categorizing your content by topics
• Measuring content (retweet, likes) to see what resonates
• Repeat (Feedback Loop)

Earned Promotion – Posts containing links to news, blogs, videos, own content, etc.
• How much of your own content was regenerated or shared?
• Not looking at campaign generated content but can include retweets or reposts?
• Dig deeper by categorizing by stakeholder or source to see who the content resonated with
• Repeat (Feedback Loop)
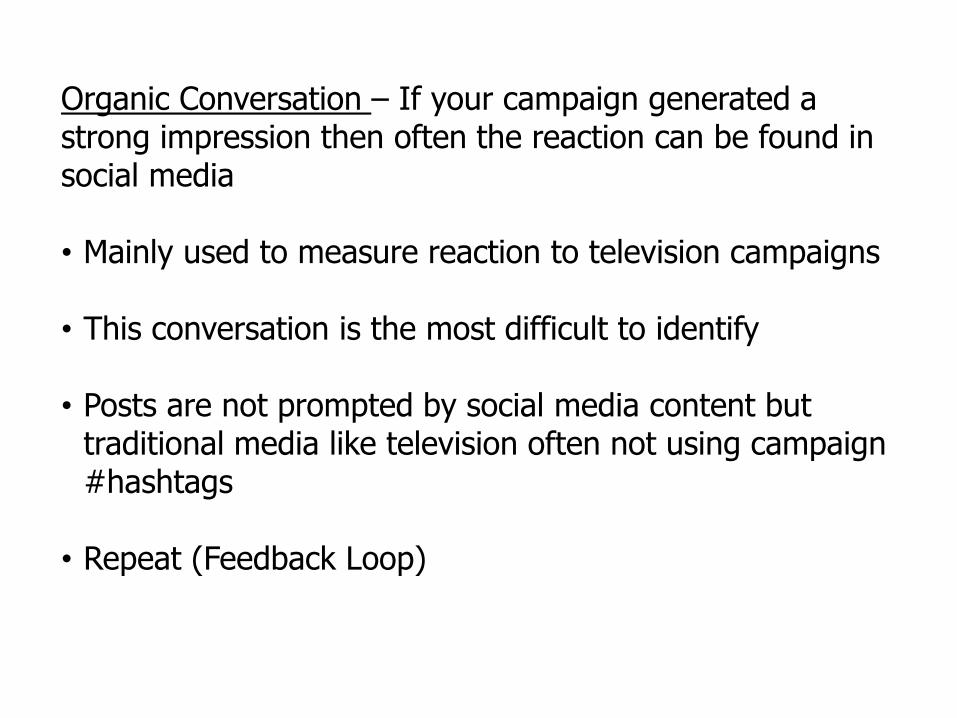
Organic Conversation – If your campaign generated a strong impression then often the reaction can be found in social media
• Mainly used to measure reaction to television campaigns
• This conversation is the most difficult to identify
• Posts are not prompted by social media content but traditional media like television often not using campaign #hashtags
• Repeat (Feedback Loop)

Methods of Analyzing Social Data
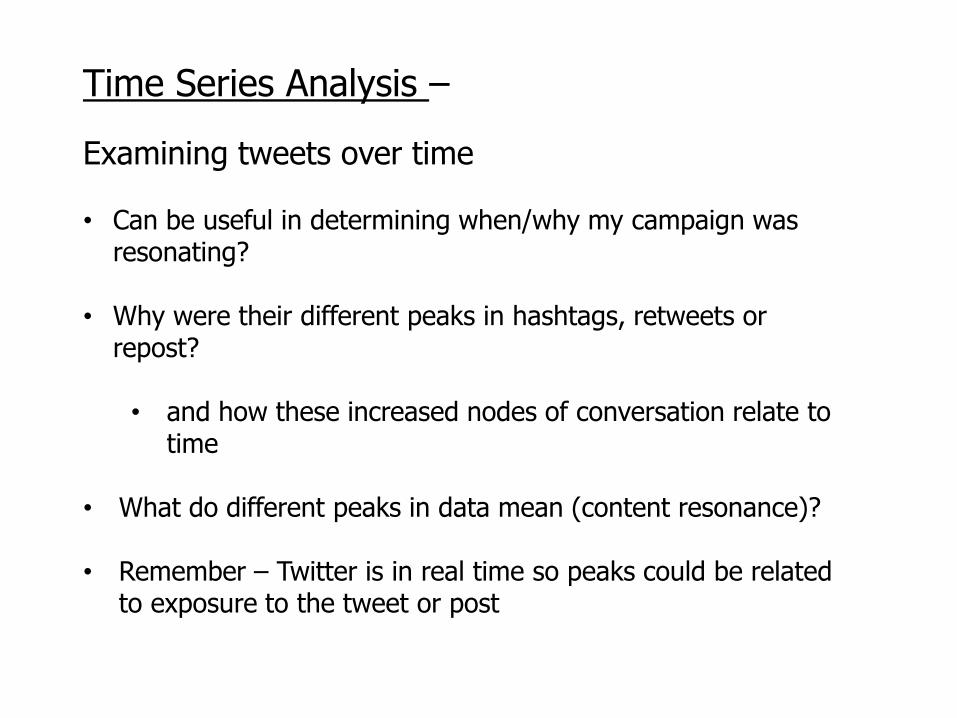
Time Series Analysis –
Examining tweets over time
• Can be useful in determining when/why my campaign was resonating?
• Why were their different peaks in hashtags, retweets or repost?
• and how these increased nodes of conversation relate to time
• What do different peaks in data mean (content resonance)?
• Remember – Twitter is in real time so peaks could be related to exposure to the tweet or post
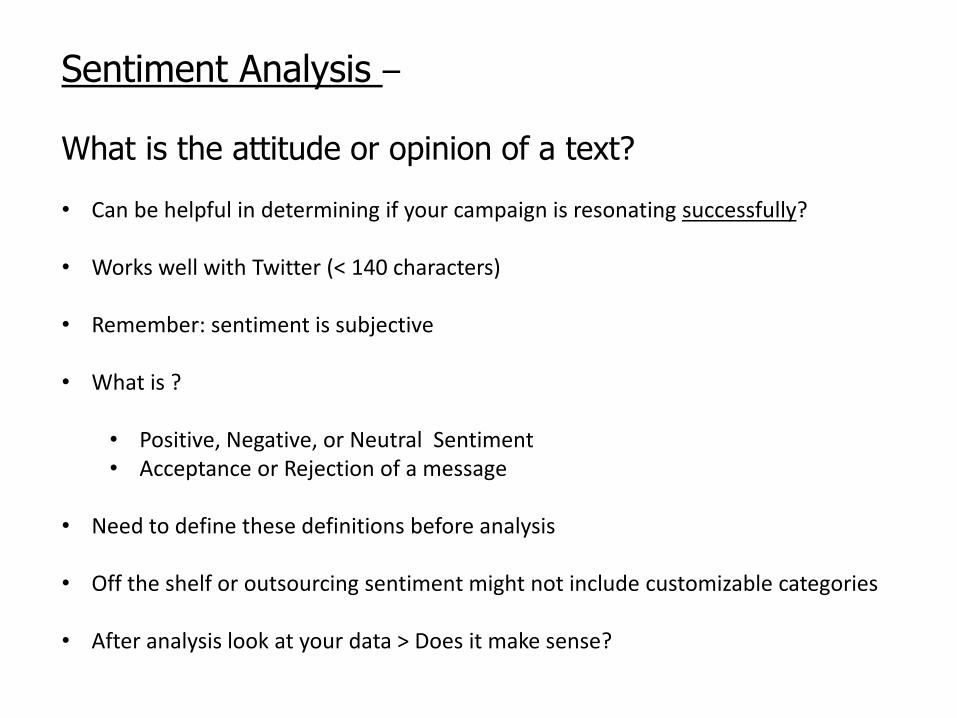
Sentiment Analysis –
What is the attitude or opinion of a text?
• Can be helpful in determining if your campaign is resonating successfully?
• Works well with Twitter (< 140 characters)
• Remember: sentiment is subjective
• What is ?
• Positive, Negative, or Neutral Sentiment • Acceptance or Rejection of a message
• Need to define these definitions before analysis
• Off the shelf or outsourcing sentiment might not include customizable categories
• After analysis look at your data > Does it make sense?
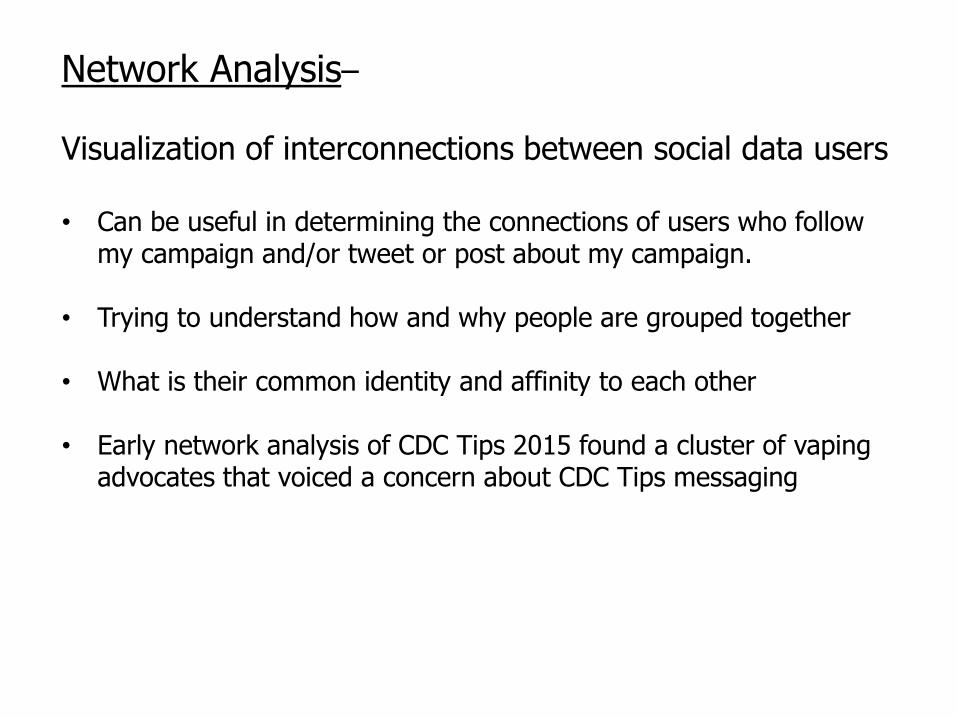
Network Analysis–
Visualization of interconnections between social data users
• Can be useful in determining the connections of users who follow my campaign and/or tweet or post about my campaign.
• Trying to understand how and why people are grouped together
• What is their common identity and affinity to each other
• Early network analysis of CDC Tips 2015 found a cluster of vaping advocates that voiced a concern about CDC Tips messaging
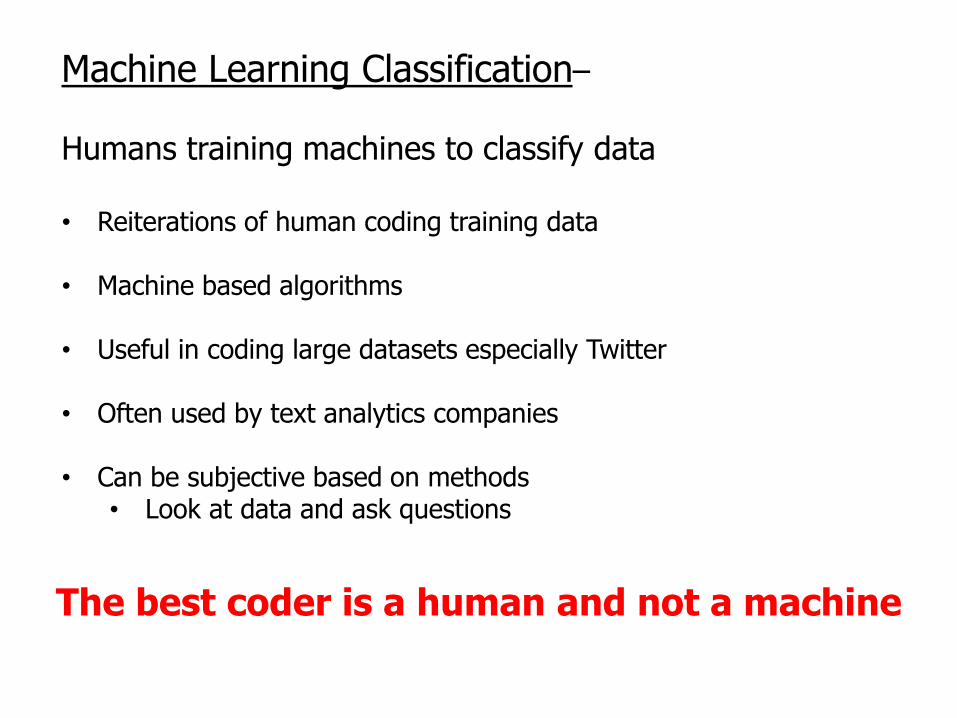
Machine Learning Classification–
Humans training machines to classify data
• Reiterations of human coding training data
• Machine based algorithms
• Useful in coding large datasets especially Twitter
• Often used by text analytics companies
• Can be subjective based on methods• Look at data and ask questions
The best coder is a human and not a machine
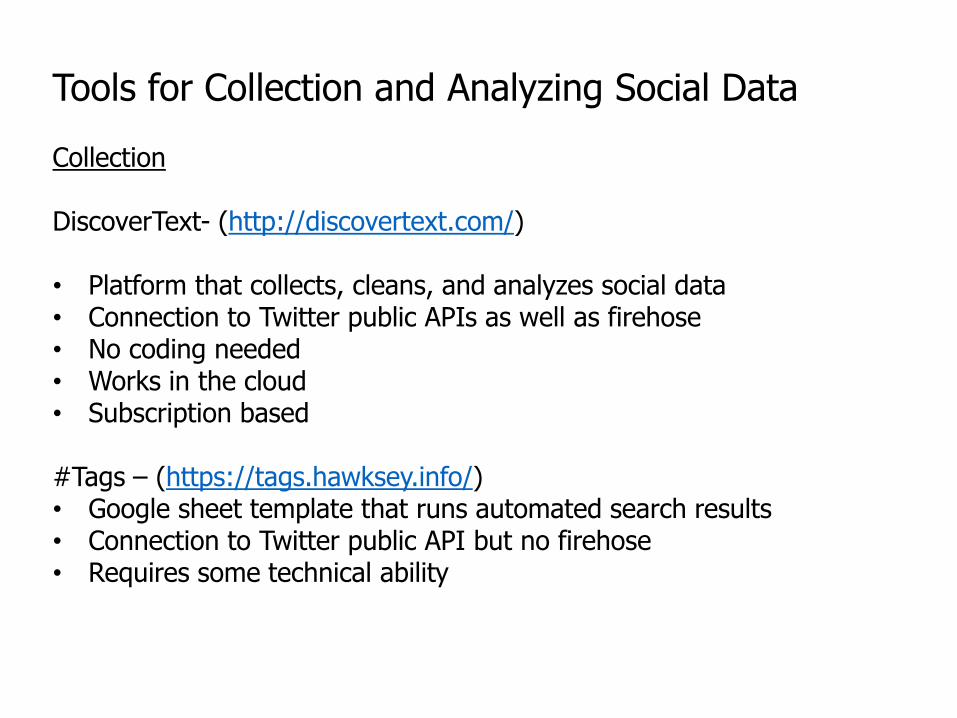
Tools for Collection and Analyzing Social Data
Collection
DiscoverText- (http://discovertext.com/)
• Platform that collects, cleans, and analyzes social data • Connection to Twitter public APIs as well as firehose• No coding needed• Works in the cloud• Subscription based
#Tags – (https://tags.hawksey.info/)• Google sheet template that runs automated search results • Connection to Twitter public API but no firehose• Requires some technical ability
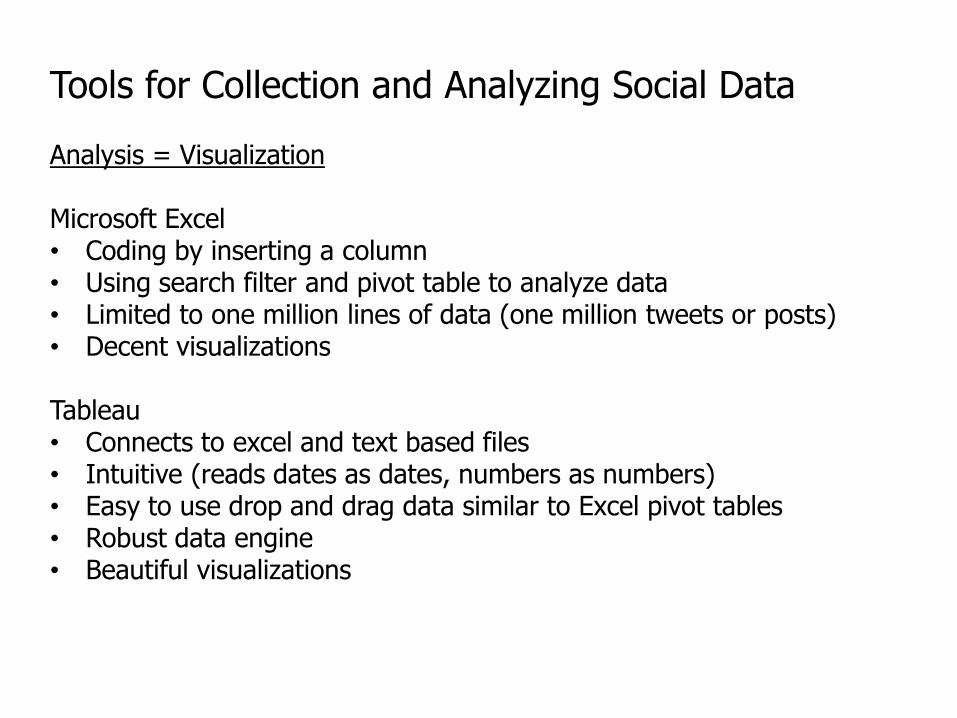
Tools for Collection and Analyzing Social Data
Analysis = Visualization
Microsoft Excel• Coding by inserting a column• Using search filter and pivot table to analyze data• Limited to one million lines of data (one million tweets or posts)• Decent visualizations
Tableau• Connects to excel and text based files• Intuitive (reads dates as dates, numbers as numbers)• Easy to use drop and drag data similar to Excel pivot tables• Robust data engine• Beautiful visualizations
Health Media Collaboratory Analysis Examples
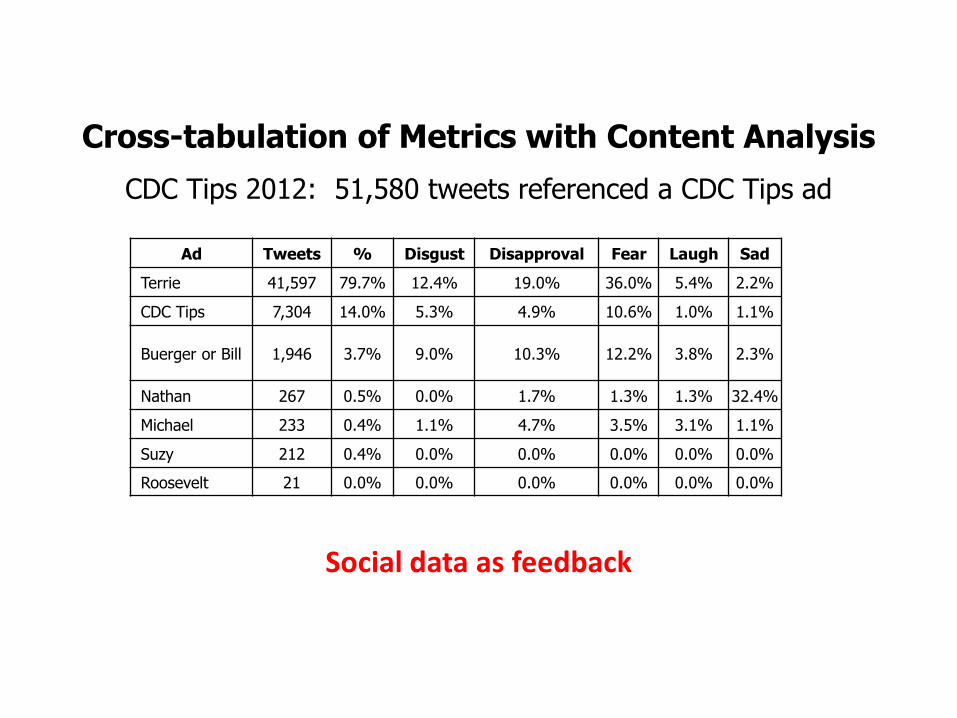
Cross-tabulation of Metrics with Content Analysis
Ad Tweets % Disgust Disapproval Fear Laugh Sad
Terrie 41,597 79.7% 12.4% 19.0% 36.0% 5.4% 2.2%
CDC Tips 7,304 14.0% 5.3% 4.9% 10.6% 1.0% 1.1%
Buerger or Bill 1,946 3.7% 9.0% 10.3% 12.2% 3.8% 2.3%
Nathan 267 0.5% 0.0% 1.7% 1.3% 1.3% 32.4%
Michael 233 0.4% 1.1% 4.7% 3.5% 3.1% 1.1%
Suzy 212 0.4% 0.0% 0.0% 0.0% 0.0% 0.0%
Roosevelt 21 0.0% 0.0% 0.0% 0.0% 0.0% 0.0%
CDC Tips 2012: 51,580 tweets referenced a CDC Tips ad
Social data as feedback
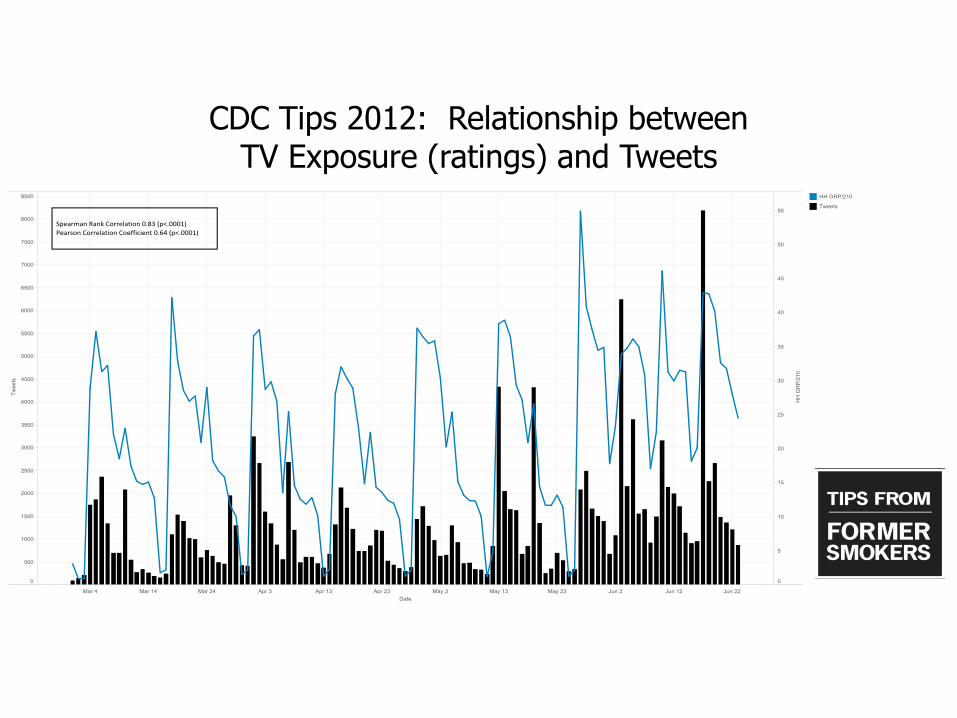
CDC Tips 2012: Relationship between TV Exposure (ratings) and Tweets
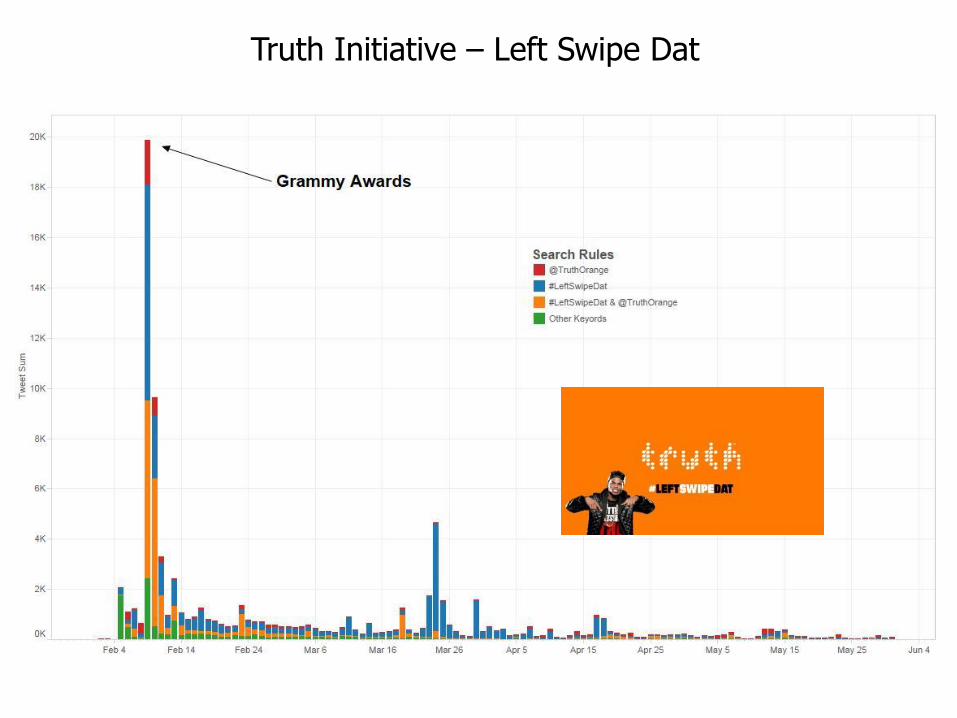
Truth Initiative – Left Swipe Dat
@HMCollab
bit.ly/bloghmc
Stay in Touch
bit.ly/hmctools