plans for the meter class autonomous telescope and ... · plans for the meter class autonomous...
TRANSCRIPT
Plans for the Meter Class Autonomous Telescopeand
Potential Coordinated Measurements With Kwajalein Radars
Gene Stansbery, Paul Kervin, Mark Mulrooney
The National Aeronautics and Space Administration’s (NASA) Orbital Debris Program Office isteaming with the US Air Force Research Laboratory’s (AFRL) Maui Optical Site to deploy amoderate field-of-view, 1.3 m aperture, optical telescope for orbital debris applications. Thetelescope will be located on the island of Legan in the Kwajalein Atoll and is scheduled forcompletion in the Spring of 2011. The telescope is intended to sample both low inclination/higheccentricity orbits and near geosynchronous orbits. The telescope will have a 1 ° diagonal field-of-view on a 4K x 4K CCD. The telescope is expected to be able to detect 10-cm diameterdebris at geosynchronous altitudes (5 sec exposure assuming a spherical specular phasefunction w/ albedo =0.13). Once operational, the telescope has the potential of conductingsimultaneous observations with radars operated by the US Army at Kwajalein Atoll (USAKA)and located on the island of Roi-Namur, approximately 55 km to the north of Legan. Fourradars, representing 6 frequency bands, are available for use: ALTAIR (ARPA-Long RangeTracking and Instrumentation Radar) operating at VHF & UHF, TRADEX (Target Resolution andDiscrimination Experiment) operating at L-band and S-band, ALCOR (ARPA-Lincoln C-bandObservables Radar) operating at S-band, and MMW (Millimeter Wave) Radar operating at Ka-band. Also potentially available is the X-band GBRP (Ground Based Radar-Prototype located25 km to the southeast of Legan on the main island of Kwajalein.
https://ntrs.nasa.gov/search.jsp?R=20110007079 2018-06-23T13:19:36+00:00Z

1
Plans for the Meter Class Autonomous Telescope and
Potential Coordinated Measurements with Kwajalein Radars
Gene Stansbery1, Paul Kervin2, Mark Mulrooney3
1NASA/ Orbital Debris Program Office/ Johnson Space Center 2U.S. Air Force Research Laboratory/Maui Optical Site
3ESCG/MEI Technologies
ABSTRACT
The National Aeronautics and Space Administration’s Orbital Debris Program Office is teaming with the U.S. Air Force Research Laboratory’s Maui Optical Site to deploy a moderate field-of-view, 1.3 m aperture, optical telescope for orbital debris applications. The telescope will be located on the island of Legan in the Kwajalein Atoll and is scheduled for completion in the spring of 2011. The telescope is intended to sample both low inclination/high eccentricity orbits and near geosynchronous orbits. The telescope will have a 1° diagonal field-of-view on a 4K x 4K CCD. The telescope is expected to be able to detect 10-cm diameter debris at geosynchronous altitudes (5 sec exposure assuming a spherical specular phase function w/ albedo=0.13). Once operational, the telescope has the potential of conducting simultaneous observations with radars operated by the U.S. Army Space Command and located on the island of Roi-Namur, approximately 47 km to the north of Legan. Four radars, representing six frequency bands, are available for use: ALTAIR (ARPA-Long Range Tracking and Instrumentation Radar) operating at VHF & UHF, TRADEX (Target Resolution and Discrimination Experiment) operating at L-band and S-band, ALCOR (ARPA-Lincoln C-band Observables Radar) operating at S-band, and MMW (Millimeter Wave) Radar operating at Ka-band. Also potentially available is the X-band GBRP (Ground Based Radar-Prototype located 25 km to the southeast of Legan on the main island of Kwajalein.
INTRODUCTION
A real and growing concern for the safety and reliability of Earth orbiting spacecraft is the threat from collision with other orbiting objects including space debris. Even small particles can damage, degrade, or destroy spacecraft due to the very high velocities involved in a collision, on average about 11 km/sec. The first accidental hypervelocity collision between two intact satellites in February 2009 illustrates the danger to operational spacecraft from human made and natural space debris.
The National Aeronautics and Space Administration (NASA) Orbital Debris Program places great emphasis on measurements of the orbital debris environment. All of NASA’s debris environment models are based on these measurements. In addition, there has been a growing interest in Space Situational Awareness in recent years. Both the U.S. and Russia have

2
worldwide sensor networks that track orbiting objects including debris. Despite these efforts, there are some orbital and size regimes that can still be considered as under-sampled. In 2003, NASA and AFRL’s Maui Optical Site (AMOS) began collaboration on a Meter Class Autonomous Telescope (MCAT) specifically to address two of these under-sampled orbit regimes.
METER CLASS AUTONOMOUS TELESCOPE
At the time of this writing, the MCAT is under construction. The concept for the MCAT is to provide a sensor that would sample historically under-sampled orbit regimes. In particular, the U.S. Space Surveillance Network (SSN) has poor coverage of low inclination, high eccentricity orbits. The MCAT is also intended to sample the near geosynchronous (GEO) orbit regime where the current SSN currently catalogs objects typically 1-m and larger in size.
An additional requirement is that the telescope be economical to operate. The concept is for routine scheduling, data collection, data reduction, and analysis to be accomplished without human intervention. However, routine maintenance tasks would still need to be accomplished. Given these requirements, a low latitude site that has an existing technical infrastructure was sought. Kwajalein Atoll in the Marshall Islands was chosen as the location for the MCAT.
Kwajalein Atoll is the home of the Ronald Reagan Ballistic Missile Test Site, or RTS (Reagan Test Site). The RTS is operated by the U.S. Army Space Command and has a long-term lease for the Kwajalein Atoll from the Marshall Island government. As part of the RTS, the Army operates telescopes on several of the atoll’s islands, providing an existing technical workforce familiar with operating and maintaining optical telescopes. Kwajalein is located in the Pacific Ocean at approximately 9°N latitude and 167°E longitude, thus meeting the low latitude requirement. The location is 3400 km southwest of the Maui optical site. This location provides a good overlap of the geosynchronous arc with telescopes located on Maui, but also provides better coverage of sections of the arc between Maui and the next SSN GEO observing site at Diego Garcia.
The main drawback to the Kwajalein location is that it is a sea-level elevation. At sea level, the telescope must look through the entire atmosphere and is subject to weather and clouds at all levels of the atmosphere. However, it does meet all of the other siting criteria. And, tests at the site indicate that the atmosphere appears to have a smooth laminar flow in the area and the seeing may be very good for a sea level site.
After a site survey in 2003, the island of Legan was chosen as the specific location for the MCAT (see Figures 1 and 2). Legan has no permanent residents. There are few lights showing on the island at night and the nearest inhabited island is more than 20 km distant. But, the island does have several telescopes and cameras that are part of the RTS. These existing optical instruments are visited two to three times per week for routine maintenance. The MCAT routine maintenance will be an add-on to this existing maintenance routine.

3
Figure 1. – Kwajalein Atoll with the islands of Kwajalein, Legan, and Roi-Namur identified. Legan is the chosen location for the MCAT. Roi-Namur is the home to the ALTAIR, ALCOR, TRADEX, and MMW
radars. GBRP is located on the main island of Kwajalein.
Figure 2. – Aerial views of Legan.
The MCAT contract for the telescope was awarded in December 2008 to DFM, Inc. Its design is a modified Ritchey-Chrétien with a 1.3 m primary mirror. The system has a focal ratio of f/4 with an 87 mm image circle. Already procured from Spectral Instruments, the camera for the telescope uses an e2v Technologies (brand name) 4K x 4K back-illuminated, charge-coupled device (CCD) with 15 µm pixel size, providing a 0.96° diagonal field-of-view (fov). Figure 3 shows the relative photometric performance of two available CCD coatings when coupled with
4
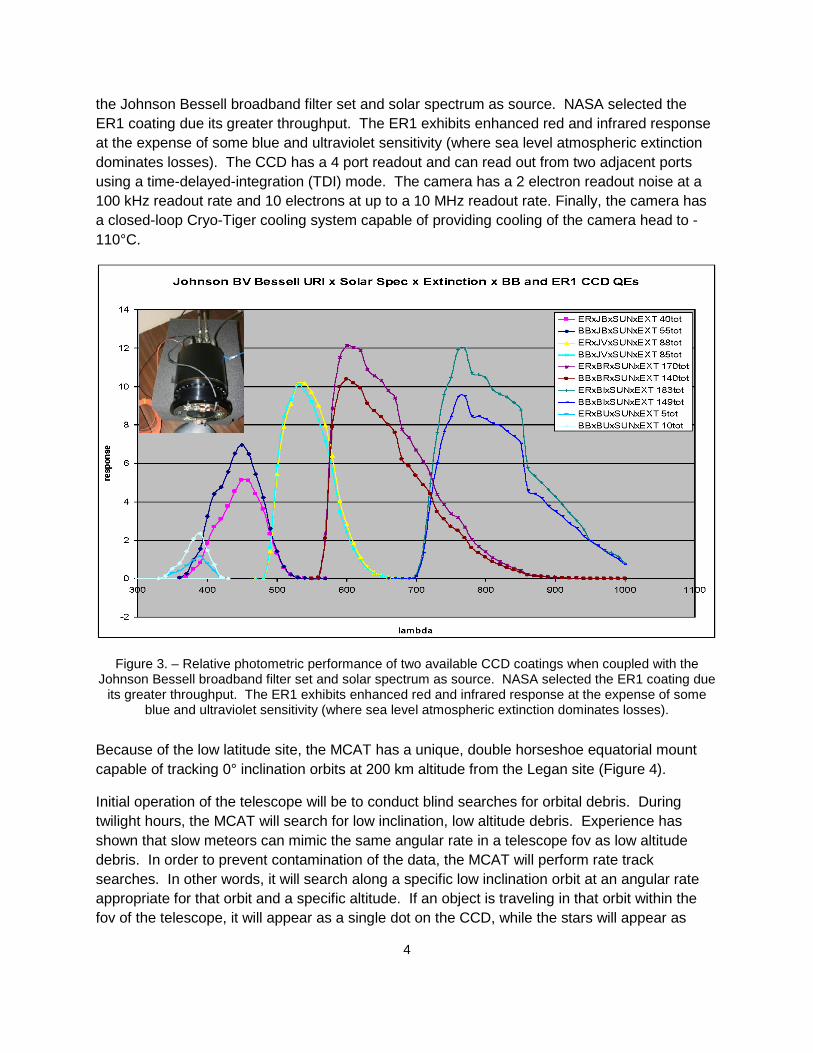
the Johnson Bessell broadband filter set and solar spectrum as source. NASA selected the ER1 coating due its greater throughput. The ER1 exhibits enhanced red and infrared response at the expense of some blue and ultraviolet sensitivity (where sea level atmospheric extinction dominates losses). The CCD has a 4 port readout and can read out from two adjacent ports using a time-delayed-integration (TDI) mode. The camera has a 2 electron readout noise at a 100 kHz readout rate and 10 electrons at up to a 10 MHz readout rate. Finally, the camera has a closed-loop Cryo-Tiger cooling system capable of providing cooling of the camera head to -110°C.
Figure 3. – Relative photometric performance of two available CCD coatings when coupled with the Johnson Bessell broadband filter set and solar spectrum as source. NASA selected the ER1 coating due
its greater throughput. The ER1 exhibits enhanced red and infrared response at the expense of some blue and ultraviolet sensitivity (where sea level atmospheric extinction dominates losses).
Because of the low latitude site, the MCAT has a unique, double horseshoe equatorial mount capable of tracking 0° inclination orbits at 200 km altitude from the Legan site (Figure 4).
Initial operation of the telescope will be to conduct blind searches for orbital debris. During twilight hours, the MCAT will search for low inclination, low altitude debris. Experience has shown that slow meteors can mimic the same angular rate in a telescope fov as low altitude debris. In order to prevent contamination of the data, the MCAT will perform rate track searches. In other words, it will search along a specific low inclination orbit at an angular rate appropriate for that orbit and a specific altitude. If an object is traveling in that orbit within the fov of the telescope, it will appear as a single dot on the CCD, while the stars will appear as

5
streaks. If an object has a slightly different inclination or is at a slightly different altitude, the object will appear as a small streak differing in length or angle from star streaks. High inclination objects and meteors will appear as long streaks and will be ignored in the data processing. This mode has the added benefit that debris of interest will have their light deposited on a relatively few pixels of the CCD, thus increasing the sensitivity of the telescope compared to other operational schemes.
Figure 4. – Double horseshoe mount of the type to be used on the MCAT provides a stable equatorial mount for a low latitude site with the added benefit of unobstructed north polar and south horizon access.
During the middle of the night, the MCAT will search the near GEO altitude regime using more standard search routines. One of the routines under consideration is used by the Michigan Orbital DEbris Survey Telescope (MODEST), currently operational in Chile. In this case, the telescope tracks the RA and DEC at the sidereal rate. During the multi-second exposure, the charge on the CCD is shifted in reverse so that the objects are seen as a point source and the stars are seen as streaks. This mode is known as time delay integration. Thus the system has peak sensitivity to objects with the expected motion of GEO objects. Again, interloping low altitude objects or other objects not of interest will appear as streaks and will be ignored during data reduction.
In addition to these simple blind searches, other, more complex operations are also envisioned. In addition to the MCAT, AFRL and NASA operate a small 35 cm Raven-class telescope on the island of Roi-Namur north of Legan. Although less sensitive than the MCAT, this telescope could be used for follow-up of bright objects using longer integration times on its CCD camera.

6
Also, the U.S. Army operates four large instrumentation radars on Roi-Namur as part of the RTS (Figure 5).
Figure 5. – Four large instrumentation radars located on the island of Roi-Namur, 47 km north of Legan.
RTS RADARS
The ARPA-Long Range Tracking and Instrumentation Radar (ALTAIR) system was developed to gather coherent data on re-entry vehicles and satellites at VHF and UHF frequencies. It is also used by the SSN as a deep space sensor to track GEO and geo-transfer satellites. The radar has a 46 m dish antenna with a focal point VHF feed and a Cassegrain UHF feed. It utilizes a frequency selective subreflector, allowing both frequencies to be used simultaneously. The 2.8° VHF beamwidth is the widest field-of-view of any of the radars and is often used to search for objects with unknown or uncertain orbital elements.
The Target Resolution and Discrimination Experiment (TRADEX) radar was the first major sensor at Kwajalein, becoming operational in 1963. Currently, TRADEX operates at L- and S-bands, although monopulse tracking is only available in L-band. TRADEX has been used in the SSN deep space role when ALTAIR has been unavailable due to maintenance or other issues.

7
The ARPA-Lincoln C-band Observables Radar (ALCOR) is a C-band radar with both narrow and wideband waveforms. The wideband waveforms are often used to provide range-Doppler images of satellites. The ALCOR served as a test bed for development of the imaging techniques now in use at Haystack, HAX, and other imaging radars.
The fourth radar on Roi-Namur is also a wideband radar predominately used for imaging, the Millimeter Wave (MMW). It operates at K-band, but having relatively low power limits its utility.
In addition to the four radars on Roi-Namur, the U.S. Missile Defense Agency operates the Ground Based Radar-Prototype (GBRP) on the island of Kwajalein. This radar is a phased-array radar operating at X-band. In addition to the pointing agility provided by the electronic steering associated with being a phased-array radar, the entire radar face is on a pointable AZ-EL mount. Unfortunately, the long-term availability of this radar is in question, as plans for its closure and relocation off Kwajalein have alternately been planned and canceled.
Some of the pertinent characteristics of the Kwajalein radar suite are given in Table 1.
Table 1 - Selected attributes of the Kwajalein instrumentation radars
COMBINED OPERATIONS
Currently, all of the radars on Roi-Namur can be remotely operated from the Range Control Center on Kwajalein. Further, any of the radars can be directed onto an object that is being tracked by one of the other radars. It should be possible, at some point in the future, to integrate the MCAT into this network so that it can point off of a real-time radar track file, or so that the KMR radars can point in the same direction as the MCAT.
Combined operations can provide more accurate determination of the metric location of satellites. Radars routinely provide slant range accuracies of a few meters or better, but the angular accuracy determined from monopulse tracking may be as bad as 10% or 20% of the radar beamwidth or more. Passive optical telescopes using in-frame calibrations of known star positions can provide arc-second or better pointing. Therefore, combining simultaneous slant range measurements from radars and angle measurements from optical telescopes can improve the accuracy of individual location measurements and, when combined with measurements from other parts of the orbit, the over-all accuracy of the orbit.

8
However, for orbital debris studies, metric accuracy of the orbit is not always the most useful goal. Often, it is more important to understand the size and mass of a debris object. Remote sensing of non-resolved targets, such as small orbital debris, never measures the size of an object directly.
For radars, the reported quantity related to size is Radar Cross Section (RCS). Quantities such as slant range and atmospheric attenuation should be accounted for in other parts of the radar equation and should not affect RCS. However, other quantities such as shape, material composition, and the frequency or wavelength of the radar do contribute to the RCS of an object.
For optical telescopes, the equivalent to RCS is the absolute magnitude, where corrections for atmospheric attenuation and slant range have been taken into account. However, for stand-alone operations, slant range is not measured and must be assumed. Typically, a circular orbit assumption is made and the angular rate across the field-of-view is used to estimate the altitude, and hence slant range, to the object.
Also, most of the unknowns affecting the RCS of an individual object have their analogs in absolute magnitude. Object shape, orientation, and surface reflectivity, or albedo, and surface roughness affect magnitude. The phase angle between the observer (telescope) and the light source (sun) also comes into play.
In order to estimate albedo, debris researchers often have observed objects in the SSN catalog and used the catalog estimate of RCS as the true representation of size. They calculate an average albedo for many cataloged objects and extrapolate that to smaller sizes. So, the optical estimate of size has all of the problems of both RCS and magnitude conversions.
Simultaneous observations from the MCAT and the RTS radars will not solve all of these issues, but will provide additional information. Simultaneous measurements at different radar frequencies should improve estimates of physical size from RCS. Some uncertainties, such as the orientation of the object with respect to the sensor can be better controlled. With independent measurements, the orientation or mix or orientations is never known. For simultaneous observations, the orientation of an object with respect to the sensor will be nearly identical (especially for objects near GEO). Combined, these advantages should produce much better estimates of albedo.
NASA is currently developing an optical size estimation model similar to the radar equivalent developed in the late 1980s and early 1990s for Haystack radar measurements and described in the next section. Simultaneous radar/optical observations will provide data to validate the new model.
RADAR SIZE ESTIMATION MODEL
A study was done by NASA and XonTech, Inc. to develop a Size Estimation Model (SEM) to relate RCS to physical size. "Representative" debris objects were selected from two

9
hypervelocity impacts of simulated satellites (Figure 6) conducted at the Arnold Engineering Development Corporation by the U.S. Department of Defense [1, 2]. Some artificial debris-like objects were also included in the sample to represent better the postulated orbital debris environment. The RCS values of these 39 debris objects were measured at a controlled RCS radar range operated by the System Planning Corporation (Figure 7). The RCSs of these objects were measured over 4 radar frequency bands (2.5647-3.9111 GHz, 4.116-7.986 GHz, 8.1544-12.7684 GHz, and 12.924-17.538 GHz) with 8 steps in the band of the lowest frequency and 16 steps in the band for the other three, and with hundreds of source-object orientations [3, 4]. These frequencies, S-, C-, X-, and Ku-band, respectively, were chosen since they represent radar frequencies often used for orbital debris observations.
Figure 6. – Simulated Satellite impacted by 1-cm steel ball along the axis of the satellite at 7 km/sec velocity.
The characteristic length of an object is defined as the average of the largest dimensions for an object measured along three orthogonal axes. The first axis was chosen to coincide with the largest dimension, the second axis to coincide with the largest dimension in a plane orthogonal to the first axis, and the third axis to be orthogonal to the first two axes. The characteristic length of an object is referred to as size or diameter.

10
Figure 7. – Indoor radar range used to measure fragments. The debris piece would be mounted on the top of the computer-controlled, rotating foam column shown on the left. Two dishes provided a wide
range of radar frequencies/wavelengths.
Consistent with the Maxwell’s equations of electromagnetics, radar data from different wavelengths can be compared by normalizing the size by the wavelength of the measuring frequency and the RCS by the wavelength squared. This results in a size parameter x=size/wavelength and a RCS parameter z=RCS/wavelength2. No divergences from the scaling law invariances were observed from the analysis of the radar data by XonTech, but this may be a consequence of the limited size range chosen for the 39 pieces. Figure 8 shows the relationship between the measured RCS parameter and the object's physical size parameter. Each of the 2072 points on this plot is a weighted average for a single object over hundreds of different orientations at a single frequency. The data was weighted to account for nonuniform sampling of the object orientations as the data was collected.

11
Figure 8. – Results of RCS-to-physical size measurements on 39 “representative” debris objects over the frequency range 2.0 – 18 GHz (15 – 1.67 cm wavelength). Each point represents an average RCS for a
single object measured at a single frequency over many orientations. The oscillating blue line is the radar cross section for a spherical conductor while the smooth black line is the polynomial fit to the data.
From this plot a scaling curve (smooth solid line) was developed that represents the mean of the measured RCS for each size/wavelength. For debris sizes much smaller or larger than the radar wavelength, the scaling curve approaches the Rayleigh or optics region curves, as expected. Between the Rayleigh and optics region curves is the Mie resonance region that results in an enhanced RCS measurement on average for a given size. In the resonance region, the scaling curve deviates from the optical curve (not shown) such that, for a given RCS, the object is smaller in characteristic length than it would have been interpreted to be by using the optical approximation. The scaling curve may be expressed as:
π=
zx 4
, for z>5, Optical Regime
659
4π
=zx
, for z<0.03, Rayleigh Regime
)z(gx = , in between, Mie Resonance Regime

12
where z=RCS/λ2, x=diameter/λ, and λ is wavelength. In the above equations, the quantity z is assumed to not be expressed in dB. The smooth function g(z) is expressed by 23 points in Table 2.
Table 2 - The NASA SEM curve x=g(z) in the Mie resonance region
For comparison, the oscillating RCS-to-size curve for a spherical conductor is shown in Figure 8. The oscillations result from constructive and destructive interference of electromagnetically induced waves on the surface of the conducting sphere.
Further work has shown that the size implied by a single valued smooth RCS-to-size curve in Figure 8 needs to be adjusted slightly, dependent on the slope of the population distribution. This is because for any given size there is a distribution of RCS values, not necessarily symmetric about a mean or median RCS value. Sometimes an object will appear to be larger than the mean value and sometimes it will appear to be smaller. The radars measure a number of similar RCS values. Of these, some will be smaller objects that appear bigger, some will be objects that appear to be the correct size, and some will be larger objects that appear to look smaller. Because the Radar SEM is a simple model for one-to-one RCS-to-size mapping, it does not provide an uncertainty estimate for the derived size distribution, nor does it take into account the specific distribution of RCS values for a given size. To improve the original NASA SEM, a Statistical Size Estimation Model (SSEM) has been developed [5]. The SSEM is based on the expectation maximization theorem clarified and further developed by Vardi and Lee [6]. The SSEM utilizes conditional probability distributions of RCS given a size, which were an outcome of the analysis done by XonTech of the RCS radar range measurements.

13
Figure 9 shows the SEM for each of the frequencies available from the RTS radars.
Figure 9. – Results of the Radar SEM for the frequencies available from the Kwajalein instrumentation radars.
CONCLUSIONS
NASA continues to improve our knowledge of the orbital debris environment. Construction is underway on a 1.3 m aperture MCAT telescope that will be deployed on Kwajalein Atoll. This telescope will be used to improve knowledge of two, historically under-sampled orbit regimes: 1) low inclination, high eccentricity orbits, and 2) near GEO satellite orbits.
Fortuitously, Kwajalein is home to a suite of radars, operating at frequencies from VHF to K-band, capable of tracking Earth orbiting debris. Simultaneous observations between the MCAT and one or more radar frequencies should provide both better metric observations and better estimates of the physical size of the debris. The observations should also support development of an Optical Size Estimation Model, similar to the Radar Size Estimation developed by NASA earlier.
14
REFERENCES
1. Dalquist, C. and Bohannon, G. Physical Descriptions of Debris Objects Used in Static RCS Measurements. XonTech Report 910555-1978. August 1991.
2. Bohannon, G., Caampued, T., and Young, N. First Order RCS Statistics of Hypervelocity
Impact Fragments. XonTech Report 940128-BE-2305. April 1994. 3. Everett, R., Caampued, T., and Chu, J. Summary of Data Processing of September 1990
SPC Debris Data. XonTech Report 910147-1937. March 1991. 4. Everett, R., Dalquist, C., and Caampued, T. Summary of Processing of January 1991 SPC
Debris Data. XonTech Report 9100393-1965. July 1991. 5. Xu, Y.-l and Stokely, C.L. A Statistical Size Estimation Model for Haystack and HAX Radar
Detections, 56th International Astronautical Congress, Fukuoka, Japan, 2005. 6. Vardi, Y. and Lee, D. “From Image Deblurring to Optical Investments: Maximum Likelihood
Solutions for Positive Linear Inverse Problems,” J. R. Statist. Soc. B 55, pp. 569-612, 1993.

National Aeronautics and Space Administration
Plans for the Meter Class Autonomous Telescope andand
Potential Coordinated Measurements With Kwajalein RadarsRadars
Gene StansberyyNASA/Johnson Space Center
Paul KervinAFRLAFRL
Mark MulrooneyMEI Technologies, Inc.
8th US-Russian Space Surveillance Workshop18-23 April 2010

National Aeronautics and Space Administration
Meter-Class Autonomous Telescope (MCAT)
• Collaboration between NASA and Air Force ResearchCollaboration between NASA and Air Force Research Laboratory
• Improve knowledge of the debris environment in under-p gsampled orbit regimes – Low Inclination / high eccentricity– Near geosynchronous
• Deploy on Kwajalein Atoll – Legan IslandLo latit de site– Low latitude site
– Existing technical infrastructure– Covers part of GEO belt not easily seen by other groundCovers part of GEO belt not easily seen by other ground
sensors
2

National Aeronautics and Space Administration
MCAT Status and ScheduleMCAT Status and Schedule
Completed To DateCompleted To-Date• Raven Class 14” telescope deployed on Roi-Namur Feb 2007• Contract awarded for CCD Camera Sep 2007• Contract awarded for Telescope Dec 2008Contract awarded for Telescope Dec 2008• Dome ordered Oct 2009• CCD Camera delivered Jan 2010
S h d l f U C i E tSchedule for Up-Coming Events• Facility construction on Legan (Jan 2010 – Mar 2011)• Completion/Acceptance of telescope at DFM (May 2010)• Installation of MCAT at Legan Kwajalein Atoll (Spring 2011)• Installation of MCAT at Legan, Kwajalein Atoll (Spring 2011)
All major components either delivered, on order, or ajo co po e ts e t e de e ed, o o de , ofunding is in place
12 18 th f I iti l O ti l C bilit
3
12-18 months from Initial Operational Capability

National Aeronautics and Space Administration
MCAT StatusMCAT Status
• Will initially operate as an independent sensor performing blind searches– Orbit rate track during twilight for low inclination / low altitude /
high eccentricity debrishigh eccentricity debris– Geo observations similar to MODEST
• However, future plan for more complex operations– Follow-up or simultaneous operations with the 14” scope on
Roi-Namur– SSN Taskingg– Simultaneous operations with USAKA (US Army at Kwajalein
Atoll) radars• Combines high angle accuracy of optics with high range accuracy• Combines high angle accuracy of optics with high range accuracy
of radar• Allows simultaneous RCS / Optical brightness measurements
4
National Aeronautics and Space Administration
Meter-Class Autonomous Telescope (MCAT)
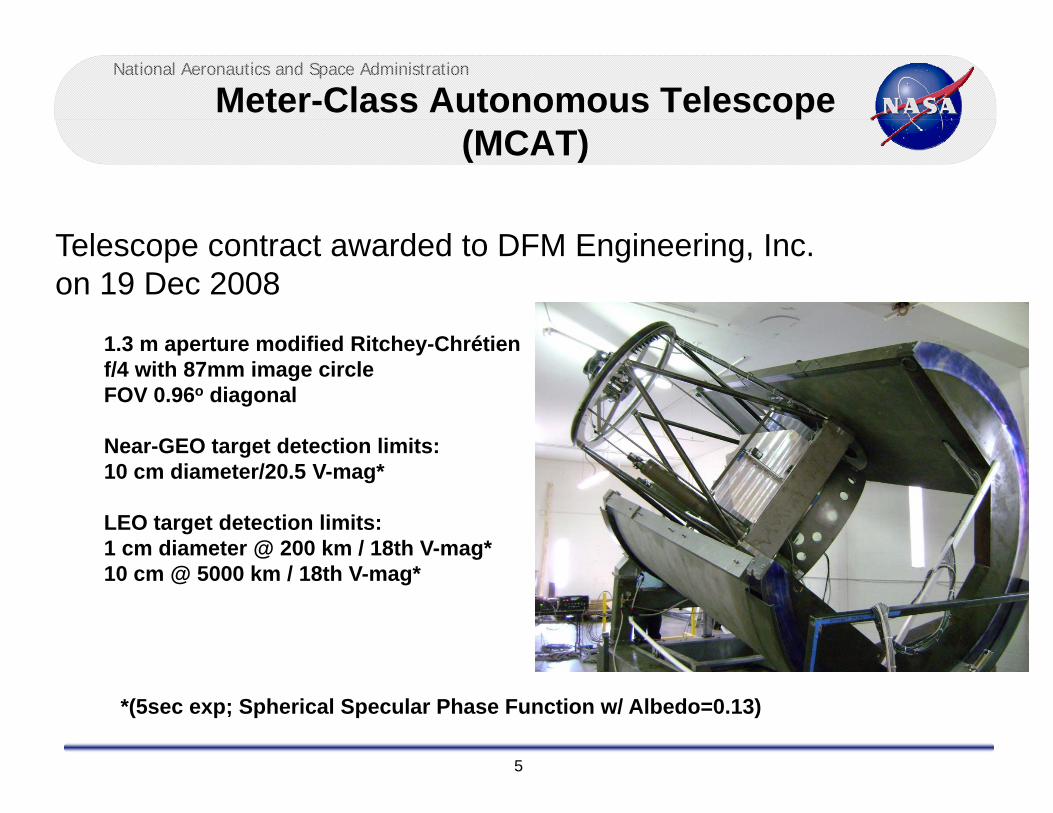
Telescope contract awarded to DFM Engineering, Inc. on 19 Dec 2008
1.3 m aperture modified Ritchey-Chrétienf/4 with 87mm image circle FOV 0.96o diagonal
Near-GEO target detection limits: 10 cm diameter/20.5 V-mag*
LEO target detection limits:1 cm diameter @ 200 km / 18th V-mag*10 cm @ 5000 km / 18th V-mag*
5
*(5sec exp; Spherical Specular Phase Function w/ Albedo=0.13)

National Aeronautics and Space Administration
MCAT MountMCAT Mount
• Unique Double Horseshoe Equatorial
– Low latitude site (9.0°)– Design allows sampling of 0° orbits
@ 200 km altitude– No zenith keyhole
• Tracking:– LEO (200 km; 2.2º/sec) to GEO Rates– < 3 arcsec RMS Pointing
Accuracy/RepeatabilityAccuracy/Repeatability– <0.2 arcsec RMS Jitter (GEO)
6

National Aeronautics and Space Administration
MCAT Camera (Vis)MCAT Camera (Vis)
• e2v 231 BI 4Kx4K 15 um pix CCDp• 4-port; TDI enabled• 2 e- read noise @ 100 KHz (GEO)• 10 e- read noise @ up to 10 MHz (LEO) • ~1 frames/sec (8x8 bin) – working on
faster• Cryo-Tiger cooled
( )• Broad Band coated (360 nm -1 um) Johnson BV Bessell URI x Solar Spec x Extinction x BB and ER1 CCD QEs
12
14ERxJBxSUNxEXT 40totBBxJBxSUNxEXT 55tot ERxJVxSUNxEXT 88tot
6
8
10
12
pons
e
BBxJVxSUNxEXT 85totERxBRxSUNxEXT 170totBBxBRxSUNxEXT 140totERxBIxSUNxEXT 183totBBxBIxSUNxEXT 149totERxBUxSUNxEXT 5totBBxBUxSUNxEXT 10tot
0
2
4
300 400 500 600 700 800 900 1000 1100
resp
7
-2
300 400 500 600 700 800 900 1000 1100
lambda

National Aeronautics and Space Administration
MCAT – Site/FacilityMCAT Site/Facility
Artist’s Conception of
8
Artist s Conception of MCAT location

National Aeronautics and Space Administration
Kwajalein Atoll jRepublic of the Marshall Islands
<=Roi-Namur
L R i N 46 k Legan=>Legan – Roi-Namur = 46 kmLegan – Kwajalein = 32 km
9
Kwajalein=>

National Aeronautics and Space Administration
Kwajalein Instrumentation RadarsKwajalein Instrumentation Radars
ALTAIR
MMW
TRADEX
ALCOR
10

National Aeronautics and Space Administration
Kwajalein Radar CharacteristicsKwajalein Radar Characteristics
Parameter ALTAIR TRADEX ALCOR MMWBand VHF UHF L‐band S‐band C‐band K‐bandCenter Frequency (MHz) 162 422 1320 2950 5670 35000q y ( )Wavelength (mm) 1850 710 225 100 50 9Beamwidth (deg) 2.8 1.1 0.6 0.3 0.3 0.04Peak Power (kw) 7000 5000 2000 2000 2250 25Peak Power (kw) 7000 5000 2000 2000 2250 25
11

National Aeronautics and Space Administration
Combined Optical / Radar MeasurementsCombined Optical / Radar Measurements
• Improved metrics - Combine meter slant range ith d laccuracy with arc-second angle accuracy.
• Improved estimates of size & shape – Combining simultaneous multiple radar wavelengths with optical brightnessoptical brightness.
12

National Aeronautics and Space Administration
NASA’s Size Estimation ModelNASA s Size Estimation Model
• Developed in the early 1990’s in support of NASA’s Haystack measurement programHaystack measurement program
• Empirically Derived• 39 pieces from ground based hyper-velocity impact• 39 pieces from ground based hyper-velocity impact
tests• Controlled indoor RCS radar rangeControlled indoor RCS radar range• Results physically reasonable
13

National Aeronautics and Space Administration
Fragments “Representative” of the Orbital Debris Environment
Si l t d S t llit i t d b 1Simulated Satellite impacted by 1-cm steel ball along the axis of the satellite at 7 km/sec velocity.
14

National Aeronautics and Space Administration
Indoor Radar Instrumentation RangeIndoor Radar Instrumentation Range
• Unusual design results in very low background noise– Smooth reflecting walls
Sh t P l– Short Pulse– Precise Timing
• Linear vs. Circular PolarizationPolarization– Calibration– Full polarization matrix
15

National Aeronautics and Space Administration
The MeasurementsThe Measurements
Frequency Range
S-band 2 5647 to 3 9157 GHzS-band 2.5647 to 3.9157 GHz C-band 4.1160 to 7.9860 GHz
X-Ku-band 8.0000 to 17.6894 GHz
Mounting
S t th bj t• Support the object
• Allow rotation in Azimuth and Elevation
• Low Density foam
16

National Aeronautics and Space Administration
Sample ResultsSample Results
17

National Aeronautics and Space Administration
NASA Size Estimation Model (SEM)
RCS Static Range Measurements
NASA Size Estimation Model (SEM)
20
h2 (d
B)
RCS Static Range MeasurementsBlue Line –
Theoretical curve for perfectly
10
avel
engt
h for perfectly conducting sphere
R d P i t
10
0
ctio
n/W
a Red Points –RCS/Size pairs from ground test data
-20
-10
Cro
ss S
ec
Black Line –SEM curve fitted to data
0 1 1 10-30R
adar
C data
18
0.1 1 10Diameter/Wavelength

National Aeronautics and Space Administration
Size Estimation ModelSize Estimation Model
• Fundamental Assumption – Pieces used to create the SEM are representative• Fundamental Assumption – Pieces used to create the SEM are representative of the On-Orbit Population
– Pieces compared to SOCIT (hypervelocity impact with a flight qualified satellite) and scaled Ariane upper stage explosion
SEM d l d f d b i f d i li bl i• SEM was developed for debris fragments and is not applicable to intact objects, particularly those 1 m and larger
– RCS of symmetric shapes (sphere, cylinders, etc.) are qualitatively different than those of irregular debris objects (on which the model is based)g j ( )
• SEM is good at characterizing ensembles of objects– There can be a large spread in possible RCS for a given size and vice versa– Will only give approximate size estimations of individual debris objects
Bi d d hi h i d d t th l f th i di t ib ti• Bias produced which is dependent on the slope of the size distribution– Small objects can “look” large in RCS– Large objects can “look” small in RCS– Many more small objects to “look” large than large objects to “look” smallMany more small objects to look large than large objects to look small
• SEM is scalable with wavelength, but within limits• SEM methodology has been extensively examined by outside reviewers, and
has been found to be sound
19

National Aeronautics and Space Administration
SEM for Kwajalein Radars20
SEM for Kwajalein Radars
0
m)
‐20
ction (dB sm
‐40
ar Cross Se
‐60
Rad
a
‐80
0.001 0.01 0.1 1
20
Characteristic Length (m)

National Aeronautics and Space Administration
SummarySummary
• MCAT should be operational by the summer 2011• MCAT should be operational by the summer 2011
I iti l ti ill b t d l h f l• Initial operations will be stand-alone searches of low inclination orbits and Geosynchronous altitudes
• Future operations will combine simultaneous optical and radar measurementsand radar measurements– Improved metrics– Improved knowledge of size and shapeImproved knowledge of size and shape
21