plant physiological responses to environmental change in a
TRANSCRIPT

University of North Florida University of North Florida
UNF Digital Commons UNF Digital Commons
UNF Graduate Theses and Dissertations Student Scholarship
2021
Plant Physiological Responses to Environmental Change in a Plant Physiological Responses to Environmental Change in a
Marsh-Mangrove Ecotone Marsh-Mangrove Ecotone
Matthew Sturchio University of North Florida, [email protected]
Follow this and additional works at: https://digitalcommons.unf.edu/etd
Part of the Biology Commons, Climate Commons, Ecology and Evolutionary Biology Commons, and
the Plant Biology Commons
Suggested Citation Suggested Citation Sturchio, Matthew, "Plant Physiological Responses to Environmental Change in a Marsh-Mangrove Ecotone" (2021). UNF Graduate Theses and Dissertations. 1019. https://digitalcommons.unf.edu/etd/1019
This Master's Thesis is brought to you for free and open access by the Student Scholarship at UNF Digital Commons. It has been accepted for inclusion in UNF Graduate Theses and Dissertations by an authorized administrator of UNF Digital Commons. For more information, please contact Digital Projects. © 2021 All Rights Reserved

PLANT PHYSIOLOGICAL RESPONSES TO ENVIRONMENTAL CHANGE IN A
MARSH-MANGROVE ECOTONE
by
Matthew Sturchio
A thesis submitted to the Department of Biology
in partial fulfillment of the requirements for the degree of
Master of Science in Biology
UNIVERSITY OF NORTH FLORIDA
COLLEGE OF ARTS AND SCIENCES
April 2021

ii
Table of Contents
Acknowledgments ................................................................................................................................................ iii
Thesis Abstract ..................................................................................................................................................... iv
Thesis Introduction ...............................................................................................................................................1
Patterns of thermal acclimation of leaf respiration in a marsh-mangrove ecotone ...................7
Abstract ......................................................................................................................................................................7
Introduction ................................................................................................................................................................8
Materials and Methods .............................................................................................................................................13
Study sites and experimental design ....................................................................................................................13
Temperature response of leaf R ...........................................................................................................................16
Modelling the temperature response of R ............................................................................................................18
Data analysis ........................................................................................................................................................19
Results ......................................................................................................................................................................20
Leaf R, leaf N, and LMA over space and time ....................................................................................................20
Relationships between Tair and leaf R, leaf N, and LMA ....................................................................................22
Scaling of leaf N and R ........................................................................................................................................23
Discussion ................................................................................................................................................................24
References ................................................................................................................................................................32
Tables and figures ....................................................................................................................................................37
Long-term and short-term impacts of nutrient enrichment on photosynthetic and
respiratory processes in black mangrove (Avicennia germinans) in north Florida ..................47
Abstract ....................................................................................................................................................................47
Introduction ..............................................................................................................................................................48
Materials and Methods .............................................................................................................................................53
Site description ....................................................................................................................................................53
Experimental design ............................................................................................................................................54
Environmental data ..............................................................................................................................................54
CO2 response of A ................................................................................................................................................55
Temperature response of leaf R ...........................................................................................................................57
Modelling the temperature response of leaf R .....................................................................................................58
Data analysis ........................................................................................................................................................59
Results ......................................................................................................................................................................60
Impacts of N and P addition on photosynthetic parameters ................................................................................60
Impacts of N and P addition on respiratory parameters ......................................................................................62
Discussion ................................................................................................................................................................63
References ................................................................................................................................................................68
Tables and figures ....................................................................................................................................................73
Supplemental tables and figures ....................................................................................................................82
Thesis references ..................................................................................................................................................88

iii
Acknowledgments
Thank you to the Garden Club of America (GCA), UNF Coastal Biology, and Auburn University
Department of Wildlife Science and Forestry, for funding and supporting my research. Guana
Tolomato Matanzas National Estuarine Research Reserve (GTMNERR) and the Warming
Ecosystem Temperatures in a Florida Ecotone Experiencing Transition, more affectionately
known as the WETFEET project, for giving me a place to do my research. Thank you, Dr. Mike
Aspinwall, Dr. Jeff Chieppa, Dr. Samantha Chapman, Dr. Ilka ‘Candy’ Feller, and Dr. Lorae
Simpson for helping me design and tell the story of these studies. Thank you, Dr. Anthony Rossi
for being a supportive committee member and for introducing me to Dr. Aspinwall. A special
thanks to Gabby Canas for quite literally holding down the fort (warming chambers) and braving
pre-dawn sampling. Susannah Dorrance, thanks for protecting me from marsh bears and moon
hexes when Gabby was unavailable. Last but not least, thank you to my family for the
overwhelming support of whatever I choose to do with my life.

iv
Abstract
Globally, photosynthesis (A) and autotrophic respiration (R) are the two largest
physiological processes responsible for CO2 flux. Coastal wetland ecosystems are responsible for
some of the highest rates of C sequestration. Marsh grass and mangrove habitats responsible for
this service are important in supporting biodiversity and preventing shoreline erosion, yet little is
known about how this vegetation will respond physiologically to effects of climate and global
change. In the first chapter a warming experiment was used to determine whether a C4 marsh
grass (Spartina alterniflora) and a C3 mangrove (Avicennia germinans) acclimate leaf R to
seasonal changes in temperature and experimental warming, and whether variation in leaf N
(proxy for enzyme concentrations) explains temperature acclimation patterns in both species. In
the second chapter a long-term fertilization experiment was conducted to determine whether
Avicennia alters parameters of A and R over time in response to nutrient enrichment of nitrogen
(N) or phosphorus (P), and whether the response to pulse enrichment of nutrients is temporary or
leaves a legacy effect. In chapter 1, Avicennia generally increased respiratory capacity as growth
temperatures increased, but Spartina acclimated to warmer temperatures by reducing respiratory
capacity. Although temperature acclimation of R differed between Spartina and Avicennia,
changes in Nmass explained temperature acclimation patterns in both species. In chapter 2, N
addition increased R capacity (Rmass25), CO2 assimilation (Asat), and the maximum rate of Rubisco
carboxylation (Vcmax). The effects of N addition on photosynthesis were short-lived, but the
effect of N addition on leaf R was consistent over time, indicating a possible legacy effect of R
but not A. This thesis provides new insight into temperature controls of leaf R in marsh and
mangrove species, which may aid predictions of CO2 fluxes from coastal wetlands. This research

v
also improves our understanding of the short- and potentially long-term impacts of N and P
enrichment on mangrove physiology.

Introduction
Vegetated coastal ecosystems are plant communities that exist at the intersection of ocean and
land. These communities are composed of plant species that tolerate both tidal inundation and
fluctuating salinity. At higher latitudes of North America where climate is temperate, vegetated
coastal communities are comprised of mostly marsh grasses including Spartina alterniflora
(smooth cordgrass) and Spartina patens (saltmeadow cordgrass) and a small number of forb and
shrub species. In the subtropics and tropics, coastal vegetative communities are made up of a
variety of halophytic mangrove species including Avicennia germinans (black mangrove)
Rhizophora mangle (red mangrove), and Laguncularia racemosa (white mangrove). The ecotone
represents a highly productive coastal wetland transitional zone where the southern limit of
temperate saltmarsh habitat converges with the northern limit of tropical mangrove habitat.
Temperature, especially minimum winter temperatures, are a key determinant of the location of
the marsh-mangrove ecotone (Osland et al. 2013; Cavanaugh et al. 2014, 2015; Saintilan et al.
2019).
Coastal vegetation serves as the primary habitat for a number of aquatic and terrestrial
organisms. Coastal birds utilize these habitats as a food source, building material, and rookeries.
Many economically important fish species of recreational or commercial importance utilize tidal
marshes through different stages of development (Mumby et al. 2004; Johnson & Swenarton
2016). Finger lakes of intercoastal waterways have calm waters and are an ideal location for
juvenile fish to feed and grow before spending their adult life at sea. In summer months, fish,
crabs, and snails use the shade from marsh grasses and mangroves to stay cool. This shading also
reduces the amount of evaporation that occurs underneath plant canopies which decreases
salinity and enables further vegetative recruitment (Peterson & Bell 2018).

2
Coastal vegetation also serves as an important defense against the impacts of sea level
rise (SLR). Coastal vegetation plays an important role in stabilizing sediments so that suspended
solids become fixed in soils rather than entering the water column (Wieski et al 2010; Doughty et
al. 2017). This fixation is referred to as soil accretion and is an important driver of wetland
elevation gain (Coldren et al. 2016; Coldren et al. 2019). Specific accretion rates of marsh and
mangrove communities vary in different regions of the world but are correlated with sediment
availability. Vegetative growth and root production also increases C inputs belowground which
can increase C storage and wetland elevation. If the rate of accretion and elevation gain is rapid
enough to keep pace with the rate of SLR, coastal vegetation may limit the loss of coastline from
SLR (Morris et al. 2002; Cahoon et al. 2020; Chapman et al. 2021). These habitats also alleviate
the impacts of storms and excessive boat traffic by dissipating wave energy and reducing erosion
of wetland soils (Guannel et al. 2016). All coastal vegetation plays a role in reducing erosion
caused by wave action, although there is evidence that mangrove habitats are more effective at
attenuating waves in shorter distances than marsh habitat (Doughty et al. 2017).
These systems also act as natural filters that purify water entering estuaries (Mitsch and
Gosselink 2008). As water enters the coastal wetland through river tributaries, groundwater
movement, and overland flow is slowed by the physical resistance imparted by wetland
vegetation (Morgan et al. 2009). Suspended sediments are then deposited in layers on the soil
surface, simultaneously increasing elevation and adding nutrients to an extremely nutrient-
limited ecosystem. The ability of these systems to filter nutrients also improves water quality and
protects coastal economies from harmful algal blooms (HAB’s) (Barbier et al. 2011). Reduction
of HAB’s promotes healthy growth of submerged vegetative communities (e.g. seagrasses) that
would otherwise be shaded out by surface algal blooms. When all the goods and services

3
provided by vegetated coastal ecosystems are accounted for, models estimate that these
vegetated coastal wetlands have an annual economic value of $10,000-$20,000 per hectare
(Kirwan and Megonigal, 2013).
Coastal vegetative ecosystems also play an important role in the global C cycle. At the
global scale these ecosystems deposit a similar amount of C belowground as terrestrial forests,
despite covering just 3% of the area of terrestrial forests (Lugo & Snedeker 1974, Bouillon et al.
2008, Duarte et al. 2013). On average, marsh and mangrove ecosystems store more carbon per
unit area (593 Mg C ha−1 and 956 Mg C ha-1, respectively) than many tropical rainforests (241
Mg C ha−1) (Donato et al. 2011; Alongi et al. 2014). Coastal vegetation is an effective carbon
sink for several reasons. First, like terrestrial plants, coastal vegetation sequesters C within living
biomass (e.g., leaves, roots, woody material) and non-living biomass (e.g., leaf litter and dead
wood) (Duarte et al. 2005, 2013; Mcleod et al. 2011). However, unlike terrestrial soils, mangrove
and salt marsh sediments accrete vertically in response to sea level rise which effectively
eliminates C saturation (McLeod et al. 2011). This vertical accretion in combination with
anaerobic wetland soils creates an environment of burial and slow turnover. For example, it has
been estimated that coastal vegetation sequesters C much longer (centuries vs. millennia) than
the world’s most productive tropical rainforests (Chambers et al. 2001; McLeod et al. 2011;
Alongi et al. 2014; Alongi and Mukhopadhyay 2015).
In many locations throughout the planet, habitat destruction, environmental degradation,
and climate change are threatening or altering the health and function of these valuable coastal
ecosystems (Friess et al. 2019). For example, 25 to 50% of global mangrove extent is estimated
to have been lost over the last 50 years due to habitat conversion and degradation (Valiela et al.
2001, Alongi 2002). In a number of locations (United States, Australia) climate warming is

4
contributing to a reduction in freeze events at mangrove range limits, facilitating poleward
movement of mangroves into saltmarsh habitat (Cavanaugh et al. 2014, Kelleway et al., 2017;
Osland et al., 2013; 2016a; Perry & Mendelssohn, 2009; Saintilan et al., 2014; Feller et al. 2017).
The encroachment of mangroves is fundamentally altering the structure and function of these
ecosystems (Doughty et al. 2016, others). There is also uncertainty about whether, or for how
long, marsh and mangrove ecosystems can gain elevation to keep pace with SLR (Friess et al.
2019, Lovelock et al. 2015, Schuerch et al. 2018). Marsh equilibrium models (MEMs) originally
created to assess vulnerability of coastal marshes to SLR have recently been adjusted to include
predictions for mangrove forests susceptibility to rising seas (Cahoon et al. 2020). These models
predict that by 2100 marsh ecosystems will be lost under a business-as-usual SLR forecast
(Morris et al. 2002, 2016). A key conservation solution for SLR is ‘marsh migration’ which
would allow for salt marshes and mangrove forests to build vertically along a natural elevation
gradient, thus sustaining their ecosystem service functions under SLR scenarios (Schuerch et al.
2018).
In addition to SLR, coastal ecosystems are threatened by other aspects of global change.
Global mean temperatures are expected to rise 1–4°C by 2050, with the amount of warming
varying among regions (IPCC 2013, Ciais et al. 2013). Warmer temperatures could alter rates of
C uptake, use and storage in coastal wetlands, with implications for climate-carbon cycle
feedbacks (Atwood et al. 2017). However, there is considerable uncertainty about temperature
controls of C cycling processes over space and time in coastal wetlands (Duarte 2017, Adame et
al. 2018). This uncertainty stems from several sources including but not limited to: 1) limited
data on leaf CO2 fluxes in relation to seasonal or latitudinal variation in temperature for marsh
and mangrove species in tropical and subtropical climates, 2) Climate warming impacts on leaf

5
photosynthetic or respiratory processes in tropical and subtropical marsh-mangrove ecosystems
are virtually unknown, and 3) Marsh and mangrove species capacity for ‘thermal acclimation’ of
leaf physiology remain understudied and difficult to predict (Aspinwall et al. 2021), despite the
importance of thermal acclimation in modifying the temperature response of wetland C cycling
processes. New work is needed to address these uncertainties and improve our quantitative and
predictive understanding of coastal C cycling responses to temperature, potential feedbacks
between temperature and C cycling, and the representation of these processes in earth system
models (ESMs) that predict future climate.
Human activities have also resulted in large and persistent nutrient inputs into coastal
habitats resulting in eutrophication and harmful cyanobacteria blooms. These events are
increasingly frequent, creating hypoxic conditions which negatively impact the natural
biodiversity of coastal ecosystems. In general, nutrient enrichment and N deposition are expected
to stimulate growth and productivity of marsh grasses and mangroves (Feller et al. 2003, Darby
and Turner 2008, Davis et al. 2017). Similar to most nutrient limited ecosystems, early studies
showed that mangrove responses to N and P additions are dependent upon the limiting nutrient in
the system (Feller et al. 2007). Some also have suggested that A. germinans is a superior
competitor to marsh grass species when nutrients are limited (Simpson et al. 2013). In a new
study, Dangremond et al. (2020) found that N-enriched mangroves grew taller, increased their
canopies, increased leaf chlorophyll content, and had higher leaf N concentrations relative to P-
enriched and control trees. However, important questions remain. For instance, few studies have
examined how long-term nutrient (N and P) enrichment impacts photosynthetic biochemistry or
respiratory capacity of mangrove foliage. We also have a limited understanding of the short-term
responses of photosynthesis and respiration to nutrient pulses in coastal wetlands. These

6
knowledge gaps hinder our ability to predict photosynthetic and respiratory processes along
spatial or temporal gradients in nutrient enrichment or incorporate the impacts of nutrient
enrichment on vegetation function in models that simulate or project C and N cycling over space
and time in coastal wetlands.
The overarching aim of this thesis is to investigate patterns of thermal acclimation of leaf
respiration over space and time in coastal plant species, and the long and short-term
physiological response of mangroves to N and P additions. In the first chapter we tested whether
a C4 marsh grass species (Spartina alterniflora) and C3 mangrove species (Avicennia germinans)
growing in a marsh-mangrove ecotone show evidence of seasonal temperature acclimation of
leaf R, and whether seasonal temperature acclimation of leaf R is consistent in plants growing
under ambient and experimentally warmed conditions, as well as across sites at the northern and
southern edge of the ecotone. We accomplished this by repeatedly measuring the short-term
temperature responses of leaf R over a 10-month period in marsh and mangrove plants grown in
situ under ambient temperatures and experimental warming at two sites within the ecotone. We
also determined leaf N on a subset of leaves and tested whether leaf N scales positively with
Spartina and Avicennia leaf R, over time and across sites and treatments. We hypothesized that
seasonal acclimation of R would be consistent across ambient and warmed treatments, and across
northern and southern sites, demonstrating convergent temperature acclimation of leaf R. In the
second chapter we determined the long-term and short-term impacts of N and P additions on
photosynthetic and respiratory processes in black mangrove (Avicennia germinans). Ultimately,
this work will improve our understanding of coastal wetland vegetation responses to
environmental change.

7
Chapter 1
Patterns of thermal acclimation of leaf respiration in a marsh-mangrove ecotone
Abstract
Leaf respiration (R) is an important parameter in terrestrial biosphere models and associated
earth system models. Yet, spatiotemporal patterns of leaf R, its temperature sensitivity, and
temperature acclimation of leaf R have not been widely studied in coastal marsh and mangrove
species. Here we examined seasonal temperature acclimation of leaf R in a C4 marsh species
(Spartina alterniflora) and C3 mangrove species (Avicennia germinans) growing under ambient
temperatures and experimental warming at northern and southern sites within a marsh-mangrove
ecotone in North Florida. We also tested whether variation in leaf N (proxy for enzyme
concentrations) explain temperature acclimation patterns in both species. In Spartina, respiratory
capacity (R per unit mass at 25 °C, Rmass25) and the temperature sensitivity of R (Q10) declined as
seasonal temperatures increased, indicating seasonal temperature acclimation, and did so
consistently across treatments and sites. Across sites and treatments, leaf N per unit mass (Nmass)
showed a strong positive relationship with Rmass25. In Avicennia, Rmass25 showed no relationship
with prevailing seasonal temperatures at the northern site but increased as seasonal temperatures
increased at the southern site. Warming caused a small increase in Rmass25 at both sites.
Nonetheless, the Q10 of R decreased as seasonal temperatures increased and did so consistently
across sites and treatments. Importantly, Nmass also showed a strong positive relationship
with Rmass25 in Avicennia. Therefore, although temperature acclimation of R differed
between Spartina and Avicennia, changes in Nmass explained temporal and spatial variation in
Rmass25 in both species. These results improve our quantitative and predictive understanding of

8
temperature controls of leaf respiration in coastal plant species and provide new data for
improving representation of these processes in larger-scale models.
Introduction
Coastal marsh and mangrove ecosystems make a large contribution to global primary production
and carbon (C) cycling despite covering a small proportion of the earth’s surface. (Lugo &
Snedeker 1974, Bouillon et al. 2008, Donato et al. 2011, McCleod et al. 2011, Lu et al. 2017).
For instance, each year these coastal wetlands deposit a similar amount of organic C
belowground as terrestrial forests, despite covering less than 3% of the area of forests (Lugo &
Snedeker 1974, Bouillon et al. 2008, Duarte et al. 2013). The high C storage capacity of coastal
wetlands can be attributed to their effectiveness in trapping and burying sediment from terrestrial
and marine sources, often referred to as blue carbon (Nellemann et al. 2009). Much of the C
fixed by photosynthesis remains sequestered for millennia due to slow decomposition rates,
anaerobic conditions, and a relatively high fraction of total biomass allocated to roots and
rhizomes (Duarte et al. 2005; Mcleod et al. 2011, Howard et al. 2017). However, global mean
temperatures are expected to rise 1–4°C by 2050 (IPCC 2013, Ciais et al. 2013) resulting in
higher sea levels, more frequent and intense storms, and altered precipitation patterns, all of
which could affect the composition, structure, C storage and persistence of coastal wetlands
(Lovelock et al. 2016, Friess et al. 2019). Rising temperatures, in particular, will have direct
effects on photosynthesis and respiration, with important consequences for coastal C cycling and
vegetation – climate feedbacks. New work is required to improve our understanding of
temperature controls of C cycling processes over space and time for marsh and mangrove
ecosystems.

9
At the global scale, autotrophic respiration represents the second largest flux of CO2
second only to photosynthesis (IPCC 2013, Ciais et al. 2013). On an annual basis, roughly half of
global terrestrial gross primary production (GPP) by plants is returned to the atmosphere via
autotrophic respiration (Piao et al. 2013). Plant respiration is estimated to account for a similar
proportion (~50%) of GPP in marsh and mangrove ecosystems (Alongi et al. 2020). At the
global scale, roughly 50% of plant respiration comes from leaves (Atkin et al. 2007, Atkin et al.
2015). As a result, leaf mitochondrial respiration (R, typically measured in darkness as CO2
efflux) is an important parameter for simulating C cycling in terrestrial biosphere models
(TBMs) and associated earth system models (Fisher et al. 2014, Atkin et al. 2015). Leaf R and
photosynthetic capacity are closely coupled (O’Leary et al. 2019, Wright et al. 2004, Wang et al.
2020). Respiration plays an important role in nitrate reduction, phloem loading, and turnover of
phospholipid membranes and proteins. Rubisco accounts for a large fraction of leaf protein
(Evans 1989, Hikosaka and Shigeno 2009, Aspinwall et al. 2019) and thus leaf R plays an
important role in maintaining photosynthetic capacity under natural conditions. Across a wide
range of species and systems, leaf R at 25 °C scales positively with maximum rates of Rubisco
carboxylation (Vcmax) at 25 °C (Atkin et al. 2015). Total leaf N represents total photosynthetic
and respiratory enzyme content, and leaf N also positively scales positively with both Vcmax and
R at 25 °C across a wide range of species and growth environments (Reich et al. 2008, Atkin et
al. 2015). For these reasons, many land surface models predict functional-type specific rates of R
using either estimates of Vcmax at 25 °C or measurements of leaf N on an area or mass-basis
(Fisher et al. 2014, Lawrence et al. 2019).
Leaf R is determined by a series of enzymatic reactions in the cytosol and mitochondria
and is therefore temperature dependent. In the short-term (minutes, hours) leaf R increases quasi-

10
exponentially with increasing measurement temperature before reaching an optimum, typically
between 50 and 60 °C (O’Sullivan et al. 2017, Aspinwall et al. 2017). This temperature
sensitivity has led to the prediction that climate warming will accelerate the positive feedback
between CO2 and temperature. However, there is considerable evidence that plants may
‘acclimate’ to changes in growth temperature by modifying the short-term temperature response
of R. In most cases, thermal acclimation of R results in partial or complete homeostasis of leaf R
across changing growth temperatures. At the plant scale, thermal acclimation helps balance the
supply of ATP and carbon skeletons for growth while reducing the C cost of maintenance R
(Atkin and Tjoelker 2003, Atkin et al. 2005). Acclimation can occur within a few days of a
change in growth temperature (Bolstad et al. 2003, Lee et al. 2005, Aspinwall et al. 2016). Many
plants acclimate to increasing growth temperatures by reducing R at a set measurement
temperature (i.e. 25 °C, Slot and Kitajima 2015). This type of acclimation is referred to as Type
II acclimation and is considered a change in respiratory capacity (Atkin and Tjoelker 2003). Less
commonly, thermal acclimation can result in a reduction in the short-term temperature sensitivity
of R (Q10, activation energy, Slot and Kitajima 2015). This type of acclimation is referred to as
Type I acclimation (Atkin and Tjoelker 2003). Type II acclimation may be the result of changes
in respiratory enzyme concentrations, while Type I acclimation is probably the result of
regulatory changes in respiratory enzymes (Atkin et al. 2005). Across sites and species, patterns
of thermal acclimation of R are generally associated with changes in leaf N and adjustments in
photosynthetic capacity (e.g. Vcmax, Atkin et al. 2015, Wang et al. 2020). Similar coupling of R,
Vcmax, and leaf N across different growth temperatures is sometimes observed at the local scale
with individual species (Tjoelker et al. 1999, Lee et al. 2005, Crous et al. 2017).

11
Thermal acclimation of R has important implications for C cycle responses to
temperature at local and global scales, as well as climate C cycle feedbacks. Assuming
acclimation results in partial or complete homeostasis of R with changing growth temperature,
the long-term temperature sensitivity of R would be reduced over time, dampening the positive
feedback between CO2 and temperature (King et al. 2006, Smith and Dukes 2013). Without
acclimation, R would increase sharply as temperature increases, weakening ecosystem C storage,
and accelerating the positive CO2 - temperature feedback (Atkin and Tjoelker 2003, Atkin et al.
2014, Heskel et al. 2014). Modelling experiments that have incorporated thermal acclimation of
photosynthesis or R have demonstrated that acclimation significantly alters estimates of C pools
and fluxes. Lombardozzi et al. (2015) found that simulating thermal acclimation of
photosynthesis and R in models resulted in a 20 Pg increase in terrestrial C pools by the end of
the 21st century. Smith et al. (2016) also found that accounting for thermal acclimation improved
model performance and suggested that acclimation results in higher net C storage and uptake
than currently predicted.
Although leaf R and patterns and mechanisms of thermal acclimation of leaf R are better
understood and better represented in TBMs, important knowledge gaps and data uncertainties
remain. Direct measures of leaf R or its temperature sensitivity over space and time are relatively
rare for coastal wetland species, and only a handful of studies have quantified thermal
acclimation of leaf R in mangrove species (see Akaji et al. 2019, Aspinwall et al. 2021) and none
have examined thermal acclimation in marsh grasses. As a result, respiratory responses of coastal
plants to spatiotemporal variation in temperature and projections of coastal wetland C cycling
over space remain uncertain. It is also unclear whether seasonal acclimation and acclimation to
climate warming are equivalent, suggesting a common mechanism. Evidence for thermal

12
acclimation of R largely comes from two different types of studies: field studies of plants
responding to seasonal variation in temperature (Atkin et al. 2000; Lee et al. 2005; Ow et al.
2008, 2010; Tjoelker et al. 2008, 2009); and warming studies conducted under controlled
conditions on small plants, usually for short time periods (Bolstad et al., 2003; Bruhn et al.,
2007; Cheesman & Winter, 2013; Drake et al., 2015). Two separate experiments with tree
species from warm-temperate and boreal climates have indicated that seasonal temperature
acclimation and acclimation to climate warming may be equivalent (Aspinwall et al. 2016, Reich
et al., 2016), and physiological responses to climate warming might be predicted from studies of
physiological responses to seasonal temperature changes. There is also evidence that
acclimation-over-time and acclimation-across-space may result in similar changes in leaf R in
response to changes in temperature (Vanderwel et al. 2015). New studies are required to
determine whether convergent temperature acclimation of R is common and generalizable across
disparate ecosystems and communities, including coastal wetlands. Finally, it remains unclear
whether thermal acclimation capacity differs between C3 and C4 plants; both are common in
coastal wetlands. It has been hypothesized that C4 plants may show limited capacity for thermal
acclimation due to a more complex physiology (Yamori et al. 2014). Support for this hypothesis
is mixed, however, with C4 plants sometimes showing similar or comparable acclimation
responses to C3 species (Smith and Dukes 2017).
The marsh-mangrove ecotone on the northern Atlantic coast of Florida (USA) provides
an opportunity to address these uncertainties. The ecotone represents a highly productive coastal
wetland transitional zone where the southern limit of temperate saltmarsh habitat converges with
the northern limit of tropical mangrove habitat. The purpose of this study was to test whether C4
marsh grass species (Spartina alterniflora) and C3 mangrove species (Avicennia germinans)

13
growing in a coastal wetland show evidence of seasonal temperature acclimation of leaf R, and
whether seasonal temperature acclimation of leaf R is consistent in plants growing under ambient
and experimentally warmed conditions, as well as across sites at the northern and southern edge
of the ecotone. We accomplished this by repeatedly measuring the short-term temperature
responses of leaf R over a 10-month period in marsh and mangrove plants grown in situ under
ambient temperatures and experimental warming at two sites within the ecotone. For each
species, we then developed empirical models describing the relationship between prevailing
(seasonal) air temperature and R at 25 °C and the Q10 of R. We tested whether site or
experimental warming altered the relationship between prevailing air temperature and R at 25 °C
or the Q10 of R. We also determined leaf N on a subset of leaves and tested whether leaf N scales
positively with marsh grass and mangrove leaf R, over time and across sites and treatments. We
hypothesized that both species should show declining leaf R at 25 °C (and/or Q10) with
increasing growth temperature, demonstrating seasonal acclimation, but the decline would be
stronger for the C3 mangrove species than the C4 marsh grass. We also hypothesized that
seasonal acclimation of R would be consistent across ambient and warmed treatments, and across
northern and southern sites, demonstrating convergent temperature acclimation of leaf R.
Materials and methods
Study sites and experimental design
This study took place at two sites in the Guana Tolomato Matanzas National Estuarine Research
Reserve (GTMNERR) on the Atlantic coast of northeast Florida, near St. Augustine. The
estuarine vegetation in GTMNERR represents a marsh-mangrove ecotone. The southern limit of
saltmarsh habitat converges and overlaps with the northern limit of mangrove habitat in Florida,

14
although mangroves are increasingly common north of GTMNERR. The northern site (NS) was
located roughly 14 km north of St. Augustine along the Tolomato River near the northern edge
of GTMNERR (30°00'41.9"N 81°20'39.2"W). The southern site (SS) was located roughly 20 km
south of St. Augustine, 34 km to the south of the northern site, and just north of the Matanzas
Inlet (29°43'38.3"N 81°14'25.0"W). The NS and SS have similar elevation, and average annual
precipitation at the GTMNERR reserve is 1317 mm (Chapman et al. 2021). Mean annual
temperature (2001–2018) at St. Augustine is 20.8 °C. The highest monthly mean daily max
temperature (July) is 31.97 °C, and the lowest monthly mean daily low temperature (January) is
11.13 °C (NOAA). Spartina alterniflora (smooth cordgrass) and Avicennia germinans (black
mangrove) are common at both sites although A. germinans trees are generally larger and more
abundant at SS. Spartina alterniflora is a C4 grass that dominates temperate estuaries along the
east coast of North America and subtropical estuaries in the Gulf of Mexico and northern
Florida. Avicennia germinans is a broadly distributed mangrove species native to warm-
temperate, subtropical, and tropical regions of the Americas and Africa. On the Pacific coast, its
distribution stretches from Mexico to Peru. On the Atlantic coast, its distribution stretches from
North Florida to southern Brazil. All mangroves selected for this study ranged from 4-11 years
old in 2018 with an average age of 7.4 years and 7.2 years at SS and NS respectively (Chapman
et al. 2021).
The study included six replicates of four treatment plots at each site. The four
treatments were: A. germinans ambient, A. germinans warmed, S. alterniflora ambient, and S.
alterniflora warmed. Treatment plots were randomly positioned within a one-hectare area at
each site. The warmed plots were enclosed in 1.5m × 1.5m × 1.5m chambers, framed with PVC
and wrapped in 6 mil polyethylene greenhouse film (Greenhouse Megastore, Danville, IL, USA)

15
that transmits ~90% of photosynthetically active radiation. The chamber top was left open to
allow for air circulation and natural rainfall. The chambers ‘trap’ radiation causing the chamber
air to passively warm. This passive warming design was chosen based on ease of construction,
portability, and durability. In the event of a tropical storm, we removed the polyethylene film
from the PVC frames so that chambers would not become airborne. In comparison to warming
experiments with infrared heaters, our design did not necessarily change the canopy surface
temperature, but instead increased the air temperature. Infrared (active) heating experiments may
increase canopy surface temperature without increasing air temperature (Smith et al. 2020). This
differentiation is important given that air temperatures are expected to increase while canopy
temperatures may or may not depending on transpirational cooling (e.g. Drake et al. 2018). A
limitation of our passive warming design was that warming could not be applied at night or
during cloudy conditions. Air temperature (Tair) and relative humidity (RH) were measured every
15 minutes in the center of two ambient and warmed treatment plots using an air temperature/RH
sensor covered in a solar radiation shield (HOBO MX2302 External Temperature/RH Sensor,
Onset Computer Corp., Bourne, MA). Gaps in Figure 1 weather data were a result of HOBO
logger failure in warmed and ambient plots. A dual failure scenario left us with no way to
precisely gap fill temperature data. However, when HOBO failure was limited to ambient
temperature measurements, data were gap filled using nearby GTMPCMET (Guana Tolomato
Matanzas Pellicer Creek Meteorological) weather station data. Data loggers were reset prior to
sampling dates to ensure temperatures were accurately recorded.
Over the course of the experiment, mean daily (24-hr) Tair was on average 0.66 °C and
0.63 °C higher in the warmed treatment than mean daily Tair in the ambient treatment at the SS
(Figure S1c) and NS (Figure S1a), respectively (SS ambient mean daily Tair = 22.9 ± 5.1

16
(standard deviation) °C, warmed mean daily Tair = 23.6 ± 5.4 °C; NS ambient mean daily Tair =
22.8 ± 5.1 °C, warmed mean daily Tair = 23.5 ± 5.3). Daily maximum Tair was on average 3.2 °C
and 3.1 °C higher in the warmed treatment than the ambient treatment at the SS (Figure S1d) and
NS (Figure S1b), respectively (SS ambient daily max Tair = 27.5 ± 5.2 °C, warmed daily max Tair
= 30.7 ± 5.8 °C; NS ambient daily max Tair = 28.1 ± 5.2 ± °C, warmed mean daily Tair = 31.2 ±
5.8 °C). Warming of this magnitude (1-3 °C) is expected by 2050 throughout the southeast U.S.
(Ashfaq et al. 2016, Diem et al. 2017). The daily mean relative humidity (RH) at both sites was
similar. SS daily mean RH was 85.3 ± 8.4% (Figure 1b) and NS daily mean RH was 83.1 ± 7.1%
(Figure 1e). Overall, average RH was similar in the ambient and warmed plots at both sites. As a
result of high RH, the daily mean VPD was <1 at both sites (Figure 1 c, f), with only small
differences in VPD between warmed and ambient treatment plots (Figure 1f).
Temperature response of leaf respiration
Measurements of the short-term temperature response of leaf dark respiration (R) were
conducted at 6 timepoints (October, December, February, April, June, July) over a 10-month
period. Each monthly campaign of leaf collection was split over a maximum of two days at each
site (four days total). An equal number of leaves from each species and treatment were selected
during each campaign to avoid sampling-date bias. On each sampling day we collected two
recent and fully developed upper canopy leaves from S. alterniflora and three recent and fully
developed upper canopy leaves from A. germinans. Leaves were collected pre-dawn (04:30 –
06:00 local time) to avoid activation of photosynthesis. The excised leaves were placed in
Ziplock bags with moist paper and transferred to the lab in complete darkness. Previous studies
have found no effect of leaf removal on leaf R measurements (O’Sullivan et al. 2013; Aspinwall

17
et al. 2017; 2019). Moreover, all measurements were completed the same day as leaf collection
and we found no evidence that leaf R changed with time since leaf removal. Leaf area (cm2) of
the measured leaves was determined with a leaf area meter (LI-3000C, LI-COR BioSciences,
Lincoln, NE, USA) just prior to measurements of leaf R. Leaf area data were used to calculate R
per unit area (Rarea μmol m–2 s–1).
Short-term temperature response curves of leaf R were completed by sealing excised
leaves inside a large gas-exchange chamber (3010-GWK1, Heinz Walz GmbH, Effeltrich,
Germany) connected to a portable infrared gas-analyzer (LI-6400XT, LiCor Inc, Lincoln, NE,
USA). The large gas-exchange chamber was set at 20 °C, while the flow rate and reference CO2
(both controlled by the infrared gas-analyzer) were set at 500 mol s–1 and 410 µmol mol-1,
respectively. Tleaf on the abaxial surface of the leaf was continuously measured with a small-
gauge copper constantan thermocouple wire attached to a LI-6400XT external thermocouple
adaptor (LI6400–13, LI-COR BioSciences). To facilitate measurements of R, the airflow from
the chamber was connected to the ‘sample’ gas line of the LI-6400XT fitted with an empty and
closed 2×3 cm cuvette. The incoming air was dried before entering the 3010-GWK1 chamber by
routing the incoming air through the LI-6400XT desiccant column. Once rates of R reached
steady-state at 20 C (~5 min) the temperature of the leaf was increased from 20C - 40C at a
rate of 1C per minute using the chamber software (GFS-Win, Heinz Walz GmbH) while
continuously (30 second interval) measuring Rarea (Figure S2). After temperature response
measurements were completed, leaves were dried at 70 °C for ~72 hours after which leaf dry
mass measurements were recorded to determine leaf dry mass per unit area (LMA, g m-2). Leaf R
per unit mass (Rmass, nmol g-1 s-1) was calculated by dividing Rarea (×1000) by LMA (Figure S3).
Leaf tissue was then homogenized and dried at 105°C for ~16 hours, stored under desiccation,

18
and leaf N per unit mass (Nmass, % or mg N g-1) was determined using a combustion elemental
analyzer (Rapid max N, Elementar Americas Inc., Ronkonkoma, NY, USA). Leaf N per unit area
(Narea, g N m-2) was calculated as the product of %N and LMA.
Modelling the temperature response of respiration
Nonlinear regression was used to model the temperature response of leaf R. Nonlinear models
were fit using R version 3.43 (R Core Team 2017). To determine the appropriate model for our
data, we compared the suitability of three different algorithms following the approach of
Aspinwall et al. (2017): (1) a log polynomial function, which describes the non-linear
relationship between natural log transformed R and Tleaf (O’Sullivan et al. 2013; Heskel et al.
2016), (2) an exponential function with a single Q10 value which assumes that the temperature
sensitivity of R is constant across the entire measurement temperature range (e.g. Tjoelker et al.
2001), and (3) a modified Arrhenius function, which accounts for a non-exponential increase in
R with increasing Tleaf (Lloyd and Taylor 1994). The polynomial function is written as:
(1) ln R = a + bT + cT2 or
(2) 𝑅 = 𝑒𝑎+𝑏𝑇+ 𝑐𝑇2
where T is Tleaf and a is an estimate of ln R at 0 °C, b is the slope of temperature response of ln R
at 0 °C, and c describes any nonlinearity in the temperature response of ln R with increasing Tleaf.
The differential of Eqn 2 can be used to estimate the Q10 of R at any Tleaf: 𝑄10 = 𝑒10 ×(𝑏+2𝑐𝑇).
Among these algorithms, the polynomial (Equation 1) provided the best fit to our data, with a
strong linear relationship (R2 = 0.998) between observed and predicted values of ln R, and
residuals values normally distributed around zero with little pattern associated with increasing

19
Tleaf. Thus, we used the polynomial equation to model the temperature response of R and used
coefficients a, b and c to estimate Rarea and Rmass at 25 °C (Rarea25, Rmass25), and the Q10 of R
(between 20 and 30 °C) for each leaf (Table S1). Repeated estimates of Rarea25, Rmass25, and Q10
over time provide a direct way of determining the direction and magnitude of seasonal thermal
acclimation (Aspinwall et al. 2019).
Data analysis
All analyses were performed using R version 3.43 (R Core Team 2017). As a preliminary step in
our analysis, we carried out variance partitioning to determine the proportion of the overall
variance in each trait (e.g. Rarea25) explained by different experimental factors (species,
measurement dates, site, treatment). The variance partitioning results indicated that 'species'
accounted for the majority of the variance in most traits (16-68%), while other factors generally
explained a much smaller proportion of the variance (0-7%) (Figure S4). Therefore, the
remainder of the analysis was conducted separately for each species.
For each species, mixed-effect models were used to test the fixed effects of time
(measurement date), temperature treatment (ambient, warmed), site (SS, NS) and their respective
interactions on Rarea25, Rmass25, Q10, LMA, Nmass, and Narea. For consistency, we analyzed estimates
of Rarea25, Rmass25, and Q10 derived from our temperature response models rather than observations
at 25 °C, although estimates and observed rates were nearly identical given the high resolution of
our temperature response data. Homogeneity of variance for model results were tested using
Levene's and Shapiro-Wilk tests. Data were log or square-root transformed as necessary.
For each species, analysis of covariance (ANCOVA) was used to test relationships
between Rarea25, Rmass25, Q10, LMA, Nmass, and Narea values and prevailing mean daily air
temperature of the preceding 7 days (mean daily Tair) and determine whether relationships

20
differed between sites or treatments. If seasonal temperature acclimation of leaf R is occurring,
we expect negative linear relationships between mean daily Tair and Rarea25, Rmass25, or the Q10 of
R (e.g. Aspinwall et al. 2016). The strength of acclimation is determined by the slope of this
relationship; stronger acclimation is indicated by a more negative slope estimate. In this model,
site and treatment were treated as factors and mean daily Tair a covariate. A significant (P<0.05)
interaction between mean daily Tair and site or treatment indicated that site or treatment affected
the relationship between mean daily Tair and the response variable (e.g. Rarea25), and different
slope parameters were required for each site or treatment. If site, treatment, and mean daily Tair
were significant (P<0.10), with no interactions, equations with different intercepts for each site
or treatment, but a common slope, were fit to the data. If only mean daily Tair was significant,
one equation describing the relationship between mean daily Tair and the response variable was
fit to data from both sites and treatments. We also used ANCOVA to test whether leaf N (Nmass,
Narea) scales positively with respiratory capacity (Rarea25, Rmass25), and whether site or treatment
changes the relationship between leaf N and respiratory capacity.
Results
Leaf R, leaf N, and LMA over space and time
In Avicennia, Rarea25, Rmass25, and Narea varied over time, but differences among time points were
dependent upon site (significant date × site interactions Table 1, 2). Rarea25 was lower at SS than
NS in December 2019 (SS: 0.86 ± 0.04 μmol m-2 s-1, NS: 1.09 ± 0.04 μmol m-2 s-1), but higher at
SS than NS in July 2020 (SS: 1.30 ± 0.04 μmol m-2 s-1, NS: 1.05 ± 0.04 μmol m-2 s-1, Figure 2a).
Rmass25 was also higher at SS than NS in July 2020 (SS: 7.64 ± 0.36 nmol g-1 s-1, NS: 4.36 ± 0.36

21
nmol g-1 s-1, Figure 2c). Narea was lower at SS (3.22 ± 0.23 g N m-2) than NS (4.29 ± 0.17 g N m-
2) in October 2019 (Figure 2i).
Across both sites, warming increased Rarea25 by 8% (ambient Rarea25 = 1.05 ± 0.02 μmol m-
2 s-1, warmed Rarea25 = 1.14 ± 0.02 μmol m-2 s-1). However, warming effects on Rmass25 differed
between sites (treatment × site interaction, Table 1). Warming increased Rmass25 by 24% at SS
(ambient Rmass25 = 4.56 ± 0.22 nmol g-1 s-1, warmed Rmass25 = 5.67 ± 0.23 nmol g-1 s-1) but did not
affect Rmass25 at NS (mean = 4.43 ± 0.21 nmol g-1 s-1).
The Q10 of R varied over time (Table 1) and was highest in February (2.25 ± 0.05) and
April 2020 (2.26 ± 0.05), and lowest in June 2020 (1.94 ± 0.05, Figure 2e). Q10 did not differ
between treatments but differed between sites (Table 1). Q10 was higher at SS (2.17 ± 0.03) than
NS (2.03 ± 0.03). LMA showed a complex pattern; with variation over time depending upon
both treatment and site (treatment × date × site, Table 1) (Figure 2g). LMA was highest in
warmed plants at NS in July 2020 (272 ± 10.4 g m-2) and October 2019 (277 ± 10.4 g m-2), and
lowest in ambient plants at SS in July 2020 (168 ± 10.4 g m-2). Nmass did not differ between sites
or treatments (Table 2), but was 15% higher in June 2020 (17.1 ± 0.60 g N kg-1) than in February
2020 (14.9 ± 0.60 g N kg-1).
In Spartina, Rarea25, Rmass25, and LMA varied over time, but differences among time points
were dependent upon site (i.e., date × site interaction, Table 1, Figure 2). In October 2019, Rarea25
was higher at SS (1.71 ± 0.11 μmol m-2 s-1) than at NS in February 2020 (1.19 ± 0.10 μmol m-2 s-
1) (Figure 2b). Rmass25 was generally higher during winter (December, February) and lower during
summer (June, July) (Figure 2). In December 2019, Rmass25 was significantly lower at SS (9.9 ±
0.5 nmol g-1 s-1) than NS (13.6 ± 0.5 nmol g-1 s-1). Rmass25 was similar between sites across all
other dates. LMA showed the opposite seasonal pattern of Rmass25; lowest in winter and highest

22
during peak growing season. In February 2020, LMA was significantly higher at SS (128 ± 5.9 g
m-2) than NS (99 ± 5.9 g m-2). On average, warming reduced Rmass25 6.4% across all timepoints
(Table 1, ambient Rmass25: 10.9 ± 0.2 nmol g-1 s-1, warmed Rmass25: 10.2 ± 0.2 nmol g-1 s-1) but had
no effect on Rarea25 or LMA. The Q10 of R varied over time and was higher in February 2020
(1.94 ± 0.03) than June 2020 (1.77 ± 0.03) (Figure 2e). The Q10 of R was similar across sites and
treatments (Table 1). Nmass varied over time, but differences among time points were dependent
upon temperature treatment (significant date × treatment interaction, Table 2). In February 2020,
Nmass was significantly lower in warmed plants (15.7 ± 0.6 g N kg-1) than ambient plants (18.3 ±
0.6 g N kg-1) (Figure 2k). Narea did not differ between dates, treatments, or sites (and no
interactions, Table 2) and averaged (2.04 ± 0.08 g N m-2).
Relationships between Tair and leaf R, leaf N, and LMA
For each species, we expected that Rarea25 and Rmass25 would decline as seasonal temperatures
increased, demonstrating seasonal acclimation. We hypothesized that seasonal acclimation
would be stronger in Avicennia than Spartina, but within each species seasonal acclimation
would be consistent across sites and treatments. For Avicennia, ANCOVA results indicated that
the response of Rarea25 and Rmass25 to prevailing mean daily Tair differed between sites (Tair × site
interaction, Table 3). At SS, we found a positive relationship between mean daily Tair and Rarea25
and Rmass25 (Table 4, Figure 3a,c). At NS, Rarea25 and Rmass25 showed no clear relationship with
mean daily Tair (Figure 3a,c). In agreement with our ANOVA results above, we found that
warming generally increased Rarea25 and Rmass25 across sites and prevailing mean daily Tair (Figure
3a,c). These results provide little evidence for thermal acclimation of respiratory capacity (Type
II acclimation, Atkin and Tjoelker 2003) in Avicennia growing at their northern range limit.

23
However, ANCOVA results revealed that the Q10 of R decreased as mean daily Tair increased
(Table 3, Figure 3e), indicating Type I thermal acclimation (Atkin and Tjoelker 2003). This
acclimation response was consistent across treatments and sites, although the intercept of the
relationship was significantly lower at NS than SS (Table 3, 4; Figure 3e).
In Avicennia, LMA decreased as mean daily Tair increased, but the slope of the
relationship differed between sites (Tair × site interaction, Table 3, 4). LMA decreased faster with
increasing Tair at SS than NS (Table 4, Figure 3g). Similar to our ANOVA results, warming
effects on LMA differed between sites (treatment × site interaction, Table 3). Warming generally
reduced LMA at SS but did not change LMA at NS. Lastly, Nmass increased as mean Tair
increased and did so consistently across treatments and sites (Table 3, Figure 3i).
Spartina showed clear evidence of Type II and Type I thermal acclimation of R across
seasons. Seasonal acclimation patterns were consistent across treatments and sites. Specifically,
Rmass25 decreased with increasing mean daily Tair; the intercept of the relationship was lower at
SS than NS (Table 4, Figure 3d). This relationship accounts for increasing LMA with Tair (Figure
3h) which obscured the relationship between area-based respiratory capacity and Tair (Figure 3b).
The Q10 of R also decreased with increasing mean daily Tair (Figure 3f). Nmass declined with
increasing Tair, although the decline in Nmass with increasing Tair differed between treatments (Tair
× treatment interaction, Table 3). Across sites, warming reduced the intercept and slope of the
relationship between Tair and Nmass (Figure 3j, Table 4).
Scaling of leaf N and R
In general, we found that leaf N (area- and mass-basis) scaled positively with leaf R (area- and
mass-basis) in both species. However, in some cases, relationships between leaf N and R

24
depended upon treatment or site (Table 5). In Avicennia, Rarea25 increased with Narea at SS but not
NS, and Rarea25 at a given Narea was higher under warming than ambient conditions (Table 6,
Figure 4a). Nmass and Rmass25 scaled positively although the intercept was higher in plants at SS
(Table 5, 6; Figure 4c).
In Spartina, the slope of the Narea – Rarea25 relationship was slightly higher at SS than NS
(Table 5,6; Figure 4b). The positive relationship between Nmass and Rmass25 was consistent across
treatments and sites (Table 5, 6; Figure 4d). Although temperature acclimation of R differed
between Avicennia and Spartina, changes in leaf N explained thermal acclimation patterns in
both species.
Discussion
Spatiotemporal patterns of leaf R, the temperature sensitivity of R (Q10), and temperature
acclimation of leaf R have been understudied in coastal marsh and mangrove species (Duarte
2017; Adame et al. 2018; Akaji et al. 2019, Aspinwall et al. 2021). To address this knowledge
gap, we examined seasonal temperature acclimation of leaf R in a C4 marsh species (Spartina
alterniflora) and C3 mangrove species (Avicennia germinans) growing under ambient and
experimentally warmed temperatures at two sites within a marsh-mangrove ecotone. We also
tested whether leaf N scales positively with marsh grass and mangrove leaf R over time and
across sites and treatments. We hypothesized that both species would reduce leaf R at 25 °C
(and/or Q10) with as growth temperatures increased over time, demonstrating seasonal
temperature acclimation, but the decline would be stronger for the C3 mangrove species than the
C4 marsh grass. We also hypothesized that seasonal acclimation of R would be consistent across
treatments and sites. In Avicennia, we found that Rarea25 and Rmass25 showed no relationship with

25
prevailing Tair at the north site, increased with Tair at the south site, and generally increased with
experimental warming across both sites. These results indicated no temperature acclimation of
respiratory capacity (no Type II acclimation) in Avicennia. Yet, the Q10 of R decreased as
seasonal temperatures increased (Type I acclimation) and did so consistently across sites and
treatments. In Spartina, Rmass25 and the Q10 of R both declined as seasonal temperatures increased
(demonstrating Type I & II acclimation). These seasonal patterns of temperature acclimation
were largely consistent across sites and treatments. These results do not support the expectation
for weaker temperature acclimation of R in Spartina than Avicennia. However, the Spartina
results supported our expectation of convergent temperature acclimation of R over time, space,
and temperature treatments. Although species differed in regulating respiratory capacity over
time, sites, and treatments, leaf N scaled positively with leaf R in both species. These results
improve our quantitative and predictive understanding of temperature controls of leaf R in
coastal wetland species.
In a synthesis of studies, Slot and Kitajima (2015) found a significant downregulation of
leaf R in response to increasing growth temperature (Type II acclimation) in 73% of the cases
examined. This suggests that temperature acclimation of respiratory capacity is relatively
common across species and systems – although coastal wetland plant species were not included
in that synthesis. We expected marsh and mangrove species would generally conform to the
patterns observed across terrestrial plant species. However, in contrast to our expectations,
Avicennia generally increased Rarea25 and Rmass25 with increasing growth temperatures, although
no seasonal pattern was observed at the north site. Moreover, we found no evidence for
convergent acclimation of respiratory capacity over time, and across sites and treatments in
Avicennia. This contrasts with results from previous warming experiments with warm-temperate,

26
temperate, and boreal tree species growing at individual sites (Aspinwall et al. 2016, Reich et al.
2016). This also contrasts with analyses indicating similar changes in leaf R with increasing
temperature across space and time (Vanderwel et al. 2015). Ultimately, our results indicate that
changes in respiratory capacity may not be easily predicted by growth temperature, at least in
Avicennia growing at its northern range limit.
The increase in respiratory capacity with increasing temperature in Avicennia might be
explained by temporal variation in salinity, nutrient availability, or the inherent functional
strategy of this species. Coastal wetlands are dynamic systems where water levels (i.e. tides) and
salinity can vary diurnally and seasonally. Salinity depends on relative proximity to the ocean
and freshwater inputs, seasonality of precipitation, and rates of evaporation which change with
temperature. In our experiment, the southern site was near an inlet and thus closer to the open
ocean while the northern site was further from the ocean and closer to freshwater inputs. This
may have resulted in higher salinity at the southern site, particularly during the summer when
temperatures and evaporation are high. Indeed, previous work at the southern site indicated that
salinity was particularly high during summer (up to 60 ppt) and lower during winter (48 ppt)
(Dangremond et al. 2020). Previous studies have also found modest increases in leaf R with
increasing salinity, presumably due to costs associated with maintaining cellular ion gradients
(Lopez-Hofmann et al. 2007, Aspinwall et al. 2021). Thus, the combination of warmer growth
temperatures and higher salinity might explain why R increased with Tair at the southern site, and
why thermal acclimation appeared constrained.
However, averaged across sites, respiratory capacity also increased with experimental
warming, suggesting that salinity alone is unlikely to explain the increase in leaf R with warmer
growth temperatures. Instead, coordination between leaf R and photosynthetic capacity might

27
explain the positive relationship between growth temperature and respiratory capacity in
Avicennia. Importantly, we found that variation in respiratory capacity (e.g. Rmass25) over time
and across sites and treatments was largely explained by changes in leaf N. The coupling of leaf
N and respiratory capacity could represent enzyme limitation of respiratory capacity (Ryan et al.
1996). However, across other studies leaf N and Rubisco carboxylation (Vcmax) are often coupled
given that a large fraction of N is allocated to Rubisco. A new theory also indicates that
temperature acclimation of leaf R is consistent with maintenance of ‘optimal’ photosynthetic
capacity, where respiratory capacity increases to support processes that maintain photosynthesis
(e.g. protein turnover, Wang et al. 2020). We hypothesize that respiratory capacity increased
with temperature in Avicennia due to concomitant changes in photosynthetic capacity, which
were reflected in changes in leaf N. If true, Avicennia responded to increasing growth
temperature by also increasing photosynthetic capacity; a response which is not necessarily
consistent with studies of photosynthetic temperature acclimation over space and time (Way and
Sage 2008, Way and Yamori 2014, Ali et al. 2015). Further studies are required to determine
whether the increase in R with growth temperature in Avicennia was coupled with increased
photosynthetic capacity.
Temporal patterns in leaf R and leaf N in Avicennia may have also been influenced by
nutrient availability, which could vary with air and soil temperature. In general, warmer soil
surface temperatures during summer may speed up decomposition and N mineralization (Kirwan
and Blum 2011, Gao et al. 2014) which could increase N availability and potentially result in
higher leaf N concentrations. Results from a fertilization experiments near our southern site have
demonstrated that higher N availability leads to higher leaf N concentrations in Avicennia
(Simpson et al. 2013, Dangremond et al. 2020). Although seasonal changes in N availability

28
were not quantified in our study, we did find evidence that leaf N concentrations increased with
prevailing air temperature across both sites. Therefore, higher N availability during warmer time
periods may have resulted in higher leaf N, greater photosynthetic capacity, and coordinated
increases in respiratory capacity in Avicennia (Wang et al. 2020).
Although respiratory capacity increased with growth temperature in Avicennia, indicating
no type II temperature acclimation, some temperature acclimation did occur mainly through a
reduction in the short-term temperature sensitivity of R, also referred to as Type I acclimation
(Atkin and Tjoelker 2003, Slot and Kitajima 2015). This acclimation response is less common
and results in weaker temperature acclimation than Type II acclimation, but it has been observed
in several studies (Atkin et al. 2000, Zaragoza-Castells et al. 2007, Ow et al. 2010). Mechanistic
explanations of Type I acclimation remain speculative; however, it has been hypothesized that a
reduction in the temperature sensitivity of R is the result of regulatory changes in several
respiratory enzymes (Atkin et al. 2005, Kruse et al. 2011; 2020). Other studies have identified
positive relationships between soluble sugars and the Q10 of R (Azcón-Bieto et al. 1983, Ow et
al. 2010) which could reflect substrate limitation of the maximum catalytic enzyme activity
(Atkin and Tjoelker 2003). Although the cause of the reduction in the Q10 with increasing
temperature is unclear, it is possible that high respiratory demand during summer may have
drawn down soluble sugar concentrations in leaves which in turn reduced maximum catalytic
activity and the temperature sensitivity of R. Whatever the explanation, our results indicate that
Avicennia may show modest reductions in the temperature sensitivity of R as temperatures
increase, which could mitigate rising leaf CO2 efflux as the climate warms.
Compared to C3 plants, C4 plants have a more complex photosynthetic apparatus
(mesophyll-bundle sheath complex). This complexity has been hypothesized to come at a cost of

29
reduced phenotypic plasticity or lower temperature acclimation capacity in C4 plants (Sage and
McKown 2006, Yamori et al. 2014). Yet, experimental work has found no clear differences in
thermal acclimation responses between C3 and C4 plant species (Smith and Dukes 2017). We
tested the expectation that Spartina would show weaker temperature acclimation than Avicennia
and found no support for this expectation. In fact, we found that Spartina reduced Rmass25 and the
Q10 of R as growth temperatures increased (Type II acclimation and Type I acclimation) over
time and across treatments while Avicennia generally showed increased respiratory capacity with
temperature. Moreover, in Spartina, this acclimation response was consistent across sites
demonstrating convergent acclimation to changes in growth temperature. This result aligns with
patterns of thermal acclimation observed in tree species representing different biomes (Aspinwall
et al. 2016, Reich et al. 2016). We conclude that Spartina, a dominant C4 marsh grass, may show
rather consistent temperature acclimation of leaf R over space and time, which could reduce the
sensitivity of coastal wetland (especially marsh-dominated) C fluxes to changes in temperature,
and dampen the positive feedback between warming and rising atmospheric CO2 (King et al.
2006, Smith & Dukes 2013, Lombardozzi et al. 2015).
Although temperature acclimation of R differed between Spartina and Avicennia,
changes in leaf N (particularly, Nmass) explained temporal and spatial variation in respiratory
capacity in both species. The relationship between leaf N and leaf R (area- and mass-based) was
stronger for Spartina than Avicennia and was relatively consistent across treatments and sites.
Theory suggests that temperature acclimation of R arises through the importance of respiration in
maximizing photosynthetic capacity under natural conditions (Wang et al. 2020), where
photosynthetic capacity is strongly influenced by concentrations of photosynthetic proteins
which represent a large fraction of leaf N. Predictions of this theory have been validated with C3

30
plants but not C4 plants. Even if this prediction holds, our results show clearly contrasting
responses of respiratory capacity to seasonal temperature changes in Avicennia and Spartina.
These contrasting responses could be due to factors not directly related to photosynthetic
pathway (i.e. C3 vs C4). Species differences in leaf N and R over time may be in part related to
differences in nutrient acquisition or inherent differences in resource investment over seasons.
For instance, Avicennia is an evergreen species and is known to be very responsive to N
enrichment in these systems (Simpson et al. 2013, Dangremond et 2020). At any given time, leaf
N may be higher when N availability is higher. In our study, Avicennia also generally responded
to increasing seasonal temperatures by reducing LMA and increasing leaf N. Spartina is also
responsive to nutrients (e.g. Mendelssohn 1979) and may also generally increase leaf N with
increased N availability (e.g. Gallagher 1975). However, Spartina exhibits a strong seasonality to
leaf development and leaf N concentrations; LMA generally increases with growth temperature
while leaf N generally decreases with growth temperature. These distinct seasonal patterns that
may explain the contrasting responses of leaf R to prevailing Tair between species, but also the
close coupling of leaf N and R across species.
More broadly, our results indicate that leaf N may be an effective predictor of foliar C
fluxes in dominant coastal wetland species, irrespective of temperature, just as leaf N is used as a
predictor of leaf R in land surface models that predict terrestrial C fluxes over space and time
(Atkin et al. 2015, Fisher et al. 2014, Lawrence et al. 2019). In fact, in our species and across our
sites, it appears that leaf N may explain more variation in leaf R than prevailing growth
temperature. We note that coastal wetlands are not well-represented in land surface models due
to gaps in our understanding of key processes and data limitations. The data presented here offer

31
an opportunity to improve representation and parameterization of CO2 exchange between coastal
vegetation and the atmosphere in land surface models.
Our results provide new information about respiratory C fluxes in marsh and mangrove
vegetation. They suggest that C4 marsh grasses and C3 mangrove species growing together may
show contrasting respiratory responses to temperature, yet both species show a positive
relationship between respiratory capacity and leaf N. The data presented here may be useful in
modelling ecological processes and physiological feedbacks for coastal marsh-
mangrove ecosystems under current and future climate warming scenarios. Future studies that
explore plant-soil and plant-air interactions in coastal wetlands, will further advance our
understanding of C fluxes in these systems.

32
References
Ainouche, M., Gray, A. Invasive Spartina: lessons and challenges. Biol Invasions 18, 2119–2122
(2016). https://doi.org/10.1007/s10530-016-1201-7
Akaji, Y., Inoue, T., Tomimatsu, H. et al. Photosynthesis, respiration, and growth patterns
of Rhizophora stylosa seedlings in relation to growth temperature. Trees 33, 1041–1049
(2019). https://doi.org/10.1007/s00468-019-01840-7
Alongi, D.M. Carbon Balance in Salt Marsh and Mangrove Ecosystems: A Global Synthesis. J.
Mar. Sci. Eng. 2020, 8, 767. https://doi.org/10.3390/jmse8100767
Aspinwall, M. J., Drake, J. E., Campany, C., Vårhammar, A., Ghannoum, O., Tissue, D. T., …
Tjoelker, M. G. (2016). Convergent acclimation of leaf photosynthesis and respiration to
prevailing ambient temperatures under current and warmer climates in Eucalyptus
tereticornis. New Phytologist, 212, 354–367. https://doi.org/10.1111/nph.14035
Aspinwall, M., Vårhammar, A., Blackman, C., Tjoelker, M., Ahrens, C., Byrne, M., … Rymer,
P. (2017). Adaptation and acclimation both influence photosynthetic and respiratory
temperature responses in Corymbia calophylla. Tree Physiology, 37, 8, 1095–1112.
Aspinwall, M. J., Pfautsch, S., Tjoelker, M. G., Vårhammar, A., Possell, M., Drake, J. E., Reich,
P. B., Tissue, D. T., Atkin, O. K., Rymer, P. D., & Dennison, S. (2019). Range size and
growth temperature influence Eucalyptus species responses to an experimental heatwave.
Global Change Biology, 25, 1665–1684. https://doi.org/10.1111/gcb.14590
Aspinwall MJ, Martina Faciane, Kylie Harris, Madison O’Toole, Amy Neece, Vrinda
Jerome, Mateo Colón, Jeff Chieppa, Ilka C Feller, Salinity has little effect on
photosynthetic and respiratory responses to seasonal temperature changes in black
mangrove (Avicennia germinans) seedlings, Tree Physiology, Volume 41, Issue 1,
January 2021, Pages 103–118, https://doi.org/10.1093/treephys/tpaa107
Atkin OK, Evans JR, Ball MC, Lambers H, Pons TL. 2000. Leaf respiration of snow gum in the
light and dark. Interactions between temperature and irradiance. Plant Physiology 122:
915–923.
Atkin OK, M.G. Tjoelker. Thermal acclimation and the dynamic response of plant respiration to
temperature. Trends Plant Sci., 8 (2003), pp. 343-351
Atkin OK., Bruhn Dan, Hurry Vaughan M., Tjoelker Mark G. (2005) Evans Review No. 2:
The hot and the cold: unravelling the variable response of plant respiration to
temperature. Functional Plant Biology 32, 87-105.
Atkin OK, Meir P, Turnbull MH (2014) Improving representation of leaf respiration in large-
scale predictive climate-vegetation models. New Phytologist 202(3):743–748.
Atkin, O., K.J. Bloomfield, P.B. Reich, M.G. Tjoelker, G.P. Asner, D. Bonal, G. Bönisch, M.G
. Bradford, L.A. Cernusak, E.G. Cosio, D. Creek, K.Y. Crous, T.F. Domingues, J.S. Duke
s, J.J.G. Egerton, J.R. Evans, G.D. Farquhar, N.M. Fyllas, P.P.G. Gauthier, E. Gloor, T.E.
Gimeno, K.L. Griffin, R. Guerrieri, M.A. Heskel, C. Huntingford, F.Y. Ishida, J. Kattge,
H. Lambers, M.J. Liddell, J. Lloyd, C.H. Lusk, R.E. Martin, A.P. Maksimov, T.C. Maxi
mov, Y. Malhi, B.E. Medlyn, P. Meir, L.M. Mercado, N. Mirotchnick, D. Ng, Ü. Niinem
ets, O.S. O’Sullivan, O.L. Phillips, L. Poorter, P. Poot, I.C. Prentice, N. Salinas, L.M. Ro
wland, M.G. Ryan, S. Sitch, M. Slot, N.G. Smith, M.H. Turnbull, M.C. VanderWel, F. V
alladares, E.J. Veneklaas, L.K. Weerasinghe, C. Wirth, I.J. Wright, K.R. Wythers, J. Xian
g, S. Xiang, J. Zaragoza-Castells. Global variability in leaf respiration in relation to
climate, plant functional types and leaf traits. New Phytologist, 206 (2015), pp. 614-636

33
Azcón‐Bieto J, Lambers H, Day DA. 1983. Effect of photosynthesis and carbohydrate status on
respiratory rates and the involvement of the alternative pathway in leaf respiration. Plant
Physiology 72: 598–603.
Ball MC (2002) Interactive effects of salinity and irradiance on growth: implications for
mangrove forest structure along salinity gradients. Trees 16:126–139
Bolstad PV, Peter Reich, Tali Lee, Rapid temperature acclimation of leaf respiration rates in
Quercus alba and Quercus rubra, Tree Physiology, Volume 23, Issue 14, October 2003,
Pages 969–976, https://doi.org/10.1093/treephys/23.14.969
Bouillon S, AV Borges, E Castaneda-Moya, K Diele, T Dittmar, NC Duke, E Kristensen, SY
Lee, C Marchand, JJ Middelburg, VH Rivera-Monroy, TJ Smith III, RR Twilley. 2008.
Global Biogeochemical Cycles 22: GB2013, doi:10.1029/2007GB003052
Bruhn D, Egerton JJG, Loveys BR, Ball MC. 2007. Evergreen leaf respiration acclimates to
long‐term nocturnal warming under field conditions. Global Change Biology 13: 1216–
1223.
Chapman SK, Feller IC, Canas G, Hayes MA, Dix N, Hester M, Morris J, Langley JA.
Mangrove growth response to experimental warming is greatest near the range limit in
northeast Florida. Ecology. 2021 Mar 4:e03320. doi: 10.1002/ecy.3320. Epub ahead of
print. PMID: 33665838.
Cheesman AW, Winter K. 2013. Growth response and acclimation of CO2 exchange
characteristics to elevated temperatures in tropical tree seedlings. Journal of
Experimental Botany 64: 3817– 3828.
Chen, E., J. A. Blaze, R. S. Smith, S. Peng, and J. E. Byers. 2020. Freeze-tolerance of 430
poleward-spreading mangrove species weakened by soil properties of resident salt marsh
431 competitor. Journal of Ecology 108:1725-1737.
Ciais, P, Sabine, C, Bala, G. (2013) Carbon and other biogeochemical cycles. In: Stocker, TF,
Qin, D, Plattner, G-K (eds) Climate Change 2013: The Physical Science Basis.
Contribution of Working Group I to the Fifth Assessment Report of the
Intergovernmental Panel on Climate Change. Cambridge, New York: Cambridge
University Press, pp. 465–544.
Clough BF, Sim RG (1989) Changes in gas exchange characteristics and water use efficiency of
mangroves in response to salinity and vapour pressure deficit. Oecologia 79:38–44
Crous K.Y., G. Wallin, O. K. Atkin, J. Uddling, A. af Ekenstam, Acclimation of light and dark
respiration to experimental and seasonal warming are mediated by changes in leaf
nitrogen in Eucalyptus globulus, Tree Physiology, Volume 37, Issue 8, August 2017,
Pages 1069–1083, https://doi.org/10.1093/treephys/tpx052
Donato, D., Kauffman, J., Murdiyarso, D. et al. Mangroves among the most carbon-rich forests
in the tropics. Nature Geosci 4, 293–297 (2011). https://doi.org/10.1038/ngeo1123
Drake, J. E., Tjoelker, M. G., Aspinwall, M. J., Reich, P. B., Barton, C. V. M., Medlyn, B. E., &
Duursma, R. A. (2016). Does physiological acclimation to climate warming stabilize the
ratio of canopy respiration to photosynthesis? New Phytologist, 211, 850–863.
https://doi.org/10.1111/nph.13978
Drake, J. E., Tjoelker, M. G., Vårhammar, A., Medlyn, B., Reich, P. B., Leigh, A., Pfautsch, S.,
Blackman, C. J., López, R., Aspinwall, M. J., Crous, K. Y., Duursma, R. A.,
Kumarathunge, D., De Kauwe, M. G., Jiang, M., Nicotra, A. B., Tissue, D. T., Choat, B.,
Atkin, O. K., & Barton, C. V. M. (2018). Trees tolerate an extreme heatwave via

34
sustained transpirational cooling and increased leaf thermal tolerance. Global Change
Biology, 24(6), 2390–2402. https://doi.org/10.1111/gcb.14037
Duarte CM, IJ Losada, IE Hendriks, I Mazarrasa, N Marba. 2013. The role of coastal plant
communities for climate change mitigation and adaptation. Nature climate change 3:
961-969.
Fisher JB, Huntzinger DN, Schwalm CR, Sitch S. 2014. Modeling the terrestrial biosphere.
Annu. Rev. Environ. Resour. 39: 91–123
Friess DA, K Rogers, CE Lovelock, KW Krauss, SE Hamilton, SY Lee, R Lucas, J Primavera, A
Rajkaran, S Shi (2019). The state of the worlds mangrove forests: Past, Present, and
Future. Annual Review of Environment and Resources 44: 89-115.
Gao H, Bai J, He X, Zhao Q, Lu Q, et al. (2014) High Temperature and Salinity Enhance Soil
Nitrogen Mineralization in a Tidal Freshwater Marsh. PLOS ONE 9(4): e95011.
https://doi.org/10.1371/journal.pone.0095011
Heskel MA, O'Sullivan OS, Reich PB et al. (2016) Convergence in the temperature response of
leaf respiration across biomes and plant functional types. Proceedings of the National
Academy of Sciences of the United States of America, 113, 3832– 3837.
Hikosaka K, Shigeno A. 2009. The role of Rubisco and cell walls in the interspecific variation in
photosynthetic capacity. Oecologia160, 443–451.
Howard J, A. Sutton-Grier, D. Herr, J. Kleypas, E. Landis, E. Mcleod, et al. Clarifying the role
of coastal and marine systems in climate mitigation Front. Ecol. Environ., 15 (2017), pp.
42-50
IPCC, 2013: Climate Change 2013: The Physical Science Basis. Contribution of Working Group
I to the Fifth Assessment Report of the Intergovernmental Panel on Climate Change
[Stocker, T.F., D. Qin, G.-K. Plattner, M. Tignor, S.K. Allen, J. Boschung, A. Nauels, Y.
Xia, V. Bex and P.M. Midgley (eds.)]. Cambridge University Press, Cambridge, United
Kingdom and New York, NY, USA, 1535 pp, doi:10.1017/CBO9781107415324
King AW, Gunderson CA, Post WM, Weston DJ, Wullschleger SD (2006) Plant respiration in a
warmer world. Science, 312, 536–537.
Kirk G. The biogeochemistry of submerged soils. Wiley, Chichester (2004)
Kirwan, M. L. and Blum, L. K.: Enhanced decomposition offsets enhanced productivity and soil
carbon accumulation in coastal wetlands responding to climate change, Biogeosciences,
8, 987–993, https://doi.org/10.5194/bg-8-987-2011, 2011.
Kruse J, Rennenberg H, Adams MA. 2011. Steps towards a mechanistic understanding of
respiratory temperature responses. New Phytologist 189: 659–677.
Kruse J, T Turnbull, H Rennenberg, MA Adams (2020). Plasticity of Leaf Respiratory and
Photosynthetic Traits in Eucalyptus grandis and E. regnans Grown Under Variable Light
and Nitrogen Availability. Front. For. Glob. Change
https://doi.org/10.3389/ffgc.2020.00005
Langley J, J Megonigal. Ecosystem response to elevated CO2 levels limited by nitrogen-induced
plant species shift. Nature, 466 (2010), pp. 96-99
Lawrence, D., Fisher, R., Koven, C., et al. (2019). The community Land model version 5:
Description of new features, benchmarking, and impact of forcing uncertainty. Journal of
Advances in Modeling Earth Systems. https://doi.org/10.1029/2018MS001583.
Lee, T. D., P. B. Reich, and P. V. Bolstad. 2005. Acclimation of leaf respiration to temperature is
rapid and related to specific leaf area, soluble sugars and leaf nitrogen across three
temperate deciduous tree species. Functional Ecology 19:640–647.
Lovelock, C., Cahoon, D., Friess, D. et al. The vulnerability of Indo-Pacific mangrove forests to

35
sea-level rise. Nature 526, 559–563 (2015). https://doi.org/10.1038/nature15538
Lu W, J Xiao, F Liu, Y Zhang, C Liu, G Lin. (2017) Contrasting ecosystem CO2 fluxes of inland
and coastal wetlands: a meta-analysis of eddy covariance data. Global Change Biology
23(3) 1180-1198. https://doi.org/10.1111/gcb.13424
Lugo, A.E. & Snedaker, S.C. (1974) The ecology of mangroves. Annual Review of Ecology and
Systematics, 5, 39–64.
Macy A, MJ Osland, JA Cherry, J Cebrian (2021) Effects of chronic and acute stressors on
transplanted black mangrove (Avicennia germinans) seedlings along an eroding
Louisiana shoreline Restoration Ecology https://doi.org/10.1111/rec.13373 Mcleod, E., Chmura, G. L., Bouillon, S., Salm, R., Björk, M., Duarte, C. M., Lovelock, C.
E., Schlesinger, W. H., & Silliman, B. R. (2011). A blueprint for blue carbon: Toward an
improved understanding of the role of vegetated coastal habitats in sequestering
CO2. Frontiers in Ecology and the Environment, 9(10), 552-560.
https://doi.org/10.1890/110004
Mozdzer TJ, EB Watson, WH Orem, CM Swarzenski. Unraveling the Gordian knot: eight
testable hypotheses on the effects of nutrient enrichment on tidal wetland sustainability
Sci. Total Environ. (2020), 10.1016/j.scitotenv.2020.140420
O'Leary, B. M., Asao, S., Millar, A. H., & Atkin, O. K. (2019). Core principles which explain
variation in respiration across biological scales. New Phytologist, 222(2), 670– 686.
O’Sullivan, O. S. et al. Thermal limits of leaf metabolism across biomes. Glob. Chang. Biol. 23,
209–223 (2017).
Ow LF, Griffin KL, Whitehead D, Walcroft AS, Turnbull MH (2008a) Thermal acclimation of
leaf respiration but not photosynthesis in Populus deltoides × nigra. New Phytol
178:123–134
Ow LF, Whitehead D, Walcroft AS, Turnbull MH (2008b) Thermal acclimation of respiration
but not photosynthesis in Pinus radiata. Funct Plant Biol 35:448–461
Ow LF, Whitehead D, Walcroft AS, Turnbull MH (2010) Seasonal variation in foliar carbon
exchange in Pinus radiata and Populus deltoides: respiration acclimates fully to changes
in temperature but photosynthesis does not. Glob Change Biol 16:288–302.
Piao SL, S. Sitch, P. Ciais, P. Friedlingstein, P. Peylin, X.H. Wang, A. Ahlstrom, A. Anav,
J.G Canadell, N. Cong, C. Huntingford, M. Jung, S. Levis, P.E. Levy, J.S. Li, X. Lin,
M.R. Lomas, M. Lu, Y.Q. Luo, Y.C. Ma, R.B. Myneni, B. Poulter, Z.Z. Sun, T. Wang,
N. Viovy, S. Zaehle, N. Zeng. Evaluation of terrestrial carbon cycle models for their
response to climate variability and to CO2 trends. Glob Change Biol, 19 (2013), pp.
2117-2132
Reich PB, M.G. Tjoelker, K.S. Pregitzer, I.J. Wright, J. Oleksyn, J.L. Machado Scaling
of respiration to nitrogen in leaves, stems and roots of higher land plants. Ecol. Lett., 11
(2008), pp. 793-801
Reich, P. B., Sendall, K. M., Stefanski, A., Wei, X., Rich, R. L., & Montgomery, R.
A. (2016). Boreal and temperate trees show strong acclimation of respiration to
warming. Nature, 531, 633– 636. https://doi.org/10.1038/nature17142
Ryan MG, Robert M. Hubbard, Silvia Pongracic, R. J. Raison, Ross E. McMurtrie,
Foliage, fine-root, woody-tissue and stand respiration in Pinus radiata in relation to
nitrogen status, Tree Physiology, Volume 16, Issue 3, March 1996, Pages 333–343,
https://doi.org/10.1093/treephys/16.3.333
Simpson L.T., I.C. Feller, and S.K. Chapman. 2013. Effects of competition and nutrient

36
enrichment on avicennia germinans in the salt marsh-mangrove ecotone. Aquatic Botany 104: 55–59.
Slot, M. & Kitajima, K. General patterns of acclimation of leaf respiration to
warmer temperatures across biomes and plant types. Oecologia 177, 885–900 (2015)
Smith N.G., J.S. Dukes. Plant respiration and photosynthesis in global-scale models:
incorporating acclimation to temperature and CO2. Glob. Change Biol., 19 (2013), pp.
45-63
Smith, N., Malyshev, S., Shevliakova, E. et al. Foliar temperature acclimation reduces simulated
carbon sensitivity to climate. Nature Clim Change 6, 407–411 (2016).
https://doi.org/10.1038/nclimate2878
Smith NG, Dukes JS. 2017. Short‐term acclimation to warmer temperatures accelerates leaf
carbon exchange processes across plant types. Global Change Biology 23: 4840–4853.
Smith NG, Risa McNellis, Jeffrey S Dukes, No acclimation: instantaneous responses to
temperature maintain homeostatic photosynthetic rates under experimental warming
across a precipitation gradient in Ulmus americana, AoB PLANTS, Volume 12, Issue 4,
August 2020, plaa027, https://doi.org/10.1093/aobpla/plaa027
Tjoelker M.G., J. Oleksyn, P.B. Reich Acclimation of respiration to temperature and CO2 in
seedlings of boreal tree species in relation to plant size and relative growth rate
Global Change Biol., 5 (1999), pp. 679-691, 10.1046/j.1365-2486.1999.00257.xC
Tjoelker MG, Oleksyn J, Reich PB (2001) Modelling respiration of vegetation: evidence for a
general temperature-dependent Q10. Global Change Biology 7, 223–230.
doi:10.1046/j.1365-2486.2001.00397.x
Tjoelker MG, Oleksyn J, Reich PB, Zytkowiak R. 2008. Coupling of respiration, nitrogen, and
Sugars underlies convergent temperature acclimation in Pinus banksiana across
wide‐ranging sites and populations. Global Change Biology 14: 782– 797.
Tjoelker MG, Oleksyn J, Lorenc‐Plucinska G, Reich P. 2009. Acclimation of respiratory
temperature responses in northern and southern populations of Pinus banksiana. New
Phytologist 181: 218–229.
Vovides Alejandra G et al (2014) Morphological plasticity in mangrove trees: salinity-related
changes in the allometry of Avicennia germinans. Trees 28(5):1413–1425
Wang, H., Atkin, O. K., Keenan, T. F., Smith, N. G., Wright, I. J., Bloomfield, K. J., … Prentice,
I. C. (2020). Acclimation of leaf respiration consistent with optimal photosynthetic
capacity. Global Change Biology, 26(4), 2573–2583.
Wright, I. J., Reich, P. B., Westoby, M., Ackerly, D. D., Baruch, Z., Bongers, F., … Villar, R.
(2004). The worldwide leaf economics spectrum. Nature, 428, 821– 827.
Yamori, W., Hikosaka, K. & Way, D.A. Temperature response of photosynthesis in C3, C4, and
CAM plants: temperature acclimation and temperature adaptation. Photosynth
Res 119, 101–117 (2014). https://doi.org/10.1007/s11120-013-9874-6
Zhang, Y., G. Huang, W. Wang, W, L. Chen. and G. Lin. 2012. Interactions between mangroves
and 595 exotic Spartina in an anthropogenically disturbed estuary in southern China.
Ecology 93:588-596 597.
Zhu L, Bloomfield KJ, Asao S, Tjoelker MG, Egerton JJG, Hayes L, Weerasinghe LK, Creek
D, Griffin KL, Hurry V et al. 2021. Acclimation of leaf respiration temperature responses
across thermally contrasting biomes. New Phytologist 229: 1312– 1325.

37
Table 1. Results of a three-way analysis of variance testing the main and interactive effects of temperature treatment (T), measurement date (D), and site (S) on rates of leaf dark respiration at per unit area and per unit mass at 25 °C (Rarea25, Rmass25), the temperature sensitivity of R (Q10), and leaf dry mass per unit area (LMA) in Spartina alterniflora and Avicennia germinans. Degrees of freedom (df) and F-values are presented for each factor and reponse variable. F-values with ‘*’, ‘**’ and ‘***’ are significant at P<0.05, P<0.01, and P<0.001, respectively.
Species Dependent
Variables df Rarea
25 Rmass25 Q10 LMA
Avicennia
Treatment (T) 1 9.05** 6.79* 0.39 1.95 Date (D) 5 10.00*** 10.09*** 9.88*** 13.29***
Site (S) 1 0.50 9.38** 19.38*** 32.77***
T x D 5 0.35 0.34 0.63 0.83 T x S 1 1.92 5.27* 0.57 6.18*
D x S 5 5.96*** 7.57*** 1.39 3.87**
T x D x S 5 0.48 0.86 0.32 2.41*
Spartina
Treatment (T) 1 1.75 4.83* 2.76 0.04
Date (D) 5 3.17* 15.67*** 4.62*** 22.57***
Site (S) 1 0.69 12.03*** 0.62 2.88
T x D 5 0.58 0.51 0.73 0.54
T x S 1 0.42 2.68 2.43 0.42
D x S 5 2.33* 3.53** 0.82 4.29**
T x D x S 5 0.49 0.22 0.66 0.37
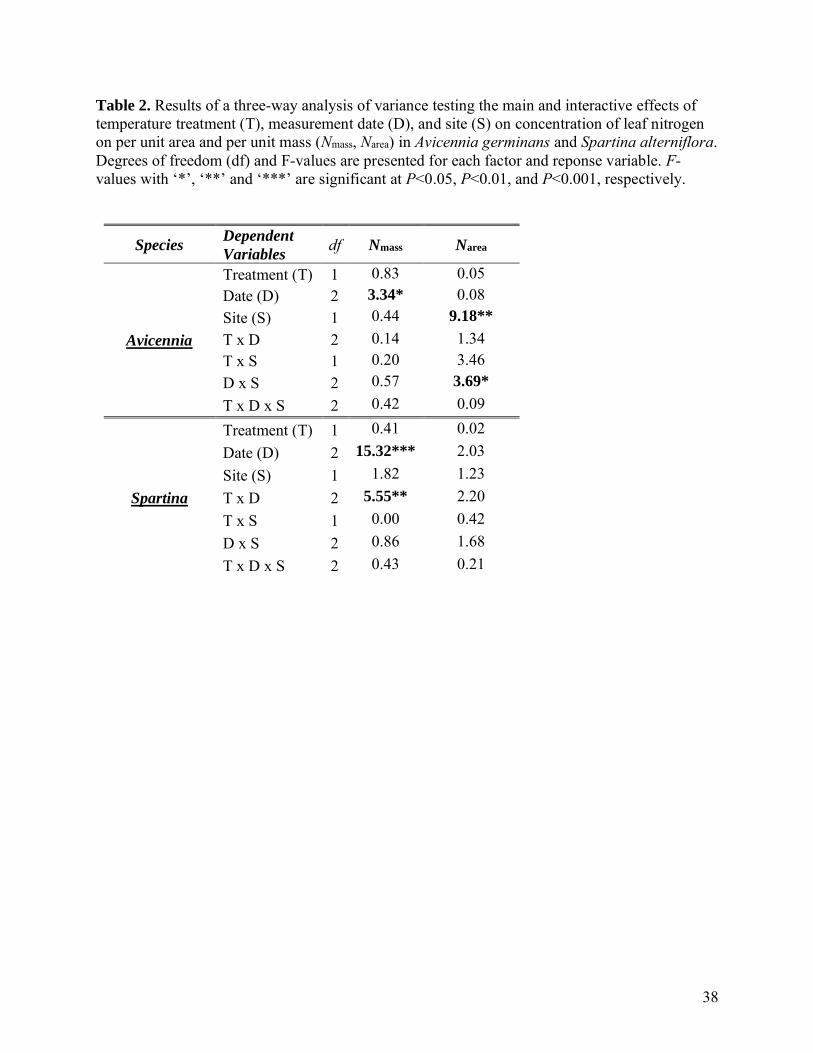
38
Table 2. Results of a three-way analysis of variance testing the main and interactive effects of temperature treatment (T), measurement date (D), and site (S) on concentration of leaf nitrogen on per unit area and per unit mass (Nmass, Narea) in Avicennia germinans and Spartina alterniflora. Degrees of freedom (df) and F-values are presented for each factor and reponse variable. F-values with ‘*’, ‘**’ and ‘***’ are significant at P<0.05, P<0.01, and P<0.001, respectively.
Species Dependent
Variables df Nmass Narea
Avicennia
Treatment (T) 1 0.83 0.05 Date (D) 2 3.34* 0.08 Site (S) 1 0.44 9.18**
T x D 2 0.14 1.34 T x S 1 0.20 3.46 D x S 2 0.57 3.69*
T x D x S 2 0.42 0.09
Spartina
Treatment (T) 1 0.41 0.02 Date (D) 2 15.32*** 2.03 Site (S) 1 1.82 1.23 T x D 2 5.55** 2.20 T x S 1 0.00 0.42 D x S 2 0.86 1.68 T x D x S 2 0.43 0.21

39
Table 3. The relationship between preceding 7 day daily mean temperature and leaf physiological traits for S. alterniflora and A. germinans at both sites, with and without experimental warming. Leaf respiration per unit area at 25°C (Rarea25); Leaf respiration per unit mass at 25°C (Rmass25); The temperature sensitivity (Q10) of (Rmass25); Leaf mass per unit area (LMA); leaf N per unit area (Narea); leaf N per unit mass (Nmass). Degrees of freedom (df) and F-values are presented for each factor and reponse variable. F-values with ‘*’, ‘**’ and ‘***’ are significant at P<0.05, P<0.01, and P<0.001, respectively.
Species Dependent
Variables df Rarea
25 Rmass25 Q10 LMA Nmass Narea
Avicennia
Air (A) 1 6.23* 26.38*** 20.81*** 44.62*** 5.80* 0.16 Treatment (T) 1 6.85** 4.94* 0.13 0.98 0.76 0.12 Site (S) 1 0.24 6.90** 23.80*** 23.26*** 0.42 9.04**
A x T 1 0.72 0.04 0.14 0.19 0.50 2.84 A x S 1 18.19*** 25.24*** 0.64 12.08*** 0.34 0.03 T x S 1 1.44 3.89 0.22 4.62* 0.23 2.84 A x T x S 1 0.23 0.76 0.35 2.10 0.16 0.00
Spartina
Air (A) 1 1.07 86.88*** 14.52*** 59.77*** 34.93*** 0.63 Treatment (T) 1 1.59 3.02 2.17 0.08 0.06 0.00 Site (S) 1 0.39 6.18* 1.51 0.51 2.11 1.05 A x T 1 1.06 3.23 2.38 0.05 12.74*** 3.65 A x S 1 0.36 2.98 1.69 3.17 0.42 3.31 T x S 1 0.11 1.71 1.75 0.43 0.00 0.59 A x T x S 1 1.24 0.31 1.06 0.50 0.37 0.95

40
Table 4. The relationship between preceding 7 day daily mean temperature and leaf physiological traits for A. germinans and S. alterniflora at both sites, with and without experimental warming. Leaf respiration per unit area at 25°C (Rarea25); Leaf respiration per unit mass at 25°C (Rmass25); The temperature sensitivity (Q10) of (Rmass25); Leaf mass per unit area (LMA); leaf N per unit area (Narea); leaf N per unit mass (Nmass). Slopes and intercepts are only shown for significant (p<0.05) relationships.
Species Variable Site Treatment Intercept Slope R2
Avicennia
Rarea25
North Overall 1.169 -0.003
0.21 South Overall 0.350 0.033
Both Ambient 0.845 0.010 Warmed 0.927 0.010
Rmass25
North Overall 3.769 0.029
0.34 South Overall -2.509 0.335
Both Ambient 1.230 0.146 Warmed 1.739 0.146
Q10 North Overall 2.508 -0.023
0.26 South Overall 2.758 -0.023
LMA North Overall 299.52 -2.131
0.40 South Overall 374.68 -6.473
Nmass Both Overall 9.493 0.288 0.12
Spartina
Rmass25
North Overall 21.34 -0.444 0.45
South Overall 20.12 -0.444
Q10 Both Overall 2.525 -0.028 0.16
LMA Both Overall 88.18 2.336 0.33
Nmass Both Ambient 32.36 -0.7500 0.47
Warmed 19.31 -0.1797

41
Table 5. Results of a two-way analysis of co-variance testing the main and interactive effects of leaf nitrogen concentration per unit area and per unit mass (Nmass, Narea) on Rarea25 and Rmass25 in Avicennia germinans and Spartina alterniflora. Degrees of freedom (df) and F-values are presented for each factor and reponse variable. F-values with ‘*’, ‘**’ and ‘***’ are significant at P<0.05, P<0.01, and P<0.001, respectively.
Dependent
Variables
Avicennia germinans
Spartina alterniflora
Rarea25
Narea (Na) 5.77* 154.20***
Treatment (T) 4.18* 2.59 Site (S) 0.17 0.00 Na x T 0.02 0.21 Na x S 7.54** 5.41*
T x S 1.37 2.06 Na x T x S 0.30 0.20
Rmass25
Nmass (Nm) 50.73*** 51.25*** Treatment (T) 3.47 3.10 Site (S) 4.51* 0.82 Nm x T 0.36 0.03 Nm x S 3.24 0.82 T x S 3.47 3.46 Nm x T x S 0.63 0.41

42
Table 6. Results of a two-way analysis of co-variance testing the main and interactive effects of leaf nitrogen concentration per unit area and per unit mass (Nmass, Narea) on Rarea25 and Rmass25 in Avicennia germinans and Spartina alterniflora. Slopes and intercepts are only shown for significant (p<0.05) relationships.
Species Variable Site Treatment Intercept Slope R2
Avicennia
Rarea25
North Overall 1.039 0.017
0.25 South Overall 0.446 0.179
Both Ambient 0.761 0.077 Warmed 0.848 0.077
Rmass25 North Overall 0.179 0.267
0.53
South Overall 0.631 0.267
Spartina Rarea
25 North Overall 0.392 0.499
0.74 South Overall -0.177 0.785
Rmass25 Both Overall 1.835 0.568 0.51

43
Figure1. South Site temperature, relative humidity, and vapor pressure deficit over the course of the study (Panels a, b, c). North Site temperature, relative humidity, and vapor pressure deficit over the course of the study (Panels d, e, f). Grey rectangles signify timepoints of sampling.

44
Figure 2. Means of leaf physiological traits across collection dates (2019-2020) for Avicennia germinans (a, c, e, g, i, k) and Spartina alterniflora (b, d, f, h, j, l) at two sites, with and without experimental warming. Leaf respiration per unit area at 25°C (panels a, b) Leaf respiration per unit mass at 25°C (panels c, d); The temperature sensitivity (Q10) of Rmass25 (panels e, f); Leaf mass per unit area (LMA) (panels g, h); leaf N per unit area (Narea) (panels I, j); leaf N per unit mass (Nmass) (panels k, l).

45
Figure 3. The relationship between preceding 7 day daily mean temperature and leaf physiological traits for Avicennia germinans (a, c, e, g, i, k) and Spartina alterniflora (b, d, f, h, j, l) at two sites, with and without experimental warming. Leaf respiration per unit area at 25°C (Rarea25) (panels a, b); Leaf respiration per unit mass at 25°C (Rmass25) (panels c, d); The temperature sensitivity (Q10) of Rmass25 (panels e, f); Leaf mass per unit area (LMA) (panels g, h); Leaf N per unit mass (Nmass) (panels i, j); Leaf N per unit area (Narea) (panels k, l). Gray solid lines signify a common relationship across sites and to warming. Black solid and dashed lines signify different relationships between sites. Red and blue lines are shown where differences in the effect of warming were consistent across sites.

46
Figure 4. The relationship between leaf N concentration and leaf respiration for Avicennia germinans (panels a, c) and Spartina alterniflora (panels b, d) at both sites, with and without warming. Leaf respiration per unit area at 25°C (Rarea25) relationship to leaf N per unit area (Narea) (panels a, b). Leaf respiration per unit mass at 25°C (Rmass25) relationship to leaf N per unit mass (Nmass) (panels c, d). Gray solid lines signify a common relationship across sites and to warming. Black solid and dashed lines signify different relationships between sites. Red and blue lines are shown where differences in the effect of warming were consistent across sites.

47
Chapter 2
Long-term and short-term impacts of nutrient enrichment on photosynthetic and
respiratory processes in black mangrove (Avicennia germinans) in North Florida
Abstract
At the global scale, photosynthesis (A) and autotrophic respiration (R) are the two largest
physiological processes responsible for CO2 flux. The carbon (C) and nutrient cycles are
interactively coupled, therefore by measuring the effect of nutrient enrichment on parameters of
A and R we may gain a better understanding of plant allocation and use of C. Here we tested
whether nitrogen (N) or phosphorus (P) inputs altered parameters of A and R in black mangrove
(Avicennia germinans) over time, whether the application of nutrients (N or P) resulted in short-
term differences in A and R, and whether leaf age (new vs. old) affected rates of A and R
differently between fertilization treatments. We accomplished this by repeatedly measuring
short-term temperature responses of leaf R and CO2 response of A on N treated, P treated, and
un-treated Avicennia over a 4-month period in situ. We found that N treated trees showed a
short-term increase in Asat and Vcmax in response to pulse enrichment. N treated trees also showed
a consistently high Rmass25 over time indicating a legacy effect. Across all fertilization treatments,
old leaves had 17% lower Rarea25, 34% lower Rmass25, and 20% higher LMA than new leaves, yet
leaf age had no consistent effect on parameters of A. These results provide mechanistic support
for existing hypotheses of mangrove nutrition and simplify future predictions of CO2 flux and
associated physiological feedbacks for mangrove ecosystems experiencing increased nutrient
input.

48
Introduction
Coastal wetland ecosystems play an important role in the global Nitrogen (N) and Carbon (C)
cycle. In particular, mangrove forests store up to 4× more C per unit area than tropical rainforests
(Donato et al. 2011, Alongi et al. 2014) and play a vital role in supporting the trophic relay that
drives N transformation, use, and storage in coastal wetlands (Nagelkerken et al. 2008).
However, continued anthropogenic pressures (e.g., agriculture, residential development, and
recreation) have increased nutrient, especially N and P, inputs into coastal wetland ecosystems
(Meybeck 2003, Holtgrieve et al. 2011, Ward et al. 2020). Atmospheric N deposition is also
expected to increase at lower latitudes (Stevens et al. 2019) where mangrove vegetation is
common and where mangrove deforestation rates are increasing (Friess et al. 2019). Increased
nutrient inputs may impact coastal wetlands by accelerating rates of resource uptake and use or
by changing the structure and composition of coastal plant communities (Simpson et al. 2013,
Dangremond et al. 2020, Mozdzer et al. 2020). Nutrient additions may also have direct effects on
photosynthesis (A) and respiration (R); key regulators of plant growth and function and the two
largest fluxes of CO2 between vegetation and the atmosphere at the global scale (Canadell et al.
2007, IPCC 2013). Thus, nutrient enrichment is expected to have important consequences for
mangrove vegetation and as well as interactions between coastal vegetation and the atmosphere
(Janssens & Luyssaert 2009, Fleischer et al. 2013, Fleischer et al. 2019).
Coastal wetlands are generally oligotrophic, and most mangrove soils are extremely
nutrient-poor (Kathiresan and Bingham 2001). As a result, several studies have examined how
nutrient enrichment affects mangrove productivity (e.g. Feller 1995, Lovelock et al. 2005, Feller
et al. 2007, Reef et al. 2010). These experiments have demonstrated that mangrove productivity
can be N-limited (Feller et al. 2003a, Lovelock and Feller 2003, Lovelock et al. 2007, Naidoo

49
2009, Simpson et al. 2013, Dangremond et al. 2020), P-limited (Lin and Sternberg 1992, Koch
1997, Medina et al. 2010), or both N- and P-limited (Feller 1995, Feller et al. 2003b, Lovelock et
al. 2004, Weaver and Armitage 2020) depending upon the species and local edaphic conditions.
What remains unclear, however, is how nutrient enrichment impacts mangrove A and R over
both short and long timescales. New studies that examine mangrove photosynthetic and
respiratory responses to nutrient enrichment could improve our basic understanding of nutrient
impacts on mangrove physiology and aid predictions of nutrient enrichment impacts on CO2
exchange between mangrove vegetation and the atmosphere.
In situ A under natural conditions is determined by both physical (i.e. stomatal)
limitations of CO2 diffusion and biochemical limitations to CO2 fixation and RuBP regeneration.
The maximum carboxylation rate of ribulose-1,5-bisphosphate carboxylase/oxygenase (Rubisco,
Vcmax), and the maximum rate of electron transport (Jmax) required to regenerate ribulose-1,5-
bisphosphate, are two key biochemical determinants of A (Farquhar et al. 1980). Many terrestrial
biosphere models (TBMs) rely on accurate estimates of Vcmax and Jmax to simulate C fluxes
(Zaehle et al. 2005, Bonan et al. 2011, Clark et al. 2011, Lawrence et al. 2019). A recent meta-
analysis across hundreds of terrestrial species showed that N addition (fertilization) generally
increases A (12.6%), leaf N per unit mass and area (18.4% and 14.3%, respectively), and
stomatal conductance to water vapor (gs, 7.5%), with little change in water-use efficiency (Liang
et al. 2020). Other broad meta-analyses have also found significant increases in leaf N following
N addition (Ostertag and DiManno 2016). However, among individual studies, photosynthetic
responses to N enrichment range from negative (Mao et al. 2018) to moderately or strongly
positive (Teskey et al. 1994, Manter et al. 2005, Zhang et al. 2020). The effects of nutrient
addition on A can also be transient (Gough et al. 2004). Moreover, the effects on N addition on

50
Vcmax are inconsistent across species and studies (Liang et al. 2020), even though leaf N generally
increases with N addition and often scales positively with Vcmax (and net photosynthesis) given
that Rubisco represents a substantial fraction of leaf N (Evans 1989, Reich et al. 1999, Wilson et
al. 2000, Wright et al. 2004, Manter et al. 2005, Kattge et al. 2009, Walker et al. 2014). Studies
have also found that P addition increases A in some species and systems (Warren and Adams
2002, Li et al. 2016), and low P can limit the response of photosynthesis to increasing leaf N
(Reich et al. 2009). P availability influences photosynthesis by affecting membrane solubility,
NADPH, and ATP production which can in turn effect reduction of phosphoglyceric acid and
regeneration of RuBP (Marschner 1995; Taiz and Zeiger 2010). There is some evidence that P
scales positively with Vcmax (Domingues et al. 2010) and less so with Jmax (Walker et al. 2014).
Only a handful of studies have examined the impacts of nutrient enrichment on mangrove
photosynthetic processes. On the east coast of Florida, Lovelock and Feller (2003) found that N
additions increased A in Avicennia germinans but not in Laguncularia racemosa. In Panama,
Lovelock et al. (2004) found no effect of N or P additions on A in Rhizophora mangle. Lovelock
et al. (2006a) found that P fertilization increased A in fringe but not dwarf Rhizophora mangle.
Lovelock et al. (2006b) found that P fertilization increased A in Avicennia germinans in Belize,
but not in Avicennia germinans in Florida. Fertilization can also impact intrinsic water use
efficiency (WUE) of mangrove foliage, quantified as the ratio of A to stomatal conductance to
water vapor (gs). Under moderate to high salinity conditions typical of coastal wetlands, N
addition can increase WUE by increasing leaf N and C fixation when gs is low (Reef et al. 2010;
Martin et al. 2010). Overall, the effects of nutrient enrichment on mangrove A vary among
studies, and photosynthetic responses to N or P additions are often smaller in magnitude or not
clearly linked with biomass responses (e.g. Lovelock et al. 2004). This fits with general patterns

51
across species where nutrient enrichment increases biomass and leaf area much more than A
(Liang et al. 2020). However, no studies have examined how nutrient enrichment impacts Vcmax
or Jmax in mangroves, or whether N and P have different effects on photosynthetic parameters.
There is evidence that N additions increase leaf N concentrations in mangroves (Lovelock and
Feller 2003, Lovelock et al. 2004, Dangremond et al. 2020) which could result in increased Vcmax
and possibly Jmax, although the change in Jmax may depend on leaf thickness or leaf P (Walker et
al. 2014). In general, very few studies have estimated Vcmax or Jmax on any mangrove species,
regardless of the growth conditions (Aspinwall et al. 2021). New studies that estimate Vcmax and
Jmax over time or under varying conditions could improve C flux estimates in coastal wetlands,
and their representation in TBMs.
About half of plant R comes from leaves (Atkin et al. 2007). Leaf R (measured in
darkness as CO2 efflux) is co-limited by the supply of carbohydrates from photosynthesis,
respiratory enzyme concentrations, and adenylate demand (Ryan et al. 1996, Atkin and Tjoelker
2003). Leaf R is also linked with photosynthesis given that R is used to support processes that
maintain photosynthesis (e.g. protein turnover, Wang et al. 2020). In TBMs, leaf R is estimated
as proportion of Vcmax or is predicted based on empirical relationships between leaf N and R at a
set measurement temperature (Atkin et al. 2015). Although there are exceptions, previous studies
have generally found that N addition results in higher leaf N and leaf R (Brix 1971, Manter et al.
2005, van de Weg et al. 2013). P is also an important component of respiratory enzymes and is
needed for phosphorylation of ADP during respiration, which could explain why leaf R scales
positively with leaf P across species and environments (Meir et al. 2001, Weerasinghe et al.
2014, Atkin et al. 2015). However, in some fertilization experiments, leaf R does not increase
with P addition, unless applied in combination with N (Heskel et al. 2014). In experiments with

52
mangroves, P addition may or may not result in increased leaf P concentrations (Lovelock et al.
2004, Dangremond et al. 2020), and it unclear whether P addition effects leaf R. More broadly,
respiratory responses to nutrient enrichment or any aspect of environmental change have not
been widely studied in mangroves (Burchett et al. 1989, Lopez-Hoffman et al. 2007, Akaji et al.
2019, Aspinwall et al. 2021). Likewise, it is unclear whether nutrient enrichment alters the
temperature sensitivity of leaf R in any species.
The purpose of this study was to determine the long-term and short-term impacts of
nutrient enrichment (N or P addition) on photosynthetic and respiratory processes in black
mangrove (Avicennia germinans) growing in a long-term fertilization study in a coastal wetland
in north Florida. The study was established in 2012 and included three treatments: control, added
N, or added P. Previous results indicated that leaf N and productivity increased with added N,
but leaf P and productivity did not change with added P (Dangremond et al. 2020). In summer
2020, on three dates prior to the annual addition of N or P, we measured in situ A, gs, WUE, and
the CO2 response of A to determine Vcmax and Jmax. We also measured the short-term temperature
response of leaf R on each date to determine respiratory capacity and the temperature sensitivity
of R. These data were used to determine the long-term impacts of nutrient enrichment on leaf
physiology. Then, roughly 20 days after the annual addition (pulse) of N or P, we again
measured A, gs, and WUE, and determined Vcmax, Jmax, leaf R and the temperature sensitivity of
leaf R. Measurements made after the pulse of N or P were made on two sets of leaves: those
formed prior to the N or P pulse and those formed after the N or P pulse. These data were used to
determine the response of photosynthetic and respiratory processes to the N or P pulse, and test
whether responses differed between leaves formed before and after the N or P pulse. Given that
Avicennia productivity at the site was primarily N-limited and N addition increased leaf N

53
(Dangremond et al. 2020), we expected modest increases in A, WUE, Vcmax, and R with long-
term N addition, and larger increases in A, WUE, Vcmax and R following the N pulse. We also
expected that the effect of the N pulse on leaf physiology would be most apparent in leaves
formed after the N pulse. Given that Avicennia showed no growth response to P addition at the
site, we expected no long-term or short-term response of photosynthetic or respiratory processes
to P addition.
Materials and methods
Site Description
This study took place in the Guana Tolomato Matanzas National Estuarine Research Reserve
(GTMNERR) on the Atlantic coast of northeast Florida, near St. Augustine. The estuarine
vegetation in GTMNERR represents a marsh-mangrove ecotone. The southern limit of saltmarsh
habitat converges and overlaps with the northern limit of mangrove habitat in Florida, although
mangroves are increasingly common north of GTMNERR (Doughty et al. 2016). Our study site
(N29°43′, W81°14′) was located roughly 20 km south of St. Augustine and just north of the
Matanzas Inlet. Average annual precipitation at the GTMNERR reserve is 1317 mm (Chapman
et al. 2021). Mean annual temperature (2001–2018) at St. Augustine is 20.8 °C. The highest
monthly mean daily max temperature (July) is 31.97 °C, and the lowest monthly mean daily low
temperature (January) is 11.13 °C (NOAA). The vegetation is dominated by low-stature,
shrubby A. germinans trees, less than 2 m tall, with an understory of halophytic succulents, Batis
maritima and Sarcocornia perennis. Avicennia germinans is a broadly distributed mangrove
species native to warm-temperate, subtropical, and tropical regions of the Americas and Africa.

54
Experimental Design
As described by Dangremond et al. (2020), 24 A. germinans trees ranging from 62 to 87 cm
(mean = 70.7 ± 1.53 cm) in height were selected to be used for an in-situ fertilization experiment
at the site described above. Trees were assigned to one of three treatments (8 replicates per
treatment): control (no fertilization), added nitrogen (N), or added phosphorus (P). Due to
methods limitations and time constraints we randomly selected 6 trees per treatment for our
study. Treatments were randomly assigned to trees, ensuring that trees were located at least 5m
away from each other. Trees were fertilized annually with 300 g of fertilizer [N as NH4 (45:0:0;
N:P:K) or P as P2O5 (0:45:0; N:P:K)], with the most recent fertilization event applied during
October 2019. A second fertilization event occurred during the middle of this experiment
(August 17th 2020). Physiology measurements taken before August 17th 2020 were used to infer
long-term effects of N or P addition. Measurements taken after this date were used to infer
responses to the pulse of added N or P. Surface broadcasting was not used when applying N or P,
as there was no way to assure that fertilizer treatments could be contained to target trees. Instead,
nutrient enrichment was administered through two (3 cm wide x 30 cm deep) soil cores (150 g
per core) inserted on opposing sides of the target tree. 150 g of N or P fertilizer was placed in the
core hole before sealing the hole. For control trees, holes were cored and sealed, but no fertilizer
was added. These methods have been used in similar fertilization experiments in Florida (Feller
et al. 2003) and in Belize (Feller et al. 2007).
Environmental Data
Air temperature (Tair) and relative humidity (RH) were measured every 15 minutes at the site
using an air temperature/RH sensor covered in a solar radiation shield (HOBO MX2302 External
Temperature/RH Sensor, Onset Computer Corp., Bourne, MA). Mean daily air temperature

55
(mean daily Tair) of the 7 days preceding physiology measurements ranged from 26.4 ºC to 28.8
ºC, and the maximum daily Tair ranged from 31.3 to 33.7 ºC over the experimental period
(June-September 2020) (Figure S5). At the same study site in 2019, Dangremond et al. (2020)
reported that pore-water salinity was generally highest during summer (60 ppt) and lower
during winter (48 ppt).
CO2 response of photosynthesis
In situ rates of leaf gas-exchange were measured five times between June 2020 and September
2020 to determine the effects of long term and pulse additions of N and P on leaf physiology of
A. germinans. The number of measurements varied per measurement date depending on weather;
afternoon thunderstorm are common in north Florida during summer. On each date, two portable
cross-calibrated photosynthsis systems (LI-6800, LiCor., Inc, Lincoln NE, USA) were used to
measure CO2 response of leaf-level net photosynthesis (A-Ci). A roughly equal number of C, N,
and P plots were measured by each photosynthesis system on each date.
Both LI-6800s were fitted with a 3 × 3 cm cuvette head and a red-blue LED light source.
For all measurements, flow rate was held constant at 500 μmol s-1. To help moderate temperature
fluctations in the LI-6800 system, the temperature exchanger of each LI-6800 was set to the
prevailing midday temperature. Leaf temperature (Tleaf) was measured with the built-in leaf
temperature thermocouple and averaged 32 ± 1.5 (standard deviation) °C across all measurement
dates. Relative humidity conditions in the chamber were controlled near ambient external
conditions but also varied depending upon water vapor fluxes from the leaf. There was no shade
at our site, so light conditions within the cuvette were set at a photosynthetic photon flux density
of 1800 μmol m-2 s-1, which approximates full-sun conditions. Each CO2 response measurement
began with steady-state measurements of light-saturated net photosynthesis (Asat, μmol m-2 s-1),

56
stomatal conductance to water vapor (gs, mol m-2 s-1), and intrinsic water use efficiency (WUE,
umol mol-1) at a chamber reference [CO2] of 420 μmol mol-1. Leaves typically reached steady-
state within 5–10 min of being enclosed in the cuvette.
All A-Ci measurements occurred between 9:00 and 15:00 local time and were made on
recently mature, fully expanded, upper canopy leaves of A. germinans. The one-sided surface
area (cm2) of leaves within the chamber was determined by measuring the length and width with
a ruler. Leaf gas-exchange data were then back-corrected using the corrected leaf area estimate.
A-Ci curves were constructed by measuring Asat and intercellular CO2 (Ci) at a series of reference
[CO2]: 300, 250, 100, 50, 0, 420, 650, 800, 1200, and 1500 μmol mol-1. On the final collection
dates (27, 28 September) we recorded A-Ci measurements (using the same methods as listed
above) on leaves formed prior to the pulse of N or P, as well as leaves formed after the pulse of
N or P.
Each A-Ci curve was parameterized using the Farquhar model of C3 photosynthesis
(Farquhar et al. 1980) using non-linear least squared parameter estimation R version 3.2.1 (R-
Development-Core-Team, 2009) and the model was fit using the Plantecophys package
(Duursma 2015) following the methods of Smith and Dukes (2017). The model estimates the
maximum rate of Rubisco carboxylation (Vcmax; μmol m-2 s-1) and the rate of electron transport
for RuBP regeneration (Jmax; μmol m-2 s-1). Vcmax and Jmax provide estimates of the biochemical
capacity of photosynthesis. Using estimates of Vcmax from each A-Ci curve, we also estimated
stomatal limitations (L) to photosynthesis. L was calculated following Farquhar and Sharkey
(1982) by comparing observed Asat with the predicted rate of Asat if stomatal limitation was zero
(i.e., Ci = Ca). The predicted ate of Asat when L = 0 was back-calculated from predicted Vcmax
using the model of Farquhar et al. (1980).

57
Temperature response of leaf respiration
Measurements of the short-term temperature response of leaf dark respiration (R, measured as
CO2 efflux per unit leaf area) were conducted at five timepoints (June 21st, July 19th, August 16th,
September 5th, September 27th). We measured the same leaves used for measurements of the CO2
response of photosynthesis. Leaves were collected pre-dawn (04:30 – 06:00 local time) to avoid
activation of photosynthesis. The excised leaves were placed in Ziplock bags with moist paper
and transferred to the lab in complete darkness. Previous studies have found no effect of leaf
removal on leaf R measurements (O’Sullivan et al. 2013; Aspinwall et al. 2017; 2019).
Moreover, all measurements were completed the same day as leaf collection, and we found no
evidence that leaf R changed with time since leaf removal. Leaf area (cm2) of the measured
leaves was determined with a leaf area meter (LI-3000C, LI-COR BioSciences, Lincoln, NE,
USA) just prior to measurements of leaf R. Leaf area data were used to calculate R per unit area
(Rarea μmol m–2 s–1).
Short-term temperature response curves of leaf R were completed by sealing excised
leaves randomly in one of three infrared gas analyzers (one LI-6400XT, two LI-6800s, LI-COR,
Inc., Lincoln, NE, USA) fitted with large chambers (LI-6400-22L or LI-6800-24, LI-COR, Inc.).
The large chambers increased CO2 differentials (sample CO2−reference CO2) without leak
artifacts without leak artifacts (Drake et al. 2015, Jahnke and Krewitt 2002), which improves
measurement accuracy. For each gas analyzer, flow rate and reference CO2 of the air were set at
500 mol s–1 and 410 mol μmol-1 respectively. Temperature response curves began by placing gas
analyzers inside temperature-controlled growth cabinet (E41L1, Percival Scientific Inc., Perry,
IA, USA) set at 15 °C. The block temperature of the gas analyzers was also set at 15 °C. Once

58
rates of R reached steady state (~10 min) 5 spot measurements of leaf R were logged. Once Rarea
of each leaf was measured at 15 °C, we repeated measurements of R in stepwise fashion at a
series of higher temperatures; 20, 27, 35 and 40C. After temperature response measurements
were completed, leaves were dried at 70 °C for ~72 hours after which leaf dry mass
measurements were recorded to determine leaf dry mass per unit area (LMA, g m-2). Leaf R per
unit mass (Rmass, nmol g-1 s-1) was calculated by dividing Rarea (×1000) by LMA.
Modelling the temperature response of respiration
Nonlinear regression was used to model the temperature response of leaf R. Nonlinear models
were fit using R version 3.43 (R Core Team 2017). To determine the appropriate model for our
data, we compared the suitability of three different algorithms following the approach of
Aspinwall et al. (2017): (1) a log polynomial function, which describes the non-linear
relationship between natural log transformed R and Tleaf (O’Sullivan et al. 2013; Heskel et al.
2016), (2) an exponential function with a single Q10 value which assumes that the temperature
sensitivity of R is constant across the entire measurement temperature range (e.g. Tjoelker et al.
2001), and (3) a modified Arrhenius function, which accounts for a non-exponential increase in
R with increasing Tleaf (Lloyd and Taylor 1994). The polynomial function is written as:
(1) ln R = a + bT + cT2 or
(2) 𝑅 = 𝑒𝑎+𝑏𝑇+ 𝑐𝑇2
where T is Tleaf and a is an estimate of ln R at 0 °C, b is the slope of temperature response of ln R
at 0 °C, and c describes any nonlinearity in the temperature response of ln R with increasing Tleaf.
The differential of Eqn 2 can be used to estimate the Q10 of R at any Tleaf: 𝑄10 = 𝑒10 ×(𝑏+2𝑐𝑇).

59
Among these algorithms, the polynomial (Equation 1) provided the best fit to our data, with a
strong linear relationship (R2 = 0.998) between observed and predicted values of ln R, and
residuals values normally distributed around zero with little pattern associated with increasing
Tleaf. Thus, we used the polynomial equation to model the temperature response of R and used
coefficients a, b and c to estimate Rarea and Rmass at 25 °C (Rarea25, Rmass25), and the Q10 of R
(between 20 and 30 °C) for each leaf. Repeated estimates of Rarea25, Rmass25, and Q10 over time
provide a direct way of determining the direction and magnitude of respiratory capacity
(Aspinwall et al. 2019).
Data Analysis
All analyses were performed using R version 3.43 (R Core Team 2017). A two-way analysis of
variance (ANOVA) was used to test the effects of measurement date, fertilization treatment
(control, added N, added P), and their respective interaction (Date x Treatment) on
photosynthetic and respiratory parameters (e.g. Asat, gs, Vcmax, Jmax, Rarea25, Rmass25, LMA, Q10). A
second two-way ANOVA was used to test whether the general timing of fertilizer application
(pre vs. post fertilization), fertilization treatment, or their interactions (Application x Treatment)
influenced photosynthetic and respiratory parameters. A third two-way ANOVA only included
data collected on the final date, and was used to test whether leaf age (formed prior to N or P
pulse, formed after N or P pulse), fertilization treatment, or their interaction (Leaf Age ×
Treatment) had any effect on photosynthetic or respiratory parameters. Homogeneity of variance
for model results were tested using Levene's and Shapiro-Wilk tests. Data were log or square
root transformed as necessary.

60
Results
Impacts of N and P addition on photosynthetic parameters
Compared to the timepoint just prior to the fertilizer addition, trees in the added N treatment
showed a modest increase in Asat following the pulse of N (+28%), while trees in the added P and
control treatments showed less variation over time (Figure 1). Nonetheless, the effects of date,
treatment, and their interaction on Asat were not statistically significant (Table 1). Across time
points and treatments Asat averaged 7.9 ± 0.65 μmol m-2 s-1. gs did not differ between fertilizer
treatments, but varied among measurement dates (Table 1). gs was highest on September 27th
(0.12 ± 0.01 mol m-2 s-1), and lowest on July 19th (0.07 ± 0.01 mol m-2 s-1) (Figure 1). WUE did
not differ among individual measurement dates, or among fertilizer treatments (Table 1) and
averaged 0.09 ± 0.01 μmol mol-1.
Vcmax and Jmax differed among measurement dates (Table 1). Vcmax was lowest on August
16th (63.5 ± 6.4 μmol m-2 s-1) and highest on September 27th (88.6 ± 5.6 μmol m-2 s-1) (Figure1a).
Similarly, Jmax was lowest on August 16th (100 ± 9.2 μmol m-2 s-1) and highest on September 27th
(136 ± 8.0 μmol m-2 s-1) (Figure 1c). Compared to the timepoint just prior to the fertilizer
addition, trees in the added N treatment showed a marked increase in Vcmax and Jmax following
the pulse of N, while trees in the added P and control treatments showed smaller changes (Figure
1a). Nonetheless, no significant date × treatment interactions were observed for Vcmax or Jmax
suggesting that increase in photosynthetic capacity after fertilization was not statistically
significant. Stomatal limitation of net photosynthesis (L) was similar across measurement dates
and fertilizer treatments and showed not date × treatment interaction (Table 1). On average, L
was 0.31 ± 0.03 (Figure 1).

61
Finally, we tested whether the average values for photosynthetic parameters measured
after the N or P pulse (i.e. post-fertilization) differed from average values of photosynthetic
parameters aggregated across timepoints before the N or P pulses. We also tested whether leaves
formed prior to N or P pulses differed in photosynthetic parameters compared to leaves formed
after N or P pulses. Compared to measurements taken before the N pulse, trees in the added N
treatment showed relatively large increases in Asat, gs, Vcmax, and to some extent Jmax, following
the N pulse (Figure 1). Trees in the added P treatment showed smaller increases in these
parameters following the P pulse (relative to measurements taken before the P pulse), while
control trees showed little change in photosynthetic parameters before and after the nutrient
pulses. The apparent short-term responses of photosynthetic parameters to N (and to some extent
P) pulses were only seen in newly formed leaves (Figure 1). Despite these trends, treatment and
timing × treatment interactions were not significant for any photosynthetic parameter, suggesting
that photosynthetic parameters showed no significant long-term or short-term response to N or P
enrichment. Moreover, leaf age (prior formed leaves, leaves formed after nutrient pulses) had no
significant effect on photosynthetic traits and did not interact with treatment (Table 3).
Significant differences in Asat, gs, Vcmax and Jmax were only observed between the pre- and post-
fertilization time periods (Table 2). Post-fertilization (September 27th) Asat (9.40 ± 0.64 μmol m-2
s-1) was 26% higher than Asat averaged across pre-fertilization dates (June – August; 7.43 ± 0.37
μmol m-2 s-1). Post-fertilization gs (0.115 ± 0.010 mol m-2 s-1) was also 39% higher than pre-
fertilization gs (0.083 ± 0.006 mol m-2 s-1). Post-fertilization Vcmax (88.6 ± 5.6 μmol m-2 s-1) was
23% higher than pre-fertilization Vcmax (72.3 ± 3.3 μmol m-2 s-1) (Figure 1b).

62
Impacts of N and P addition on respiratory parameters
Respiratory parameters were generally consistent across treatments but varied over time (Table
4). Rarea25 was 20% higher on September 27th (1.54 ± 0.06 μmol m-2 s-1) than September 5th (1.28
± 0.06 μmol m-2 s-1) (Table 4, Figure 2a). Rmass25 was higher on August 16th (8.73 ± 0.65 nmol g-2
s-1) and September 27th (8.65 ± 0.55 nmol g-2 s-1) than September 5th (6.61 ± 0.61 nmol g-2 s-1).
LMA was higher on June 21st (222 ± 8.8 g m-2) than August 16th (178 ± 10.4 g m-2) or September
27th (186 ± 8.8 g m-2) (Table 4, Figure 2e). Although only marginally significant (p=0.06) trees
in the N treatment had higher Rmass25 (8.56 ± 0.47 nmol g-2 s-1) than trees in the P treatment (7.47
± 0.46 nmol g-2 s-1) and control trees (7.24 ± 0.44 nmol g-2 s-1) averaged over time (Table 4,
Figure 2c). There was no effect of treatment or measurement date on the of Q10 of R (Table 4,
Figure 2g). On average, the Q10 of R was 2.39 ± 0.06.
Leaf respiratory parameters were consistently different between leaf age classes (prior
formed leaves, newly formed leaves). Compared to newly formed leaves, leaves formed prior to
the fertilization event had 17% lower Rarea25 (prior leaves: 1.28 ± 0.05 μmol m-2 s-1, new leaves:
1.54 ± 0.05 μmol m-2 s-1), 34% lower Rmass25 (prior leaves: 5.75 ± 0.52 nmol g-2 s-1, new leaves:
8.65 ± 0.50 nmol g-2 s-1), and 20% higher LMA (prior leaves: 223 ± 6.6 g m-2, new leaves: 186 ±
6.4 nmol g m-2) (Table 5, Figure 2b,d,f). Unlike photosynthetic traits, there were no significant
differences between respiratory parameters measured before and after application of fertilization
treatments (N or P) (Table 6, Figure 2b,d,f,h).
Although N treated trees showed increased response of Asat, Vcmax, and Rd there were no
detectable relationships between parameters of A and R.

63
Discussion
Mangrove ecosystems have the ability to sequester and store large amounts of C, but little is
known about how increased nutrient inputs may affect photosynthetic and respiratory processes
that regulate patterns of C allocation, storage, and use in coastal wetland plants (Evans 1989,
Feller 2007, Donato et al. 2011, Fernandez-Martinez et al. 2014). To address this knowledge gap,
we examined whether black mangrove (Avicennia germinans) in a north Florida coastal wetland
adjust their photosynthetic and respiratory capacities in response to N or P additions, and
whether long-term physiological responses to nutrient enrichment differ from short-term
physiological responses. We expected that N treated Avicennia would increase in situ Asat,
photosynthetic capacity (Vcmax, Jmax) and respiratory capacity (Rarea25, Rmass25) in response to the
N pulse (i.e. short-term response), with smaller long-term effects of N addition on photosynthetic
and respiratory parameters. Trees at our site previously showed no evidence of P-limitation on
aboveground productivity (Dangremond et al. 2020). Therefore, we hypothesized that P addition
would have little short-term or long-term effect on photosynthetic or respiratory capacity. In
addition, we tested whether responses to nutrient enrichment differed between leaves formed
before and after the N or P pulse. We found that pulse N addition led to a short-term increase of
photosynthetic parameters and consistently increased Rmass25 over time. These results indicate
that photosynthetic responses to N addition may be short-lived, while respiratory responses to N
addition may persist for longer time periods. In support of our hypothesis, we also found that P
treatment had little short- or long-term effect on photosynthetic or respiratory parameters. Lastly,
we found some evidence that increases in Asat and photosynthetic capacity were limited to leaves
formed after the N pulse, although leaf age effects on photosynthetic traits were largely non-
significant. Even so, newer leaves had significantly lower LMA and higher respiratory capacity.

64
These results improve our understanding of nutrient enrichment effects on photosynthetic and
respiratory physiology in Avicennia germinans growing near its northern range limit.
In a synthesis of studies, Liang et al. (2020) found that N addition increased leaf A per
unit area, gs, WUE, and Vcmax. In the present study, N treated trees showed a short-term increase
of Asat and Vcmax in response to pulse enrichment which partially supports our hypothesis that in
an N limited system, N enrichment would result in increased photosynthetic capacity. This
positive relationship between N enrichment and increased photosynthetic capacity might be
explained by the proportion of N allocated to Rubisco and other bioenergetic proteins (Evans and
Clarke 2019). Rubisco accounts for the largest fraction of leaf protein, therefore N addition
alleviates limitations imposed on Rubisco carboxylation (Vcmax) in an N limited system (Evans
1989, Hikosaka and Shigeno 2009, Aspinwall et al. 2019). Previous work by Dangremond et al.
(2020) found that leaf %N increased in response to N addition, supporting the hypothesis that
leaf %N, photosynthetic capacity, nutrient limitations are tightly coupled in Avicennia.
Many plant types have been shown to reduce their response to consistent nutrient
enrichment, resulting in weaker relationships between fertilization and physiological response
over time (Liang et al. 2020). Considering that in this study trees received nutrient enrichment
annually over 9 years, it is plausible that the overall effect of nutrient enrichment declined as the
trees became acclimated to this level of enrichment. It is also plausible that the ratio of fertilizer
to total plant biomass has been reduced heavily over time, warranting a proportionally smaller
physiological response by year 9 (Linder and Rook 1984). However, as described in Liang et al.
(2020), the percent change in structural traits (~ 33%) and physiological traits (~ 5.4%) in
response to N addition are not equivalent. A simple explanation for this type of response is that
the plant is allocating N to something other than leaf level photosynthesis. There is evidence to

65
support a decoupling of leaf A and R from N driven increases in biomass (Teskey 1994). Some
clues for simplifying the imperfect relationships between N addition, photosynthesis and
respiration could be attributed to the storage of nonstructural carbohydrates (NSC) (Collalti et al
2020).
Leaf N has been shown to positively scale with capacity of leaf A and R (Reich et al
2008, Crous et al. 2018). Our results support the hypothesis that R capacity (Rmass25), CO2
assimilation (Asat) and carboxylation of Rubisco (Vcmax) would positively scale with each other in
response to N enrichment. However, it is important to make a distinction between the response
patterns of A and R. Our results showed short-term response of A to pulse additions of N but did
not show evidence of a sustained legacy effect over time. Mitochondrial enzymes that regulate R
require much less N than that of those that regulate A (Ghimire et al. 2017). Therefore, N
addition may result in higher R over longer periods of time than A. This is an important result for
future mangrove physiology studies because it presents a new gap in our understanding of how
nutrient enrichment might illicit short-term response of A, legacy effects of R, and a possible
decoupling of A and R over time. This result may also be useful in earth system modelling in
coastal wetland ecosystems as eutrophication, N deposition, and mangrove expansion progress.
Site conditions play an important role in mediating mangrove responses to nutrients (Reef
et al. 2010). As a result of proximity (~2 miles) to the Matanzas inlet, our study site had a high
rate of exchange and a low residence time for nutrients, a known driver of N limitation in
mangrove ecosystems (Smith 1984; Reef et al 2010). There was also evidence that the site would
be N limited from the growth response to N addition reported by Dangremond et al. (2020).
Many mangrove nutrition experiments have demonstrated large increases in biomass and
physiology related responses as a result of P addition (Feller 1995; Feller et al. 2003, Lovelock et

66
al. 2006, Lovelock et al. 2007). However, just as Dangremond et al. (2020) found limited
biomass response to P addition, we found no effect of P addition on leaf level physiology. Our
results for P treated and control trees were highly variable which may suggest that influxes of
organic N could be responsible for variability over time. However, as leaves aged there were
consistent patterns of reduced levels of A and R across treatments.
Previous studies have shown that the relationship between leaf age and overall
physiological capacity is negative across plant types (Suzuki et al. 1987, Whitehead et al. 2011).
Black mangrove leaf lifespan is ~16 months (consistent with many broadleaved tropical and
subtropical evergreens), supporting our hypothesis that Avicennia would show a negative
relationship between leaf age and physiological response to nutrient enrichment (Reich et al.
1992, Reich et al. 1998, Suarez and Medina 2005). Our work supports this hypothesis as Rarea25,
and Rmass25 were greatly reduced in old Avicennia leaves. We found that old leaves had much
higher LMA and lower parameters of A and R relative to new leaves. This response might be
driven by a reduction in leaf N allocated to Rubisco and a simultaneous increase in leaf N is
allocated to cell wall material (Kattge et al. 2011, Onoda et al 2017). Although results of
statistical analysis were not significant, old leaves showed reduced photosynthesis consistently
across treatment types and time with lower Vcmax (old leaves: mean = 79.1 ± 5.6 μmol m-2 s-1,
new leaves: mean = 87.5 ± 5.7 μmol m-2 s-1) and Jmax (old leaves: mean = 119 ± 6.7 μmol m-2 s-1,
new leaves: mean = 135 ± 6.9 μmol m-2 s-1). Leaves formed before the N (or P) pulse showed no
difference in response to application of fertilization indicating that an increase in parameters of A
is only measurable in leaves formed after the N pulse, and that response is relatively short lived.
This finding may be useful in describing similarities between relationships between leaf age,
respiration, and photosynthesis for Avicennia, mangroves, and other coastal wetland species.

67
Our results provide new information on the short-term and long-term impacts of nutrient
enrichment on mangrove photosynthetic and respiratory parameters. They suggest that
alleviation of N limitation drives short term increases in A and that N addition might drive long-
term elevation of R. Our results also suggest that old mangrove leaves reduce rates of R as they
increase LMA over time; a result found in most C3 plants. We note that coastal wetlands are not
well-represented in land surface models due to gaps in our understanding of key processes and
data limitations. The information presented here may be useful in modelling C cycle and nutrient
cycle feedbacks in coastal wetland ecosystems under current and future nutrient input scenarios.
Future studies that explore mangrove physiology of full factorial nutrient enrichment
experimental designs (N, P, N+P) and legacy effects of nutrient enrichment across multiple sites
will further advance our understanding of how nutrient inputs impact mangrove C exchange.

68
References
Alongi, D.M. Carbon Balance in Salt Marsh and Mangrove Ecosystems: A Global Synthesis. J.
Mar. Sci. Eng. 2020, 8, 767. https://doi.org/10.3390/jmse8100767
Alongi DM. Carbon Cycling and Storage in Mangrove Forests. Annual Review of Marine Science (2014) 6:1, 195-219
Brix H, Effects of Nitrogen Fertilization on Photosynthesis and Respiration in Douglas-Fir, Forest Science, Volume 17, Issue 4, December 1971, Pages 407–414, https://doi.org/10.1093/forestscience/17.4.407
Canadell, J. G. et al. Contributions to accelerating atmospheric CO2 growth from economic activity, carbon intensity, and efficiency of natural sinks. Proc. Natl Acad. Sci. USA 104, 18866–18870 (2007)
Chapman SK, Feller IC, Canas G, Hayes MA, Dix N, Hester M, Morris J, Langley JA.
Mangrove growth response to experimental warming is greatest near the range limit in
northeast Florida. Ecology. 2021 Mar 4:e03320. doi: 10.1002/ecy.3320. Epub ahead of
print. PMID: 33665838. Cheeseman, J. 1994. Depressions of photosynthesis in mangrove canopies. In Photoinhibition of
Photosynthesis: From Molecular Mechanisms to the Field. Eds. N.R. Baker and J.R. Bowyer. Bios, Oxford, pp 377–389.
Ciais, P, Sabine, C, Bala, G. (2013) Carbon and other biogeochemical cycles. In: Stocker, TF,
Qin, D, Plattner, G-K (eds) Climate Change 2013: The Physical Science Basis.
Contribution of Working Group I to the Fifth Assessment Report of the
Intergovernmental Panel on Climate Change. Cambridge, New York: Cambridge
University Press, pp. 465–544.
Collalti, A.; Tjoelker, M.G.; Hoch, G.; Mäkelä, A.; Guidolotti, G.; Heskel, M.; Petit, G.; Ryan,
M.G.; Battipaglia, G.; Matteucci, G.; et al. Plant respiration: Controlled by
photosynthesis or biomass? Glob. Chang. Biol. 2020, 26, 1739–1753.
Dangremond EM, Simpson LT, Osborne TZ, Feller IC (2020) Mangrove range expansion in the temperate-tropical ecotone. Ecosystems 23: 703-714 http://doi.org/10.1007/s10021-019-00441-2
Donato, D., Kauffman, J., Murdiyarso, D. et al. Mangroves among the most carbon-rich forests
in the tropics. Nature Geosci 4, 293–297 (2011). https://doi.org/10.1038/ngeo1123
Downing, J., McClain, M., Twilley, R. et al. The impact of accelerating land-use change on the
N-Cycle of tropical aquatic ecosystems: Current conditions and projected changes.
Biogeochemistry 46, 109–148 (1999). https://doi.org/10.1023/A:1006156213761
Evans, J. R. (1989). Photosynthesis and nitrogen relationships in leaves of C3 plants. Oecologia, 78(1), 9– 19. Gough CM, John R. Seiler, Kurt H. Johnsen, David Arthur Sampson, Seasonal
Photosynthesis in Fertilized and Nonfertilized Loblolly Pine, Forest Science, Volume 50,
Issue 1, February 2004, Pages 1–9, https://doi.org/10.1093/forestscience/50.1.1
John R Evans, Victoria C Clarke, The nitrogen cost of photosynthesis, Journal of Experimental Botany, Volume 70, Issue 1, 1 January 2019, Pages 7–15, https://doi.org/10.1093/jxb/ery366
Feller, I.C. 1995. Effects of nutrient enrichment on growth and herbivory of dwarf red mangrove (Rhizophora mangle). Ecol. Monogr. 65:477–505.
Feller IC, Whigham DF, McKee KL, Lovelock CE. 2003. Nitrogen limitation of growth and

69
nutrient dynamics in a disturbed mangrove forest, Indian River Lagoon, Florida. Oecologia 134:405–14.
Feller IC, Lovelock CE, McKee KL. 2007. Nutrient addition differentially affects ecological processes of Avicennia germinans in nitrogen versus phosphorus limited mangrove ecosystems. Ecosystems 10:347–59.
Fernández‐Martínez, M., Vicca, S., Janssens, I. A., Sardans, J., Luyssaert, S., Campioli, M., Chapin, F. S. III, Ciais, P., Malhi, Y., Obersteiner, M., Papale, D., Piao, S. L., Reichstein, M., Rodà, F., & Peñuelas, J. (2014). Nutrient availability as the key regulator of global forest carbon balance. Nature Climate Change, 4(6), 471–476. https://doi.org/10.1038/nclimate2177
Field, C. H., &Mooney, H. A. (1986). Photosynthesis‐nitrogen relationship in wild plants. In T. J. Givnish (Ed.), Economy of plant form and function (pp. 25– 55). Cambridge: Cambridge University Press.
Fleischer K., K.T. Rebel, M.K. Molen, J.W. Erisman, M.J. Wassen, E.E. Loon, L. Montagnani, C.M. Gough, M. Herbst, I.A. Janssens, D. Gianelle, A.J. Dolman. The contribution of nitrogen deposition to the photosynthetic capacity of forests. Global Biogeochem. Cycles, 27 (2013), pp. 187-199
Fleischer K, Dolman AJ, van der Molen MK, Rebel KT, Erisman JW, Wassen MJ, Pak B, Lu X, Rammig A, Wang YP (2019) Nitrogen deposition maintains a positive effect on terrestrial carbon sequestration in the 21st century despite growing phosphorus limitation at regional scales. Glob Biogeochem Cycles 33:810–824
Friess DA, K Rogers, CE Lovelock, KW Krauss, SE Hamilton, SY Lee, R Lucas, J Primavera, A Rajkaran, S Shi (2019). The state of the worlds mangrove forests: Past, Present, and Future. Annual Review of Environment and Resources 44: 89-115. https://doi.org/10.1146/annurev-environ-101718-033302
Ghimire B, Riley WJ, Koven CDet al. A global trait-based approach to estimate leaf nitrogen functional allocation from observations. Ecol Appl2017; 27: 1421–34. 10.1002/eap.1542
Hayes, M.A., Jesse, A., Tabet, B. et al. The contrasting effects of nutrient enrichment on growth, biomass allocation and decomposition of plant tissue in coastal wetlands. Plant Soil 416, 193–204 (2017). https://doi.org/10.1007/s11104-017-3206-0
Holtgrieve G.W., et al. A coherent signature of anthropogenic nitrogen deposition to remote watersheds of the Northern Hemisphere. Science, 334 (2011), pp. 1545-1548
Janssens, I., Luyssaert, S. Nitrogen's carbon bonus. Nature Geosci 2, 318–319 (2009). https://doi.org/10.1038/ngeo505 Kathiresan, K., and B. L. Bingham. 2001. Biology of mangroves and mangrove ecosystems.
Advances in Marine Biology, 40: 84-254 Kattge J, Knorr W, Raddatz T, Wirth C (2009) Quantifying photosynthetic capacity and its
relationship to leaf nitrogen content for global-scale terrestrial biosphere models. Global Change Biology 15: 976-991.
Liang, X., Zhang, T., Lu, X., Ellsworth, D. S., BassiriRad, H., You, C., … Ye, Q. (2020). Global response patterns of plant photosynthesis to nitrogen addition: A meta‐analysis. Global Change Biology, 26(6), 3585–3600. https://doi.org/10.1111/gcb.15071
Li J, Qingxue Guo, Jinxin Zhang, Helena Korpelainen, Chunyang Li,
Effects of nitrogen and phosphorus supply on growth and physiological traits of two
Larix species, Environmental and Experimental Botany, Volume 130, 2016, Pages 206-
215, ISSN 0098-8472, https://doi.org/10.1016/j.envexpbot.2016.06.006.

70
Li W.B., H.X. Zhang, G.Z. Huang, R.X. Liu, H.J. Wu, C.Y. Zhao, N.G. McDowell Effects of nitrogen enrichment on tree carbon allocation: a global synthesis Global Ecol. Biogeogr., 29 (2019), pp. 573-589, 10.1111/geb.13042
Linder, S. and D.A. Rook. 1984. Effects of mineral nutrition on carbon dioxide exchange and partitioning of carbon in trees. In Nutrition of Plantation Forests. Eds. G.D. Bowen and E.K.S. Nambiar. AcademicPress, London, pp 211--236.
Lovelock CE, Feller IC (2003) Photosynthetic performance and resource utilization of two mangrove species coexisting in hypersaline scrub forest. Oecologia 134: 455–462.
Lovelock CE, Ball MC, Feller IC, Engelbrecht BMJ, Ewe ML (2006) Plant function in nitrogen and phosphorus limited mangrove ecosystems. New Phytol 172: 514–522.
Lovelock C.E., Feller I.C., Ellis J., Schwarz A., Hancock N., Nichols P., Sorrell B.. Mangrove growth in New Zealand estuaries: the role of nutrient enrichment at sites with contrasting rates of sedimentation, Oecologia, 2007, vol. 153 (pg. 633-641)
Manter DK, Kathleen L. Kavanagh, Cathy L. Rose, Growth response of Douglas-fir
seedlings to nitrogen fertilization: importance of Rubisco activation state and respiration
rates, Tree Physiology, Volume 25, Issue 8, August 2005, Pages 1015–1021,
https://doi.org/10.1093/treephys/25.8.1015
Martin, K.C., D. Bruhn, C.E. Lovelock, I.C. Feller, J.R. Evans and M.C. Ball. 2010. Nitrogen fertilization enhances water-use efficiency in a saline environment. Plant Cell Environ. 10.1111/ j.1365-3040.2009.02072.x.
Mcleod, E., Chmura, G. L., Bouillon, S., Salm, R., Björk, M., Duarte, C. M., Lovelock, C.
E., Schlesinger, W. H., & Silliman, B. R. (2011). A blueprint for blue carbon: Toward an
improved understanding of the role of vegetated coastal habitats in sequestering
CO2. Frontiers in Ecology and the Environment, 9(10), 552-560.
https://doi.org/10.1890/110004
Meybeck M. 2003. Global analysis of river systems: from Earth system controls to Anthropocene syndromes. Phil. Trans. R. Soc. Lond. B 358:1935–1955 http://doi.org/10.1098/rstb.2003.1379
Mozdzer TJ, EB Watson, WH Orem, CM Swarzenski. Unraveling the Gordian knot: eight
testable hypotheses on the effects of nutrient enrichment on tidal wetland sustainability
Sci. Total Environ. (2020), 10.1016/j.scitotenv.2020.140420
Nagelkerken I., S.J.M. Blaber, S. Bouillon, P. Green, M. Haywood, L.G. Kirton, J.-O. Meynecke, J. Pawlik, H.M. Penrose, A. Sasekumar, P.J. Somerfield, The habitat function of mangroves for terrestrial and marine fauna: A review, Aquatic Botany, Volume 89, Issue 2, 2008, Pages 155-185, ISSN 0304-3770, https://doi.org/10.1016/j.aquabot.2007.12.007.
Naidoo G (2009) Differential effects of nitrogen and phosphorus enrichment on growth of dwarf Avicennia marina mangroves. Aqua Bot 90: 184–190.
Nijs, I., Behaeghe, T., &Impens, I. (1995). Leaf nitrogen content as a predictor of photosynthetic capacity in ambient and global change conditions. Journal of Biogeography, 22(2/3), 177– 183. https://doi.org/10.2307/2845908
Onoda Y, Wright IJ, Evans JR, Hikosaka K, Kitajima K, Niinemets Ü, Poorter H, Tosens T, Westoby M. 2017. Physiological and structural tradeoffs underlying the leaf economics spectrum. New Phytologist214, 1447–1463.
Ostertag R and DiManno NM (2016) Detecting Terrestrial Nutrient Limitation: A Global Meta-Analysis of Foliar Nutrient Concentrations after Fertilization. Front. Earth Sci.

71
4:23. doi: 10.3389/feart.2016.00023 Reef R, Ilka C. Feller, Catherine E. Lovelock, Nutrition of mangroves, Tree Physiology,
Volume 30, Issue 9, September 2010, Pages 1148-1160, https://doi.org/10.1093/treephys/tpq048
Reich, P. B., Walters, M. B. & Ellsworth, D. S. Leaf life-span in relation to leaf, plant, and stand characteristics among diverse ecosystems. Ecol. Monogr. 62, 365–392 (1992)
Reich, P. B. et al. Relationships of leaf dark respiration to leaf nitrogen, specific leaf area and leaf life-span—a test across biomes and functional groups. Oecologia 114, 471–482 (1998)
Reich PB, M.G. Tjoelker, K.S. Pregitzer, I.J. Wright, J. Oleksyn, J.L. Machado Scaling
of respiration to nitrogen in leaves, stems and roots of higher land plants. Ecol. Lett., 11
(2008), pp. 793-801
Schleppi P, Bucher-Wallin I, Hagedorn F, Körner C (2012) Increased nitrate availability in the soil of a mixed mature temperate forest subjected to elevated CO2 concentration (canopy FACE). Glob Chang Biol 18:757–768
Simpson L.T., I.C. Feller, and S.K. Chapman. 2013. Effects of competition and nutrient enrichemnt on avicennia germinans in the salt marsh-mangrove ecotone. Aquatic Botany 104: 55–59.
Stevens, C. J. Nitrogen in the environment. Science 363, 578–580 (2019)
Suzuki S, H Nakamoto, MSB Ku, GE Edwards (1987) Influence of Leaf Age on Photosynthesis,
Enzyme Activity, and Metabolite Levels in Wheat. Plant Physiology 84 (4) 1244-1248;
DOI: 10.1104/pp.84.4.1244
Teskey RO, H. L. Gholz, W. P. Cropper, Jr., Influence of climate and fertilization on net
photosynthesis of mature slash pine, Tree Physiology, Volume 14, Issue 11, November
1994, Pages 1215–1227, https://doi.org/10.1093/treephys/14.11.1215
Van de Weg, M.J., Shaver, G.R. & Salmon, V.G. Contrasting effects of long term versus short-
term nitrogen addition on photosynthesis and respiration in the Arctic. Plant Ecol 214,
1273–1286 (2013). https://doi.org/10.1007/s11258-013-0250-6
Walker, A. P., Beckerman, A. P., Gu, L., Kattge, J., Cernusak, L. A., Domingues, T. F., Scales,
J. C., Wohlfahrt, G., Wullschleger, S. D., & Ian Woodward, F. (2014). The relationship
of leaf photosynthetic traits – Vcmax and Jmax – To leaf nitrogen, leaf phosphorus, and
specific leaf area: A meta‐analysis and modeling study. Ecology and Evolution, 4, 3218–
3235.
Ward ND, Megonigal JP, Bond-Lamberty B, Bailey VL, Butman D, Canuel EA, Diefenderfer H, Ganju NK, Goni MA, Graham EB, Hopkinson CS, Khangaonkar T, Langley JA, McDowell NG, Myers-Pigg AN, Neumann RB, Osburn CL, Price RM, Rowland J, Sengupta A, Simard M, Thornton PE, Tzortziou M, Vargas R, Weisenhorn PB, Windham-Myers L (2020) Representing the function and sensitivity of coastal interfaces in earth system models. Nature Communications 11: 2458 https://doi.org/10.1038/s41467-020-16236-2
Whitehead D, MM Barbour, KL Griffin, MH Turnbull, DT Tissue, Effects of leaf age and tree size on stomatal and mesophyll limitations to photosynthesis in mountain beech (Nothofagus solandrii var. cliffortiodes), Tree Physiology, Volume 31, Issue 9, September 2011, Pages 985–996, https://doi.org/10.1093/treephys/tpr021
Wilson KB, Dennis D. Baldocchi, Paul J. Hanson, Spatial and seasonal variability of

72
photosynthetic parameters and their relationship to leaf nitrogen in a deciduous forest,
Tree Physiology, Volume 20, Issue 9, May 2000, Pages 565–578,
https://doi.org/10.1093/treephys/20.9.565
Zaehle, S. (2013), Terrestrial nitrogen‐carbon cycle interactions at the global scale, Philos. Trans. R. Soc., B, 368, 20130125, doi:10.1098/rstb.2013.0125.
Zhang H, Fenghui Yuan, Jiabing Wu, Changjie Jin, Alexandria L Pivovaroff, Jinyuan
Tian, Weibin Li, Dexin Guan, Anzhi Wang, Nate G McDowell, Responses of functional
traits to seven-year nitrogen addition in two tree species: coordination of hydraulics, gas
exchange and carbon reserves, Tree Physiology, Volume 41, Issue 2, February 2021,
Pages 190–205, https://doi.org/10.1093/treephys/tpaa120
Zomlefer, W., Giannasi, D., Judd, W., Kruse, L., Bettinger, K. (2004). A floristic survey of Fort Matanzas national monument, St. Johns county, florida. SIDA, Contributions to Botany, 21(2), 1081-1106. Retrieved January 3, 2021, from http://www.jstor.org/stable/41968359

73
Table 1. Results of a two-way analysis of variance testing the main and interactive effect of fertilization treatment and measurement date on in situ rate of leaf net photosynthesis (Asat), stomatal conductance to water vapor (gs), water use efficiency (WUE), the estimated rate of Rubisco carboxylation (Vcmax), the maximum rate of electron transport for RuBP regeneration (Jmax), and stomatal limitation of net photosynthesis (L). Degrees of freedom (df) and F-values are presented for each factor and reponse variable. F-values with ‘*’, ‘**’ and ‘***’ are significant at P<0.05, P<0.01, and P<0.001, respectively.
df Asat gs WUE Vcmax Jmax L
Treatment (T) 2 0.56 0.01 0.40 0.83 0.68 0.14 Date (D) 3 2.57 3.60* 2.73 3.53* 2.89* 2.50
T x D 6 1.10 0.59 0.55 0.97 0.62 0.71

74
Table 2. Results of a two-way analysis of variance testing the main and interactive effect of fertilization treatment and timing of fertilizer application (before versus after N or P application on the in situ rate of leaf net photosynthesis (Asat), stomatal conductance to water vapor (gs), water use efficiency (WUE), the estimated rate of Rubisco carboxylation (Vcmax), the maximum rate of electron transport for RuBP regeneration (Jmax), and stomatal limitation of net photosynthesis (L). Degrees of freedom (df) and F-values are presented for each factor and reponse variable. F-values with ‘*’, ‘**’ and ‘***’ are significant at P<0.05, P<0.01, and P<0.001, respectively.
df Asat gs WUE Vcmax Jmax L
Treatment (T) 2 0.58 0.02 0.44 0.81 0.57 0.16 Application (A) 1 6.35* 6.78* 0.22 5.64* 0.37 0.05
T x A 2 2.05 1.48 0.11 2.37 0.34 0.11

75
Table 3. Results of a two-way analysis of variance testing the main and interactive effect of fertilization treatment and leaf age (formed prior to fertlizer pulse, formed after fertlizer pulse) on the in situ rate of leaf net photosynthesis (Asat), stomatal conductance to water vapor (gs), water use efficiency (WUE), the estimated rate of Rubisco carboxylation (Vcmax), the maximum rate of electron transport for RuBP regeneration (Jmax), and stomatal limitation of net photosynthesis (L). Degrees of freedom (df) and F-values are presented for each factor and reponse variable. F-values with ‘*’, ‘**’ and ‘***’ are significant at P<0.05, P<0.01, and P<0.001, respectively.
df Asat gs WUE Vcmax Jmax L
Treatment (T) 2 1.74 0.03 1.14 2.70 0.79 0.00 Leaf age (La) 1 1.26 1.66 0.39 1.43 2.87 0.77
T x La 2 1.11 1.20 0.15 0.80 1.31 0.02

76
Table 4. Results of a two-way analysis of variance testing the main and interactive effect of nutrient treatment and measurement date on rates of leaf dark respiration at per unit area and per unit mass at 25 °C (Rarea25, Rmass25), leaf dry mass per unit area (LMA), and the temperature sensitivity of R (Q10) in Avicennia germinans. Degrees of freedom (df) and F-values are presented for each factor and reponse variable. F-values with ‘*’, ‘**’ and ‘***’ are significant at P<0.05, P<0.01, and P<0.001, respectively.
df Rarea25 Rmass25 LMA Q10 Treatment (T) 2 1.45 2.91 1.57 1.81
Date (D) 4 3.27* 2.79* 3.25* 2.42 T x D 8 0.91 0.87 1.00 0.90

77
Table 5. Results of a two-way analysis of variance testing the main and interactive effect of nutrient treatment (T) and leaf age (La) on rates of leaf dark respiration at per unit area and per unit mass at 25 °C (Rarea25, Rmass25), leaf dry mass per unit area (LMA), and the temperature sensitivity of R (Q10) in Avicennia germinans. Degrees of freedom (df) and F-values are presented for each factor and reponse variable. F-values with ‘*’, ‘**’ and ‘***’ are significant at P<0.05, P<0.01, and P<0.001, respectively.
df Rarea25 Rmass25 LMA Q10 Treatment (T) 2 0.58 0.61 0.23 0.78 Leaf age (La) 1 13.49*** 16.46*** 16.20*** 1.61
T x La 2 0.73 0.55 0.21 0.08

78
Table 6. Results of a two-way analysis of variance testing the main and interactive effect of nutrient treatment (T) and application (A) on rates of leaf dark respiration at per unit area and per unit mass at 25 °C (Rarea25, Rmass25), leaf dry mass per unit area (LMA), and the temperature sensitivity of R (Q10) in Avicennia germinans. Degrees of freedom (df) and F-values are presented for each factor and reponse variable. F-values with ‘*’, ‘**’ and ‘***’ are significant at P<0.05, P<0.01, and P<0.001, respectively.
df Rarea25 Rmass25 LMA Q10 Treatment (T) 2 1.53 2.60 1.39 1.79
Application (A) 1 0.92 0.01 0.85 0.45 T x A 2 0.28 0.12 0.20 0.11

79
Figure 1. Means (± standard error) values for leaf photosynthetic parameters across collection dates for Avicennia germinans (panels a, c, e, g, i, k). Significant main and interactive effects of treatment (T) and date (D) are annotated in the upper right corner of each panel. The red vertical line represents the fertilization event. Signifigant main and interactive effects of fertilization treatment (T) and measurement date (D) on in situ rate of leaf net photosynthesis (Asat) (panels a and b), stomatal conductance to water vapor (gs) (panels c and d), water use efficiency (WUE) (panels e and f) estimated rate of Rubisco carboxylation (Vcmax) (panels g and h), electron transport for RuBP regeneration (Jmax) (panels i and j), and stomatal limitation (L) (panels k and l).

80
Figure 2. Means of leaf respiratory traits across collection dates for Avicennia germinans are shown in panels a, c, e, g. Significant main and interactive effects of treatment (T) and date (D) are annotated in the upper right corner of each panel. The red vertical line indicates the fertilization event. Means of photosynthetic traits Pre and Post fertilization event are shown in panels b, d, f, h. Leaf respiration per unit area at 25°C (panels a and b) Leaf respiration per unit mass at 25°C (panels c and d); Leaf mass per unit area (LMA) (panels e and f); The temperature sensitivity (Q10) of Rmass25 (panels g and h).

81
Supplemental Tables and Figures

Table S1. Log polynomial parameter estimates of a, b, and c for each Species x Treatment (W = warmed, A = ambient) x Site (North or South) x Date combination. Standard error of each estimate is also shown. Grey rectangles signify the dates at which leaf N concentration was measured.
October 2019 December 2019 February 2020 April 2020 June 2020 July 2020
a b c a b c a b c a b c a b c a b c
S. alterniflora
North W -0.3986 ±0.326
0.0741 ±0.004
-0.0002 ±0.000
-0.2062 ±0.330
0.0753 ±0.004
-0.0003 ±0.000
-0.0729 ±0.379
0.0455 ±0.015
0.0003 ±0.000
-0.3432 ±0.380
0.0761 ±0.012
-0.0003 ±0.000
0.4976 ±0.399
0.0091 ±0.021
0.0008 ±0.000
-0.2591 ±0.303
0.0548 ±0.011
0.0000 ±0.000
North A -0.6269 ±0.444
0.0983 ±0.003
-0.0006 ±0.000
-0.5400 ±0.332
0.1030 ±0.006
-0.0007 ±0.000
-0.6282 ±0.395
0.0929 ±0.012
-0.0005 ±0.000
-0.2108 ±0.333
0.0720 ±0.004
-0.0002 ±0.000
0.0839 ±0.459
0.0437 ±0.023
0.0003 ±0.000
-0.1486 ±0.005
0.0500 ±0.005
0.0002 ±0.000
South W -0.5175 ±0.395
0.0927 ±0.009
-0.0006 ±0.000
-0.4064 ±0.327
0.0672 ±0.008
0.0000 ±0.000
-0.5963 ±0.340
0.0855 ±0.012
-0.0004 ±0.000
-0.2298 ±0.374
0.0648 ±0.012
-0.0001 ±0.000
-0.2852 ±0.313
0.0609 ±0.007
0.0000 ±0.000
-0.2750 ±0.294
0.0572 ±0.007
0.0000 ±0.000
South A -0.4701 ±0.294
0.0847 ±0.008
-0.0004 ±0.000
-0.4363 ±0.332
0.0780 ±0.013
-0.0003 ±0.000
-0.6712 ±0.318
0.1001 ±0.007
-0.0006 ±0.000
-0.6750 ±0.352
0.0905 ±0.007
-0.0005 ±0.000
-0.2474 ±0.313
0.0535 ±0.007
0.0001 ±0.000
0.2513 ±0.288
0.0224 ±0.008
0.0006 ±0.000
A. germinans
North W -0.5076 ±0.306
0.0232 ±0.016
0.0008 ±0.000
-0.4709 ±0.221
0.0302 ±0.006
0.0008 ±0.000
-1.1186 ±0.245
0.0788 ±0.011
0.0000 ±0.000
-0.9562 ±0.250
0.0653 ±0.009
0.0002 ±0.000
-0.1130 ±0.392
0.0232 ±0.017
0.0008 ±0.000
-0.1831 ±0.255
0.0139 ±0.008
0.0010 ±0.000
North A -0.6151 ±0.270
0.0268 ±0.012
0.0008 ±0.000
-0.3647 ±0.251
0.0243 ±0.008
0.0009 ±0.000
-1.3228 ±0.247
0.0846 ±0.007
0.0000 ±0.000
-1.0407 ±0.248
0.0691 ±0.011
0.0002 ±0.000
0.5286 ±0.380
-0.0199 ±0.020
0.0015 ±0.000
-0.5173 ±0.239
0.0319 ±0.007
0.0007 ±0.000
South W -0.4381 ±0.525
0.0431 ±0.013
0.0003 ±0.000
-1.3511 ±0.286
0.0789 ±0.011
0.0000 ±0.000
-0.9903 ±0.251
0.0621 ±0.009
0.0004 ±0.000
-1.4821 ±0.262
0.1063 ±0.009
-0.0004 ±0.000
-0.2795 ±0.260
0.0330 ±0.007
0.0007 ±0.000
-0.2570 ±0.308
0.0387 ±0.008
0.0006 ±0.000
South A -0.7724 ±0.441
0.0419 ±0.020
0.0006 ±0.000
-1.5348 ±0.250
0.0755 ±0.009
0.0001 ±0.000
-1.3524 ±0.278
0.0781 ±0.013
0.0001 ±0.000
-1.3717 ±0.221
0.0813 ±0.007
0.0000 ±0.000
-0.5131 ±0.332
0.0356 ±0.015
0.0008 ±0.000
-0.3717 ±0.349
0.0451 ±0.015
0.0006 ±0.000

Figure S1. North site difference between Warmed and Ambient plots; daily mean (panel a) and max (panel b). South site difference between Warmed and Ambient plots; daily mean (panel c) and max (panel d).The green dashed lines represent the mean affect of warming over the course of the study.
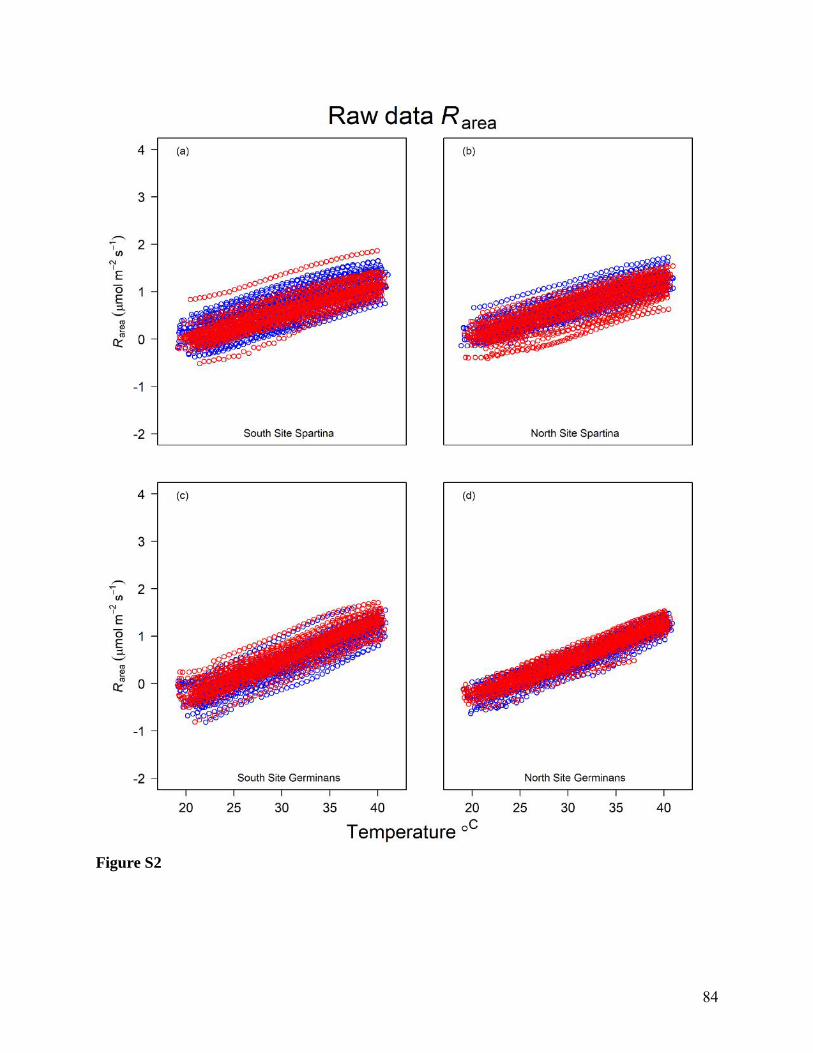
84
Figure S2

85
Figure S3

86
Figure S4. The proportion of variance explained for each of the leaf physiological traits analyzed across all timepoints. Panel a shows main and interactive effects that explain the greatest proportion of variance. Panel b shows what main and interactive effects make up the “Other” section from panel a.

87
Figure S5. Maximum, mean, and minimum temperature differences over the course of the study. Grey rectangles signify timepoints of sampling. Green rectangle signifies fertilization.

88
References
Adame, M. F. et al. The undervalued contribution of mangrove protection in Mexico to carbon
emission targets. Conserv. Lett. 11, e12445 (2018). Ainouche, M., Gray, A. Invasive Spartina: lessons and challenges. Biol Invasions 18, 2119–2122
(2016). https://doi.org/10.1007/s10530-016-1201-7
Akaji, Y., Inoue, T., Tomimatsu, H. et al. Photosynthesis, respiration, and growth patterns
of Rhizophora stylosa seedlings in relation to growth temperature. Trees 33, 1041–1049
(2019). https://doi.org/10.1007/s00468-019-01840-7
Alongi DM. (2002). Present state and future of the world's mangrove forests. Environmental Conservation, 29(3), 331-349. Retrieved January 25, 2021, from http://www.jstor.org/stable/44520614
Alongi DM. Carbon Cycling and Storage in Mangrove Forests. Annual Review of Marine Science (2014) 6:1, 195-219
Alongi DM and SK Mukhopadhyay. 2015. Contribution of mangroves to coastal carbon cycling in low lattitude seas. Agricultural and Forest Meteorology 213: 266-272.
Alongi, D.M. Carbon Balance in Salt Marsh and Mangrove Ecosystems: A Global Synthesis. J.
Mar. Sci. Eng. 2020, 8, 767. https://doi.org/10.3390/jmse8100767
Aspinwall, M. J., Drake, J. E., Campany, C., Vårhammar, A., Ghannoum, O., Tissue, D. T., …
Tjoelker, M. G. (2016). Convergent acclimation of leaf photosynthesis and respiration to
prevailing ambient temperatures under current and warmer climates in Eucalyptus
tereticornis. New Phytologist, 212, 354–367. https://doi.org/10.1111/nph.14035
Aspinwall, M., Vårhammar, A., Blackman, C., Tjoelker, M., Ahrens, C., Byrne, M., … Rymer,
P. (2017). Adaptation and acclimation both influence photosynthetic and respiratory
temperature responses in Corymbia calophylla. Tree Physiology, 37, 8, 1095–1112.
Aspinwall, M. J., Pfautsch, S., Tjoelker, M. G., Vårhammar, A., Possell, M., Drake, J. E., Reich,
P. B., Tissue, D. T., Atkin, O. K., Rymer, P. D., & Dennison, S. (2019). Range size and
growth temperature influence Eucalyptus species responses to an experimental heatwave.
Global Change Biology, 25, 1665–1684. https://doi.org/10.1111/gcb.14590
Aspinwall MJ, Martina Faciane, Kylie Harris, Madison O’Toole, Amy Neece, Vrinda
Jerome, Mateo Colón, Jeff Chieppa, Ilka C Feller, Salinity has little effect on
photosynthetic and respiratory responses to seasonal temperature changes in black
mangrove (Avicennia germinans) seedlings, Tree Physiology, Volume 41, Issue 1,
January 2021, Pages 103–118, https://doi.org/10.1093/treephys/tpaa107
Atkin OK, Evans JR, Ball MC, Lambers H, Pons TL. 2000. Leaf respiration of snow gum in the
light and dark. Interactions between temperature and irradiance. Plant Physiology 122:
915–923.
Atkin OK, M.G. Tjoelker. Thermal acclimation and the dynamic response of plant respiration to
temperature. Trends Plant Sci., 8 (2003), pp. 343-351
Atkin OK., Bruhn Dan, Hurry Vaughan M., Tjoelker Mark G. (2005) Evans Review No. 2:
The hot and the cold: unravelling the variable response of plant respiration to
temperature. Functional Plant Biology 32, 87-105.
Atkin OK, Meir P, Turnbull MH (2014) Improving representation of leaf respiration in large-
scale predictive climate-vegetation models. New Phytologist 202(3):743–748.
Atkin, O., K.J. Bloomfield, P.B. Reich, M.G. Tjoelker, G.P. Asner, D. Bonal, G. Bönisch, M.G

89
. Bradford, L.A. Cernusak, E.G. Cosio, D. Creek, K.Y. Crous, T.F. Domingues, J.S. Duke
s, J.J.G. Egerton, J.R. Evans, G.D. Farquhar, N.M. Fyllas, P.P.G. Gauthier, E. Gloor, T.E.
Gimeno, K.L. Griffin, R. Guerrieri, M.A. Heskel, C. Huntingford, F.Y. Ishida, J. Kattge,
H. Lambers, M.J. Liddell, J. Lloyd, C.H. Lusk, R.E. Martin, A.P. Maksimov, T.C. Maxi
mov, Y. Malhi, B.E. Medlyn, P. Meir, L.M. Mercado, N. Mirotchnick, D. Ng, Ü. Niinem
ets, O.S. O’Sullivan, O.L. Phillips, L. Poorter, P. Poot, I.C. Prentice, N. Salinas, L.M. Ro
wland, M.G. Ryan, S. Sitch, M. Slot, N.G. Smith, M.H. Turnbull, M.C. VanderWel, F. V
alladares, E.J. Veneklaas, L.K. Weerasinghe, C. Wirth, I.J. Wright, K.R. Wythers, J. Xian
g, S. Xiang, J. Zaragoza-Castells. Global variability in leaf respiration in relation to
climate, plant functional types and leaf traits. New Phytologist, 206 (2015), pp. 614-636
Atwood, T. B., Connolly, R. M., Almahasheer, H., Carnell, P. E., Duarte, C. M., Ewers Lewis, C.,J., . . . Lovelock, C. E. (2017). Global patterns in mangrove soil carbon stocks and losses. Nature Climate Change, 7(7), 523-528. http://dx.doi.org/10.1038/nclimate3326
Azcón‐Bieto J, Lambers H, Day DA. 1983. Effect of photosynthesis and carbohydrate status on
respiratory rates and the involvement of the alternative pathway in leaf respiration. Plant
Physiology 72: 598–603.
Ball MC (2002) Interactive effects of salinity and irradiance on growth: implications for
mangrove forest structure along salinity gradients. Trees 16:126–139
Bolstad PV, Peter Reich, Tali Lee, Rapid temperature acclimation of leaf respiration rates in
Quercus alba and Quercus rubra, Tree Physiology, Volume 23, Issue 14, October 2003,
Pages 969–976, https://doi.org/10.1093/treephys/23.14.969
Bouillon S, AV Borges, E Castaneda-Moya, K Diele, T Dittmar, NC Duke, E Kristensen, SY
Lee, C Marchand, JJ Middelburg, VH Rivera-Monroy, TJ Smith III, RR Twilley. 2008.
Global Biogeochemical Cycles 22: GB2013, doi:10.1029/2007GB003052
Bruhn D, Egerton JJG, Loveys BR, Ball MC. 2007. Evergreen leaf respiration acclimates to
long‐term nocturnal warming under field conditions. Global Change Biology 13: 1216–
1223.
Cahoon, D.R., McKee, K.L. & Morris, J.T. How Plants Influence Resilience of Salt Marsh and Mangrove Wetlands to Sea-Level Rise. Estuaries and Coasts (2020). https://doi.org/10.1007/s12237-020-00834-w
Cavanaugh, K. C., J. R. Kellner, A. J. Forde, D. S. Gruner, J. D. Parker, W. Rodriguez & I. C. Feller, 2014. Poleward expansion of mangroves is a threshold response to decreased frequency of extreme cold events. PNAS USA 111: 723–727.
Cavanaugh, K. C., J. D. Parker, S. C. Cook-Patton, I. C. Feller, A. P. Williams & J. R. Kellner, 2015. Integrating physiological threshold experiments with climate modeling to project mangrove species’ range expansion. Global Change Biology 21: 1928–1938.
Chambers, J., Higuchi, N., Tribuzy, E. et al. Carbon sink for a century. Nature 410, 429 (2001). https://doi.org/10.1038/35068624
Chapman SK, Feller IC, Canas G, Hayes MA, Dix N, Hester M, Morris J, Langley JA.
Mangrove growth response to experimental warming is greatest near the range limit in
northeast Florida. Ecology. 2021 Mar 4:e03320. doi: 10.1002/ecy.3320. Epub ahead of
print. PMID: 33665838.
Cheeseman, J. 1994. Depressions of photosynthesis in mangrove canopies. In Photoinhibition of Photosynthesis: From Molecular Mechanisms to the Field. Eds. N.R. Baker and J.R. Bowyer. Bios, Oxford, pp 377–389.
Cheesman AW, Winter K. 2013. Growth response and acclimation of CO2 exchange

90
characteristics to elevated temperatures in tropical tree seedlings. Journal of
Experimental Botany 64: 3817– 3828.
Chen, E., J. A. Blaze, R. S. Smith, S. Peng, and J. E. Byers. 2020. Freeze-tolerance of 430
poleward-spreading mangrove species weakened by soil properties of resident salt marsh
431 competitor. Journal of Ecology 108:1725-1737.
Ciais, P, Sabine, C, Bala, G. (2013) Carbon and other biogeochemical cycles. In: Stocker, TF,
Qin, D, Plattner, G-K (eds) Climate Change 2013: The Physical Science Basis.
Contribution of Working Group I to the Fifth Assessment Report of the
Intergovernmental Panel on Climate Change. Cambridge, New York: Cambridge
University Press, pp. 465–544.
Clough BF, Sim RG (1989) Changes in gas exchange characteristics and water use efficiency of
mangroves in response to salinity and vapour pressure deficit. Oecologia 79:38–44
Coldren GA, CR Barreto, DD Wykoff, EM Morrissey, JA Langley, IC Feller, SK Chapman. 2016. Chronic warming stimulates growth of marsh grasses more than mangroves in a coastal wetland ecotone. Ecology 97(11) 3167-3175.
Coldren GA, JA Langley, IC Feller, SK Chapman. 2018. Warming accelerates mangrove expansion and surface elevation gain in a subtropical wetland. Journal of Ecology 107(1) 79-90.
Crous K.Y., G. Wallin, O. K. Atkin, J. Uddling, A. af Ekenstam, Acclimation of light and dark
respiration to experimental and seasonal warming are mediated by changes in leaf
nitrogen in Eucalyptus globulus, Tree Physiology, Volume 37, Issue 8, August 2017,
Pages 1069–1083, https://doi.org/10.1093/treephys/tpx052
Dangremond EM, Simpson LT, Osborne TZ, Feller IC (2020) Mangrove range expansion in the temperate-tropical ecotone. Ecosystems 23: 703-714 http://doi.org/10.1007/s10021-019-00441-2
Darby, F.A., Turner, R.E. Below- and Aboveground Biomass of Spartina alterniflora: Response to Nutrient Addition in a Louisiana Salt Marsh. Estuaries and Coasts: J CERF 31, 326–334 (2008). https://doi.org/10.1007/s12237-008-9037-8
Davis, J., Currin, C. & Morris, J.T. Impacts of Fertilization and Tidal Inundation on Elevation Change in Microtidal, Low Relief Salt Marshes. Estuaries and Coasts 40, 1677–1687 (2017). https://doi.org/10.1007/s12237-017-0251-0
Donato, D., Kauffman, J., Murdiyarso, D. et al. Mangroves among the most carbon-rich forests
in the tropics. Nature Geosci 4, 293–297 (2011). https://doi.org/10.1038/ngeo1123
Drake, J. E., Tjoelker, M. G., Aspinwall, M. J., Reich, P. B., Barton, C. V. M., Medlyn, B. E., &
Duursma, R. A. (2016). Does physiological acclimation to climate warming stabilize the
ratio of canopy respiration to photosynthesis? New Phytologist, 211, 850–863.
https://doi.org/10.1111/nph.13978
Drake, J. E., Tjoelker, M. G., Vårhammar, A., Medlyn, B., Reich, P. B., Leigh, A., Pfautsch, S.,
Blackman, C. J., López, R., Aspinwall, M. J., Crous, K. Y., Duursma, R. A.,
Kumarathunge, D., De Kauwe, M. G., Jiang, M., Nicotra, A. B., Tissue, D. T., Choat, B.,
Atkin, O. K., & Barton, C. V. M. (2018). Trees tolerate an extreme heatwave via
sustained transpirational cooling and increased leaf thermal tolerance. Global Change
Biology, 24(6), 2390–2402. https://doi.org/10.1111/gcb.14037
Doughty CL, JA Langley, WS Walker, IC Feller, R Schaub, SK Chapman. 2016. Mangrove Range Expansion Rapidly Increases Coastal Wetland Carbon Storage. Estuaries and Coasts 39: 385-396 DOI 10.1007/s12237-015-9993-8

91
Doughty CL, KC Cavanaugh, CR Hall, IC Feller, SK Chapman. 2017. Impacts of mangrove encroachment and mosquito impoundment management on coastal protection services. Hydrobiologia 803: 105-120.
Downing, J., McClain, M., Twilley, R. et al. The impact of accelerating land-use change on the
N-Cycle of tropical aquatic ecosystems: Current conditions and projected changes.
Biogeochemistry 46, 109–148 (1999). https://doi.org/10.1023/A:1006156213761
Duarte CM, IJ Losada, IE Hendriks, I Mazarrasa, N Marba. 2013. The role of coastal plant
communities for climate change mitigation and adaptation. Nature climate change 3:
961-969.
Evans, J. R. (1989). Photosynthesis and nitrogen relationships in leaves of C3 plants. Oecologia, 78(1), 9– 19. Evans JR, Victoria C Clarke, The nitrogen cost of photosynthesis, Journal of Experimental
Botany, Volume 70, Issue 1, 1 January 2019, Pages 7–15, https://doi.org/10.1093/jxb/ery366
Feller, I.C. 1995. Effects of nutrient enrichment on growth and herbivory of dwarf red mangrove (Rhizophora mangle). Ecol. Monogr. 65:477–505.
Feller IC, Whigham DF, McKee KL, Lovelock CE. 2003. Nitrogen limitation of growth and nutrient dynamics in a disturbed mangrove forest, Indian River Lagoon, Florida. Oecologia 134:405–14.
Feller IC, Lovelock CE, McKee KL. 2007. Nutrient addition differentially affects ecological processes of Avicennia germinans in nitrogen versus phosphorus limited mangrove ecosystems. Ecosystems 10:347–59.
Feller IC, DA Friess, KW Krauss, RR Lewis III. 2017. The state of the worlds mangroves in the 21st century under climate change. Hydrobiologia 803 1-12.
Fernández‐Martínez, M., Vicca, S., Janssens, I. A., Sardans, J., Luyssaert, S., Campioli, M., Chapin, F. S. III, Ciais, P., Malhi, Y., Obersteiner, M., Papale, D., Piao, S. L., Reichstein, M., Rodà, F., & Peñuelas, J. (2014). Nutrient availability as the key regulator of global forest carbon balance. Nature Climate Change, 4(6), 471–476. https://doi.org/10.1038/nclimate2177
Field, C. H., &Mooney, H. A. (1986). Photosynthesis‐nitrogen relationship in wild plants. In T. J. Givnish (Ed.), Economy of plant form and function (pp. 25– 55). Cambridge: Cambridge University Press.
Fisher JB, Huntzinger DN, Schwalm CR, Sitch S. 2014. Modeling the terrestrial biosphere.
Annu. Rev. Environ. Resour. 39: 91–123
Fleischer K., K.T. Rebel, M.K. Molen, J.W. Erisman, M.J. Wassen, E.E. Loon, L. Montagnani, C.M. Gough, M. Herbst, I.A. Janssens, D. Gianelle, A.J. Dolman. The contribution of nitrogen deposition to the photosynthetic capacity of forests. Global Biogeochem. Cycles, 27 (2013), pp. 187-199
Fleischer K, Dolman AJ, van der Molen MK, Rebel KT, Erisman JW, Wassen MJ, Pak B, Lu X, Rammig A, Wang YP (2019) Nitrogen deposition maintains a positive effect on terrestrial carbon sequestration in the 21st century despite growing phosphorus limitation at regional scales. Glob Biogeochem Cycles 33:810–824
Friess DA, K Rogers, CE Lovelock, KW Krauss, SE Hamilton, SY Lee, R Lucas, J Primavera, A
Rajkaran, S Shi (2019). The state of the worlds mangrove forests: Past, Present, and
Future. Annual Review of Environment and Resources 44: 89-115.
Ghimire B, Riley WJ, Koven CDet al. A global trait-based approach to estimate leaf nitrogen

92
functional allocation from observations. Ecol Appl2017; 27: 1421–34. 10.1002/eap.1542 Guannel, G., K. Arkema, P. Ruggiero & G. Verutes, 2016. The power of three: coral reefs,
seagrasses and mangroves protect coastal regions and increase their resilience. PLoS ONE 11: e0158094.
Hayes, M.A., Jesse, A., Tabet, B. et al. The contrasting effects of nutrient enrichment on growth, biomass allocation and decomposition of plant tissue in coastal wetlands. Plant Soil 416, 193–204 (2017). https://doi.org/10.1007/s11104-017-3206-0
Holtgrieve G.W., et al. A coherent signature of anthropogenic nitrogen deposition to remote watersheds of the Northern Hemisphere. Science, 334 (2011), pp. 1545-1548
Heskel MA, O'Sullivan OS, Reich PB et al. (2016) Convergence in the temperature response of
leaf respiration across biomes and plant functional types. Proceedings of the National
Academy of Sciences of the United States of America, 113, 3832– 3837.
Hikosaka K, Shigeno A. 2009. The role of Rubisco and cell walls in the interspecific variation in
photosynthetic capacity. Oecologia160, 443–451.
Howard J, A. Sutton-Grier, D. Herr, J. Kleypas, E. Landis, E. Mcleod, et al. Clarifying the role
of coastal and marine systems in climate mitigation Front. Ecol. Environ., 15 (2017), pp.
42-50
IPCC, 2013: Climate Change 2013: The Physical Science Basis. Contribution of Working Group
I to the Fifth Assessment Report of the Intergovernmental Panel on Climate Change
[Stocker, T.F., D. Qin, G.-K. Plattner, M. Tignor, S.K. Allen, J. Boschung, A. Nauels, Y.
Xia, V. Bex and P.M. Midgley (eds.)]. Cambridge University Press, Cambridge, United
Kingdom and New York, NY, USA, 1535 pp, doi:10.1017/CBO9781107415324
Janssens, I., Luyssaert, S. Nitrogen's carbon bonus. Nature Geosci 2, 318–319 (2009). https://doi.org/10.1038/ngeo505 Johnson EG, MK Swenarton. 2016. Age, growth and population structure of invasive lionfish
(Pterois volitans/miles) in northeast Florida using a length-based, age-structured population model. Peer J 4:e2730 https://doi.org/10.7717/peerj.2730
Kattge J, Knorr W, Raddatz T, Wirth C (2009) Quantifying photosynthetic capacity and its relationship to leaf nitrogen content for global-scale terrestrial biosphere models. Global Change Biology 15: 976-991.
Kelleway J.J., K. Cavanaugh, K. Rogers, I.C. Feller, E. Ens, C. Doughty, N. Saintilan. Review of the ecosystem service implications of mangrove encroachment into salt marshes Global Change Biol., 23 (2017), pp. 3967-3983
King AW, Gunderson CA, Post WM, Weston DJ, Wullschleger SD (2006) Plant respiration in a
warmer world. Science, 312, 536–537.
Kirk G. The biogeochemistry of submerged soils. Wiley, Chichester (2004)
Kruse J, Rennenberg H, Adams MA. 2011. Steps towards a mechanistic understanding of
respiratory temperature responses. New Phytologist 189: 659–677.
Kruse J, T Turnbull, H Rennenberg, MA Adams (2020). Plasticity of Leaf Respiratory and
Photosynthetic Traits in Eucalyptus grandis and E. regnans Grown Under Variable Light
and Nitrogen Availability. Front. For. Glob. Change
https://doi.org/10.3389/ffgc.2020.00005
Langley J, J Megonigal. Ecosystem response to elevated CO2 levels limited by nitrogen-induced
plant species shift. Nature, 466 (2010), pp. 96-99
Lawrence, D., Fisher, R., Koven, C., et al. (2019). The community Land model version 5:
Description of new features, benchmarking, and impact of forcing uncertainty. Journal of
Advances in Modeling Earth Systems. https://doi.org/10.1029/2018MS001583.

93
Lee, T. D., P. B. Reich, and P. V. Bolstad. 2005. Acclimation of leaf respiration to temperature is
rapid and related to specific leaf area, soluble sugars and leaf nitrogen across three
temperate deciduous tree species. Functional Ecology 19:640–647.
Liang, X., Zhang, T., Lu, X., Ellsworth, D. S., BassiriRad, H., You, C., … Ye, Q. (2020). Global response patterns of plant photosynthesis to nitrogen addition: A meta‐analysis. Global Change Biology, 26(6), 3585–3600. https://doi.org/10.1111/gcb.15071
Li W.B., H.X. Zhang, G.Z. Huang, R.X. Liu, H.J. Wu, C.Y. Zhao, N.G. McDowell Effects of nitrogen enrichment on tree carbon allocation: a global synthesis Global Ecol. Biogeogr., 29 (2019), pp. 573-589, 10.1111/geb.13042
Lombardozzi DL, GB Bonan, NG Smith, JS Dukes, RA Fisher. 2015. Temperature acclimation of photosynthesis and respiration; a key uncertainty in the carbon cycle-climate feedback. Geophysical research letters 42: 8624-8631.
Lovelock CE, Feller IC (2003) Photosynthetic performance and resource utilization of two mangrove species coexisting in hypersaline scrub forest. Oecologia 134: 455–462.
Lovelock CE, Ball MC, Feller IC, Engelbrecht BMJ, Ewe ML (2006) Plant function in nitrogen and phosphorus limited mangrove ecosystems. New Phytol 172: 514–522.
Lovelock C.E., Feller I.C., Ellis J., Schwarz A., Hancock N., Nichols P., Sorrell B.. Mangrove growth in New Zealand estuaries: the role of nutrient enrichment at sites with contrasting rates of sedimentation, Oecologia, 2007, vol. 153 (pg. 633-641)
Lovelock, C., Cahoon, D., Friess, D. et al. The vulnerability of Indo-Pacific mangrove forests to
sea-level rise. Nature 526, 559–563 (2015). https://doi.org/10.1038/nature15538
Lu W, J Xiao, F Liu, Y Zhang, C Liu, G Lin. (2017) Contrasting ecosystem CO2 fluxes of inland
and coastal wetlands: a meta-analysis of eddy covariance data. Global Change Biology
23(3) 1180-1198. https://doi.org/10.1111/gcb.13424
Lugo, A.E. & Snedaker, S.C. (1974) The ecology of mangroves. Annual Review of Ecology and
Systematics, 5, 39–64.
Macy A, MJ Osland, JA Cherry, J Cebrian (2021) Effects of chronic and acute stressors on
transplanted black mangrove (Avicennia germinans) seedlings along an eroding
Louisiana shoreline Restoration Ecology https://doi.org/10.1111/rec.13373 Mao Q, Xiankai Lu, Hui Mo, Per Gundersen, Jiangming Mo,
Effects of simulated N deposition on foliar nutrient status, N metabolism and
photosynthetic capacity of three dominant understory plant species in a mature tropical
forest, Science of The Total Environment, Volumes 610–611, 2018, Pages 555-562,
ISSN 0048-9697,
https://doi.org/10.1016/j.scitotenv.2017.08.087.
Martin, K.C., D. Bruhn, C.E. Lovelock, I.C. Feller, J.R. Evans and M.C. Ball. 2010. Nitrogen fertilization enhances water-use efficiency in a saline environment. Plant Cell Environ. 10.1111/ j.1365-3040.2009.02072.x.
McKee KL, JE Rooth. 2008. Where temperate meets tropical: multi-factorial effects of elevated CO2, nitrogen enrichment, and competition on a mangrove-salt marsh community. Global Change Biology 14(5) 971-984.
Mcleod, E., Chmura, G. L., Bouillon, S., Salm, R., Björk, M., Duarte, C. M., Lovelock, C.
E., Schlesinger, W. H., & Silliman, B. R. (2011). A blueprint for blue carbon: Toward an
improved understanding of the role of vegetated coastal habitats in sequestering
CO2. Frontiers in Ecology and the Environment, 9(10), 552-560.
https://doi.org/10.1890/110004

94
Meybeck M. 2003. Global analysis of river systems: from Earth system controls to Anthropocene syndromes. Phil. Trans. R. Soc. Lond. B 358:1935–1955 http://doi.org/10.1098/rstb.2003.1379
Morris, J.T., P.V. Sundareshwar, C.T. Nietch, B. Kjerfve, and D.R. Cahoon. 2002. Responses of coastal wetlands to rising sea level. Ecology 83 (10): 2869–2877.
Morris, J.T., D.C. Barber, J.C. Callaway, R. Chambers, S.C. Hagen, C.S. Hopkinson, B.J. Johnson, P. Megonigal, S.C. Neubauer, T. Troxler, and C. Wigand. 2016. Contributions of organic and inorganic matter to sediment volume and accretion in tidal wetlands at steady state. Earth’s Future 4 (4): 110–121.
Mozdzer TJ, EB Watson, WH Orem, CM Swarzenski. Unraveling the Gordian knot: eight
testable hypotheses on the effects of nutrient enrichment on tidal wetland sustainability
Sci. Total Environ. (2020), 10.1016/j.scitotenv.2020.140420
Mumby PJ, AJ Edwards, JE Arias-Gonzalez, KC Lindeman, PG Blackwell, A Gall, MI Gorczynska, AR Harborne, CL Pescod, H Renken, CCC Wabnitz, G Llewellyn. Mangroves enhance the biomass of coral reef fish communities in the Caribbean. 2004. Nature 427(6974) 533-536.
Naidoo G (2009) Differential effects of nitrogen and phosphorus enrichment on growth of dwarf Avicennia marina mangroves. Aqua Bot 90: 184–190.
Nijs, I., Behaeghe, T., &Impens, I. (1995). Leaf nitrogen content as a predictor of photosynthetic capacity in ambient and global change conditions. Journal of Biogeography, 22(2/3), 177– 183. https://doi.org/10.2307/2845908
NOAA (National Oceanic and Atmospheric Administration) Sea level trends (2017) https://tidesandcurrents.noaa.gov/sltrends/sltrends_global_station.htm?stnid=610032
O'Leary, B. M., Asao, S., Millar, A. H., & Atkin, O. K. (2019). Core principles which explain
variation in respiration across biological scales. New Phytologist, 222(2), 670– 686.
Onoda Y, Wright IJ, Evans JR, Hikosaka K, Kitajima K, Niinemets Ü, Poorter H, Tosens T, Westoby M. 2017. Physiological and structural tradeoffs underlying the leaf economics spectrum. New Phytologist214, 1447–1463.
Osland, M. J., N. Enwright, R. H. Day & T. W. Doyle, 2013. Winter climate change and coastal wetland foundation species: salt marshes vs. mangrove forests in the southeastern United States. Global Change Biology 19: 1482–1494.
Osland MJ, CA Gabler, JB Grace, RH Day, ML McCoy, JL McLeod, AS From, NM Enwright, LC Feher, CL Stagg, SB Hartley. 2018. Climate and plant controls on soil organic matter in coastal wetlands. Global Change Biology 24(11) 5361-5379.
Ostertag R and DiManno NM (2016) Detecting Terrestrial Nutrient Limitation: A Global Meta-Analysis of Foliar Nutrient Concentrations after Fertilization. Front. Earth Sci. 4:23. doi: 10.3389/feart.2016.00023
O’Sullivan, O. S. et al. Thermal limits of leaf metabolism across biomes. Glob. Chang. Biol. 23,
209–223 (2017).
Ow LF, Griffin KL, Whitehead D, Walcroft AS, Turnbull MH (2008a) Thermal acclimation of
leaf respiration but not photosynthesis in Populus deltoides × nigra. New Phytol
178:123–134
Ow LF, Whitehead D, Walcroft AS, Turnbull MH (2008b) Thermal acclimation of respiration
but not photosynthesis in Pinus radiata. Funct Plant Biol 35:448–461
Ow LF, Whitehead D, Walcroft AS, Turnbull MH (2010) Seasonal variation in foliar carbon

95
exchange in Pinus radiata and Populus deltoides: respiration acclimates fully to changes
in temperature but photosynthesis does not. Glob Change Biol 16:288–302.
Perry, C.L., Mendelssohn, I.A. Ecosystem effects of expanding populations of Avicennia germinans in a Louisiana salt marsh. Wetlands 29, 396–406 (2009). https://doi.org/10.1672/08-100.1
Piao SL, S. Sitch, P. Ciais, P. Friedlingstein, P. Peylin, X.H. Wang, A. Ahlstrom, A. Anav,
J.G Canadell, N. Cong, C. Huntingford, M. Jung, S. Levis, P.E. Levy, J.S. Li, X. Lin,
M.R. Lomas, M. Lu, Y.Q. Luo, Y.C. Ma, R.B. Myneni, B. Poulter, Z.Z. Sun, T. Wang,
N. Viovy, S. Zaehle, N. Zeng. Evaluation of terrestrial carbon cycle models for their
response to climate variability and to CO2 trends. Glob Change Biol, 19 (2013), pp.
2117-2132
Reef R, Ilka C. Feller, Catherine E. Lovelock, Nutrition of mangroves, Tree Physiology, Volume 30, Issue 9, September 2010, Pages 1148-1160, https://doi.org/10.1093/treephys/tpq048
Reich, P. B., Walters, M. B. & Ellsworth, D. S. Leaf life-span in relation to leaf, plant, and stand characteristics among diverse ecosystems. Ecol. Monogr. 62, 365–392 (1992)
Reich, P. B. et al. Relationships of leaf dark respiration to leaf nitrogen, specific leaf area and leaf life-span—a test across biomes and functional groups. Oecologia 114, 471–482 (1998)
Reich PB, M.G. Tjoelker, K.S. Pregitzer, I.J. Wright, J. Oleksyn, J.L. Machado Scaling
of respiration to nitrogen in leaves, stems and roots of higher land plants. Ecol. Lett., 11
(2008), pp. 793-801
Reich, P. B., Sendall, K. M., Stefanski, A., Wei, X., Rich, R. L., & Montgomery, R.
A. (2016). Boreal and temperate trees show strong acclimation of respiration to
warming. Nature, 531, 633– 636. https://doi.org/10.1038/nature17142
Saintilan N, Rogers K, McKee KL. 2019. The shifting saltmarsh–mangrove ecotone in Australasia and the Americas. In: Perillo GME, Wolanski E, Cahoon DR, Hopkinson CS, Eds. Coastal wetlands. Amsterdam: Elsevier. p 915–45.
Schleppi P, Bucher-Wallin I, Hagedorn F, Körner C (2012) Increased nitrate availability in the soil of a mixed mature temperate forest subjected to elevated CO2 concentration (canopy FACE). Glob Chang Biol 18:757–768
Schuerch, M., Spencer, T., Temmerman, S. et al. Future response of global coastal wetlands to sea-level rise. Nature 561, 231–234 (2018). https://doi.org/10.1038/s41586-018-0476-5
Simpson L.T., I.C. Feller, and S.K. Chapman. 2013. Effects of competition and nutrient enrichment on avicennia germinans in the salt marsh-mangrove ecotone. Aquatic Botany 104: 55–59.
Slot, M. & Kitajima, K. General patterns of acclimation of leaf respiration to
warmer temperatures across biomes and plant types. Oecologia 177, 885–900 (2015)
Smith N.G., J.S. Dukes. Plant respiration and photosynthesis in global-scale models:
incorporating acclimation to temperature and CO2. Glob. Change Biol., 19 (2013), pp.
45-63
Smith, N., Malyshev, S., Shevliakova, E. et al. Foliar temperature acclimation reduces simulated
carbon sensitivity to climate. Nature Clim Change 6, 407–411 (2016).
https://doi.org/10.1038/nclimate2878
Smith NG, Dukes JS. 2017. Short‐term acclimation to warmer temperatures accelerates leaf

96
carbon exchange processes across plant types. Global Change Biology 23: 4840–4853.
Smith NG, Risa McNellis, Jeffrey S Dukes, No acclimation: instantaneous responses to
temperature maintain homeostatic photosynthetic rates under experimental warming
across a precipitation gradient in Ulmus americana, AoB PLANTS, Volume 12, Issue 4,
August 2020, plaa027, https://doi.org/10.1093/aobpla/plaa027
Sperry JS, MD Venturas, HN Todd, AT Trugman, WRL Anderegg, Y Wang, X Tai. 2019. The impact of rising CO2 and acclimation on response of US forests to global warming. PNAS 115(51) 25734-25744.
Stevens, C. J. Nitrogen in the environment. Science 363, 578–580 (2019)
Sun B, L Yan, M Jiang, X Li, G Han, J Xia. 2020. Reduced magnitude and shifted seasonality of CO2 sink by experimental warming in a coastal wetland. Ecology not yet listed
Suzuki S, H Nakamoto, MSB Ku, GE Edwards (1987) Influence of Leaf Age on Photosynthesis,
Enzyme Activity, and Metabolite Levels in Wheat. Plant Physiology 84 (4) 1244-1248;
DOI: 10.1104/pp.84.4.1244
Tjoelker M.G., J. Oleksyn, P.B. Reich Acclimation of respiration to temperature and CO2 in
seedlings of boreal tree species in relation to plant size and relative growth rate
Global Change Biol., 5 (1999), pp. 679-691, 10.1046/j.1365-2486.1999.00257.xC
Tjoelker MG, Oleksyn J, Reich PB (2001) Modelling respiration of vegetation: evidence for a
general temperature-dependent Q10. Global Change Biology 7, 223–230.
doi:10.1046/j.1365-2486.2001.00397.x
Tjoelker MG, Oleksyn J, Reich PB, Zytkowiak R. 2008. Coupling of respiration, nitrogen, and
Sugars underlies convergent temperature acclimation in Pinus banksiana across
wide‐ranging sites and populations. Global Change Biology 14: 782– 797.
Tjoelker MG, Oleksyn J, Lorenc‐Plucinska G, Reich P. 2009. Acclimation of respiratory
temperature responses in northern and southern populations of Pinus banksiana. New
Phytologist 181: 218–229.
Valiela I, JL Bowen, JK York, Mangrove Forests: One of the World's Threatened Major Tropical Environments: At least 35% of the area of mangrove forests has been lost in the past two decades, losses that exceed those for tropical rain forests and coral reefs, two other well-known threatened environments, BioScience, Volume 51, Issue 10, October 2001, Pages 807–815, https://doi.org/10.1641/0006-3568(2001)051[0807:MFOOTW]2.0.CO;2
Vovides Alejandra G et al (2014) Morphological plasticity in mangrove trees: salinity-related
changes in the allometry of Avicennia germinans. Trees 28(5):1413–1425
Wang, H., Atkin, O. K., Keenan, T. F., Smith, N. G., Wright, I. J., Bloomfield, K. J., … Prentice,
I. C. (2020). Acclimation of leaf respiration consistent with optimal photosynthetic
capacity. Global Change Biology, 26(4), 2573–2583.
Ward ND, Megonigal JP, Bond-Lamberty B, Bailey VL, Butman D, Canuel EA, Diefenderfer H, Ganju NK, Goni MA, Graham EB, Hopkinson CS, Khangaonkar T, Langley JA, McDowell NG, Myers-Pigg AN, Neumann RB, Osburn CL, Price RM, Rowland J, Sengupta A, Simard M, Thornton PE, Tzortziou M, Vargas R, Weisenhorn PB, Windham-Myers L (2020) Representing the function and sensitivity of coastal interfaces in earth system models. Nature Communications 11: 2458 https://doi.org/10.1038/s41467-020-16236-2
Whitehead D, MM Barbour, KL Griffin, MH Turnbull, DT Tissue, Effects of leaf age and tree
97
size on stomatal and mesophyll limitations to photosynthesis in mountain beech (Nothofagus solandrii var. cliffortiodes), Tree Physiology, Volume 31, Issue 9, September 2011, Pages 985–996, https://doi.org/10.1093/treephys/tpr021
Więski, K., Guo, H., Craft, C.B. et al. Ecosystem Functions of Tidal Fresh, Brackish, and Salt Marshes on the Georgia Coast. Estuaries and Coasts 33, 161–169 (2010). https://doi.org/10.1007/s12237-009-9230-4
Wright, I. J., Reich, P. B., Westoby, M., Ackerly, D. D., Baruch, Z., Bongers, F., … Villar, R.
(2004). The worldwide leaf economics spectrum. Nature, 428, 821– 827.
Yamori, W., Hikosaka, K. & Way, D.A. Temperature response of photosynthesis in C3, C4, and
CAM plants: temperature acclimation and temperature adaptation. Photosynth
Res 119, 101–117 (2014). https://doi.org/10.1007/s11120-013-9874-6
Zaehle, S. (2013), Terrestrial nitrogen‐carbon cycle interactions at the global scale, Philos. Trans. R. Soc., B, 368, 20130125, doi:10.1098/rstb.2013.0125.
Zhang, Y., G. Huang, W. Wang, W, L. Chen. and G. Lin. 2012. Interactions between mangroves
and 595 exotic Spartina in an anthropogenically disturbed estuary in southern China.
Ecology 93:588-596 597.
Zhu L, Bloomfield KJ, Asao S, Tjoelker MG, Egerton JJG, Hayes L, Weerasinghe LK, Creek
D, Griffin KL, Hurry V et al. 2021. Acclimation of leaf respiration temperature responses
across thermally contrasting biomes. New Phytologist 229: 1312– 1325.
Zomlefer, W., Giannasi, D., Judd, W., Kruse, L., Bettinger, K. (2004). A floristic survey of Fort Matanzas national monument, St. Johns county, florida. SIDA, Contributions to Botany, 21(2), 1081-1106. Retrieved January 3, 2021, from http://www.jstor.org/stable/41968359