plants preparation of acidulated...
TRANSCRIPT
Plants
Seeds of green gram (VIP radioto (L.) Wilaek cv. ADT-1, CO-5 and Vamban) and
black gram (V~gna mungo (L.) Eepper cv. CO-5 and T-9) were chosen for the study. They
were procured from Pondicheny Agro Service Industries Corporation (PASIC) and Knshi
Vigym Kendra, Pondicheny. Viable seeds of uniform colour, sine and weight were selected
for the experiments.
Preparation of acidulated water
At present, simulated acidic rainfalls (SAR) are most Frequently characterised by acid-
ity or pH In most experiments, &SO, and HNO, are used to provide the majority of the acid
rain component in simulated rainfalls (Evans, 1984a). in the ratio of sulphate to nitrate, be-
tween 3 1 and 1 3 on an equivalent basis Since Pondicheny is a coastal town where the
air would be normally laden with chloride ions also, HCI was added to the other two acids
normally used, following Kobno and Kobayashi (1989s)
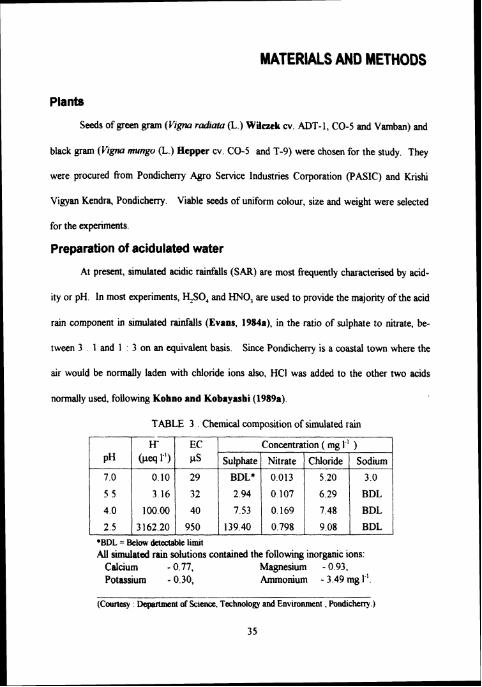
TABLE 3 . Chemical composition of simulated rain
/ 5 5 1 3 16 / 32 1 2 94 1 0 107 1 6.29 / BDL /
P r ) t: 0 I0 1 29
/ 4.0 1 1 0 0 0 0 / 40 1 753 / 0169 1 748 / BDL 1
Concentration ( mg I-' )
sulphate 1 Nitrate 1 Chloride 1 Sodium - BDL* 1 0.013 1 5 20 / 3.0
(COU~W Department of Science. Technology and Environment. Pon&chew.)
2 5 *BDL = &low detectable Limit All simulated rain solutions contained the following inorganic ions:
Calcium - 0 77, Magnesium - 0.93, Potassium - 0.30, Ammonium - 3.49 mg l"
3162 20 950 139 40 0 798 9.08 BDL

Double distilled water was adjusted to dEerent pH levels viz. 5.5, 4.0 and 2.5 using a
diluted mixture of &SO,, HNO, and HCI (4: 2 . 1 , v/v) in the molar ratios of 6 . 3 1 The
distilled water had a pH of 6.5 - 6.8 and was adjusted to pH 7.0 by ad@ one or two
drops of 0. IN NaOH and served as control. The other characteristics of simulated rain are
presented in Table 3.
Rain generating system
The acidic rain was applied through a rain-generating unit modelled after Kohno and
Kobayuhi (19%9a). It consisted of a reservoir, a compressor and a set of nozzle sprayers
(pore s i i 0.35 rnm) The acidulated water was served 60m a glass container and showered
on the foliage from one metre above the ground level. The whole system was operated elec-
trically The potted plants were arranged on a platform and rotated on a turn table basis to
ensure uniform leaf wetting SAR was applied at the prefixed timing around 9.30 AM. to
avoid excess heat and in-. Each rain event lasted for 6 min at an effective flow rate of
7 8 mm h ' as measured by a rain-gauge The rain drop size ranged from 0 35 to 1.35 mm.
Depending upon the design of the experiments, the total number of showers varied from 10 to
20 About 200 ml of acidulated water was used in each shower. Showers were applied to
the top of the plant and no efforts were made to prevent the 'run off to soil (Kohno and
Kobayrshi, 19898)
Pot Culture
The experin~ents were performed under condrtions which closely approximate field en-
vironment under rain-fed conditions. Plants were grown in earthenware pots (25 x 25 cm)
filled with a mixture of sand, red soil and farmyard manure (2 1 1 vk). Ten healthy seeds
were sown at equidistant places at a depth of 2 cm in each pot. The pots were arranged ran-
domly and treatments were replicated sufficiently to avoid possible experimental errors Plants
grown in earthen pots (3 to 4 per pot) were maintained under natural green house conditions
(day-temperature, maximum 38" C; minimum night-temperature 18" C; relative humidity
60 i 5 %; maximum irradiance (PAR) 1,400 pmol m.' s.'; photo period 12 - 14 h) The
sides were open allowing free air circulation but the covered roof excluded natural precipiia-
tions As the SAR-showers contributed only a portion of normal rainfall, plants were inigated
with tap water to maintain soil moisture levels adequately. To check seasonal influences, the
experiments were repeated in July-September and December-March rain-fed seasons.
For studies on nitrogen metabolism, tenday-old seedhgs in each pot were inoculated
with 200 mg of the commercial preparation of Kh~zoblurn inowlurn Pepartment of Agncul-
ture. Government of Pondicherry) suspended in 10 ml of water poured on the surface of the
soil as suggested by Shrioer rod Johnston (1981)
SAR applications
Two types of short-term experiments were planned In the fist set of short-term ex-
periments, all the five cultivars of two grain legumes were screened for their relative sensitivi-
ties in terms of growth and cell metabolite pools. Tenday-old seedlings with the primary
leaves (PL) fully expanded were exposed to SAR of 6 min duration each for 10 days Bio-
chemical analyses were restricted to the primary leaves.
In the second series of short-term experiments, studies on photosynthesis, nitrogen me-
tabolism and surface perturbations were carried out and restricted to two green p m cultivars,
ADT-I and CO-5 only Fifteendayald plants with PL and the emergmg first trifoliate leaf

(TFI) were exposed to SAR of 6 min duration each for 10 days. The rain events were ex-
tended to another 10 days to monitor the progression of injury and sensitivities of leaves de-
veloping subsequently.
For monitoring the long-term effects of acidic precipitation on yield characteristics, the
same two green gram cultivars ADT-1 and CO-5 were used To study the effect of consecu-
tive and episodic nature of rain events and to assess the sensitivity of the developmental stage
to SAIL the consecutive showers were applied during early vegetative growth phase and flow-
ering stages, respectively, as detailed below
Expt.1 Plants (2-leaf stage) were exposed to SAR showers daily for I5 consecutive
days - each of 6 min duration starting from 15 DAS.
Expt.11 Plants received showers of same intensity and duration (6 min) but only twice
a week (Tuesday 1 Friday) for seven weeks starting from 15 DAS. This treatment commenced
on young plants (two-leaf stage) and continued through the flowering stage.
ExptlIl. Plants (5 leaf-stage) were exposed to SAR (6 min each) w i n g from the
firs1 sign of flowering, 35 DAS for cultivar CO-5 and 30 DAS for ADT-1 and continued for
15 days wnsecutively through the flowering stage.
The three treatment groups coincided with &g, Me f e e and flowering periods of
the plant respectively. Though the timings of SAR dsered, all the plants received the same
amount of ramfill.
Assessment of growth
Ten plants per treatment were uprooted at the specified stage and the growth parame-
ters viz, root and shoot length and the plant height were measured. The plant parts were
weighed in Anamed Digital balance for fresh weight They were then dried in an oven at
80°C for 48 h and weighed again for dry mass measurements
Flowering index
The plants were tagged, numbered serially and checked periodically for flower buds.
Beginning from the date on which the first plant was in flowers, flowering was assessed on
eveq 5th day by recordmg the number of plants per treatment beanng flowers as well as the
number of flowers I hu ts in each plant From the data obtained, the date on which 50% of
the plants had flowers was extrapolated &o.m them. Alongside the flowering vigour indices
were also calculated using the following formula. No d A a e n m m c n y . - N o &8a*srrnpmarrslngc
Flowering vigour index = No o r h r n p m a u s t 4 $ ? x loo
Fruit harvest
Mature fnrits were harvested pendically from each plant and the harvests were ter-
minated by 75 DAS for green gram cultivar ADT-1 and 90 DAS for the other cultivar CO-5.
Length, and fresh weight of the h t s , and number of seeds per pod were noted immediately,
and the dry weight of seeds measured after 48 h at 80°C.
Harvest Index (HA)
Harvest index was calculated using the following formula as suggested by Mohm
et rl. (1992)
Y d ( m g ) loo Harvest index =

Biochemical analysis
Biochemical changes were observed in the primary or first trifoliate leaves.
Estimation of photosynthetic pigments
Chlorophyll (Chl)
ChlorophyU pigmems were estimated foUowing the non-destructive method of Shod
rod Lium (1976),. This method was followed as it gave accurate results and can be done
with ease than the conventional Araon's method
Fresh leaf discs (25 mg) were cut and placed in a tube containing 10 ml of D i h y l
sulphoxide (DMSO) and the pigmerds were extracted into the h ~ d without gri- by incu-
batmg in dark at 65Yor 1 hr as standardised previously. The complete extraction of chloro-
phyll in DMSO was visualised when the leaf tissues were free from the green pigments.
The absorbance was measured at 645 and 663 nrn in a spectrophotometer with DMSO
as blank The pigments were quantified using the following fonnula:
(11 7 x h ) - ( 2 . 6 9 ~ A,) chlorophyll a (ma g ' fw) = ,, , , , , x V x df
where A= absorbance, w = fie& weight of the sample in mg, V = volume of the sam-
ple, df = dilution faaor (if any).
The amounf of total chlorophyll was calculated by adding the contents of Chl a and b
Carotenoids (Ikan, 1969)
Absorbance values of pigments at 480, 645, and 663 were used to find the corrected
optical density (OD) for carotenoids which was used for quantification.
Corrected OD = A, + [ (0.114 x &) - (0.638 x b*)] Carotcnoid (mg g.') = corrected OD x x 5 where A = Absorbance, V = Volume of DMSO taken for extraction (ml), W = Fresh
weight of the sample in mg.
Estimation of soluble proteins (Lowry et al., 1951)
m c t l o n
Fresh leaf material (300 mg) was macerated in a pre-chilled mortar and pestle with 10
ml of 20?/0 TCA The homogenate was centrifuged for 15 min at 600 rpm. The supematant
was discarded To the pellet was added 5 ml of 0 . lN NaOH, stirred well and d f u g e d
again for 15 min. The supematant was saved (protein fraction) and used for the estimation of
total proteins.
Estimation
Five ml of reagent 'c' was added to 0.5 ml of protein extract and was allowed to stand
for 10 min in dark. Theq 0.5 ml of Folin-Ciocalteau reagent was added to thls solution and
again kept in dark for 30 min. The absorbance was read at 660 nm in a spectrophotometer
Preparation of reagents
1 Alkaline Sodium carbonate (Reagent A): Two grams of sodium carbonate were dis-
solved in 0. IN NaOH and made up to 100 ml.
2. Copper sulphate and potassium tnrtarate (Reagent B): Copper sulphate (1%) was
mixed with equal volume of 2% sodium potassium tartarate solution freshly
prepared.
3 Reagent C: 50 ml of reagent A was mixed with 1 ml of reagent B.
4. Folin-Ciocalteau Reagent: Commercial Folin-Ciocalteau was diluted with @ass dis-
t i ed water (1 : 2, vlv)
The protein content was calculated with reference to the standard curve for Bovine Se-
rum Albumin.
Preparation of Alcohol Extract for biochemScal estimations
Oven-dned leaves were powdered in a mortar and pestle. Fifty mg of the dried pow-
der was boiled in a water bath with 10 ml of 80% ethyl alcohol. M e r coohg, the homogen-
ate was centrifuged at 600 rpm for 15 min. The supernatant was saved and made up to 20 ml
with 80% ethyl alcohol. Ttus extract was used for quantitative estimation of reducing sugar,
total sugar, onho-dihydric (0.D) phenol and total phenol. The residue was saved for starch
estimation.
Estimation of reducing sugars
The reducing sugars were estimated by the Nelson's modification of Somogyi's method
(Nelson, 1944). To 1 ml of ethnolic extract, 1 ml of fresh copper reagent prepared by mixkg
copper tartarate and copper sulphate solution (25 . 1 vlv) was added. The mixture was heated
in a boding water-bath for 20min and cooled One ml of arsenomolybdate reagent was added
and the contents incubated for 1 5 min. The solution was then dduted to 25 ml with distilled

water and the colour intensity was read at 500 nm in a spectrophotometer. The content of the
reducing sugar was calculated using the standard graph for glucose.
PreparaUon of reagents
1. Copper tartarate solution (A) Twenty five g of anhydrous sodium &lute, 25 g
of sodium potassium tartarate, 20 g of sodium bicarbonate, 200 g of anhydrous so-
dium sulphate were dissolved in 800 ml of distilled water, diluted to l L, filtered and
stored in a brown bottle.
2 Copper sulphate solution (B) : Fifteen g of copper sulphate was added to 100 ml of
distilled water One or two drops of conc. %SO, was added to this reagent B.
3. Copper reagent Twenty five ml of reagent A and 1 ml of reagent B were mixed.
4. Ammolybdate reagent: In 450 ml of distilled water 25 g of ammonium molyb-
date was dissohed To this 21 ml of conc. &SO, was also added. Three grams of
sodium arsenate dissolved in 25 ml of distilled water was also added to the above
mixture. Th~s was incubated at 3P C for 48 h. The reagent was stored in a glass
stoppered brown bottle.
Estimation of tatal sugar (Dubois et al., 1956)
To 1 ml of ethnolic extract, 4 ml of cold anthrone reagent was added This was shaken
vigorously and boilal for 10 min in a bow water bath. Mer coohg in nmning tap water,
the absorbance was read at 620 nm in a spectrophotometer. A standard curve was prepared
with known amounts of glucose to estimate the contents.

Anthrone reagent
To 40 ml of distilled water 100 ml of concentrated sulphric acid was added. To 100
ml of the above mixture 200 mg of anthrone was added and mixed thoroughly until a golden
yellow wlour appeared.
Estimation of non-reducing sugars
The amount of non-rcduchg sugars was determined by the following formula sug-
gested by h m b and Sboll(1937).
Non reducing sugars = Total sugars - Free reducing sugars x 0.95.
Estimation of starch (Mc Cready et al., 1950)
The residue I& behiod after alcoholic extraction of the leaf materials was dissolved in
5 ml of 52% perchloric acid for one h. The +re was filtered through Whatman's filter pa-
per (No. 42) and the filtrate was made up to 100 ml Mth distilled water. To 1 ml of the above
extract, 4 ml of distilled water and 10 ml of freshly prepared cold anthrone reagent were added
carefully along the sides of the tube. The contems of the tubes were shaken vigorously and
heated in s bow watw-bath for 7.5 min. The tubes were then cooled immediately in running
tap water and shaken well before readmg the c o l w intensity at 630 nm in a spectrophotome-
ter. The starch content was calculated with reference to glucose standard and multi-
plied by 0.9.
Preparation of reagents
1. Anthrone nrgeot : Amhrone (200 mg) was dissolved in 100 ml of cold 95%
Y so,. 2. Perchlotic acid : To 18 ml of distilled water, 52 ml of commerdal perchloric acid
(70%) was added to get 52% perchloric acid.
Estimation of 0.0. Phenols (Johnson and Shoal, 1952)
To 1 ml of alcoholic extract, 1 ml of 0.5N HCI and 1 ml of Arnow's reagent were
added To this, 2 ml of NaOH and 10 ml of distilled water were added. A pink colour ap-
peared immediately on adding NaOH. The colour intensity was reduced by diluting it to 25 ml
with distilled water and the absorbance read at 515 nm. The O.D. phenols were calculated us-
ing a standilii d curve with catechol.
Preparation of reagent
Arnow's reagent: Ten g of sodium nitrite and 10 g of sodium molybdate were mixed in 100
ml of distilled water The reagent was stored in a brown bottle.
Estimation of total phenols (Bray and Thorpe, 1954)
To 1 ml of alcoholic extract, 1 ml of Folm-Ciocalteau reagent and 2nd of 20% sodium
carbonate were added and shaken weU. The mixture was heated in a boiling water bath for
1 min and cooled under running tap water The blue solution was diluted to 25 ml with dis-
tilled water and read at 650 nm in a spectrophotometer. Phenols were quantified using
catechol as standard.
Preparation of reagents
1 . 20% sodium cubonate . Twenty g of sodium carbonate was mixed with 100 ml of
distilled water
2. Folin-Ciocalteau reagent Commercial Fol'm-Ciocalteau was diluted with distilled
water in l 2 ratio.
Measurement of gas exchange in photosynthesis
Photosynthetic CO, uptake and stornatal resistance were monitored using a LI 6200
portable infia-red gas analyser (Li-Cor Inc., USA) with a 1 litre leaf chamber. Ten r d n g s
were taken for each sample at 5 s intervals
Measurement of chlorophyll fluorescence
In vrw, Chl a florescence induction was followed in intact leaves after excitation with
the broad-band blue radiation (100 W m-', 400-460 nm, Coming 5113) as described by
Kuhdaivdu .od Daniel1 (1980) The photon fhix density was 700pE m-' s" Leaves were
dark incubated at 28' C for 10 min before fluorescence measurements. The photomultiptier
(Hamarnatzu R 375) placed at 90' to the excitation beam was protected by an interference
filter (A max 690 nm. balf band width 12 nm Sehott, Germany ). A leaf bit was placed in
the black placiglsss frame and placed dragonally in a standard 4 ml glass cuvette. Photophom
slide projector was used to produce the excitation lighl. An electromagnetic shutter with
short openu~g time (rns) was used to control the excitation beam. The signal from the pho-
tomultiplier was directly displayed on a Hitachi recorder Model 056) or stored in a digital os-
cilloscope (Iwatzu modd SS- 5802)
Measurement of Electroo transport activities
Whole chain dsctron tranrpmc (H,O-rMV) (Armond et d., 1978))
The rme of whole c b n electron transport (KO+MV) in the isolated chloroplasts
(mesophyll 4 s ) was measured as 0: uptake at 25' C using a &ncu~ttch oxygen electrode
(Hamrtscb, U.K). White actinic light (900 pE. m' s ') from a slide projector was passed
through a 10 cm water balh before ill- the sample The reaction mixture in a total
volume of 1.0 ml contained 20 rnM phosphate (pH 7.5). 5 mM Mgc4, lOmM Nacl, 100 mM
sucrose, 0.1 m M NaN,, 5 m M NH,CI and mesophyll cells equivalent to 20 pg chlorophyll.
PSI1 and PSI Electron Transport (Noorudben and Kulrndrivelu, 1982).
PSU dcctroa trursport (B,O + BQ)
PSI1 mediated 0, evolution was continuously monitored at 25" C in the presence of
BQ using the same electrode set up described above. The reaction mixture in a total volume of
1.0 ml wmgined 20 mM phosphate (pH 7.5), 5 mM MgCI,, 0.5 mM BQ, 100 mM sucrose and
chloroplasts (rnesophyll cells) equivalent to 20 pg chlorophyll.
PSI electron transport (DCPIPB, + MY)
PSI medmted electron transport fiom the attiticid electron donors ( D C P I P - h a t e )
was assayed polarographically as 0? uptake. The reaction mixture in a final volume of 1 0 ml
contained 20 mM phosphate (pH 7 S), 2 mM sodium ascorbate, 100 mM DCPIP. 5 fl
DCMU, 5mM NH,CI. 0.1 mM NaN,, 1 mM MV and chloroplasts (mesophyU cells) equivalent
to 10 pg chlorophyll The other conditions were similar to whole chain electron transport
experiment
Measurement of absorption spectra
Room temperature absorption spectra were recorded d i i y using a double beam
spectrophotometer (Hibehi, Model 557). Chloroplasts were suspended in a medium contain-
ing 20 mM Tris-HCI (pH 7 . 9 , 100 mM sucrose. 10 mh4 NaCI, 5 mM MgC1, and glycerol to a
final concentration of Wh, vlv Both the reference and sample cuvmes were placed in the
cuvetteholder with their ground surface facing the light beams, so as to scatter beams equally.
The spectra were norrnalised at 540 nm.
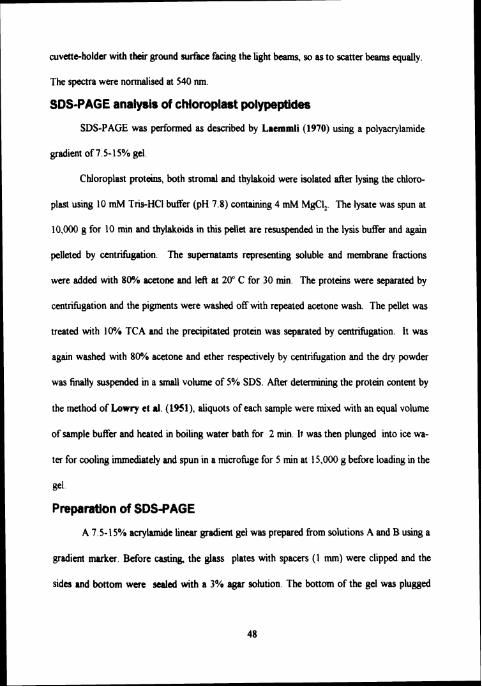
SDS-PAGE analysis of chloroplast polypeptides
SDS-PAGE was performed as described by Laemmli (1970) us'mg a polyacrylarnide
gradient of 7.5-1 5% gel
Chloroplast proteins, both stromal and thylakoid were isolated after lysing the chloro-
plast using 10 mM Tris-HCI buffer @H 7.8) containing 4 mM MgCl,. The lysate was spun at
10,000 g for 10 min and thylakoids in this pellet are resuspended in the lysis buffer and again
pelleted by centrifugation The supernatants representing soluble and membrane kactions
were added with 80?4 acetone and left at 20" C for 30 min. The proteins were separated by
centrifugation and the pigments were washed off with repeated acetone wash. The pellet was
treated with 10% TCA and the precipitated protein was separated by centrifugation. It was
again washed with 8% acetone and ether respectively by centrifugation and the dry powder
was finaHy suspended in a small volume of 5% SDS. After determining the protein content by
the method of Lowry et d. (1951), aliquots of each sample were mixed with an equal volume
of sample buffer and heated in boiling water bath for 2 min. It was then plunged into ice wa-
ter for cooling immediately and spun in a microfuge for 5 min at 15.000 g before loading in the
gel
Preparation of SDS-PAGE
A 7 5- 15% acrylamide linear gradient gel was prepared kom solutions A and B using a
gradient marker. Before casting, the glass plates with spacers (1 mm) were clipped and the
sides and bottom were sealed with a 3% agar solution. The bonom of the gel was plugged

with a solution containing 2 d of solution B, 20 yl of APS and 3 pl of TEMED The mixture
was slowly let into the chunber between the glass plates. A layer of i s o p r o p d was laid over
the gel solution slowly and the gels were allowed to polymerize for 30 min. The isopropanol
was washed off with water. The gel comb was then inserted leaving a gap of 1 cm above the
gel and then the stacking gel solution poured. Ma complete polymerisation in about 2 to 3 h
the bonom spacers and the comb were removed gently. The wells were washed with water
and the gds placed in a tank with running buffcr avoiding air bubbles.
The protein concentration of all samples were equalid and 300 pg of sample was
loaded in each slot The run was started at 60 mV and increased to 125 rnV subsequently and
was continued until the marker dye reached the bonom and the glass plates along with the gel
were removed, the gels were slowly slid into a glass tray, washed once with water and then
placed in the coomassie brilliant blue staining solution for 3 4 h The gels were tben
destained. Marker proteins of known molecular weight were also run concurrently and the
molecular weights of the polypeptide bands were then calculated from their Rf values.
heparation of reagents Solution A
(7 5% scrylamide) 40% anylamide solution 5.7 ml 1.5 M Tris-HCI pH 8.8 7.5 ml 10?4 SDS 0 6 m l
%* 14.0 ml looh APS 0.2 ml TEMED 10.0 ml
Solution B (1 5% anylmde)
11.4ml 7.5 ml 0.6 ml 6.3 ml 0.2 ml
10.0 ml
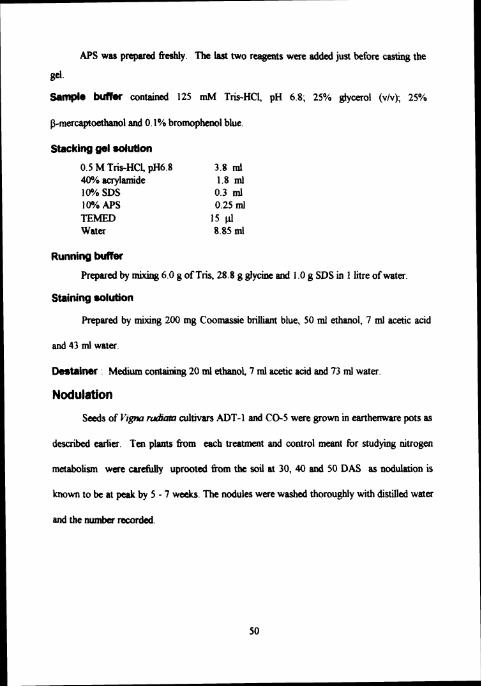
APS was prepared freshly. The last two reagents were added just before casting the
gel.
Sample buffer contained 125 mM Tris-HCI, pH 68; 25% glycerol (vlv); 25%
p-macaptoethanol and 0.1% bromophenol blue.
Stacking gel solution
0.5 M Tris-HCI, pH6.8 3.8 ml 40% acrylamide 1.8 ml I P/o SDS 0.3 ml 1 PA A P S 0.25 ml TEMED 15 Pl Wsta 8.85 ml
Running buffer
Prepared by mixing 6.0 g of Tris, 28.8 g &cine and 1.0 g SDS in 1 litre of water
Staining solution
Prepared by mixing 200 mg Coomassie bfiant blue, 50 ml ethanol, 7 ml acetic acid
and 43 ml water.
Dostainer Medium containing 20 mi -01 7 ml acetic acid and 73 mlwater
Nodulation
Seeds of Figno rudwm cultivars ADT-I and CO-5 were grown in earthenware pots as
described earlis Ten plants from each treatment and control meant for studying nitrogen
metabolism w s e cardilly uprooted from the soil at 30, 40 and 50 DAS as nodulation is
known to be at peak by 5 - 7 weeks. The nodules were washed thoroughly with distilled water
and the number recorded
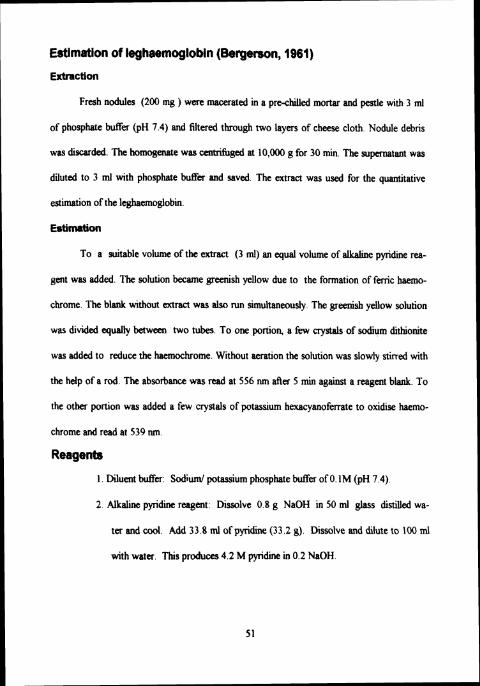
Estimation of leghaemoglobin (Bergerson, 1961)
Extrsction
Fresh nodules (200 mg ) were macerated in a pre-ctulled mortar and pestle with 3 ml
of phosphate buffer (pH 7.4) and filtered through two layers of cheese cloth Nodule debris
was discarded. The bomogenate was centdkged at 10,000 g for 30 min. The supernatant was
diluted to 3 ml with phosphate buffer and saved. The extract was used for the quantitative
estimation of the leghaemoglobin.
Estimation
To a suitable volume of the extract (3 ml) an equal volume of alkaline pyridine rea-
gent was added. The solution became greenish yellow h e to the formation of fenic haerno-
chrome. The blank without extract was also run simultaneously The greenish yellow solution
was divided equally between two tubes. To one portion, a few crystals of sodium ditbionite
was added to reduce the haemochrome. Without aeration the solution was slowly stirred with
the help of a rod. The absorbance was read at 556 nm after 5 rnin against a reagent blank. To
the other portion was added a few crystals of potassium hexacyanoferrate to oxidise haemo-
chrome and read at 539 nm.
Reagents
1 Diluem buffer Sodium/ potassium phosphate butfer of 0.1M @H 7.4)
2 Alkaline pyndine reagent. Dissolve 0.8 g NaOH in 50 ml glass distilled wa-
ter and d. Add 33 8 ml of pyridine (33 2 g). Dissolve and dilute to 100 nd
with water This produces 4.2 M p y i d ' i in 0.2 NaOH.
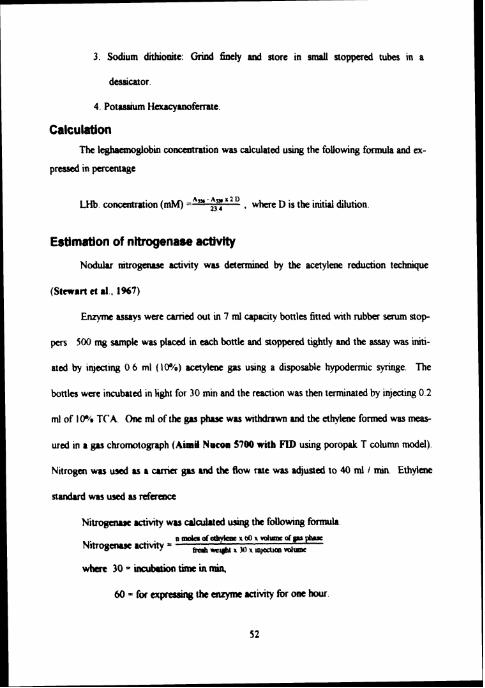
3. W u m dithionite: Grind finely and store in small stoppered tubes in a
dessicator
Calculation The leghacmoglobii concartration was calculated usmg the following formula and ex-
pr& in percmtage
A m - A m x 2 U LHb concatration (mM) =- , where D is the initial dilution
Estimation of nttrogenase activity
Nodular nitrogame activity was determined by the acetylene reduction techque
(Stmati et 11. 1967)
Enzyme assays were canied out in 7 ml capacity bonla fined with rubber serum stop
pen 500 rng sampk was plrced in each bottle and stoppered tightly and the assay was initi-
ated by tnjecting 0 6 ml (10%) acetylene gas using a d~sposable hypodermic synnge The
bonla were incubated in light for 30 min and the reaction was then terminated by injeaing 0 2
ml of 10% TCA One ml of the gas p k wu withdrawn and the ethylene formed was meas-
ured In r gu chromatograph (Airnil Nucoa 5700 witb W usiig poropak T column madel)
N ~ t r o w was uxd u a cartia gu ud the Row rue was adjusted to 40 ml 1 min Ethylare
standard was u d as daanx
Nitrogaure rwrty w u dculuad usiq the foUowng formula
whar 30-incukuiontimcinmin.
60 - for apfdq lhc auymc ~ c t ~ i t y for ont hwr

d h y k p e J ~ x ~ 'n' moles of ethylene = aritivi* x 2.59
where anmuation = 32 and sensitivity = 1000
Nitroge~sc Mivity was expressed as p moles of acetylene reduced h-' pg fw'
Estimation of nitrate reductase activity (NRA) - in vivo.
N i m e reductase activity was assayed by the method of Jawonki (1971) with slutable
modifications (Muthucbdun et d., 1992). Freshly harvested leaves were washed and cut
into 5 nun disks Leaf ks 1 noduia co-g to 100 mg eesh weight were incubated in
vials conwining 5 ml of incubetion medium prepared by mimg 0. IN KNO, ( 1 ml), 0 . 1 ~ phos-
phate buffn of pH 7 5 (3 75 ml), 0 01 ml of Triton x-100 (0.1%) and 1% propanol (0.25 ml).
Incubatmn was c d out in dark for one hour at room tnnpaature (28" C * 2" C) giving oc-
casiod shrlungs. Aliquots of 0.2 ml from the locubation mixture were analysed for nitrite af-
ier 60 mm To 0 2 'ml of inchtion mecLum. 1 8 ml of M e d water, 1 ml of 3%
Yulphanilumde tn 3N HCI nod I ml0f0.02~h N-(I-naphthyl) cthyl&amioe dhydrochloride
were W In quick succession This was incuked for 15 min in darkness for wlour dwel-
opmun md atn0kmc.t was read at 540 mn with nutabk blank in a Scbimatm spectropho-
tomam. Tbe amoum of nimie formal was aprrssed as 'n' moles of nitrite produced per min
mgihv~asobumoiui tcn .ndrrdarrve .
Estltlmrblon of nitmte and nibite (Woolley et al., 1960)
Abou~ 50 mg of Dhdcdricd powdered material was boiled for 10 min m 5 ml ofdis-
rtlkd w u u One ml rqueau artnct wu ddcd to 9 ml of 20% (vlv) acetic acid solution con-
tain~ o 2 ppn of Cum,. Ooc gun of 41 - as tbcdibed Nebon e d (19%) was
added to ach Iunpk Thc uh mixture wu mrde by mixing m g h l ~ the fiody ground
chemicals vrz. Barium sulphate 100 & Citric acid 75 g Uanganous sulphate 10 g, Sulphanilic
wid 4 g Zinc powder 2 g and I-Napthyl mine 2 g.
Blank without extract was also run simultaneously Tubes cataining the assay mix-
ture were shaken at last thnce at 3 min intervals and 6naUy centrifuged at 3000 rpm for 10
min Absorbance of the clear supematam was read at 520 nm agmst a reagent blank
The procedure was repated for another batch of samples omitting Zq MnSO, and
CuSO, The second run gave the quantity of nitrite alone present in the sample. The first
value minus the arcond p v c tbe quamrtg of nitrate present in the samples
The unaunts of nitrate and nitrite were cakulated from standard graphs for polassium
nitrate and d i m nitrite nspectlvely
Estinratlon of nrtrogen (JackMH1,1958)
Dried leaf sunple ( 100 mg) was placed in a 100 ml Kjeldahl £task and about 2M) mg of
the utrtyst mixture (potassium sllphrte, arpric sulphate and selenium dioxide mixed in the ra-
t ~ o of SO 10 I by w&) and 3 ml of c o w e d &SO, were added The sample was di-
gested for 2 h Whcn the solut~on becune colourlcss or pale yellow. 10 ml of distilled wata
was added to the digat, cooled and decanted into the micro-Kjcldahl distillation flask To
that. 10 mi of 40% NlOH wra dded and distilled The BmrnOniacal distillate was wUected in
a 25 mi corucal Ruk containing 10 ml of 4% boric acid and 3 drops of mixed indicator (0 3 g
brolnorraol gnen .nd 0.2 8 methyl red in 400 ml of 90.h ethanol) This solution was timed
a p i n g 0 OSN HCI Ni- foment ww estimUed using the foUowtng formula (yap* Om. bhd Otw) x HCl d l t ) X 14 \ 100
N i e n Ch) - *waght(&)~IW
Soll pH and EC
Soil samplea from the cultun pots were colleaed at the ad of the eocpenment and
dried in M oven at 60" C. Twenty gnms of dry soil was added to 50 ml of double-d~stilled
water, stirred and allowed to dand for 30 min. The dear mpmatant was decanted and used
for pH ud EC measunments in digital pH metn (Etico, India) and dilgtal conductivity bridge
(Elico, lodia), respactivdy
Anatomkal chancbrWk8
PhotognphY
L u f slrfrceo were viewed through Nikem -Lot dmo micrwcopc under inci-
dent ud uutducart I& and photographa] Leaf h s of 0.5 x 1 cm w e e cut from middle in-
t m d region oft& acpenmcnul sunpla. Thin b h d sstioos were prepared usmg a
sharp M& for obsantm unda the microscope SedoaPI views of developing lesions were
photographed in various s q p undP a Nikoo bbophot micrewope (Type Whole
plants were photogrrpbad in dryllgtd using a P a t u tamers
Epldennal cells
The size and numkr of epldarml cdls wae m t e d using a &$rated microscope.
Calibration was done unng r ougc d d a r micrometer
stomat81 frequency I index
StomrtrJ Gaquency was duamincd by umimg the laf uupmmotu on pokydymc
plastic fihn The p h x meburn ( I g of pdysymc in 100 ml of xylol) was applied on the leaf
uruformly la a thm layer Afla dryiag the h e 4 was carefully removed and obsaved uada
magmhma S t o d caurr wae mde Rndwdy on five sdccted regions on the adaxial
surface The hf unpmabs WYC Jso wed for SEM uulysls. &causc s t o d

Frequmcies wy ~ ~ ~ ~ r d i i g to cdl rite, W b u r y (1928) intduced the term ' stomatal index'
which relates the number of stomata per unit leaf area to the number of epidermal cells in the
same arm. Thus Stornatal index (S.1) = & x 100 . where S = number of stomata per
unit leaf area E = number of epidermal cdls per unit leaf area
wsophyll volume
Mesophyll th~d;ncss in mm was nhphcd by 1100 to calculate tbe mesophyu v o k in
cm' pa dm: of leaf ares (Prttmon d rl., 1978).
Scanning electron microscopy (SEM studies)
For o b e the ~njuria and wax pattans, the leaf bits were 6rst dehydrated in
graded Ma of ethanol These wae then coated wnh gold. using a Hit.&i AUSSGB vac-
u w c o u a and v i w d in a Hitacti S-450 scanning demon microscope operated at 10 KV
Light microscopic studies D.t.rminrRiocr of percent ieaf area injured
All pluns unda SAR-(lanna~ wae regularty examintd for acid-rain injury If visible
Inpry was presem in any of the test piants, control plants were checked for the same charac-
tenstlcs Wben only the SAR-exposed plants showed a pamcular type of injury, it was amib
uted to r c ~ d run r u h a than to other causes
h o c u were scored for percent laf uta inJurui The assessments w e d e using a
c!~ssa!ulg miaoscope kens were categorisai urto four groups d w n g upon the d i m
The number of lesions pec group per fidd was tabulated and related to the whole area
to give the percentage of area injured
Detennlnatlon of leaf contact angles and water-holdlng capacrty
~ e a f contact angle
Contact @a w m measured on adaxial surfaces of detachad leaves of two cuhivars
( V i w r&m cv. ADT-1 and CO-5). Since water of different pH levels did not influence the
wnW angle (Ibba et d , 1985), only distilled wata was used for the determinations The
leaves w e sprayed with distilled wata for 20 s from a distance of I m with a sprayer used
for other utpaunents Drop outbe were projected onto a wall using a 35-mm side projec-
tor md mcai on papa Contact angle was measured as the angle h e e n the surfsce of tbe
I d a n d the tangent pkne of a wata droplet at the circle of contact between air, liquid and leaf
s u k
wrtw-hoiang uprctty
As derribal for the I d contact angle, the leaves were sprayed with distilled water
and the droplet me and Frequency were detmned by m i c r o d c method The droplets
were m the range k w m 0 34 and 1 40 mm in dlamaer Wata which remined on the adax-
la1 SUTf.EI afta sprayvlg was absorbed Into a tissue paper and waghed Leaf areas were de-
temunui for a c h leaf by outlmq the laves on the graph papa W a t e r - h o b capac~ty was
exprtued lu mg t4O an:
StatWcal anatysis
Ailcas~ fin replicates wae mrinuunal for all treatments and control The expmments
were rcpcued to confirm the uads

Application of a one-way ANOVA among the c x ~ n t a l groups, F-tests or two-
tailed ANOVA is the standard practice and is less conservative. t-tests compared only pre-
dected p& i.e treatment vs control rather than treatment vs treatment (Lee et .L, 1961).
The depth of sigrufiunce between the treatments could be brought out clearly by a multiple
range tesling programme
Hence Trkcy's multiple range test (TMRT) was applied for the expenmental data
(at 5% level of siguficance). Whaeva necessary, the data were evaluated by Pearson's
product-momcnt corrdation cuulym (Zlr, 1984).