plasmodium falciparum infection during pregnancy impairs ... · 7 grisotto5,6, antonio carlos...
TRANSCRIPT
1
Plasmodium falciparum infection during pregnancy impairs fetal head growth: prospective 1
and populational-based retrospective studies 2
3
Jamille Gregório Dombrowski1, Rodrigo Medeiros de Souza1,2, Flávia Afonso Lima1, Carla Letícia 4
Bandeira1, Oscar Murillo1, Douglas de Sousa Costa1, Erika Paula Machado Peixoto1, Marielton dos 5
Passos Cunha3, Paolo Marinho de Andrade Zanotto3, Estela Bevilacqua4, Marcos Augusto Grigolin 6
Grisotto5,6, Antonio Carlos Pedroso de Lima7, Julio da Motta Singer7, Susana Campino8, Taane 7
Gregory Clark8,9, Sabrina Epiphanio10, Lígia Antunes Gonçalves1, #, , Cláudio Romero Farias 8
Marinho1, #, 9
10
1 Department of Parasitology, Institute of Biomedical Sciences, University of São Paulo, São 11
Paulo, Brazil 12
2 Multidisciplinary Center, Federal University of Acre, Acre, Brazil 13
3 Department of Microbiology, Institute of Biomedical Sciences, University of São Paulo, São 14
Paulo, Brazil 15
4 Department of Cell and Developmental Biology, Institute of Biomedical Sciences, University of 16
São Paulo, São Paulo, Brazil 17
5 CEUMA University, Maranhão, Brazil 18
6 Florence Institute, Maranhão, Brazil 19
7 Department of Statistics, Institute of Mathematics and Statistics, University of São Paulo, São 20
Paulo, Brazil 21
8 Faculty of Infectious and Tropical Diseases, London School of Hygiene & Tropical Medicine, 22
London, United Kingdom 23
9 Faculty of Epidemiology and Population Health, London School of Hygiene & Tropical 24
Medicine, London, United Kingdom 25
.CC-BY-NC-ND 4.0 International licenseIt is made available under a (which was not peer-reviewed) is the author/funder, who has granted bioRxiv a license to display the preprint in perpetuity.
The copyright holder for this preprint. http://dx.doi.org/10.1101/203059doi: bioRxiv preprint first posted online Oct. 13, 2017;

2
10 Department of Clinical and Toxicological Analyses, School of Pharmaceutical Sciences, 26
University of São Paulo, São Paulo, Brazil 27
# These authors are joint senior authors on this work. 28
Corresponding authors: 29
Claudio Romero Farias Marinho, PhD 30
e-mail: [email protected] 31
Lígia Antunes Gonçalves, PhD 32
e-mail: [email protected] 33
34
Department of Parasitology, Institute of Biomedical Sciences - ICB 35
University of Sao Paulo - USP 36
Av. Prof. Lineu Prestes, 1374 37
São Paulo - SP – Brazil - 05508-900 38
Fone: +55(11)30917209 (Laboratory); +55(11)30917417 (Fax) 39
40
Short Title: Malaria impairs fetal head growth 41
42
43
Keywords: global health, epidemiology, pregnancy, newborn, placental malaria, small head 44
.CC-BY-NC-ND 4.0 International licenseIt is made available under a (which was not peer-reviewed) is the author/funder, who has granted bioRxiv a license to display the preprint in perpetuity.
The copyright holder for this preprint. http://dx.doi.org/10.1101/203059doi: bioRxiv preprint first posted online Oct. 13, 2017;

3
ABSTRACT 45
Background: Malaria in pregnancy is associated with adverse effects on the fetus and newborns. 46
However, the outcome on a newborn’s head circumference (HC) is still unclear. Here, we show the 47
relation of malaria during pregnancy with fetal head growth. 48
Methods: Clinical and anthropometric data were collected from babies in two cohort studies of 49
malaria-infected and non-infected pregnant women, in the Brazilian Amazon. One enrolled 50
prospectively (PCS, Jan. 2013 to April 2015) through volunteer sampling, and followed until delivery, 51
600 malaria-infected and non-infected pregnant women. The other assembled retrospectively (RCS, 52
Jan. 2012 to Dec. 2013) clinical and malaria data from 4697 pregnant women selected through 53
population-based sampling. The effects of malaria during pregnancy in the newborns were assessed 54
using a multivariate logistic regression. According with World Health Organization guidelines babies 55
were classified in small head (HC < 1 SD below the median) and microcephaly (HC < 2 SD below 56
the median) using international HC standards. 57
Results: Analysis of 251 (PCS) and 232 (RCS) malaria-infected, and 158 (PCS) and 3650 (RCS) 58
non-infected women with clinical data and anthropometric measures of their babies was performed. 59
Among the newborns, 70 (17.1%) in the PCS and 934 (24.1%) in the RCS presented with a small 60
head (SH). Of these, 15 (3.7%) and 161 (4.2%), respectively, showed microcephaly (MC). The 61
prevalence of newborns with a SH (30.7% in PCS and 36.6% in RCS) and MC (8.1% in PCS and 62
7.3% in RCS) was higher among babies born from women infected with Plasmodium falciparum 63
during pregnancy. Multivariate logistic regression analyses revealed that P. falciparum infection 64
during pregnancy represents a significant increased odds for the occurrence of a SH in newborns 65
(PCS: OR 3.15, 95% CI 1.52-6.53, p=0.002; RCS: OR 1.91, 95% CI 1.21-3.04, p=0.006). Similarly, 66
there is an increased odds of MC in babies born from mothers that were P. falciparum-infected (PCS: 67
OR 5.09, 95% CI 1.12-23.17, p=0.035). Moreover, characterization of placental pathology 68
corroborates the association analysis, particularly through the occurrence of more syncytial nuclear 69
.CC-BY-NC-ND 4.0 International licenseIt is made available under a (which was not peer-reviewed) is the author/funder, who has granted bioRxiv a license to display the preprint in perpetuity.
The copyright holder for this preprint. http://dx.doi.org/10.1101/203059doi: bioRxiv preprint first posted online Oct. 13, 2017;

4
aggregates and inflammatory infiltrates in placentas from babies with the reduced head 70
circumference. 71
Conclusions: This work indicates that falciparum-malaria during pregnancy presents an increased 72
likelihood of occurring reduction of head circumference in newborns, which is associated with 73
placental malaria. 74
Trial Registration: registered as RBR-3yrqfq in the Brazilian Clinical Trials Registry 75
76
.CC-BY-NC-ND 4.0 International licenseIt is made available under a (which was not peer-reviewed) is the author/funder, who has granted bioRxiv a license to display the preprint in perpetuity.
The copyright holder for this preprint. http://dx.doi.org/10.1101/203059doi: bioRxiv preprint first posted online Oct. 13, 2017;

5
BACKGROUND 77
Malaria remains a major global health problem, with approximately one billion people living at 78
high-risk of being infected (World Health Organization. 2017). Plasmodium spp. infection impacts 79
the health of the poorest and marginalized communities in the endemic countries, particularly in 80
infants and pregnant women, with around 125 million pregnancies at risk of infection each year 81
(Dellicour et al. 2010). Malaria during pregnancy, especially falciparum-malaria, can be devastating 82
and fulminant, leading to high mortality for both mother and fetus (Desai et al. 2007). During 83
pregnancy, the infected erythrocytes accumulate and sequester in the placental intervillous space, 84
causing placental histopathological changes, which triggers an exacerbated inflammatory response 85
that is highly detrimental (Ismail et al. 2000). The deleterious effects caused by malaria infection 86
during pregnancy depend on various factors, such as the woman’s immunity, the number of 87
previous pregnancies and the trimester of gestation, with primigravida and secundigravida most 88
susceptible and suffering the greatest consequences (Rogerson et al. 2007). 89
A heightened inflammatory response perturbs the maternal-fetal interface and impairs critical 90
placental functions. Therefore, maternal malaria presents a major impact on fetus and newborns, 91
being the main cause of abortion, stillbirth, premature delivery and fetal death in malaria-endemic 92
countries (Desai et al. 2007). Low birth weight (LBW) caused by prematurity or intrauterine growth 93
retardation (IUGR) is commonly observed in babies born from mothers who had malaria during 94
pregnancy, contributing to around 100,000 infant deaths each year (Guyatt and Snow 2001; Desai et 95
al. 2007; Rogerson et al. 2007). Additionally, in utero exposure to malaria parasites has been shown 96
to impact the fetus or newborn head circumference (HC), a proportional reduction as an outcome of 97
the IUGR (Menendez et al. 2000; Meuris et al. 1993). Albeit, no further studies have tried to unpick 98
a specific disproportionate HC reduction associated with malaria during pregnancy. 99
Several studies have reported the association of intrauterine infections with a high risk of the 100
newborn to have LBW and brain injury (Zhao et al. 2013). A group of microorganisms designated 101
as TORCH, an abbreviation for Toxoplasma, rubella, cytomegalovirus, and Herpes simplex that 102
.CC-BY-NC-ND 4.0 International licenseIt is made available under a (which was not peer-reviewed) is the author/funder, who has granted bioRxiv a license to display the preprint in perpetuity.
The copyright holder for this preprint. http://dx.doi.org/10.1101/203059doi: bioRxiv preprint first posted online Oct. 13, 2017;
6
now also comprise T. pallidum (Syphilis), hepatitis virus, and HIV, and recently, the Zika virus are 103
frequently associated with reduced HC in newborns (Neu, Duchon, and Zachariah 2015; Tetro 104
2016). The more adverse consequence that results from these infections is microcephaly at birth, 105
which is defined by a reduction of the occipitofrontal HC of more than two standard deviations 106
(SD) below the median compared to age and sex-matched control population (Passemard, Kaindl, 107
and Verloes 2013). Although the brain insult is defined by the cranium size, it also reflects a 108
reduction of the brain volume and an impairment of cognitive abilities (Passemard, Kaindl, and 109
Verloes 2013). 110
Thus, to investigate the relation of malaria during pregnancy on the fetus head growth, we analyzed 111
data from a prospective and a retrospective cohort from newborns delivered between 2012 and 2015 112
in Cruzeiro do Sul (Acre State in the Southwestern Brazilian Amazon Basin), where 46% of the 113
total falciparum-malaria Brazilian cases occur (SIVEP - Secretaria de Vigilância em Saúde - 114
Ministério da Saúde 2015; Ferreira and Castro 2016).115
.CC-BY-NC-ND 4.0 International licenseIt is made available under a (which was not peer-reviewed) is the author/funder, who has granted bioRxiv a license to display the preprint in perpetuity.
The copyright holder for this preprint. http://dx.doi.org/10.1101/203059doi: bioRxiv preprint first posted online Oct. 13, 2017;
7
METHODS 116
Setting 117
Two cohort studies were conducted in the Amazonian region of the “Alto do Juruá” valley (Acre, 118
Brazil), evaluating maternal-child pairs data of births at the general maternity ward, Hospital da 119
Mulher e da Criança do Juruá (HMCJ, Cruzeiro do Sul), where approximately 90% of the total 120
deliveries in the region occur. “Alto do Juruá” valley is in the extreme southwest of the Brazilian 121
Amazon Basin, covering an area of 74,965 km2, predominantly rainforest, and a population of 122
~200,000 inhabitants. It is limited to the north by the Amazonas state, to the east by the Acre Valley 123
(Acre), and to the south and west by Peru (Fig. 1). This is a region of high malaria endemicity in 124
Brazil, with an annual parasite incidence above 100, where P. vivax is responsible for 70-80% of 125
the malaria cases, and where 46% of the total P. falciparum Brazilian cases occur (Ferreira and 126
Castro 2016; Kohara Melchior and Chiaravalloti Neto 2016). In this region, 18% of women acquire 127
Plasmodium infection during pregnancy (SIVEP - Secretaria de Vigilância em Saúde - Ministério 128
da Saúde 2015). 129
130
Prospective cohort study (PCS) 131
Design and participants 132
A total of 600 pregnant women were enrolled through volunteer sampling of equal numbers of P. 133
falciparum-, P. vivax-infected, and non-infected pregnant women, and followed until delivery, 134
between January 2013 and April 2015. The women were recruited during their first pregnancy visit 135
to the antenatal care (ANC) clinic. Each pregnant woman was followed by a trained nurse, which 136
involved at least two domiciliary visits, at the second and third trimester, to monitor their clinical 137
state, in addition to the usual prenatal care in health care services. 138
Samples collection 139
At the time of recruitment, data was collected on socioeconomic, clinical, and obstetric variables, 140
and peripheral blood and thick and thin blood smears were used to diagnose and confirm malaria 141
.CC-BY-NC-ND 4.0 International licenseIt is made available under a (which was not peer-reviewed) is the author/funder, who has granted bioRxiv a license to display the preprint in perpetuity.
The copyright holder for this preprint. http://dx.doi.org/10.1101/203059doi: bioRxiv preprint first posted online Oct. 13, 2017;

8
infection. During the domiciliary visits, clinical and obstetric data were obtained, and collected a 142
peripheral blood sample. An additional blood sample was collected in each episode of malaria 143
during pregnancy. At the time of delivery, clinical data were collected from mother and newborn, as 144
well as a placental biopsy and blood samples. 145
Samples processing 146
The peripheral and placental blood was collected in heparin tubes and then separated into plasma 147
and whole blood cells using a centrifuge. Thin and thick blood smears were stained with Giemsa. 148
The placental biopsies were fixed in 10% neutral buffered formalin at 4°C until they could be sent 149
to the University of São Paulo for processing. Paraffin-embedded 5µm sections of placental tissue 150
were stained with Hematoxylin-Eosin (H&E) or Giemsa for histological examination. Total DNA 151
was obtained from whole blood cells using a commercially available extraction kit (QIAmp DNA 152
Mini Kit, Qiagen), following the manufacturer’s instructions. 153
Gestational age estimation 154
The gestational age of all women from the PCS was estimated by woman’s last menstrual period 155
(LMP) and adjusted by ultrasound during the first trimester of pregnancy. 156
Newborns classification according to head circumference 157
Based on the gestational age, and on the HC size and gender, each newborn from the PCS was 158
assigned into groups using the INTERGROWTH-21st Project (Villar et al. 2014). An individual was 159
in a normal head circumference (NHC) range if their HC was within one SD of the median. 160
Newborns with HC below one SD below the median were considered to have a small head (SH) 161
(Brennan, Funk, and Frorhingham 1985). Newborns with HC below two SD below the median were 162
classified as having microcephaly (MC) (Passemard, Kaindl, and Verloes 2013). 163
Screening of malaria infection 164
Malaria during pregnancy was diagnosed from thin and thick blood smears by two experts in 165
microscopy of the endemic surveillance team of Cruzeiro do Sul (Acre, Brazil). Furthermore, all 166
samples collected throughout the pregnancy were screened for the presence of malaria parasites, by 167
.CC-BY-NC-ND 4.0 International licenseIt is made available under a (which was not peer-reviewed) is the author/funder, who has granted bioRxiv a license to display the preprint in perpetuity.
The copyright holder for this preprint. http://dx.doi.org/10.1101/203059doi: bioRxiv preprint first posted online Oct. 13, 2017;
9
microscopy and confirmed by a real-time PCR technique (PET-PCR). This technique detects in 168
multiplex the Plasmodium spp. and P. falciparum, and in singleplex P. vivax if only Plasmodium 169
spp. is detected in the first PCR. PET-PCR has a detection limit of 3.2 parasites/ml (Lucchi et al. 170
2013). The real-time PCR was performed on the 7500 Fast Real-Time PCR System (Applied 171
Biosystems, ThermoFisher). All the women who had malaria during pregnancy were treated with 172
antimalarial drugs under medical prescription, according to the Brazilian Ministry of Health (MoH) 173
guidelines, with further treatment confirmation. 174
Histopathology evaluation 175
The histopathologic examination involved using placental tissue slides. The Hematoxylin-Eosin-176
staining allowed evaluating the syncytial nuclear aggregates (SNA), fibrinoid necrosis, and fibrin 177
deposition (Souza et al. 2013). The hemozoin presence was assessed through microscopy of 178
polarized light (Romagosa et al. 2004). The leukocyte (CD45) and monocyte inflammatory infiltrate 179
(CD68), and the villous vascularity (CD31) have been evaluated by immunohistochemistry using 180
the tissue microarray (TMA) technique, conducted at the AC Camargo Hospital, in São Paulo, 181
Brazil, as described elsewhere (Ataíde et al. 2015; Hsu, Raine, and Fanger 1981). The proliferation 182
index was calculated through quantitative image analysis of anti-Ki-67/DAB staining (Tuominen et 183
al. 2010). Additional file 1 describes these procedures in detail. The images of placenta were 184
captured by a Zeiss Axio Imager M2 light microscope equipped with a Zeiss Axio Cam HRc 185
camera and analyzed by Image J software (http://imagej.nih.gov/ij). 186
Angiogenic factors and Leptin measurement 187
The angiogenic factors, vascular endothelial growth factor A (VEGFA, and it receptors 188
VEGFR1/FLT1 and VEGFR2/FLK1), angiopoietins 1 and 2 (ANG-1 and ANG-2, and their 189
associated soluble receptor the TEK receptor tyrosine kinase (TIE-2)), and the leptin hormone were 190
measured in placental plasma (1:20 dilution for all factors) using the DuoSet ELISA development 191
kits (R&D), according to manufacturer’s guidelines. 192
Screening of other infectious agents 193
.CC-BY-NC-ND 4.0 International licenseIt is made available under a (which was not peer-reviewed) is the author/funder, who has granted bioRxiv a license to display the preprint in perpetuity.
The copyright holder for this preprint. http://dx.doi.org/10.1101/203059doi: bioRxiv preprint first posted online Oct. 13, 2017;

10
All pregnant women were screened in the local ANC clinics for toxoplasmosis, hepatitis, syphilis, 194
and HIV by measuring antibodies titers, following the Brazilian MoH guidelines. Further, 195
peripheral plasma from women that delivered babies with small head and microcephaly, 196
irrespective of the infection status and Plasmodium species, was tested to confirm the absence of 197
other infectious agents during pregnancy. Tests for Toxoplasma gondii, Rubella, Cytomegalovirus, 198
Herpes simplex virus, Syphilis, HIV, Dengue virus, Chikungunya virus, and Zika virus were 199
performed retrospectively by ELISA assays in peripheral blood collected until the 28 weeks of 200
gestation. In pregnant women that delivered babies with microcephaly, plasma samples of two 201
different time points of the pregnancy were tested. All the serological tests were performed using 202
commercially available kits: HIV 1/2 and total Syphilis (Symbiosys) and IgG/IgM to 203
Toxoplasmosis, Rubella, Cytomegalovirus and Herpes simplex (TORCH) (Virion\Serion), and used 204
according to the manufacturer’s instructions. To detect Dengue, Chikungunya, and Zika current 205
viral infections, qualitative assays were carried out by IgM capture using a specific viral antigen for 206
DENV, ZIKV, and CHIKV, as previously described (Sow et al. 2016). The identification of specific 207
IgG antibodies to CHIKV was performed using a specific viral antigen (Sow et al. 2016), and to 208
DENV and ZIKV were made with an antigen derived from a whole DENV-2 NS1 protein and a 209
portion of the NS1 protein, respectively (unpublished data). Developing color was quantified on an 210
automatic microliter plate reader Spectramax Plus 384 (Molecular Devices). The results were 211
expressed as optical density (OD) at 405/630 nm or 450/630 nm (Virion/Serion and 212
Symbiosys/Alka Kits, respectively). In TORCH analyses, the presence of IgG and IgM antibodies 213
were classified as positive, negative or borderline according to an OD range adopted by standard 214
positive control mean. For Rubella and Toxoplasma gondii (IgG) avidity test was performed 215
according to the manufacturer's specifications (Virion/Serion), and in all TORCH IgM tests, we use 216
the rheumatoid factor absorbent reagent (# Z200, Virion/Serion). All the kits followed the 217
validation criteria, and the presence of IgG and IgM antibodies for Syphilis and HIV antigens were 218
determined by comparing the absorbance value of serum samples with the cut-off value of standards 219
.CC-BY-NC-ND 4.0 International licenseIt is made available under a (which was not peer-reviewed) is the author/funder, who has granted bioRxiv a license to display the preprint in perpetuity.
The copyright holder for this preprint. http://dx.doi.org/10.1101/203059doi: bioRxiv preprint first posted online Oct. 13, 2017;

11
of reference controls and classified as positive or negative. All tests were performed without the 220
operator knowledge of the group classification for each sample. If the test was inconclusive the 221
screen was repeated using samples from two different gestational time-points. Newborns were 222
excluded from the analysis whenever their mothers presented antibody titers for IgM. 223
Measurement of cytokines/anaphylatoxins by bead array 224
The levels of the cytokines IL-12p70, TNF, IL-10, IL-6, IL-1b, and IL-8 in the placental plasma, 225
were detected and quantified by a CBA human inflammatory kit (BD Biosciences) that was used 226
according to the manufacturer’s protocol. For complement activation studies (measuring C3a, C4a, 227
and C5a) the CBA human anaphylatoxin kit (BD Biosciences) was used. The samples were 228
analyzed in a two-laser BD FACSCalibur flow cytometer with CellQuest version 5.2 software (BD 229
Biosciences), and concentrations computed using FCAP array software version 3.0.1 (BD 230
Biosciences). All plasma samples were processed and kept at -80°C in Cruzeiro do Sul until they 231
were sent to the University of São Paulo. 232
233
Retrospective cohort study (RCS) 234
Design, participants and data collection 235
A total of 4697 maternal-child pairs were selected retrospectively through a population-based 236
sampling of all deliveries occurring between January 2012 and December 2013. The data from the 237
Brazilian Epidemiological Surveillance Information System (SIVEP)-Malaria of the mother malaria 238
infection status during pregnancy was assembled with the clinical and anthropometric data present 239
in the medical records of the mother and the newborn. This was followed by the collection and 240
collation of the data to evaluate the newborns further. 241
Gestational age estimation 242
The gestational age in the RCS was established by the woman’s last menstrual period (LMP). These 243
data were obtained from the medical records. The LMP method is recommended by the Brazilian 244
MoH for gestational age calculation when it is not possible to use ultrasound. 245
.CC-BY-NC-ND 4.0 International licenseIt is made available under a (which was not peer-reviewed) is the author/funder, who has granted bioRxiv a license to display the preprint in perpetuity.
The copyright holder for this preprint. http://dx.doi.org/10.1101/203059doi: bioRxiv preprint first posted online Oct. 13, 2017;

12
Newborns classification according to head circumference 246
Based on the gestational age estimation methodologies, and on the HC size and gender, each 247
newborn from RCS was assigned into groups using the WHO child growth standards (WHO-CGS) 248
(WHO Multicentre Growth Reference Study Group 2007). Gestational age assessment is considered 249
accurate when acquired through ultrasound performed early in the first trimester, but the date of the 250
last menstrual period is considered unreliable (World Health Organization 2016). According to 251
WHO guidelines, the WHO-CGS provides an appropriate reference standard for term neonates 252
when gestational age is not reliably known. An individual was in a normal head circumference 253
(NHC) range if their HC was within one SD of the median, (boys 33.2 ≥ HC ≤ 35.7, girls 32.7 ≥ HC 254
≤ 35.1). Newborns with HC below one SD below the median were considered to have a small head 255
(SH) (boys HC < 33.2, girls HC < 32.7) (Brennan, Funk, and Frorhingham 1985). Newborns with 256
HC below two SD below the median were classified as having microcephaly (MC) (boys HC < 257
31.9, girls HC < 31.5) (Passemard, Kaindl, and Verloes 2013). 258
Screening of malaria infection 259
Malaria during pregnancy was diagnosed from thin and thick blood smears by microscopists of the 260
endemic surveillance team of Cruzeiro do Sul (Acre, Brazil), whenever women show suspicious 261
malaria symptoms. These data were obtained from the Brazilian Epidemiological Surveillance 262
Information System (SIVEP)-Malaria. All the women who had malaria during pregnancy were 263
treated with antimalarial drugs under medical prescription, according to the Brazilian MoH 264
guidelines. 265
Screening of other infectious agents 266
All pregnant women were screened in the local ANC clinics for toxoplasmosis, hepatitis, syphilis, 267
and HIV by measuring antibodies titers, following the Brazilian MoH guidelines. 268
269
Newborn anthropometric measures 270
.CC-BY-NC-ND 4.0 International licenseIt is made available under a (which was not peer-reviewed) is the author/funder, who has granted bioRxiv a license to display the preprint in perpetuity.
The copyright holder for this preprint. http://dx.doi.org/10.1101/203059doi: bioRxiv preprint first posted online Oct. 13, 2017;

13
In the two cohort studies, PCS and RCS, the newborn anthropometric measures were obtained 271
immediately after the delivery, maximum within 24h, by trained nurses. Weight was measured in 272
grams (g) using digital pediatric scales, with a precision of 5 g, and the length and occipitofrontal 273
head circumference (HC) were measured in centimeters (cm), using a non-stretching flexible 274
measuring tape. Rohrer’s ponderal index is the newborns’ weight in grams divided by the cube of 275
the length in centimeters, and babies are considered proportional when values are above 2.5, 276
corresponding to the 10th percentile (WHO Expert Committee on Physical Status 1995). An Apgar 277
score indicates the physical condition of the newborn, relative to its response to stimulation, skin 278
coloration, heart rate, respiratory effort, and muscle tone. If the Apgar Score is between 7 and 10 279
the newborn is considered normal; if it is between 4 and 6 it is indicative that some assistance for 280
breathing might be required; and below 4, the baby needs several interventions (American Academy 281
of Pediatrics Committee on Fetus and Newborn and American College of Obstetricians and 282
Gynecologists Committee on Obstetric Practice 2015). 283
284
Exclusion criteria 285
Our analysis was restricted to babies that had been born at term (37 - 42 weeks of gestation) with at 286
least 2500 grams of weight in a single birth and from mothers of fertile age (13 - 47 years old). 287
Women were excluded if they had a history during pregnancy of smoking, drug use and/or alcohol 288
consumption, and who presented with infections (TORCH, HIV, Hepatitis B virus, Hepatitis C 289
virus, Syphilis, Dengue, Chikungunya and Zika virus), and/or other comorbidities (e.g. 290
hypertension, pre-eclampsia/eclampsia, diabetes mellitus, preterm delivery, stillbirth, and newborn 291
with congenital malformation). Due to the extremely high percentage of C-sections performed in 292
Brazilian maternity units, women who underwent a C-section were not excluded from the study. 293
294
Statistical analyses 295
.CC-BY-NC-ND 4.0 International licenseIt is made available under a (which was not peer-reviewed) is the author/funder, who has granted bioRxiv a license to display the preprint in perpetuity.
The copyright holder for this preprint. http://dx.doi.org/10.1101/203059doi: bioRxiv preprint first posted online Oct. 13, 2017;

14
Data were analyzed using R (r-project.org), Stata (StataCorp), Minitab 18 and GraphPad Prism 296
software. Continuous variables were summarized using means and SD, medians, and interquartile 297
ranges (IQR). Categorical variables were summarized using frequencies and percentages. 298
Differences between groups were evaluated using Mann-Whitney U-tests accordingly. Categorical 299
data and proportions were analyzed using chi-square tests. All p-Values were 2-sided, at a 300
significance level of 0.05. To assess the association between malaria and microcephaly, adjusted 301
odds ratios (OR) with 95% confidence intervals (CI) were estimated using a multivariate logistic 302
regression approach. These models included infection by malaria (no/yes), maternal age (≥ 18 years 303
old / ≤ 17 years old) and the number of gestations (two or more/one) as explanatory variables and 304
SH (yes/no) or microcephaly (yes/no) as response variables. The first category for each explanatory 305
variable was considered as reference (Hosmer and Lemeshow 2013). Missing data were imputed or 306
“filled in” within a multiple imputation framework using the “MICE” library within the R software 307
(Rubin 1996; Van Buuren and Groothuis-Oudshoorn 2011). In particular, 5 datasets were completed 308
and the results pooled across allowing for the uncertainty in the imputation process. 309
The current sample sizes present a deviation from those proposed at the outset. It was proposed to 310
enroll ~400 infected and ~800 non-infected pregnant women into the prospective cohort study. We 311
were unable to recruit to this 2:1 ratio, as some initially included in the non-infected group, were 312
transferred to an infected group upon Plasmodium molecular detection. 313
The manuscript was written according to the STROBE statement guidelines. 314
315
.CC-BY-NC-ND 4.0 International licenseIt is made available under a (which was not peer-reviewed) is the author/funder, who has granted bioRxiv a license to display the preprint in perpetuity.
The copyright holder for this preprint. http://dx.doi.org/10.1101/203059doi: bioRxiv preprint first posted online Oct. 13, 2017;

15
RESULTS 316
Study Population 317
A total of 600 pregnant women were enrolled in a prospective cohort study (PCS) and followed 318
until delivery. Of the first eligible maternal-child pairs, 409 (68.2%) met the inclusion criteria (Fig. 319
2). Among the 409 newborns, 251 were born from mothers that had malaria infection during 320
pregnancy, P. vivax (Pv), P. falciparum (Pf) or both (mixed) (Fig. 2). Overall, there were no 321
relevant maternal and newborns baseline differences between the distinct groups (Additional file 2). 322
Nonetheless, women that were Plasmodium-infected presented few characteristics at delivery that 323
were slightly different from the Non-Infected group: less weight gain, lower hematocrit, lower 324
hemoglobin, and reduced placental weight (Additional file 2). 325
326
Reduced head circumference in newborns from women infected with P. falciparum during 327
pregnancy 328
The frequency distribution of the newborns HC born from non- (NI) and malaria-infected mothers 329
(Malaria), including LBW and preterm babies, evidenced differences between the two groups. The 330
Malaria group displayed a deviated peak and spread to the left when compared with the NI group, 331
indicative of more newborns with reduced HC (p = 0.005) (Fig. 3a). Nevertheless, to assure that the 332
observed difference was not due to the LBW and preterm babies, these newborns were removed 333
from the analysis and segregated the malaria-infected group into Plasmodium species infected 334
groups. Even though, it was possible to observe an apparent deviation of the peak of the P. 335
falciparum-infected group (Pf) from the non-infected (NI) (p = 0.023) (Fig. 3b), indicating a higher 336
frequency of babies with smaller HC when mothers are infected by P. falciparum. 337
Among the evaluated newborns in the PCS, 70 (17.1%) babies presented with a small head (SH), 338
including 15 (3.7%) with microcephaly (Fig. 3c). The evaluated babies were considered 339
proportionate through the Rohrer Index, independently of the HC size (Additional file 3). Further, 340
to evaluate the association of malaria during pregnancy with fetus head growth, the newborns were 341
.CC-BY-NC-ND 4.0 International licenseIt is made available under a (which was not peer-reviewed) is the author/funder, who has granted bioRxiv a license to display the preprint in perpetuity.
The copyright holder for this preprint. http://dx.doi.org/10.1101/203059doi: bioRxiv preprint first posted online Oct. 13, 2017;
16
segregated by HC and the mother infection status: non-infected, P. vivax-, mixed- or P. falciparum-342
infected. The prevalence of newborns with SH was higher among babies born from women infected 343
with P. falciparum (30.7%) during pregnancy. Similarly, the prevalence of microcephaly doubled 344
when a P. falciparum infection has occurred (8.1%) (Fig. 3c). In fact, a multivariate logistic 345
regression analysis identified P. falciparum infection as increasing the odds of occurring SH in 346
newborns (OR 3.15, 95% CI 1.52-6.53, p = 0.002) (Fig. 3c). Likewise, it revealed a higher 347
likelihood of occurring microcephaly in babies born from mothers that were P. falciparum-infected 348
(OR 5.09, 95% CI 1.12-23.17, p = 0.035) (Fig. 3c). Strikingly, P. vivax infection during pregnancy 349
was not found to be associated with reduced HC (for SH, OR 1.30, 95% CI 0.66-2.59, p = 0.449). 350
Maternal-child pairs that presented misleading factors such as TORCH infections, Syphilis, HIV, 351
Dengue, Chikungunya, and Zika virus, and alcoholism and drug use declared in the medical 352
records, or identified in all mothers that delivered babies with were discarded SH (Additional file 353
4). 354
355
Reduced head circumference in newborns is associated with placental malaria 356
Further, several placental parameters were evaluated to ascertain the relation of placental malaria 357
due to P. falciparum infection with the SH occurrence. Strikingly, babies with SH (Pf-SH) born 358
from mothers that had their first infection later in gestation (median [IQR], 25.5 weeks [18.0-32.5], 359
p = 0.014) when compared with NHC (19.0 weeks [12.0-29.3]). Moreover, much of the placental 360
malaria manifestation in newborns with SH (Pf-SH) or microcephaly (Pf-MC) was due to a past P. 361
falciparum infection (54% and 72%, respectively), as opposed to 48% in placentas from newborns 362
with NHC (Pf-NHC) (Table 1). 363
The analysis of placental histology parameters and angiogenic factors disclosed substantial 364
differences between non-infected controls and P. falciparum-infected groups. Of note, in all P. 365
falciparum-infected groups, we observed higher monocytes infiltrate (median[IQR], Pf-NHC 7.0 366
[5.0-13.0], p <0.0001; Pf-SH 9.5 [5.5-15.0], p <0.0001; Pf-MC 9.0 [6.0-11.0], p = 0.018 vs Non-367
.CC-BY-NC-ND 4.0 International licenseIt is made available under a (which was not peer-reviewed) is the author/funder, who has granted bioRxiv a license to display the preprint in perpetuity.
The copyright holder for this preprint. http://dx.doi.org/10.1101/203059doi: bioRxiv preprint first posted online Oct. 13, 2017;

17
Infected 4.0 [2.0-7.0]) (Fig. 4c, d). On the other hand, the syncytial nuclear aggregates (SNA) and 368
Leptin alterations were only observed in infected placentas of babies with SH and MC. Remarkably, 369
SNA that have a long-standing association with placental pathologies (Heazell et al. 2007), 370
presented excessive formation in the Pf-SH and Pf-MC groups (17.5 [12.0-24.5], p = 0.002 and 18.0 371
[12.0-30.0], p = 0.023, respectively) when compared to the Non-Infected (13.0 [10.0-17.0]) (Fig. 372
4g, h), as well, when Pf-SH was compared to Pf-NHC. Moreover, the Leptin levels were markedly 373
reduced in the Pf-SH and Pf-MC groups (19.5 [4.5-37.2], p = 0.013 and 16.7 [9.0-26.7], p = 0.027, 374
respectively) when compared to the Non-Infected (33.1 [17.2-47.4]) (Fig. 5i). Complete data details 375
can be found in Additional file 5. 376
Furthermore, evaluation of inflammatory factors in the placental plasma revealed differences 377
mainly between the Non-Infected group and the Pf-NHC group. Though, the Pf-SH group shows 378
statistically significant higher IL8 and smaller C3a plasma levels (45.1 [22.1-85.9], p = 0.044; and, 379
3.0 [0-5.5], p = 0.014, respectively) when compared to the Non-Infected group (25.5 [15.7-52.2], 380
and, 4.5 [3.2-6.6], respectively) (Additional file 5). These results support a placental dysfunction 381
upon P. falciparum infection, which in some parameters are specifically heightened in placentas 382
derived from babies with reduced HC, like the syncytial nuclear aggregates. 383
384
Retrospective cohort study corroborates the reduced head circumference association with P. 385
falciparum infection 386
Further, a population-based retrospective cohort study (RCS) was conducted to confirm the 387
association results. A total of 4697 maternal-child pairs were included, and upon application of the 388
exclusion criteria, 3882 (83%) newborns remained to be evaluated, of which, 232 were born from 389
mothers that had malaria infection during pregnancy (Fig. 2). Overall, there were no significant 390
differences in baseline characteristics between the PCS and the RCS (Additional file 2 and 6). The 391
evaluation of the frequency distribution of the newborns HC born from non- (NI) and malaria-392
infected mothers (Malaria), showed differences between the two groups (p = 0.008) (Fig. 6a). 393
.CC-BY-NC-ND 4.0 International licenseIt is made available under a (which was not peer-reviewed) is the author/funder, who has granted bioRxiv a license to display the preprint in perpetuity.
The copyright holder for this preprint. http://dx.doi.org/10.1101/203059doi: bioRxiv preprint first posted online Oct. 13, 2017;

18
Identical to the PCS, when the LBW and preterm babies were removed from the analysis, and the 394
malaria-infected group segregated, the P. falciparum-infected group (Pf) presented a deviated peak 395
from the non-infected (NI) (p = 0.015) (Fig. 6b). Indicative of a higher frequency of newborns with 396
reduced HC when mothers are infected with P. falciparum during pregnancy. 397
The evaluated newborns included 934 (24.1%) babies with SH and 161 (4.2%) with microcephaly. 398
In the RCS, similarly to the PCS, the prevalence of newborns with SH was more than one-half 399
higher (36.6%) among babies born from P. falciparum-infected mothers, and the microcephaly 400
prevalence almost doubled in the presence of a P. falciparum infection (7.3%) (Fig. 6c). 401
Analogously, the multivariate logistic regression analysis revealed that P. falciparum infection 402
increases the odds of occurring SH in newborns (Odds ratio [OR] 1.91, 95% CI 1.21-3.04, p = 403
0.006) (Fig. 6c). Altogether, these results demonstrate that P. falciparum infection during 404
pregnancy increases the likelihood of occurring reduced HC in the newborns, corroborating the 405
results obtained in the PCS. 406
.CC-BY-NC-ND 4.0 International licenseIt is made available under a (which was not peer-reviewed) is the author/funder, who has granted bioRxiv a license to display the preprint in perpetuity.
The copyright holder for this preprint. http://dx.doi.org/10.1101/203059doi: bioRxiv preprint first posted online Oct. 13, 2017;

19
DISCUSSION 407
It is well-established that malaria during pregnancy increases the risk of adverse fetal outcomes, 408
such as abortion, IUGR, premature births and LBW. We show evidence that P. falciparum infection 409
during pregnancy is significantly associated with the occurrence of reduced HC in the newborns, 410
and to some extent, with microcephaly. The revealed newborn HC reduction is independent of the 411
already known impact that malaria has on the whole fetal growth, as LBW and preterm newborns 412
were deliberately excluded from our analysis. 413
The increased risk for developing reduced HC associated with P. falciparum infection was 414
supported by a prospective study (PCS) (Odds Ratio (OR) 3.15, p = 0.002) and subsequently 415
corroborated by a retrospective study (RCS) (OR 1.91, p = 0.006). Remarkably, in the prospective 416
study, the OR doubles when we consider only the microcephaly cases (OR 5.09, p = 0.035). These 417
observations reinforce the knowledge that malaria during pregnancy increases the risk of problems 418
in fetal development (Desai et al. 2007; Ismail et al. 2000; Rogerson et al. 2007). 419
We hypothesize that the placental inflammatory process acting upon P. falciparum infection is 420
contributing to impair the fetal head growth. This hypothesis is supported by the observation of 421
histopathological alterations, combined with an imbalance in angiogenic factors production and 422
inflammatory factors in placentas from babies with congenital SH or microcephaly when mothers 423
were P. falciparum-infected. A local inflammation can generate a frame of hypoxia/ischemia that 424
would alter the transportation of both nutrients and respiratory gases to the unborn baby, which can 425
impact on cranial malformation due to the lack of an adequate supply of nutrients and oxygen 426
(Nelson and Penn 2015). Also, the oxidative stress caused by hypoxia leads to several structural and 427
functional alterations in the intrauterine development (Kurinczuk, White-Koning, and Badawi 428
2010). This scenario is often observed in cases of placental malfunction due to different etiologies, 429
and prolonged and premature labor (Boksa 2004). 430
Interestingly, the values of SNA or syncytial knotting, which has been associated with IUGR due to 431
local hypoxia/oxidative stress (Heazell et al. 2007), were highly increased in placentas from the Pf-432
.CC-BY-NC-ND 4.0 International licenseIt is made available under a (which was not peer-reviewed) is the author/funder, who has granted bioRxiv a license to display the preprint in perpetuity.
The copyright holder for this preprint. http://dx.doi.org/10.1101/203059doi: bioRxiv preprint first posted online Oct. 13, 2017;

20
SH and Pf-MC groups when compared to the other control groups. Syncytial knotting has 433
repeatedly been observed in placentas from P. falciparum-exposed women (Souza et al. 2013; 434
Bulmer et al. 1993; Ismail et al. 2000). In fact, the major placental alterations observed, including 435
syncytial knots and monocytes inflammatory infiltrate, are consistent with previous reports on 436
placental inflammatory responses due to sequestration of P. falciparum parasites in the placenta, 437
which characterizes the placental malaria development (Ismail et al. 2000; Rogerson et al. 2007; 438
Souza et al. 2013). The evaluation of cytokine levels and complement in our samples did not show 439
an overall alteration. Nevertheless, these only reflect a picture at the moment of birth. It is 440
unsurprising that P. vivax infection was not associated with the head reduction phenotype, as this 441
parasite is known as not sequestering in the placenta. Previous studies have demonstrated that P. 442
vivax infection during pregnancy induces a less placental inflammatory process when compared 443
with P. falciparum infection (Souza et al. 2013). 444
The presence of residual tissue lesions and impaired leptin production constitute clear evidence of 445
damage. In fact, the Pf-SH and Pf-MC groups presented deregulated leptin levels. The impaired 446
production of leptin, a hormone commonly produced in substantial amounts by the placenta, can be 447
related to placental inflammation upon infection. Also, leptin has been shown associated with fetal 448
growth restriction (Conroy et al. 2011). Regarding the Pf-SH group, few observed differences 449
reached statistical significance, possibly due to the small sample size of this group, but the overall 450
placental malaria phenotype is more prominent and widespread than in non-infected and Pf-NHC 451
groups. Nevertheless, it is unclear how placental alterations due to inflammation impact on the 452
development of the fetus. 453
Currently, much of what is known about falciparum gestational malaria is based on studies 454
performed in African high transmission areas, which in general are settings that have precarious 455
health systems and inadequate or late treatment provision. In Brazil, approximately 85% of the 456
infections are caused by P. vivax. P. falciparum is only transmitted in specific regions, including in 457
the one evaluated in this work (“Alto do Juruá” valley, Acre), where it is responsible for 46% of the 458
.CC-BY-NC-ND 4.0 International licenseIt is made available under a (which was not peer-reviewed) is the author/funder, who has granted bioRxiv a license to display the preprint in perpetuity.
The copyright holder for this preprint. http://dx.doi.org/10.1101/203059doi: bioRxiv preprint first posted online Oct. 13, 2017;

21
total infections in Brazil (SIVEP - Secretaria de Vigilância em Saúde - Ministério da Saúde 2015; 459
Ferreira and Castro 2016). Interestingly, despite Brazil being a low transmission area for malaria 460
with effective control strategies and early treatment provision, we observed adverse events in 461
newborns similar to those reported in areas of high endemicity. 462
Surprisingly, the prevalence of microcephaly (HC < -2 SD) observed by us is far higher than what 463
has been previously reported by the Brazilian Ministry of Health (Passemard, Kaindl, and Verloes 464
2013). Two independent studies have recently evaluated retrospectively babies born in two different 465
Brazilian regions, and also reported a higher prevalence of microcephaly in babies born before the 466
Zika outbreak (Soares de Araújo et al. 2016; Magalhães-Barbosa et al. 2017). In one, 16,208 infants 467
born between 2012 and 2015 in the Paraiba State (Brazil) were evaluated, and 4.2 to 8.2% of 468
microcephaly prevalence was reported, depending on the classification criteria (Soares de Araújo et 469
al. 2016). In the other, 8,275 babies born between 2011 and 2015 in the southeastern and mid-470
western Brazilian region were evaluated, and an overall prevalence of microcephaly of 5.6% was 471
identified (Magalhães-Barbosa et al. 2017). In fact, it is puzzling that a country like the USA with 472
about 3.5 millions of births per year reports annually approximately 25,000 infants with 473
microcephaly (Ashwal et al. 2009); on the other hand, Brazil with about 3 million births per year 474
reported around 150 microcephaly cases annually, before Zika epidemy (Ministério da Saúde - 475
Secretaria de Vigilância em Saúde -Brasil 2015). These observations indicate an inconsistency of 476
the data released by the Brazilian authorities probably due to under-reporting. 477
Our work has some potential limitations. First, the babies’ HC was only assessed at birth, since it 478
was not possible to perform the morphometric measures through ultrasonography during pregnancy 479
in the public health system, as well as the possibility of acquiring newborn head imaging. Second, 480
reduction of HC has different etiologies, namely, genetic causes and action of infectious agents. 481
While we have discarded misleading factors, such as TORCH infections, Syphilis, HIV, Dengue, 482
Chikungunya and Zika virus, as well as smoking, alcoholism and drug use, studies to detect genetic 483
abnormalities in those patients were not performed. Third, although in both the PCS and the RCS 484
.CC-BY-NC-ND 4.0 International licenseIt is made available under a (which was not peer-reviewed) is the author/funder, who has granted bioRxiv a license to display the preprint in perpetuity.
The copyright holder for this preprint. http://dx.doi.org/10.1101/203059doi: bioRxiv preprint first posted online Oct. 13, 2017;

22
the logistic-regression analysis indicates a strong association between SH and P. falciparum 485
infection, we only had access to few placentas. The smaller sample size has limited the statistical 486
analysis; however, most of the parameters analyzed indicated intensified placental malaria when 487
compared to placentas from newborns with normal head size. 488
CONCLUSION 489
This work provides evidence that P. falciparum infection during pregnancy can impact the head 490
growth of the fetus, which leads to small heads and in extreme cases to microcephaly. If our results 491
are confirmed, the consequences of gestational malaria over fetal neurological development, which 492
can lead to poor neurocognitive and behavioral development, represents a serious long-term health 493
problem. Physicians should periodically assess the development and academic achievements of 494
these children, with a comprehensive neurocognitive evaluation, to guide preventive and 495
rehabilitative assistance that might improve outcomes. Extensive epidemiological prospective 496
studies, involving the collection of biological, clinical, and socioeconomic data and potential 497
confounding factors, are required to establish the prevalence of SH and microcephaly and its 498
association with malaria. Our work reinforces the urgent need to protect the pregnant women and 499
their unborn babies from the devastating effects of malaria infection. 500
501
.CC-BY-NC-ND 4.0 International licenseIt is made available under a (which was not peer-reviewed) is the author/funder, who has granted bioRxiv a license to display the preprint in perpetuity.
The copyright holder for this preprint. http://dx.doi.org/10.1101/203059doi: bioRxiv preprint first posted online Oct. 13, 2017;

23
ABBREVIATIONS 502
ANC: Antenatal care; ANG-1 and ANG-2: Angiopoietins 1 and 2; CI: Confidence intervals; cm: 503
centimeters; g: Grams; HC: head circumference; H&E: Hematoxylin-Eosin; HMCJ: Hospital da 504
Mulher e da Criança do Juruá; IUGR: Intrauterine growth retardation; IQR: Interquartile ranges; 505
LBW: Low birth weight; LMP: Last menstrual period; MC: Microcephaly; MoH: Ministry of 506
Health; NHC: Normal head circumference; NI: Non-infected; OD: Optical density; OR: Odds ratio; 507
PCS: Prospective cohort study; Pf: Plasmodium falciparum; Pv: Plasmodium vivax; RCS: 508
Retrospective cohort study; SD: standard deviations; SH: Small head; SIVEP: Epidemiological 509
Surveillance Information System; SNA: Syncytial nuclear aggregates; TIE-2: TEK receptor tyrosine 510
kinase; TMA: Tissue microarray; TORCH: abbreviation for Toxoplasma, rubella, cytomegalovirus, 511
and Herpes simplex; VEGFA: Vascular endothelial growth factor A; WHO: World Health 512
Organization; WHO-CGS: WHO child growth standards. 513
514
DECLARATIONS 515
Ethics approval and consent to participate 516
Ethical clearance was provided by the committees for research of the University of São Paulo and the 517
Federal University of Acre (Plataforma Brasil, CAAE: 03930812.8.0000.5467 and 518
03930812.8.3001.5010, respectively), according to Resolution nº 196/96 of Brazilian National Health 519
Committee. All the study participants or their legal guardians (if minors) gave written informed 520
consent. The authors have agreed to maintain the confidentiality of the data collected from the medical 521
records and databases, by signing the Term of Commitment for the Use of Data from Medical 522
Records. The study was conducted in accordance with the Declaration of Helsinki and is registered 523
in the Brazilian Clinical Trials Registry as RBR-3yrqfq. 524
525
Consent for publication 526
Not applicable. 527
.CC-BY-NC-ND 4.0 International licenseIt is made available under a (which was not peer-reviewed) is the author/funder, who has granted bioRxiv a license to display the preprint in perpetuity.
The copyright holder for this preprint. http://dx.doi.org/10.1101/203059doi: bioRxiv preprint first posted online Oct. 13, 2017;
24
528
Availability of data and materials 529
All relevant data are available from the authors on request. 530
531
Competing interests 532
The authors declare that they have no competing interests. 533
534
Funding 535
This work was primarily funded by grants from São Paulo Research Foundation (FAPESP), CRFM 536
(2009/53889-0 and 2014/09964-5) and SE (2014/20451-0). JMS was supported by CNPq 537
(308613/2011-2) and FAPESP (2013/21728-2). PMAZ was supported by FAPESP (2014/17766-9). 538
MAGG was supported by CNPq (404478/2012-3). TGC was supported by the Medical Research 539
Council UK (Grant no. MR/K000551/1, MR/M01360X/1, MR/N010469/1, MC_PC_15103). SC was 540
funded by the Medical Research Council UK (Grant no. MR/M01360X/1, MC_PC_15103). JGD, 541
FAL, OM, MPC, and LAG were supported by FAPESP fellowships (2012/04755-3, 2013/16417-8, 542
2013/00981-1, 2016/08204-2, and 2015/06106-0, respectively). The funders had no role in analysis 543
design, data collection and analysis, decision to publish, or preparation of the manuscript. 544
545
Authors’ contributions 546
JGD, RMS, SE, and CRFM designed the study. JGD, RMS, FAL, CLB, OM, DSC, EPMP, MPC, 547
PMAZ, MAGG, SE, LAG, and CRFM were involved in data acquisition and scientific input. JGD, 548
RMS, FAL, CLB, OM, DSC, EPMP, MPC, PMAZ, EB, MAGG, SC, TGC, SE, LAG, and CRFM 549
contributed to the analysis and/or interpretation of data. ACPL, JMS, and TGC performed the 550
multivariate logistic regression analysis. LAG and CRFM wrote the manuscript and compiled the 551
information in the Additional information. CRFM and SE were the main funders of this work. CRFM 552
have had full access to all the data in the study and takes responsibility for the integrity of the data 553
.CC-BY-NC-ND 4.0 International licenseIt is made available under a (which was not peer-reviewed) is the author/funder, who has granted bioRxiv a license to display the preprint in perpetuity.
The copyright holder for this preprint. http://dx.doi.org/10.1101/203059doi: bioRxiv preprint first posted online Oct. 13, 2017;
25
and the accuracy of the data analysis. All authors reviewed and approved the final version of this 554
manuscript. 555
556
Acknowledgements 557
We thank the women from “Alto do Juruá” valley who agreed to participate in the study, as well as 558
the nurses and technicians from the Hospital da Mulher e da Criança do Juruá and Gerência de 559
Endemias/SESACRE team for their invaluable assistance. Also, we thank the direction of Santa Casa 560
de Misericórdia de Cruzeiro do Sul, and Universidade Federal do Acre for the support. Additionally, 561
we thank Alexandre Macedo de Oliveira from Centers for Disease Control and Prevention (CDC) for 562
his ongoing support of our study; Ricardo Ataíde for assistance during fieldwork and scientific input; 563
and Bernardo Paulo Albe for technical assistance. Finally, we thank Venkatachalam Udhayakumar, 564
Luciana Flannery and Naomi Lucchi from Malaria Laboratory Research and Development Unit at 565
CDC for all the support on the establishment and training of the PET-PCR technique, which was 566
funded by the U.S. Agency for International Development (USAID) through the Amazon Malaria 567
Initiative (AMI). 568
569
.CC-BY-NC-ND 4.0 International licenseIt is made available under a (which was not peer-reviewed) is the author/funder, who has granted bioRxiv a license to display the preprint in perpetuity.
The copyright holder for this preprint. http://dx.doi.org/10.1101/203059doi: bioRxiv preprint first posted online Oct. 13, 2017;

26
REFERENCES 570
American Academy of Pediatrics Committee on Fetus and Newborn, and American College of 571
Obstetricians and Gynecologists Committee on Obstetric Practice. 2015. “The Apgar Score.” 572
Pediatrics 136 (4): 819. doi:10.1542/peds.2015-2651. 573
Ashwal, Stephen, David Michelson, Lauren Plawner, and William B. Dobyns. 2009. “Practice 574
Parameter: Evaluation of the Child with Microcephaly (an Evidence-Based Review).” 575
Neurology 73: 887–97. doi:10.1212/WNL.0b013e3181d5e077. 576
Ataíde, Ricardo, Oscar Murillo, Jamille G. Dombrowski, Rodrigo M. Souza, Flávia A. Lima, 577
Giselle F. M. C. Lima, Angélica D. Hristov, et al. 2015. “Malaria in Pregnancy Interacts with 578
and Alters the Angiogenic Profiles of the Placenta.” PLOS Neglected Tropical Diseases 9 (6): 579
e0003824. doi:10.1371/journal.pntd.0003824. 580
Boksa, Patricia. 2004. “Animal Models of Obstetric Complications in Relation to Schizophrenia.” 581
Brain Research Reviews 45 (1): 1–17. doi:10.1016/j.brainresrev.2004.01.001. 582
Brennan, Teresa L, Sandra G Funk, and Thomas E Frorhingham. 1985. “Disproportionate Intra-583
Uterine Head Growth and Developmental Outcome.” Developmental Medicine & Child 584
Neurology 27: 746–50. 585
Bulmer, J N, F N Rasheed, L Morrison, N Francis, and B M Greenwood. 1993. “Placental Malaria. 586
II. A Semi-Quantitative Investigation of the Pathological Features.” Histopathology 22 (3): 587
219–26. doi:10.1111/j.1365-2559.1993.tb00111.x. 588
Conroy, Andrea L., W. Conrad Liles, Malcolm E. Molyneux, Stephen J. Rogerson, and Kevin C. 589
Kain. 2011. “Performance Characteristics of Combinations of Host Biomarkers to Identify 590
Women with Occult Placental Malaria: A Case-Control Study from Malawi.” PLoS ONE 6 591
(12). doi:10.1371/journal.pone.0028540. 592
Dellicour, Stephanie, Andrew J. Tatem, Carlos A. Guerra, Robert W. Snow, and Feiko O. Ter 593
Kuile. 2010. “Quantifying the Number of Pregnancies at Risk of Malaria in 2007: A 594
Demographic Study.” PLoS Medicine 7 (1): 1–10. doi:10.1371/journal.pmed.1000221. 595
.CC-BY-NC-ND 4.0 International licenseIt is made available under a (which was not peer-reviewed) is the author/funder, who has granted bioRxiv a license to display the preprint in perpetuity.
The copyright holder for this preprint. http://dx.doi.org/10.1101/203059doi: bioRxiv preprint first posted online Oct. 13, 2017;

27
Desai, Meghna, Feiko O ter Kuile, François Nosten, Rose McGready, Kwame Asamoa, Bernard 596
Brabin, and Robert D Newman. 2007. “Epidemiology and Burden of Malaria in Pregnancy.” 597
The Lancet Infectious Diseases 7 (2): 93–104. doi:10.1016/S1473-3099(07)70021-X. 598
Ferreira, Marcelo U., and Marcia C. Castro. 2016. “Challenges for Malaria Elimination in Brazil.” 599
Malaria Journal 15 (1): 284. doi:10.1186/s12936-016-1335-1. 600
Guyatt, Helen L, and Robert W Snow. 2001. “Malaria in Pregnancy as an Indirect Cause of Infant 601
Mortality in Sub-Saharan Africa.” Transactions of the Royal Society of Tropical Medicine and 602
Hygiene 95 (6): 569–76. 603
Heazell, A E P, S J Moll, C J P Jones, P N Baker, and I P Crocker. 2007. “Formation of Syncytial 604
Knots Is Increased by Hyperoxia, Hypoxia and Reactive Oxygen Species.” Placenta 28 Suppl 605
A (April): S33-40. doi:10.1016/j.placenta.2006.10.007. 606
Hosmer, David W., and Stanley Lemeshow. 2013. Applied Logistic Regression. 2nd Ed. New York: 607
Wiley. 608
Hsu, S M, L Raine, and H Fanger. 1981. “A Comparative Study of the Peroxidase-Antiperoxidase 609
Method and an Avidin-Biotin Complex Method for Studying Polypeptide Hormones with 610
Radioimmunoassay Antibodies.” American Journal of Clinical Pathology 75 (5): 734–38. 611
Ismail, M R, J Ordi, C Menendez, P J Ventura, J J Aponte, E Kahigwa, R Hirt, A Cardesa, and P L 612
Alonso. 2000. “Placental Pathology in Malaria: A Histological, Immunohistochemical, and 613
Quantitative Study.” Human Pathology 31 (1): 85–93. doi:http://dx.doi.org/10.1016/S0046-614
8177(00)80203-8. 615
Kohara Melchior, Leonardo Augusto, and Francisco Chiaravalloti Neto. 2016. “Spatial and Spatio-616
Temporal Analysis of Malaria in the State of Acre, Western Amazon, Brazil.” Geospatial 617
Health 11 (3). doi:10.4081/gh.2016.443. 618
Kurinczuk, Jennifer J., Melanie White-Koning, and Nadia Badawi. 2010. “Epidemiology of 619
Neonatal Encephalopathy and Hypoxic-Ischaemic Encephalopathy.” Early Human 620
Development 86 (6): 329–38. doi:10.1016/j.earlhumdev.2010.05.010. 621
.CC-BY-NC-ND 4.0 International licenseIt is made available under a (which was not peer-reviewed) is the author/funder, who has granted bioRxiv a license to display the preprint in perpetuity.
The copyright holder for this preprint. http://dx.doi.org/10.1101/203059doi: bioRxiv preprint first posted online Oct. 13, 2017;
28
Lucchi, Naomi W., Jothikumar Narayanan, Mara A. Karell, Maniphet Xayavong, Simon Kariuki, 622
Alexandre J. DaSilva, Vincent Hill, and Venkatachalam Udhayakumar. 2013. “Molecular 623
Diagnosis of Malaria by Photo-Induced Electron Transfer Fluorogenic Primers: PET-PCR.” 624
PLoS ONE 8 (2): e56677. doi:10.1371/journal.pone.0056677. 625
Magalhães-Barbosa, Maria Clara de, Arnaldo Prata-Barbosa, Jaqueline Rodrigues Robaina, Carlos 626
Eduardo Raymundo, Fernanda Lima-Setta, and Antonio José Ledo Alves da Cunha. 2017. 627
“Prevalence of Microcephaly in Eight South-Eastern and Midwestern Brazilian Neonatal 628
Intensive Care Units: 2011–2015.” Archives of Disease in Childhood 0: 1–7. 629
doi:10.1136/archdischild-2016-311541. 630
Menendez, C, J Ordi, M R Ismail, P J Ventura, J J Aponte, E Kahigwa, F Font, and P L Alonso. 631
2000. “The Impact of Placental Malaria on Gestational Age and Birth Weight.” The Journal of 632
Infectious Diseases 181: 1740–45. 633
Meuris, S, B B Piko, P Eerens, A M Vanbellinghen, M Dramaix, and P Hennart. 1993. “Gestational 634
Malaria: Assessment of Its Consequences on Fetal Growth.” Am J Trop Med Hyg 48 (5): 603–635
9. 636
Ministério da Saúde - Secretaria de Vigilância em Saúde -Brasil. 2015. “Microcefalia: Ministério 637
Da Saúde Divulga Boletim Epidemiológico.” Portal Saúde. 638
http://portalsaude.saude.gov.br/index.php/cidadao/principal/agencia-saude/20805-ministerio-639
da-saude-divulga-boletim-epidemiologico. 640
Nelson, Karin B., and Anna A. Penn. 2015. “Is Infection a Factor in Neonatal Encephalopathy?” 641
Archives of Disease in Childhood - Fetal and Neonatal Edition 100 (1): F8–10. 642
doi:10.1136/archdischild-2014-306192. 643
Neu, Natalie, Jennifer Duchon, and Philip Zachariah. 2015. “TORCH Infections.” Clinics in 644
Perinatology 42 (1). Elsevier Inc: 77–103. doi:10.1016/j.clp.2014.11.001. 645
Passemard, Sandrine, Angela M. Kaindl, and Alain Verloes. 2013. “Microcephaly.” In Handbook of 646
Clinical Neurology Vol. 111, Pediatric Neurology, Part I, edited by Olivier Dulac, Maryse 647
.CC-BY-NC-ND 4.0 International licenseIt is made available under a (which was not peer-reviewed) is the author/funder, who has granted bioRxiv a license to display the preprint in perpetuity.
The copyright holder for this preprint. http://dx.doi.org/10.1101/203059doi: bioRxiv preprint first posted online Oct. 13, 2017;

29
Lassonde, and Harvey Sarnat, 111:129–41. Elsevier B.V. doi:10.1016/B978-0-444-52891-648
9.00013-0. 649
Rogerson, Stephen J, Lars Hviid, Patrick E Duffy, Rose F G Leke, and Diane W Taylor. 2007. 650
“Malaria in Pregnancy: Pathogenesis and Immunity.” The Lancet Infectious Diseases 7 (2): 651
105–17. doi:10.1016/S1473-3099(07)70022-1. 652
Romagosa, Cleofé, Clara Menendez, Mamudo R Ismail, Llorenç Quintó, Berta Ferrer, Pedro L 653
Alonso, and Jaume Ordi. 2004. “Polarisation Microscopy Increases the Sensitivity of 654
Hemozoin and Plasmodium Detection in the Histological Assessment of Placental Malaria.” 655
Acta Tropica 90 (3): 277–84. doi:10.1016/j.actatropica.2004.02.003. 656
Rubin, Donald B. 1996. “Multiple Imputation After 18+ Years.” Journal of the American Statistical 657
Association 91 (434): 473–89. 658
SIVEP - Secretaria de Vigilância em Saúde - Ministério da Saúde. 2015. “Malária: Monitoramento 659
Dos Casos No Brasil Em 2014.” Vol. 46. 660
Soares de Araújo, Juliana Sousa, Cláudio Teixeira Regis, Renata Grigório Silva Gomes, Thiago 661
Ribeiro Tavares, Cícera Rocha dos Santos, Patrícia Melo Assunção, Renata Valéria Nóbrega, 662
Diana de Fátima Alves Pinto, Bruno Vinícius Dantas Bezerra, and Sandra da Silva Mattos. 663
2016. “Microcephaly in North-East Brazil: A Retrospective Study on Neonates Born between 664
2012 and 2015.” Bulletin of the World Health Organization 94 (11): 835–40. 665
doi:10.2471/BLT.16.170639. 666
Souza, Rodrigo M., Ricardo Ataíde, Jamille G. Dombrowski, Vanessa Ippólito, Elizabeth H. 667
Aitken, Suiane N. Valle, José M. Álvarez, Sabrina Epiphânio, and Claudio R F Marinho. 2013. 668
“Placental Histopathological Changes Associated with Plasmodium Vivax Infection during 669
Pregnancy.” PLoS Neglected Tropical Diseases 7 (2): e2071. 670
doi:10.1371/journal.pntd.0002071. 671
Sow, Abdourahmane, Cheikh Loucoubar, Diawo Diallo, Oumar Faye, Youssoupha Ndiaye, Cheikh 672
Saadibou Senghor, Anta Tal Dia, et al. 2016. “Concurrent Malaria and Arbovirus Infections in 673
.CC-BY-NC-ND 4.0 International licenseIt is made available under a (which was not peer-reviewed) is the author/funder, who has granted bioRxiv a license to display the preprint in perpetuity.
The copyright holder for this preprint. http://dx.doi.org/10.1101/203059doi: bioRxiv preprint first posted online Oct. 13, 2017;

30
Kedougou, Southeastern Senegal.” Malaria Journal 15 (1). BioMed Central: 47. 674
doi:10.1186/s12936-016-1100-5. 675
Tetro, Jason A. 2016. “Zika and Microcephaly: Causation, Correlation, or Coincidence?” Microbes 676
and Infection 18 (13). Elsevier Masson SAS: 167–68. doi:10.1016/j.micinf.2015.12.010. 677
Tuominen, Vilppu J, Sanna Ruotoistenmaki, Arttu Viitanen, Mervi Jumppanen, and Jorma Isola. 678
2010. “ImmunoRatio: A Publicly Available Web Application for Quantitative Image Analysis 679
of Estrogen Receptor (ER), Progesterone Receptor (PR), and Ki-67.” Breast Cancer Research 680
12 (4): R56. doi:10.1186/bcr2615. 681
Van Buuren, Stef, and Karin Groothuis-Oudshoorn. 2011. “Mice: Multivariate Imputation by 682
Chained Equations in R.” Journal Of Statistical Software 45 (3): 1–67. 683
doi:10.1177/0962280206074463. 684
Villar, José, Leila Cheikh Ismail, Cesar G Victora, Eric O Ohuma, Enrico Bertino, Doug G Altman, 685
Ann Lambert, et al. 2014. “International Standards for Newborn Weight, Length, and Head 686
Circumference by Gestational Age and Sex: The Newborn Cross-Sectional Study of the 687
INTERGROWTH-21st Project.” The Lancet 384: 857–68. 688
WHO Expert Committee on Physical Status. 1995. Physical Status: The Use and Interpretation of 689
Anthropometry. Geneva: World Health Organization. 690
WHO Multicentre Growth Reference Study Group. 2007. WHO Child Growth Standards: Head 691
Circumference-for-Age, Arm Circumference-for-Age, Triceps Skinfold-for-Age and 692
Subscapular Skinfold-for-Age: Methods and Development. Geneva: World Health 693
Organization. 694
World Health Organization. 2016. “Screening, Assessment and Management of Neonates and 695
Infants with Complications Associated with Zika Virus Exposure in Utero.” WHO Press. 696
doi:http://apps.who.int/iris/bitstream/10665/204475/1/WHO_ZIKV_MOC_16.3_eng.pdf?ua=1 697
World Health Organization. 2017. “World Malaria Report 2017.” Geneve. 698
Zhao, Jing, Yurong Chen, Yuxia Xu, and Guanghuan Pi. 2013. “Effect of Intrauterine Infection on 699
.CC-BY-NC-ND 4.0 International licenseIt is made available under a (which was not peer-reviewed) is the author/funder, who has granted bioRxiv a license to display the preprint in perpetuity.
The copyright holder for this preprint. http://dx.doi.org/10.1101/203059doi: bioRxiv preprint first posted online Oct. 13, 2017;

31
Brain Development and Injury.” International Journal of Developmental Neuroscience 31 (7). 700
International Society for Developmental Neuroscience: 543–49. 701
doi:10.1016/j.ijdevneu.2013.06.008. 702
703
.CC-BY-NC-ND 4.0 International licenseIt is made available under a (which was not peer-reviewed) is the author/funder, who has granted bioRxiv a license to display the preprint in perpetuity.
The copyright holder for this preprint. http://dx.doi.org/10.1101/203059doi: bioRxiv preprint first posted online Oct. 13, 2017;

32
ADDITIONAL FILE 704
Additional file 1: Summary of histopathological evaluation methods. (PDF) 705
Additional file 2: Summary of maternal and newborns characteristics of the Prospective Cohort 706
Study (PCS). (PDF) 707
Additional file 3: Summary of newborns characteristics of the Prospective Cohort Study according 708
with head circumference. (PDF) 709
Additional file 4: Summary of serological screening of TORCH, HIV, Syphilis, Dengue, 710
Chikungunya and Zika infections. (PDF) 711
Additional file 5: Summary of placental parameters evaluation in the Prospective Cohort study 712
according to newborns head circumference. (PDF) 713
Additional file 6: Summary of maternal and newborns characteristics of the Retrospective Cohort 714
Study (RCS). (PDF) 715
.CC-BY-NC-ND 4.0 International licenseIt is made available under a (which was not peer-reviewed) is the author/funder, who has granted bioRxiv a license to display the preprint in perpetuity.
The copyright holder for this preprint. http://dx.doi.org/10.1101/203059doi: bioRxiv preprint first posted online Oct. 13, 2017;

33
FIGURES LEGENDS 716
Figure 1. Map showing the location of the field site, Alto do Juruá river region, Northwest of 717
the Acre State, Brazilian Amazon. The map also indicates Cruzeiro do Sul where the field 718
laboratory is situated, and Rio Branco, the capital of the state of Acre. 719
720
Figure 2. Flow diagram of the two cohort studies detailing exclusion criteria. Mixed infection – 721
P. vivax- and P. falciparum-infection occurring at the same time and/or at different times during 722
pregnancy. 723
724
Figure 3. Prospective cohort study shows that malaria infection during pregnancy impacts 725
babies head circumference. a, b Newborns head circumference frequency distribution in the PCS 726
according to maternal infection status: malaria- and non-infected (NI) mothers (p = 0.005) (a), and 727
NI, Pv, Mixed and Pf-infected mothers after excluding LBW and preterm babies (NI vs Pf p = 728
0.023) (b). The differences in the frequency distributions between each group were examined with 729
Mann-Whitney rank sum tests. c Forest plot of the Odds Ratio of small head or microcephaly in 730
babies born from women infected during pregnancy compared to babies from non-infected women, 731
according to Plasmodium species. Mixed infection – P. vivax- and P. falciparum-infection 732
occurring at the same time and/or at different times during pregnancy. n/N - number of events by 733
total number of individuals in each group; CI - confidence interval; HC - head circumference; SD - 734
standard deviation; P-Values were estimated through multivariate logistic regression methods. 735
736
Figure 4. Histopathological parameters evaluation of placentas from non- and P. falciparum-737
infected mothers according to newborns head circumference. a Leukocytes (CD45+) number. b 738
Monocytes (CD68+) number. c Fibrin deposition score. d Syncytial nuclear aggregates. Images in 739
each panel are only representative. Histopathological parameters were evaluated by microscopy 740
through H&E (fibrin deposition and syncytial nuclear aggregates) and immunohistochemistry 741
.CC-BY-NC-ND 4.0 International licenseIt is made available under a (which was not peer-reviewed) is the author/funder, who has granted bioRxiv a license to display the preprint in perpetuity.
The copyright holder for this preprint. http://dx.doi.org/10.1101/203059doi: bioRxiv preprint first posted online Oct. 13, 2017;

34
(leukocytes and monocytes) staining. NI – non-infected; NI-SH – non-infected small head; Pf-NHC 742
– P. falciparum-infected normal head circumference; Pf-SH - P. falciparum-infected small; and, Pf-743
MC - P. falciparum-infected microcephaly. Data are represented as Tukey boxplots, the bottom and 744
the top of the box are the first and third quartiles, the line inside the box is the median, and the 745
whiskers represent the lowest and the highest data within 1.5 IQR of the first and upper quartiles. 746
The differences between each group were examined with Mann-Whitney rank sum tests, * p ≤ 0.05, 747
** p < 0.01, *** p < 0.001 and **** p < 0.0001. 748
749
Figure 5. Placental plasma levels of angiogenic factors and leptin from non- and P. 750
falciparum-infected mothers according to newborns head circumference. a Angiopoietin-1 751
(ANG-1). b Angiopoietin-2 (ANG-2). c Ratio ANG-2/ANG-1. d Vascular endothelial growth factor 752
(VEGF). e VEGF receptor-1 (VEGFR-1). f VEGF receptor-2 (VEGFR-2). g TEK receptor tyrosine 753
kinase (Tie-2). h Ratio Tie-2/ANG-2. i Leptin. All factors were measured by ELISA. NI – non-754
infected; NI-SH – non-infected small head; Pf-NHC – P. falciparum-infected normal head 755
circumference; Pf-SH - P. falciparum-infected small; and, Pf-MC - P. falciparum-infected 756
microcephaly. Data are represented as Tukey boxplots, the bottom and the top of the box are the 757
first and third quartiles, the line inside the box is the median, and the whiskers represent the lowest 758
and the highest data within 1.5 IQR of the first and upper quartiles. The differences between each 759
group were examined with Mann-Whitney rank sum tests, * p ≤ 0.05, ** p < 0.01. 760
761
Figure 6. Retrospective cohort study corroborates that malaria infection during pregnancy 762
impacts babies head circumference. a, b Newborns head circumference frequency distribution in 763
the PCS according to maternal infection status: malaria- and non-infected (NI) mothers (p = 0.008) 764
(a), and NI, Pv, Mixed and Pf-infected mothers after excluding LBW and preterm babies (NI vs Pf 765
p = 0.015) (b). The differences in the frequency distributions between each group were examined 766
with Mann-Whitney rank sum tests. c Forest plot of the Odds Ratio of small head or microcephaly 767
.CC-BY-NC-ND 4.0 International licenseIt is made available under a (which was not peer-reviewed) is the author/funder, who has granted bioRxiv a license to display the preprint in perpetuity.
The copyright holder for this preprint. http://dx.doi.org/10.1101/203059doi: bioRxiv preprint first posted online Oct. 13, 2017;

35
in babies born from women infected during pregnancy compared to babies from non-infected 768
women, according to Plasmodium species. Mixed infection – P. vivax- and P. falciparum-infection 769
occurring at the same time and/or at different times during pregnancy. n/N - number of events by 770
total number of individuals in each group; CI - confidence interval; HC - head circumference; SD - 771
standard deviation; p-Values were estimated through multivariate logistic regression methods. 772
773
.CC-BY-NC-ND 4.0 International licenseIt is made available under a (which was not peer-reviewed) is the author/funder, who has granted bioRxiv a license to display the preprint in perpetuity.
The copyright holder for this preprint. http://dx.doi.org/10.1101/203059doi: bioRxiv preprint first posted online Oct. 13, 2017;

36
Table 1. Infection characteristics in P. falciparum-infected pregnant women. 774
Pf-NHC
(N=94)
Pf-SH
(N=30) p-Valuea
Pf-MC
(N=8) p-Valueb
Infections per pregnancy, median (IQR) 2.0 (1.0-3.0) 2.0 (1.0-2.0) 0.463 1.0 (1.0-2.0) 0.116
Parasitemia of first infection, median (IQR)c 1.2 (0.3-4.6) 3.8 (0.5-9.2) 0.053 0.4 (0.2-1.8) 0.220
Gestational age at first infection
Mean (SD) 20.7 (10.5) 26.0 (8.1) 0.014
27.6 (7.8) 0.064
Median (IQR) 19.0 (12.0-29.3) 25.5 (18.0-32.5) 28.5 (19.8-34.3)
Placental Malaria, no. (%)d
No 29 (36) 7 (30) - 1 (14) -
Active Acute 8 (10) 2 (8) - 0 -
Active Chronic 5 (6) 2 (8) - 1 (14) -
Past 38 (48) 13 (54) - 5 (72) -
Hemozoin, no. (%)d, e
No 31 (39) 8 (33) - 1 (14) -
Mild 32 (40) 9 (38) - 4 (57) -
Moderate 15 (19) 7 (29) - 2 (29) -
Severe 2 (2) 0 - 0 -
N, number of individuals; Pf-NHC, Plasmodium falciparum-normal head circumference; Pf-SH, 775
Plasmodium falciparum-small head; Pf-MC, Plasmodium falciparum-microcephaly; IQR, 776
interquartile range; SD, standard deviation; no., number of events. 777
a Differences between Pf-NHC and Pf-SH groups were evaluated using Mann-Whitney rank sum 778
tests. 779
b Differences between Pf-NHC and Pf-MC groups were evaluated using Mann-Whitney rank sum 780
tests. 781
c Parasitemia was recorded in 82 Pf-NHC, 28 Pf-SH, and 7 Pf-MC. Values presented in 103 DNA 782
copies, obtained by PET-PCR quantification. 783
d Placental malaria and Hemozoin was recorded in 80 Pf-NHC, 24 Pf-SH, and 7 Pf-MC. 784
e Hemozoin - Mild: focal presence in small amounts; Moderate: small spots or larger deposits in 785
many locations; Severe: large amounts present widely. 786
787
.CC-BY-NC-ND 4.0 International licenseIt is made available under a (which was not peer-reviewed) is the author/funder, who has granted bioRxiv a license to display the preprint in perpetuity.
The copyright holder for this preprint. http://dx.doi.org/10.1101/203059doi: bioRxiv preprint first posted online Oct. 13, 2017;

409 Newborns included in the analysis
158 Non-infected mothers
127 P. vivax-infected mothers
62 Mixed-infected mothers
62 P. falciparum-infected mothers
80 Newborns excluded
48 Alcohol and smoke
16 Eclampsia and pre-eclampsia
15 Other infectious diseases
1 Other comorbidities
41 Newborns excluded
27 Low birth weight
9 Preterm and post-term
3 Miscarriage and stillbirth
1 >1 fetus
1 Congenital anomaly
227 Newborns excluded
167 Eclampsia and pre-eclampsia
47 Other infectious diseases
10 Other comorbidities
3 Alcohol and smoke
461 Newborns excluded
279 Low birth weight
108 Preterm and post-term
56 >1 fetus
13 Miscarriage and stillbirth
5 Congenital anomaly
70 Newborns excluded
Missing data
530 Newborns initially
included
600 Livebirths or stillbirths
[Delivered 01/2013 - 04/2015]
Prospective Cohort Study
4697 Livebirths or stillbirths
[Delivered 01/2012 - 12/2013]
Retrospective Cohort Study
124 Newborns excluded
Missing data
4573 Newborns initially
included
3 Newborns excluded
Undetermined infection
3882 Newborns included in the analysis
3650 Non-infected mothers
129 P. vivax-infected mothers
21 Mixed-infected mothers
82 P. falciparum-infected mothers
.CC-BY-NC-ND 4.0 International licenseIt is made available under a (which was not peer-reviewed) is the author/funder, who has granted bioRxiv a license to display the preprint in perpetuity.
The copyright holder for this preprint. http://dx.doi.org/10.1101/203059doi: bioRxiv preprint first posted online Oct. 13, 2017;
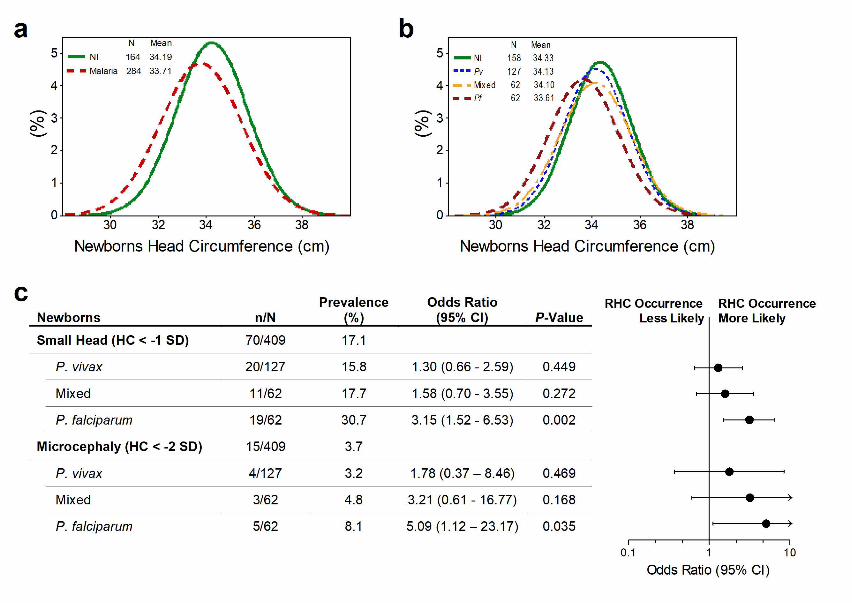
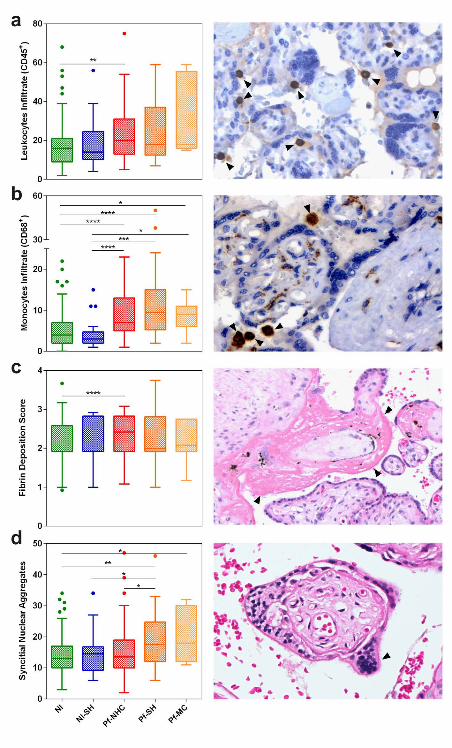
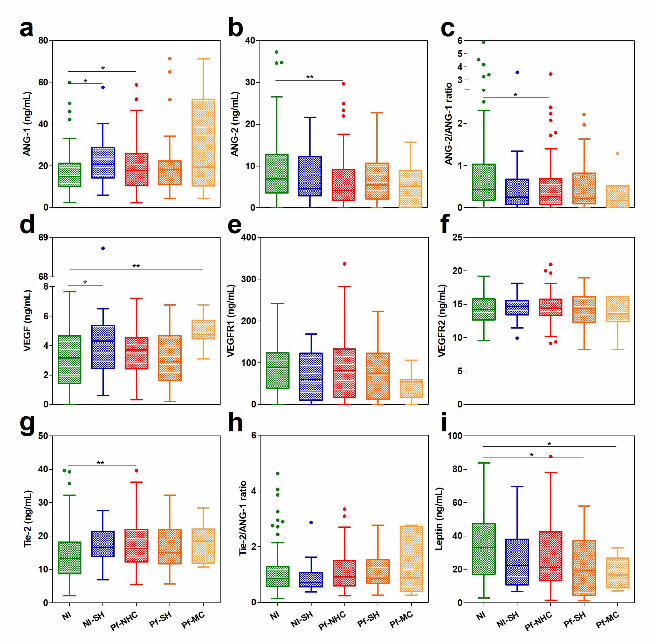

Dombrowskiet.al.
1
Additional file 1: Summary of histopathological evaluation methods. Table 1. Evaluation Methods and Staining Used to Quantify Malaria-Associated Placental Parameters
Evaluation methods Staining
Pathological features
Syncytial nuclear aggregates Number of affected villi per 100 villi at 10× magnification.[1,2] Hematoxylin-Eosin
Fibrin deposition score Semi-quantitative scoring was used for placental fibrin on a scale from 0 to 5. For the extent of fibrin
deposition at the basal and chorionic plates and intervillous fibrin and perivillous fibrin, the following
scale was used to apply a score to each: none (0), scant (1), minimal extension (2), moderate (3),
heavy (4), or extensive (5) at 100× magnification.[1,2]
Hematoxylin-Eosin
Fibrinoid Necrosis Number of intersection points on a random grid that touched areas of necrosis per total points of a
square grid 4 862·43 µm2
of area point at 10× magnification.[1,2]
Hematoxylin-Eosin
Proliferation index The index was calculated by quantitative image analysis of the percentage of positively stained nuclear
area with anti-Ki-67/DAB per the total area of the nuclei, obtained by averaging three images of the
same sample at 20-fold increase. Employing a web available free application for ImageJ.[3]
Immunohistochemistry
Villous vascularity Number of fetal vessels labeled with anti-CD31 in ten villi terminals at 20× magnification in the Axio
Scan.Z1 scanning system.
Immunohistochemistry
Leukocytes infiltrate (CD45+
) Number of leukocyte cells in 10 fields at 400× magnification. Immunohistochemistry
Monocytes infiltrate (CD68+
) Number of monocyte cells in 10 fields at 400× magnification.[4–6] Immunohistochemistry
Malaria-associated features
Parasitized erythrocytes Number of fields with parasite in 100 fields at 1000× magnification. Giemsa
Hemozoin Sixty fields at 40× magnification were screened with polarized light for the presence of hemozoin in the
intervillous space (free or within cells) and in the tissue.[7]
Hematoxylin-Eosin
.CC-BY-NC-ND 4.0 International licenseIt is made available under a (which was not peer-reviewed) is the author/funder, who has granted bioRxiv a license to display the preprint in perpetuity.
The copyright holder for this preprint. http://dx.doi.org/10.1101/203059doi: bioRxiv preprint first posted online Oct. 13, 2017;

Dombrowskiet.al.
2
REFERENCES 1. Souza RM, Ataíde R, Dombrowski JG, Ippólito V, Aitken EH, Valle SN, et al. Placental Histopathological Changes Associated with Plasmodium vivax Infection during Pregnancy. PLoS Negl. Trop. Dis. 2013;7:e2071. 2. Avery JW, Smith GM, Owino SO, Sarr D, Nagy T, Mwalimu S, et al. Maternal malaria induces a procoagulant and antifibrinolytic state that is embryotoxic but responsive to anticoagulant therapy. PLoS One. Public Library of Science; 2012;7:e31090. 3. Tuominen VJ, Ruotoistenmaki S, Viitanen A, Jumppanen M, Isola J. ImmunoRatio: a publicly available web application for quantitative image analysis of estrogen receptor (ER), progesterone receptor (PR), and Ki-67. Breast Cancer Res. 2010;12:R56. 4. Ataíde R, Murillo O, Dombrowski JG, Souza RM, Lima FA, Lima GFMC, et al. Malaria in Pregnancy Interacts with and Alters the Angiogenic Profiles of the Placenta. PLoS Negl. Trop. Dis. 2015;9:e0003824. 5. Hsu SM, Raine L, Fanger H. A comparative study of the peroxidase-antiperoxidase method and an avidin-biotin complex method for studying polypeptide hormones with radioimmunoassay antibodies. Am. J. Clin. Pathol. 1981;75:734–8. 6. Maley SW, Buxton D, Macaldowie CN, Anderson IE, Wright SE, Bartley PM, et al. Characterization of the immune response in the placenta of cattle experimentally infected with Neospora caninum in early gestation. J. Comp. Pathol. 2006;135:130–41. 7. Romagosa C, Menendez C, Ismail MR, Quintó L, Ferrer B, Alonso PL, et al. Polarisation microscopy increases the sensitivity of hemozoin and Plasmodium detection in the histological assessment of placental malaria. Acta Trop. 2004;90:277–84.
.CC-BY-NC-ND 4.0 International licenseIt is made available under a (which was not peer-reviewed) is the author/funder, who has granted bioRxiv a license to display the preprint in perpetuity.
The copyright holder for this preprint. http://dx.doi.org/10.1101/203059doi: bioRxiv preprint first posted online Oct. 13, 2017;

Dombrowskiet.al.
1
Additional file 2: Summary of maternal and newborns characteristics of the Prospective Cohort Study (PCS). Table 1. Baseline characteristics of mothers
N, number of individuals; SD, standard deviation; IQR, interquartile range; no., number of events. a Maternal weight gain was recorded in 153 non-infected, 107 P. vivax, 56 mixed-infected and 49 P. falciparum
pregnant women. It was determined by subtracting the initial pregnancy weight from the final weight. b Hematocrit was recorded in 107 non-infected, 86 P. vivax, 43 mixed-infected and 35 P. falciparum pregnant
women. c Hemoglobin was recorded in 107 non-infected, 85 P. vivax, 43 mixed-infected and 35 P. falciparum pregnant
women. d Placental weight was recorded in 148 non-infected, 108 P. vivax, 57 mixed-infected and 48 P. falciparum
pregnant women. e The number of antenatal care visits was recorded in 153 non-infected, 120 P. vivax, 59 mixed-infected and 57 P.
falciparum pregnant women.
Mothers’ Characteristics Non-Infected (N=158)
P. vivax (N=127)
Mixed (N=62)
P. falciparum (N=62)
Maternal age (years), mean (SD) 24.3 (6.2) 22.2 (6.2) 23.3 (5.8) 23.1 (6.3)
Gravidity, no. (%)
Primigravida 72 (45.6) 51 (40.2) 19 (30.7) 23 (37.1)
Multigravida 86 (54.4) 76 (59.8) 43 (69.3) 39 (62.9)
Gestational age at delivery (weeks)
Mean (SD) 39.7 (1.2) 39.6 (1.3) 39.5 (1.2) 39.6 (1.3)
Median (IQR) 40.0 (39.0-40.0) 40.0 (39.0-41.0) 40.0 (39.0-40.0) 39.5 (39.0-40.0)
C-section, no. (%) 90 (57.0) 51 (40.2) 27 (43.6) 23 (37.1)
Maternal weight gain (Kg), mean (SD)a 13.6 (5.0) 11.2 (5.0) 12.0 (5.0) 11.8 (5.2)
Hematocrit (%), mean (SD)b 36.2 (3.5) 35.3 (3.9) 34.9 (4.0) 34.2 (4.3)
Hemoglobin (g/dL), mean (SD)c 11.9 (1.2) 11.6 (1.3) 11.5 (1.3) 11.2 (1.4)
Placental weight (g), mean (SD)d
Primigravida 578.8 (97.0) 558.7 (102.2) 533.3 (63.1) 568.0 (129.2)
Multigravida 608.0 (112.2) 601.5 (148.9) 578.8 (108.8) 592.6 (159.1)
Antenatal care visits, mean (SD)e 7.9 (2.3) 6.4 (2.5) 6.3 (2.3) 5.6 (2.8) Previous malaria episodes during current pregnancy, no. (%) - 37 (29.1) 30 (48.4) 7 (11.3)
.CC-BY-NC-ND 4.0 International licenseIt is made available under a (which was not peer-reviewed) is the author/funder, who has granted bioRxiv a license to display the preprint in perpetuity.
The copyright holder for this preprint. http://dx.doi.org/10.1101/203059doi: bioRxiv preprint first posted online Oct. 13, 2017;
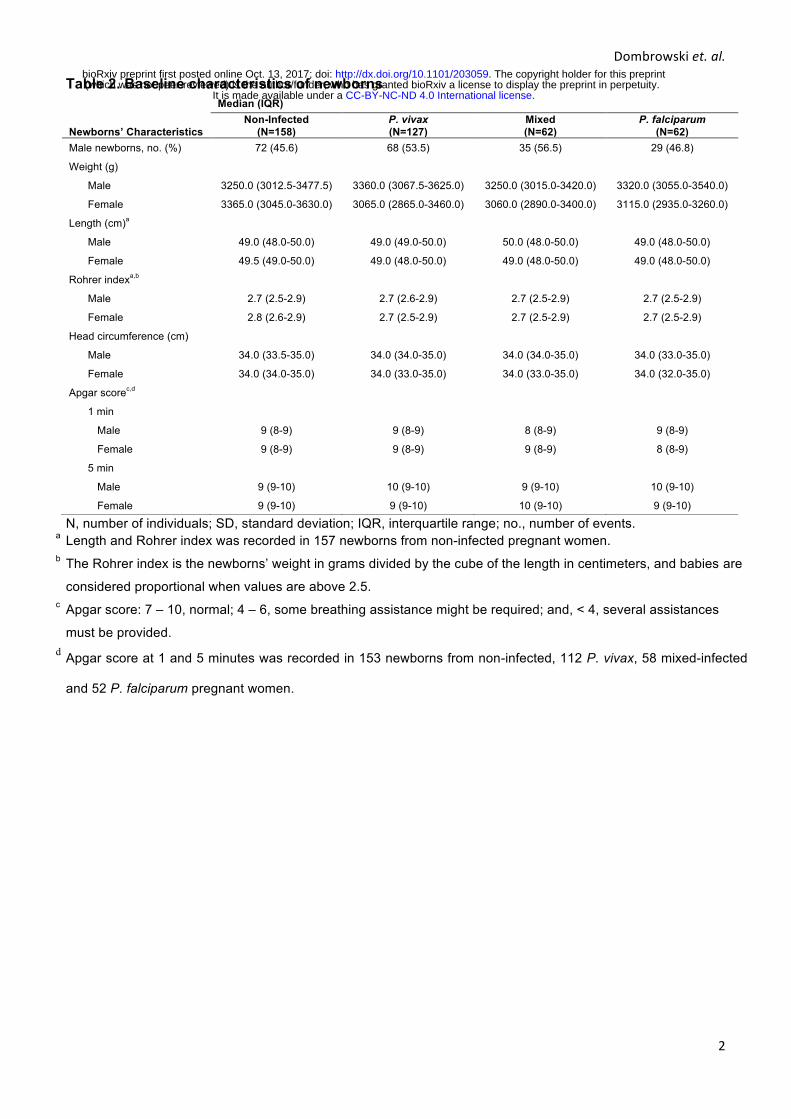
Dombrowskiet.al.
2
Table 2. Baseline characteristics of newborns
N, number of individuals; SD, standard deviation; IQR, interquartile range; no., number of events. a Length and Rohrer index was recorded in 157 newborns from non-infected pregnant women. b The Rohrer index is the newborns’ weight in grams divided by the cube of the length in centimeters, and babies are
considered proportional when values are above 2.5. c Apgar score: 7 – 10, normal; 4 – 6, some breathing assistance might be required; and, < 4, several assistances
must be provided. d Apgar score at 1 and 5 minutes was recorded in 153 newborns from non-infected, 112 P. vivax, 58 mixed-infected
and 52 P. falciparum pregnant women.
Newborns’ Characteristics
Median (IQR) Non-Infected
(N=158) P. vivax (N=127)
Mixed (N=62)
P. falciparum (N=62)
Male newborns, no. (%) 72 (45.6) 68 (53.5) 35 (56.5) 29 (46.8)
Weight (g)
Male 3250.0 (3012.5-3477.5) 3360.0 (3067.5-3625.0) 3250.0 (3015.0-3420.0) 3320.0 (3055.0-3540.0)
Female 3365.0 (3045.0-3630.0) 3065.0 (2865.0-3460.0) 3060.0 (2890.0-3400.0) 3115.0 (2935.0-3260.0)
Length (cm)a
Male 49.0 (48.0-50.0) 49.0 (49.0-50.0) 50.0 (48.0-50.0) 49.0 (48.0-50.0)
Female 49.5 (49.0-50.0) 49.0 (48.0-50.0) 49.0 (48.0-50.0) 49.0 (48.0-50.0)
Rohrer indexa,b
Male 2.7 (2.5-2.9) 2.7 (2.6-2.9) 2.7 (2.5-2.9) 2.7 (2.5-2.9)
Female 2.8 (2.6-2.9) 2.7 (2.5-2.9) 2.7 (2.5-2.9) 2.7 (2.5-2.9)
Head circumference (cm)
Male 34.0 (33.5-35.0) 34.0 (34.0-35.0) 34.0 (34.0-35.0) 34.0 (33.0-35.0)
Female 34.0 (34.0-35.0) 34.0 (33.0-35.0) 34.0 (33.0-35.0) 34.0 (32.0-35.0)
Apgar scorec,d
1 min
Male 9 (8-9) 9 (8-9) 8 (8-9) 9 (8-9)
Female 9 (8-9) 9 (8-9) 9 (8-9) 8 (8-9)
5 min
Male 9 (9-10) 10 (9-10) 9 (9-10) 10 (9-10)
Female 9 (9-10) 9 (9-10) 10 (9-10) 9 (9-10)
.CC-BY-NC-ND 4.0 International licenseIt is made available under a (which was not peer-reviewed) is the author/funder, who has granted bioRxiv a license to display the preprint in perpetuity.
The copyright holder for this preprint. http://dx.doi.org/10.1101/203059doi: bioRxiv preprint first posted online Oct. 13, 2017;

Dombrowskiet.al.
1
Additional file 3: Summary of newborns characteristics of the Prospective Cohort Study according with head circumference. Table 3. Baseline Characteristics of Newborns at Delivery of Non-Infected and P. falciparum-infected Pregnant Women
Newborns’ Characteristics
Median (IQR) Non-Infected
(N:M=59, F=79) NI-SH
(N:M=13, F=7) Pf-NHC
(N:M=49, F=45) Pf-SH
(N:M=15, F=15) Pf-MC
(N:M=3, F=5) Weight (g)
Male 3305.0 (3045.0-3530.0) 2900.0 (2800.0-3125.0) 3320.0 (3135.0-3530.0) 3030.0 (2790.0-3160.0) 2790.0 (2735.0-4300.0) Female 3400.0 (3055.0-3690.0) 3000.0 (2890.0-3240.0) 3170.0 (2960.0-3390.0) 2910.0 (2700.0-3100.0) 2905.0 (2870.0-2910.0)
Length (cm)a Male 49.0 (48.0-50.0) 48.0 (48.0-49.0) 50.0 (48.0-51.0) 49.0 (48.0-50.0) 49.0 (48.0-54.0) Female 50.0 (49.0-50.0) 48.0 (47.0-50.0) 49.0 (48.0-50.0) 48.0 (47.0-50.0) 48.0 (47.0-49.0)
Rohrer indexa, b Male 2.8 (2.6-3.0) 2.6 (2.4-2.7) 2.7 (2.6-3.0) 2.5 (2.4-2.7) 2.5 (2.3-2.7) Female 2.8 (2.6-2.9) 2.7 (2.4-3.0) 2.7 (2.5-2.9) 2.6 (2.3-2.8) 2.6 (2.3-2.8)
Head circumference (cm) Male 35.0 (34.0-36.0) 33.0 (32.0-33.0) 35.0 (34.0-35.0) 32.0 (32.0-33.0) 32.0 (31.0-32.0) Female 34.0 (34.0-35.0) 32.0 (31.0-32.5) 34.0 (34.0-35.0) 32.0 (31.0-32.0) 30.0 (30.0-31.0)
Apgar scorec, d 1 min
Male 8.0 (8.0-9.0) 9.0 (8.5-9 0) 8.0 (8.0-9.0) 9.0 (8.0-9.0) 8.5 (8.0-9.0) Female 9.0 (8.0-9.0) 8.0 (6.0-9.0) 8.0 (8.0-9.0) 9.0 (8.5-9.0) 9.0 (9.0-9.0)
5 min Male 9.0 (9.0-10.0) 10.0 (9.0-10.0) 9.0 (9.0-10.0) 10.0 (9.0-10.0) 9.5 (9.0-10.0) Female 9.0 (9.0-10.0) 9.0 (9.0-10.0) 9.0 (9.0-10.0) 10.0 (9.5-10.0) 10.0 (10.0-10.0)
IQR, interquartile range, N, number of newborns; M, male newborns; F, female newborns, NI-SH, Non-Infected small head; Pf-NHC, Plasmodium falciparum-normal head
circumference; Pf-SH, Plasmodium falciparum-small head; Pf-MC, Plasmodium falciparum-microcephaly. a Length and Rohrer index were recorded in 58 males from the Non-infected group. b The Rohrer index is the newborns’ weight in grams divided by the cube of the length in centimeters, and babies are considered proportional when values are above 2.5. c Apgar score was recorded in 57 males and 77 females from the Non-infected group; in 12 males from the NI-SH group; in 45 males and 39 females from the Pf-NHC
group; in 14 males and 12 females from the Pf-SH group; and, in 2 males from the Pf-MC group. d Apgar score: 7 – 10, normal; 4 – 6, some breathing assistance might be required; and, < 4, several assistances must be provided.
.CC-BY-NC-ND 4.0 International licenseIt is made available under a (which was not peer-reviewed) is the author/funder, who has granted bioRxiv a license to display the preprint in perpetuity.
The copyright holder for this preprint. http://dx.doi.org/10.1101/203059doi: bioRxiv preprint first posted online Oct. 13, 2017;
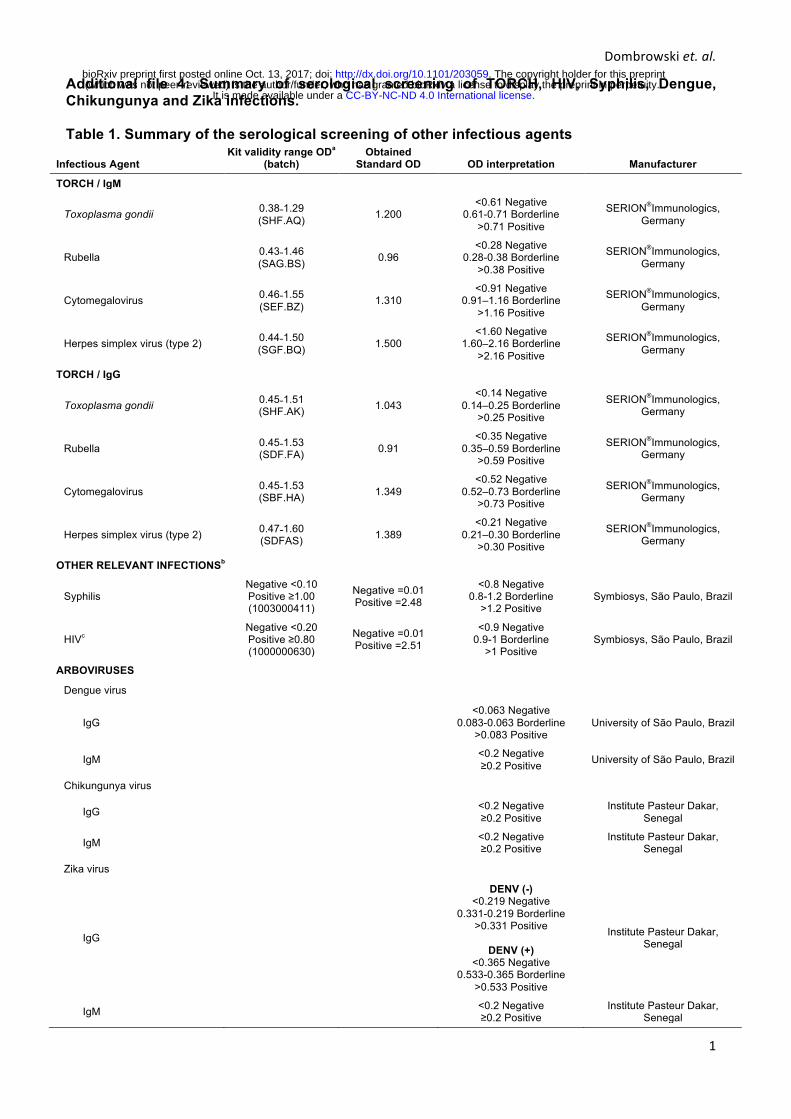
Dombrowskiet.al.
1
Additional file 4: Summary of serological screening of TORCH, HIV, Syphilis, Dengue, Chikungunya and Zika infections. Table 1. Summary of the serological screening of other infectious agents
Infectious Agent Kit validity range ODa
(batch) Obtained
Standard OD OD interpretation Manufacturer
TORCH / IgM
Toxoplasma gondii 0.38˗1.29 (SHF.AQ) 1.200
<0.61 Negative 0.61-0.71 Borderline
>0.71 Positive
SERION®Immunologics, Germany
Rubella 0.43˗1.46 (SAG.BS) 0.96
<0.28 Negative 0.28-0.38 Borderline
>0.38 Positive
SERION®Immunologics, Germany
Cytomegalovirus 0.46˗1.55 (SEF.BZ) 1.310
<0.91 Negative 0.91–1.16 Borderline
>1.16 Positive
SERION®Immunologics, Germany
Herpes simplex virus (type 2) 0.44˗1.50 (SGF.BQ) 1.500
<1.60 Negative 1.60–2.16 Borderline
>2.16 Positive
SERION®Immunologics, Germany
TORCH / IgG
Toxoplasma gondii 0.45˗1.51 (SHF.AK) 1.043
<0.14 Negative 0.14–0.25 Borderline
>0.25 Positive
SERION®Immunologics, Germany
Rubella 0.45˗1.53 (SDF.FA) 0.91
<0.35 Negative 0.35–0.59 Borderline
>0.59 Positive
SERION®Immunologics, Germany
Cytomegalovirus 0.45˗1.53 (SBF.HA) 1.349
<0.52 Negative 0.52–0.73 Borderline
>0.73 Positive
SERION®Immunologics, Germany
Herpes simplex virus (type 2) 0.47˗1.60 (SDFAS) 1.389
<0.21 Negative 0.21–0.30 Borderline
>0.30 Positive
SERION®Immunologics, Germany
OTHER RELEVANT INFECTIONSb
Syphilis Negative <0.10 Positive ≥1.00 (1003000411)
Negative =0.01 Positive =2.48
<0.8 Negative 0.8-1.2 Borderline
>1.2 Positive Symbiosys, São Paulo, Brazil
HIVc Negative <0.20 Positive ≥0.80 (1000000630)
Negative =0.01 Positive =2.51
<0.9 Negative 0.9-1 Borderline
>1 Positive Symbiosys, São Paulo, Brazil
ARBOVIRUSES
Dengue virus
IgG <0.063 Negative
0.083-0.063 Borderline >0.083 Positive
University of São Paulo, Brazil
IgM <0.2 Negative ≥0.2 Positive University of São Paulo, Brazil
Chikungunya virus
IgG <0.2 Negative ≥0.2 Positive
Institute Pasteur Dakar, Senegal
IgM <0.2 Negative ≥0.2 Positive
Institute Pasteur Dakar, Senegal
Zika virus
IgG
DENV (-) <0.219 Negative
0.331-0.219 Borderline >0.331 Positive
DENV (+)
<0.365 Negative 0.533-0.365 Borderline
>0.533 Positive
Institute Pasteur Dakar, Senegal
IgM <0.2 Negative ≥0.2 Positive
Institute Pasteur Dakar, Senegal
.CC-BY-NC-ND 4.0 International licenseIt is made available under a (which was not peer-reviewed) is the author/funder, who has granted bioRxiv a license to display the preprint in perpetuity.
The copyright holder for this preprint. http://dx.doi.org/10.1101/203059doi: bioRxiv preprint first posted online Oct. 13, 2017;

Dombrowskiet.al.
2
OD, optical density. a The kit validity range is according to the batch. b Total antibodies. The validity range was verified through a negative and positive standard OD obtained in
each test. c Isotypes 1 and 2.
.CC-BY-NC-ND 4.0 International licenseIt is made available under a (which was not peer-reviewed) is the author/funder, who has granted bioRxiv a license to display the preprint in perpetuity.
The copyright holder for this preprint. http://dx.doi.org/10.1101/203059doi: bioRxiv preprint first posted online Oct. 13, 2017;
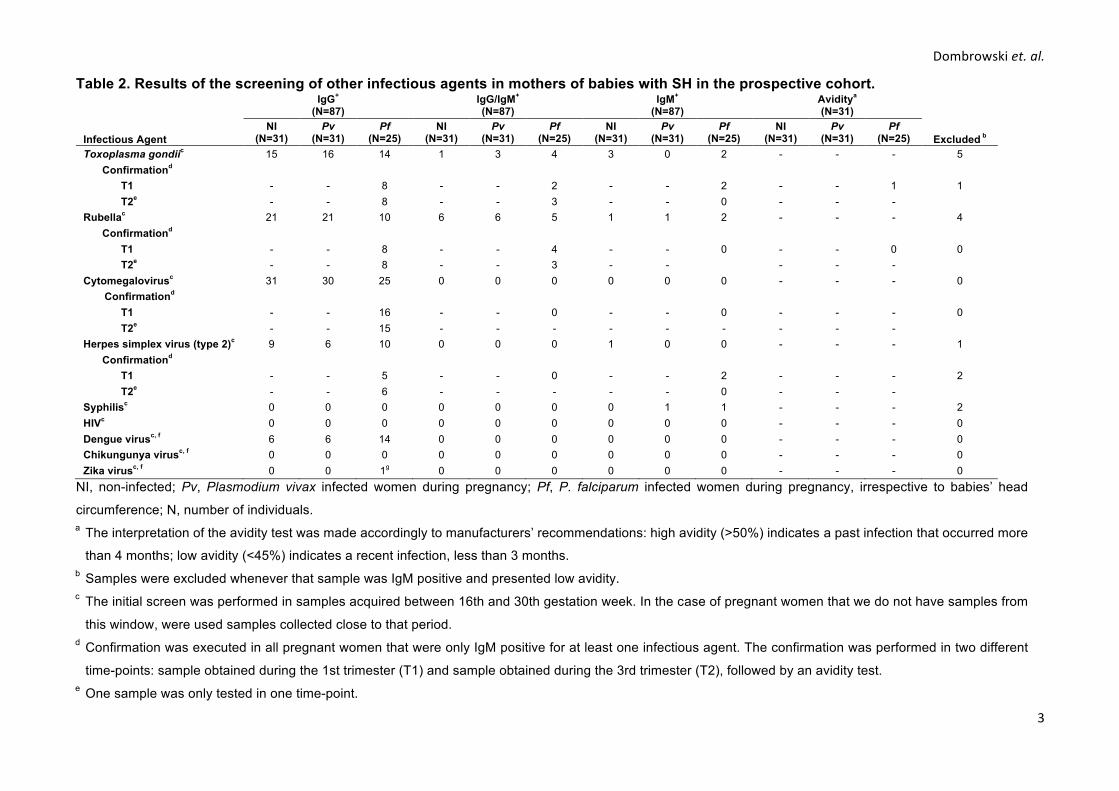
Dombrowskiet.al.
3
Table 2. Results of the screening of other infectious agents in mothers of babies with SH in the prospective cohort.
Infectious Agent
IgG+ (N=87)
IgG/IgM+ (N=87)
IgM+
(N=87) Aviditya (N=31)
Excluded b NI
(N=31) Pv
(N=31) Pf
(N=25) NI
(N=31) Pv
(N=31) Pf
(N=25) NI
(N=31) Pv
(N=31) Pf
(N=25) NI
(N=31) Pv
(N=31) Pf
(N=25) Toxoplasma gondiic 15 16 14 1 3 4 3 0 2 - - - 5
Confirmationd
1 T1 - - 8 - - 2 - - 2 - - 1
T2e - - 8 - - 3 - - 0 - - -
Rubellac 21 21 10 6 6 5 1 1 2 - - - 4
Confirmationd
0 T1 - - 8 - - 4 - - 0 - - 0
T2e - - 8 - - 3 - - - - -
Cytomegalovirusc 31 30 25 0 0 0 0 0 0 - - - 0
Confirmationd
0 T1 - - 16 - - 0 - - 0 - - -
T2e - - 15 - - - - - - - - -
Herpes simplex virus (type 2)c 9 6 10 0 0 0 1 0 0 - - - 1
Confirmationd
2 T1 - - 5 - - 0 - - 2 - - -
T2e - - 6 - - - - - 0 - - -
Syphilisc 0 0 0 0 0 0 0 1 1 - - - 2
HIVc 0 0 0 0 0 0 0 0 0 - - - 0
Dengue virusc, f 6 6 14 0 0 0 0 0 0 - - - 0
Chikungunya virusc, f 0 0 0 0 0 0 0 0 0 - - - 0
Zika virusc, f 0 0 1g 0 0 0 0 0 0 - - - 0
NI, non-infected; Pv, Plasmodium vivax infected women during pregnancy; Pf, P. falciparum infected women during pregnancy, irrespective to babies’ head
circumference; N, number of individuals. a The interpretation of the avidity test was made accordingly to manufacturers’ recommendations: high avidity (>50%) indicates a past infection that occurred more
than 4 months; low avidity (<45%) indicates a recent infection, less than 3 months. b Samples were excluded whenever that sample was IgM positive and presented low avidity. c The initial screen was performed in samples acquired between 16th and 30th gestation week. In the case of pregnant women that we do not have samples from
this window, were used samples collected close to that period. d Confirmation was executed in all pregnant women that were only IgM positive for at least one infectious agent. The confirmation was performed in two different
time-points: sample obtained during the 1st trimester (T1) and sample obtained during the 3rd trimester (T2), followed by an avidity test. e One sample was only tested in one time-point.
.CC-BY-NC-ND 4.0 International licenseIt is made available under a (which was not peer-reviewed) is the author/funder, who has granted bioRxiv a license to display the preprint in perpetuity.
The copyright holder for this preprint. http://dx.doi.org/10.1101/203059doi: bioRxiv preprint first posted online Oct. 13, 2017;

Dombrowskiet.al.
4
f Tested only in 8 NI, 10 Pv, and 19 Pf for IgG; and 8 NI, 10 Pv, and 19 Pf for IgM.
g The sample that was IgG positive for Zika virus was considered a possible cross-reaction with another flavivirus, as the absorbance levels were at borderline. Until 2016 there were no reported cases of Zika virus infection in Acre state
.CC-BY-NC-ND 4.0 International licenseIt is made available under a (which was not peer-reviewed) is the author/funder, who has granted bioRxiv a license to display the preprint in perpetuity.
The copyright holder for this preprint. http://dx.doi.org/10.1101/203059doi: bioRxiv preprint first posted online Oct. 13, 2017;

Dombrowskiet.al.
Additional file 5: Summary of placental parameters evaluation in the Prospective Cohort study according to newborns head circumference. Table 1. Placental histological parameters and angiogenic factors of non-infected and P. falciparum-infected pregnant women
Characteristics
Median (IQR) Non-Infected
(N=128) Non-Infected-SH
(N=20) p-Valuea Pf-NHC (N=80) p-Valueb
Pf-SH (N=24) p-Valuec
Pf-MC (N=7) p-Valued
Placental histological parameters
Leukocytes infiltratee 16.0 (9.0-21.0) 14.0 (10.5-24.0) 0.905 20.0 (13.0-31.0) 0.001 18.0 (14.0-35.0) 0.073 18.0 (17.0-52.0) 0.083
Monocytes infiltratef 4.0 (2.0-7.0) 3.0 (2.0-4.5) 0.325 7.0 (5.0-13.0)g <0.0001 9.5 (5.5-15.0)h <0.0001 9.0 (6.0-11.0)i 0.018
Fibrin deposition score 1.9 (1.9-2.4) 1.9 (1.9-2.8) 0.446 2.4 (1.9-2.8) <0.0001 2.0 (1.9-2.8) 0.196 2.1 (1.9-2.8) 0.557
Fibrinoid necrosisj 6.0 (3.8-10.2) 7.2 (4.5-10.3) 0.707 7.1 (4.3-10.0) 0.425 6.8 (4.0-9.8) 0.898 8.1 (2.9-9.4) 0.937
Proliferation indexk 3.6 (2.5-4.9) 3.6 (2.5-4.4) 0.281 3.8 (2.8-4.8) 0.613 3.7 (2.9-4.2) 0.716 3.0 (2.6-3.5) 0.208
Villous vascularityl 4.0 (3.6-4.5) 3.9 (3.4-4.4) 0.553 4.0 (3.4-4.5) 0.887 4.1 (3.6-4.6) 0.321 3.8 (3.6-3.9) 0.351
Syncytial nuclear aggregates 13.0 (10.0-17.0) 14.5 (9.5-16.5) 0.588 13.5 (10.0-19.0) 0.352 17.5 (12.0-24.5)m, n 0.002 18.0 (12.0-30.0) 0.023
Angiogenic factors (ng/mL)o
ANG-1p 14.9 (10.2-21.1) 20.8 (14.2-28.8) 0.024 17.7 (10.6-25.9) 0.047 18.1 (11.2-22.3) 0.275 19.4 (10.4-51.7) 0.468
ANG-2 7.0 (3.5-12.8) 4.6 (3.0-11.5) 0.465 4.2 (1.8-9.1) 0.007 5.5 (2.2-10.0) 0.088 5.1 (0-8.9) 0.120
ANG-2/ANG-1 ratio 0.4 (0.2-1.0) 0.3 (0.1-0.7) 0.089 0.3 (0.1-0.7) 0.010 0.2 (0.1-0.8) 0.104 0.2 (0-0.5) 0.077
Tie-2 13.2 (8.7-18.1) 16.6 (14.8-21.2) 0.075 16.2 (12.2-21.9) 0.002 15.1 (11.7-21.7) 0.074 18.5 (11.8-22.1) 0.154
Tie-2/ANG-1 ratio 0.9 (0.6-1.3) 0.7 (0.6-1.1) 0.456 0.9 (0.6-1.5) 0.384 0.9 (0.7-1.5) 0.520 0.9 (0.4-2.7) 0.940
VEGFp 3.2 (1.5-4.6) 4.3 (2.5-5.4) 0.032 3.7 (2.4-4.5) 0.097 2.9 (1.6-4.7) 0.834 4.8 (4.5-5.7) 0.009
VEGFR1 89.6 (38.9-123.3) 60.4 (11.5-121.3) 0.280 81.1 (16.4-133.1) 0.715 74.7 (13.0-121.8) 0.494 54.2 (17.2-60.6) 0.071
VEGFR-2 14.2 (12.7-15.8) 14.7 (13.5-15.6) 0.406 14.4 (13.3-15.7) 0.359 14.3 (12.3-16.2) 0.868 13.6 (12.4-16.1) 0.611
Leptin (ng/mL)q 33.1 (17.2-47.4) 22.5 (10.7-37.5) 0.127 21.2 (13.8-42.3) 0.051 19.5 (4.5-37.2) 0.013 16.7 (9.0-26.7) 0.027
N, number of individuals; Non-Infected-SH, non-infected-small head; Pf-NHC, Plasmodium falciparum-normal head circumference; Pf-SH, Plasmodium falciparum-
small head; Pf-MC, Plasmodium falciparum-microcephaly; IQR, interquartile range. a Differences between Non-Infected and Non-Infected-SH groups were evaluated using Mann-Whitney rank sum tests. b Differences between Non-Infected and Pf-NHC groups were evaluated using Mann-Whitney rank sum tests. c Differences between Non-Infected and Pf-SH groups were evaluated using Mann-Whitney rank sum tests. d Differences between Non-Infected and Pf-MC groups were evaluated using Mann-Whitney rank sum tests. e Leukocyte infiltrate (CD45+) was recorded in placentas from 126 non-infected, 54 Pf-NHC, 17 Pf-SH and 5 Pf-MC pregnant women. f Monocytes infiltrate (CD68+) was recorded in placentas from 127 non-infected pregnant women. g Statistical difference for the comparison of Non-Infected-SH versus Pf-NHC, p < 0.0001.
.CC-BY-NC-ND 4.0 International licenseIt is made available under a (which was not peer-reviewed) is the author/funder, who has granted bioRxiv a license to display the preprint in perpetuity.
The copyright holder for this preprint. http://dx.doi.org/10.1101/203059doi: bioRxiv preprint first posted online Oct. 13, 2017;
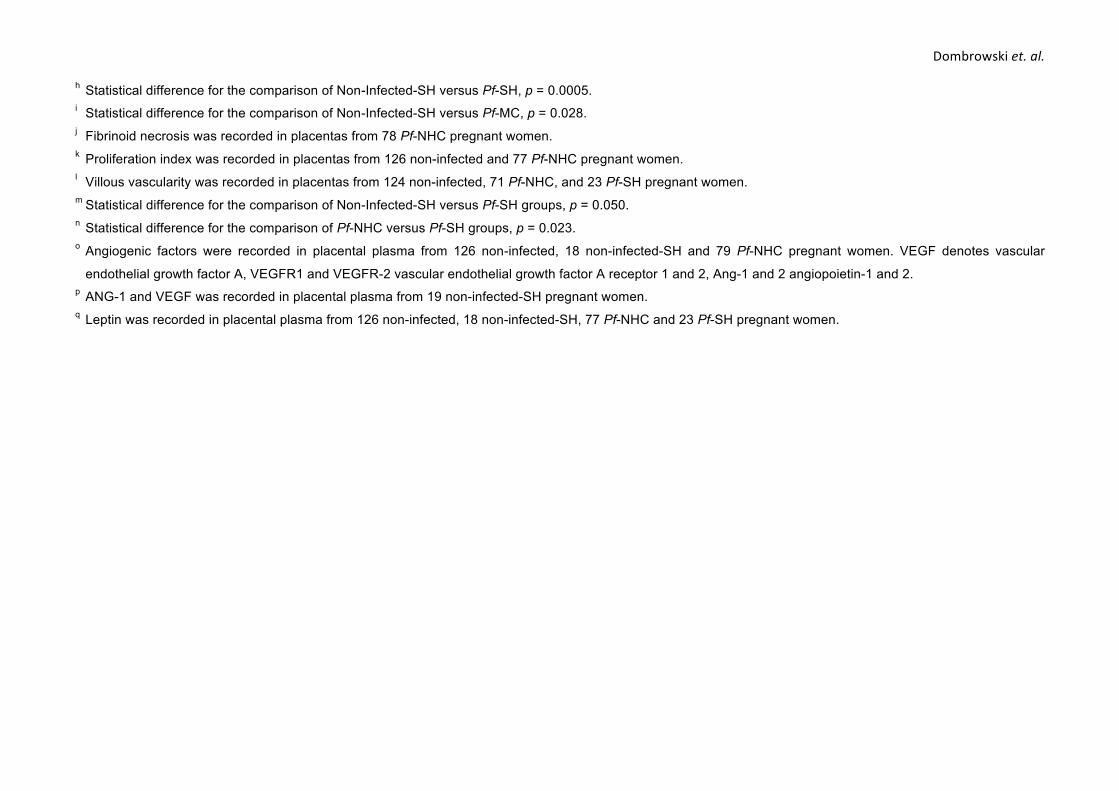
Dombrowskiet.al.h Statistical difference for the comparison of Non-Infected-SH versus Pf-SH, p = 0.0005. i Statistical difference for the comparison of Non-Infected-SH versus Pf-MC, p = 0.028. j Fibrinoid necrosis was recorded in placentas from 78 Pf-NHC pregnant women. k Proliferation index was recorded in placentas from 126 non-infected and 77 Pf-NHC pregnant women. l Villous vascularity was recorded in placentas from 124 non-infected, 71 Pf-NHC, and 23 Pf-SH pregnant women. m Statistical difference for the comparison of Non-Infected-SH versus Pf-SH groups, p = 0.050. n Statistical difference for the comparison of Pf-NHC versus Pf-SH groups, p = 0.023. o Angiogenic factors were recorded in placental plasma from 126 non-infected, 18 non-infected-SH and 79 Pf-NHC pregnant women. VEGF denotes vascular
endothelial growth factor A, VEGFR1 and VEGFR-2 vascular endothelial growth factor A receptor 1 and 2, Ang-1 and 2 angiopoietin-1 and 2. p ANG-1 and VEGF was recorded in placental plasma from 19 non-infected-SH pregnant women. q Leptin was recorded in placental plasma from 126 non-infected, 18 non-infected-SH, 77 Pf-NHC and 23 Pf-SH pregnant women.
.CC-BY-NC-ND 4.0 International licenseIt is made available under a (which was not peer-reviewed) is the author/funder, who has granted bioRxiv a license to display the preprint in perpetuity.
The copyright holder for this preprint. http://dx.doi.org/10.1101/203059doi: bioRxiv preprint first posted online Oct. 13, 2017;
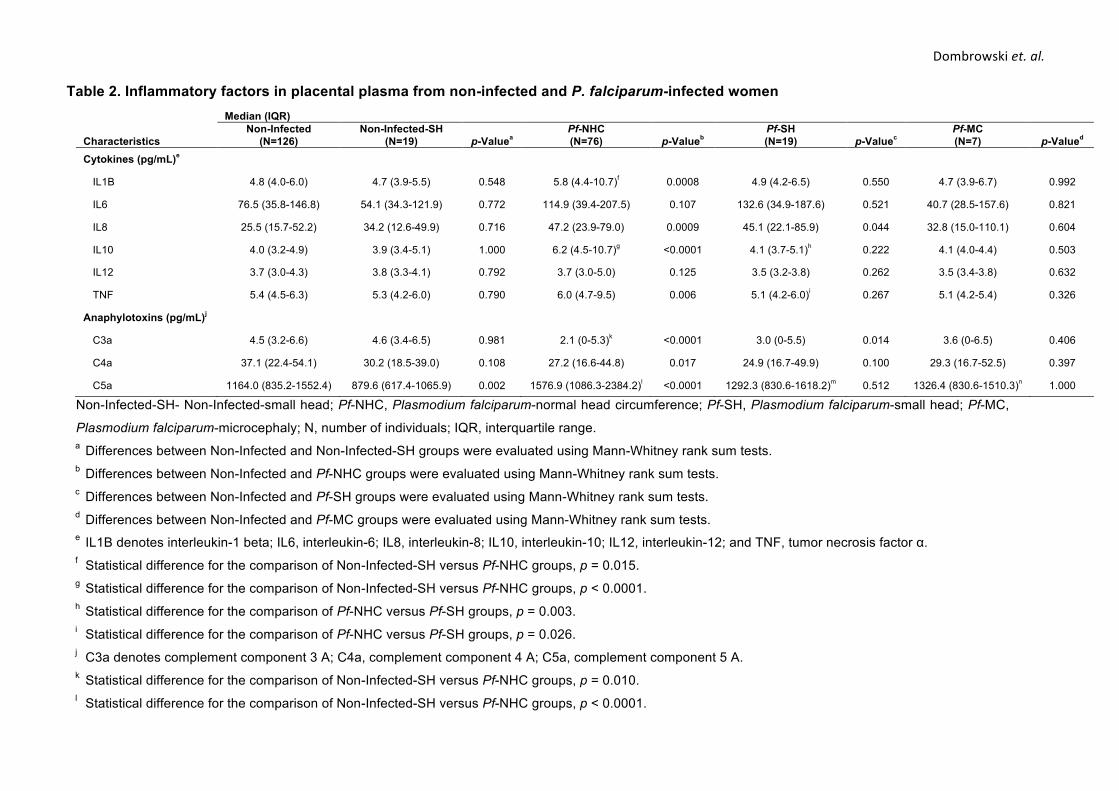
Dombrowskiet.al.
Table 2. Inflammatory factors in placental plasma from non-infected and P. falciparum-infected women
Characteristics
Median (IQR) Non-Infected
(N=126) Non-Infected-SH
(N=19) p-Valuea Pf-NHC (N=76) p-Valueb
Pf-SH (N=19) p-Valuec
Pf-MC (N=7) p-Valued
Cytokines (pg/mL)e
IL1B 4.8 (4.0-6.0) 4.7 (3.9-5.5) 0.548 5.8 (4.4-10.7)f 0.0008 4.9 (4.2-6.5) 0.550 4.7 (3.9-6.7) 0.992
IL6 76.5 (35.8-146.8) 54.1 (34.3-121.9) 0.772 114.9 (39.4-207.5) 0.107 132.6 (34.9-187.6) 0.521 40.7 (28.5-157.6) 0.821
IL8 25.5 (15.7-52.2) 34.2 (12.6-49.9) 0.716 47.2 (23.9-79.0) 0.0009 45.1 (22.1-85.9) 0.044 32.8 (15.0-110.1) 0.604
IL10 4.0 (3.2-4.9) 3.9 (3.4-5.1) 1.000 6.2 (4.5-10.7)g <0.0001 4.1 (3.7-5.1)h 0.222 4.1 (4.0-4.4) 0.503
IL12 3.7 (3.0-4.3) 3.8 (3.3-4.1) 0.792 3.7 (3.0-5.0) 0.125 3.5 (3.2-3.8) 0.262 3.5 (3.4-3.8) 0.632
TNF 5.4 (4.5-6.3) 5.3 (4.2-6.0) 0.790 6.0 (4.7-9.5) 0.006 5.1 (4.2-6.0)i 0.267 5.1 (4.2-5.4) 0.326
Anaphylotoxins (pg/mL)j
C3a 4.5 (3.2-6.6) 4.6 (3.4-6.5) 0.981 2.1 (0-5.3)k <0.0001 3.0 (0-5.5) 0.014 3.6 (0-6.5) 0.406
C4a 37.1 (22.4-54.1) 30.2 (18.5-39.0) 0.108 27.2 (16.6-44.8) 0.017 24.9 (16.7-49.9) 0.100 29.3 (16.7-52.5) 0.397
C5a 1164.0 (835.2-1552.4) 879.6 (617.4-1065.9) 0.002 1576.9 (1086.3-2384.2)l <0.0001 1292.3 (830.6-1618.2)m 0.512 1326.4 (830.6-1510.3)n 1.000
Non-Infected-SH- Non-Infected-small head; Pf-NHC, Plasmodium falciparum-normal head circumference; Pf-SH, Plasmodium falciparum-small head; Pf-MC,
Plasmodium falciparum-microcephaly; N, number of individuals; IQR, interquartile range. a Differences between Non-Infected and Non-Infected-SH groups were evaluated using Mann-Whitney rank sum tests. b Differences between Non-Infected and Pf-NHC groups were evaluated using Mann-Whitney rank sum tests. c Differences between Non-Infected and Pf-SH groups were evaluated using Mann-Whitney rank sum tests. d Differences between Non-Infected and Pf-MC groups were evaluated using Mann-Whitney rank sum tests. e IL1B denotes interleukin-1 beta; IL6, interleukin-6; IL8, interleukin-8; IL10, interleukin-10; IL12, interleukin-12; and TNF, tumor necrosis factor α. f Statistical difference for the comparison of Non-Infected-SH versus Pf-NHC groups, p = 0.015. g Statistical difference for the comparison of Non-Infected-SH versus Pf-NHC groups, p < 0.0001. h Statistical difference for the comparison of Pf-NHC versus Pf-SH groups, p = 0.003. i Statistical difference for the comparison of Pf-NHC versus Pf-SH groups, p = 0.026. j C3a denotes complement component 3 A; C4a, complement component 4 A; C5a, complement component 5 A. k Statistical difference for the comparison of Non-Infected-SH versus Pf-NHC groups, p = 0.010. l Statistical difference for the comparison of Non-Infected-SH versus Pf-NHC groups, p < 0.0001.
.CC-BY-NC-ND 4.0 International licenseIt is made available under a (which was not peer-reviewed) is the author/funder, who has granted bioRxiv a license to display the preprint in perpetuity.
The copyright holder for this preprint. http://dx.doi.org/10.1101/203059doi: bioRxiv preprint first posted online Oct. 13, 2017;

Dombrowskiet.al.m Statistical difference for the comparison of Non-Infected-SH versus Pf-SH groups, p = 0.004. n Statistical difference for the comparison of Non-Infected-SH versus Pf-MC groups, p = 0.049.
.CC-BY-NC-ND 4.0 International licenseIt is made available under a (which was not peer-reviewed) is the author/funder, who has granted bioRxiv a license to display the preprint in perpetuity.
The copyright holder for this preprint. http://dx.doi.org/10.1101/203059doi: bioRxiv preprint first posted online Oct. 13, 2017;

Dombrowskiet.al.
Additional file 6: Summary of maternal and newborns characteristics of the Retrospective Cohort Study (RCS). Table 1. Baseline characteristics of mothers and newborns
Characteristics Non-Infected
(N=3650) P. vivax (N=129)
Mixed (N=21)
P. falciparum (N=82)
Mothers Maternal age (years), mean (SD)a 24.1 (6.4) 22.7 (6.1) 23.4 (6.4) 24.1 (6.6) Gravidity, no. (%)b
Primigravida 1286 (36.4) 46 (36.2) 6 (28.6) 22 (28.2) Multigravida 2247 (63.6) 81 (63.8) 15 (71.4) 56 (71.8)
Gestational age at delivery (weeks) Mean (SD) 39.3 (1.1) 39.0 (1.2) 39.2 (1.4) 39.0 (1.1) Median (IQR) 39.0 (38.0-40.0) 39.0 (38.0-40.0) 39.0 (38.0-40.0) 39.0 (38.0-40.0)
C-section, no. (%) 1283 (35.2) 43 (33.3) 7 (33.3) 22 (26.8) Antenatal care visits, mean (SD)c 5.9 (2.5) 5.8 (2.4) 5.6 (2.4) 5.5 (2.8)
Newborns Male newborns, no. (%) 1921 (52.6) 67 (51.9) 10 (47.6) 47 (57.3) Weight (g), median (IQR)
Male 3325.0 (3065.0-3650.0) 3360.0 (3005.0-3600.0) 3242.5 (3165.0-3750.0) 3180.0 (2960.0-3470.0) Female 3200.0 (2965.0-3480.0) 3150.0 (2910.0-3410.0) 3035.0 (2700.0-3340.0) 3100.0 (2860.0-3380.0)
Length (cm), median (IQR)d Male 49.0 (48.0-51.0) 49.0 (48.0-50.0) 49.0 (48.0-51.0) 49.0 (48.0-50.0) Female 49.0 (48.0-50.0) 48.0 (48.0-49.0) 49.0 (48.0-50.0) 48.0 (47.0-49.0)
Rohrer index, median (IQR)d, e Male 2.8 (2.6-3.0) 2.8 (2.6-3.0) 2.8 (2.5-3.0) 2.8 (2.6-3.0) Female 2.8 (2.6-3.0) 2.8 (2.6-2.9) 2.4 (2.3-2.7) 2.7 (2.5-3.0)
Head circumference (cm), median (IQR) Male 34.0 (33.0-35.0) 34.0 (33.0-35.0) 34.5 (33.0-36.0) 34.0 (33.0-35.0) Female 34.0 (33.0-35.0) 34.0 (33.0-35.0) 34.0 (32.0-35.0) 33.0 (32.0-35.0)
Apgar score, median (IQR)g, h 1 min
Male 9 (8-9) 9 (8-9) 8 (8-9) 9 (8-9) Female 9 (8-9) 9 (8-9) 9 (8 -9) 8 (8-9)
5 min Male 10 (9-10) 10 (9-10) 9 (9-10) 10 (9-10) Female 10 (9-10) 10 (9-10) 10 (9-10) 10 (9-10)
N, number of individuals; SD, standard deviation; IQR, interquartile range; no., number of events.
.CC-BY-NC-ND 4.0 International licenseIt is made available under a (which was not peer-reviewed) is the author/funder, who has granted bioRxiv a license to display the preprint in perpetuity.
The copyright holder for this preprint. http://dx.doi.org/10.1101/203059doi: bioRxiv preprint first posted online Oct. 13, 2017;

Dombrowskiet.al.a Maternal age was recorded in 3372 non-infected and 126 P. vivax-infected pregnant women. b Gravidity was recorded in 3533 non-infected, 127 P. vivax, and 78 P. falciparum-infected pregnant women. c The number of antenatal care visits was recorded in 3413 non-infected, 125 P. vivax, 20 mixed-infected and 79 P. falciparum pregnant women. d Length and Rohrer index was recorded in 3635 newborns from non-infected pregnant women. e The Rohrer index is the newborns’ weight in grams divided by the cube of the length in centimeters, and babies are considered proportional when values
are above 2.5. f Chest circumference was recorded in 3647 newborns from non-infected pregnant women. g Apgar score: 7 – 10, normal; 4 – 6, some breathing assistance might be required; and, < 4, several assistances must be provided. h Apgar score at 1 and 5 minutes was recorded in 3628 newborns from non-infected and 81 P. falciparum-infected pregnant women
.CC-BY-NC-ND 4.0 International licenseIt is made available under a (which was not peer-reviewed) is the author/funder, who has granted bioRxiv a license to display the preprint in perpetuity.
The copyright holder for this preprint. http://dx.doi.org/10.1101/203059doi: bioRxiv preprint first posted online Oct. 13, 2017;