platform-enabled small businesses and the geography … · platform-enabled small businesses and...
TRANSCRIPT

PLATFORM-ENABLED SMALL BUSINESSES AND THE GEOGRAPHY OF RECOVERY
Evidence of More Inclusive New Enterprise Growth on eBay than Reflected in Official Statistics
January 2017

CONTENTS
03 INTRODUCTION
04 RESEARCH PARAMETERS
05 FALLING DYNAMISM AND ENTREPRENEURIAL ACTIVITY IN THE UNITED STATES
06 COUNTY LEVEL ANALYSIS OF US CENSUS BUREAU DATA ON NEW ESTABLISHMENT FORMATION
09 COUNTY LEVEL ANALYSIS OF EBAY COMMERCIAL SELLER DATA ON NEW ENTERPRISE FORMATION
14 CONCLUSIONS AND QUESTIONS FOR FURTHER STUDY
16 APPENDIX A: DIGITAL DENSITY TOP 100 COUNTIES

3
INTRODUCTION
Since 2011, the eBay Public Policy Lab and a team of economists at Sidley Austin LLP1 have together carried out research into the trade and commercial activities of firms that use the online commerce platform. We have uncovered a fundamental transformation occurring within global commerce driven by the dramatic reduction in the cost of engaging in commerce over distance when a firm is enabled by digital platforms. National and global opportunities have expanded beyond traditional large corporations as even the smallest Internet-enabled enterprises can connect directly with customers across America and around the world.
This report presents new findings coming out of this collaboration, exploring questions related to the apparent decline in new establishment creation in the United States as well as the increasing concentration of establishment growth in an increasingly small number of very large, cosmopolitan counties.
This analysis builds upon a recent report published by the Economic Innovation Group (EIG), ”The new Map of Economic Growth and Recovery,” which presented a compelling and admittedly disturbing county-based geographic analysis of US Census Bureau data related to the growth of new establishments in the 2010 - 2014 period.2 In a country with over 3,000 counties, the EIG analysis revealed that fully half of the net business establishment growth occurred in just 20 very large counties located in only seven states, more than three quarters of net establishment growth came from counties with 500,000 or more people, that 59 percent of counties (home to nearly one-third of the U.S population) had fewer establishments in 2014 than they did in 2010, and there was no net establishment growth from counties with fewer than 100,000 residents.3 In short, they warn of “an economy veering towards a less broadly dynamic, less entrepreneurial, and more geographically concentrated equilibrium – more reliant than ever on a few high-performing geographies abundant in talent and capital to carry national rates of growth.”4
The county-level analysis and framing of US Census Bureau data by EIG focused a new light on major issues related to US economic dynamism, entrepreneurship, and inclusive growth. Those issues will not be answered, explained or rebutted in any single report, especially this one. However, this eBay Public Policy Lab report proposes to contribute some findings that suggest inclusive entrepreneurial growth is possible and indeed happening. Over the same time period as the EIG analysis, our findings show a much more geographically inclusive spread of new enterprise formation on eBay.
ABOUT THE EBAY PUBLIC POLICY LAB
The eBay Public Policy Lab seeks to address the public policy challenges that lie at the nexus of technology and commerce. We conduct innovative research using unique data analytics methodologies and creative insights. We seek to inspire debate at the highest levels of public policy discourse about the future of commerce and how technology can be leveraged to achieve the best possible outcomes for all.
Brian Bieron Executive Director
Hanne Melin Director Global Public Policy
Alan Elias Senior Manager Global Public Policy
1 Simon Schropp, Andreas Lendle, Olim Latipov, and Kornel Mahlstein.
2 Economic Innovation Group (May 2016) “The New Map of Economic Growth and Recovery,” Available at: http://eig.org/recoverymap.
3 All population estimates used in conjunction with US Census Bureau and eBay data in this report are based on US Census Bureau County Population Estimates as of July 1, 2010. Available at: http://census.gov/topics/population.html.
4 Economic Innovation Group (May 2016) “The New Map of Economic Growth and Recovery,” Available at: http://eig.org/recoverymap.
This report uses eBay’s own propriety data to build on EIG’s propriety analysis of publicly available data provided by the US Census Bureau. This report is the sole product of eBay and is not produced in partnership with EIG.

4
As opposed to half of net establishment growth clustered in just 20 counties in seven states, on eBay, a similar level of net small business growth in the US was distributed among 75 counties in 24 states. Additionally, nearly three-quarters of the counties in America had net eBay small business growth in the 2010 - 2014 period, as opposed to just 41 percent in the economy overall, and more than 10 percent of the net eBay small business growth came from counties with fewer than 100,000 people as opposed to no net growth from these small population counties as reported by the EIG study.
We believe that the fairly dramatic differences in the county-based results shown by the EIG analysis of US Census Bureau data and this eBay data-based analysis raises interesting questions related to the nature of small business entrepreneurship in the new Internet economy, the extent to which traditional government statistical models properly capture some Internet-enabled micro business growth, and the possibility that entrepreneurial activity in more remote areas might be shifting to use Internet platforms because they better facilitate commerce over distance.
If eBay Commercial Seller data is a proxy for on-demand platform entrepreneurship, then it is possible that subdued economic dynamism and new enterprise creation in the US economy might not be as dramatic as reported, and might not be so concentrated in just the nation’s most elite economic hubs. Instead, a meaningful amount of Internet economy entrepreneurship could be occurring through very small Internet-enabled enterprises more widely dispersed and in a more inclusive manner across the nation.
RESEARCH PARAMETERS
The research presented in this report is based on a data set covering commercial activity on eBay by what we call “Commercial Sellers” based in the United States for the period 2010 - 2014. Those are firms with at least $10,000 USD in annual sales on eBay. We have limited the data on which our research is based to transactions by Commercial Sellers to ensure we properly capture the community of small commercial enterprises on eBay. We would add that in our experience Commercial Sellers are predominately micro enterprises (with less than 10 employees). Following the methodology of the EIG analysis of net change in U.S. business establishments, we look at the county level distribution of the net change in Commercial Sellers over the period 2010 - 2014.
5
FALLING DYNAMISM AND ENTREPRENEURIAL ACTIVITY IN THE UNITED STATES
There has been widespread empirical study and analysis related to what is often described as the declining dynamism of the US economy. Factors that are commonly considered in the context of economic dynamism are new business formation, the failure rate of firms and the resulting “churn” that is reflected by comparative rates of new firms and failing firms, the survival rate of new firms, and the average age of firms. The decline in the rate of new enterprise formation or start-ups, in particular as revealed by US Census Bureau data, has been pinpointed as the primary factor in the perceived reduction in dynamism. Recent papers by Pugsley and Sahin (2014)5, Decker, Haltiwanger, Jarmin and Miranda (2014)6, Hathaway and Litan (2014)7, Gourio, Messer and Siemer (2014)8, and Karahan, Pugsley and Sahin (2015)9 all point to this phenomenon as widespread both regionally and across industry sectors. As noted in the 2016 Economic Report of the President, declining rates of new enterprise formation and a relatively steady rate of business failures has resulted in lower rates of churn and an increasing average age of firms.10
The apparent decades-long decline in dynamism and new business formation has led to various demographic-based analyses of the phenomenon. Karahan, Pugsley and Sahin (2015)11 show that declines in the growth rate of the labor force underway since the 1970’s and other demographic shifts underway in the US since the 1980’s can explain the gradual decline in the rate of new enterprise formation. Wilmouth (2016) reports that “Millennials” appear to have a meaningfully lower rate of self-employment than Generation X or Baby Boomers, reporting that less than 2 percent of Millennials reported self-employment in 2014, compared with 7.6 percent for Generation X and 8.3 percent for Baby Boomers.12 At age 30, Wilmouth notes that less than four percent of Millennials reported self-employment as their primary job, compared to 5.4 percent at that age for Generation Xers and 6.7 percent for Baby Boomers.13 Similarly, a Wall Street Journal analysis of Federal Reserve data found that the share of households headed by someone under 30 with a stake in or ownership of a private business has fallen from over 10 percent in 1989 to 3.6 percent in 2013.14
5 Pugsley, B.W., and A. Sahin (2014): “Grown-up business cycles,” FRB of New York Staff Report, (707).
6 Decker, R., J. Haltiwanger, R. S. Jarmin, and J. Miranda (2014): “The Role of Entrepreneurship in US Job Creation and Economic Dynamism,” The Journal of Economic Perspectives, 28(3), 3-24.
7 Hathaway, I., and R. E. Litan (2014): “Declining Business Dynamism in the United States: A Look at States and Metros,” mimeo, Brookings Institution.
8 Gourio, F., T. Messer, and M. Siemer (2014): “A Missing Generation of Firms? Aggregate Effects of the Decline in New Business Formation,” mimeo.
9 Karahan, F., B. Pugsley, and A. Sahin (2015): “Understanding the 30-year Decline in Startup Rate: A General Equilibrium Approach,” Working Paper.
10 Council of Economic Advisors (February 2016) “Economic Report of the President”, (p. 214) Available at: https://www.whitehouse.gov/sites/default/files/docs/ERP_2016_Book_Complete%20JA.pdf.
11 Karahan, F., B. Pugsley, and A. Sahin (2015): “Understanding the 30-year Decline in Startup Rate: A General Equilibrium Approach,” Working Paper.
12 Wilmouth, Daniel (February 4, 2016) “The Missing Millennial Entrepreneurs,” U.S. Small Business Administration: Office of Advocacy Economic Research Series. Available at: https://www.sba.gov/sites/default/files/advocacy/Millenial_IB.pdf.
13 Wilmouth, Daniel (February 4, 2016) “The Missing Millennial Entrepreneurs,” U.S. Small Business Administration: Office of Advocacy Economic Research Series. Available at: https://www.sba.gov/sites/default/files/advocacy/Millenial_IB.pdf.
14 Ruth Simon and Caelainn Barr (January 2, 2015) “Endangered Species: Young U.S. Entrepreneurs,” The Wall Street Journal.

6
COUNTY LEVEL ANALYSIS OF US CENSUS BUREAU DATA ON NEW ESTABLISHMENT FORMATION
The EIG, through their report “The New Map of Economic Growth and Recovery” (2016)15, has added valuable time series and county-by-county analysis of new establishment data from the US Census Bureau to the discussion surrounding economic dynamism in the United States. In this report, they examined the geographic distribution of the net growth in business establishments during the first five years of the three most recent economic recoveries in the United States. The years covered in the context of these three economic recoveries were 1992 - 1996, 2002 - 2006, and 2010 - 2014. The EIG report defines establishments as, “single physical locations – with employees and owned by firms – where business is conducted or services and operations are performed.”16 For the purposes of this paper, we will be focusing on the geographic distribution of the net growth in establishments.
Overall, EIG uncovered a trend over the three economic recovery periods whereby net establishment growth has receded to a fewer number of counties with larger populations. In the most recent recovery time period, 2010 - 2014, nearly six out of ten counties in the Unites States, a nation of over 3,000 counties, experienced a negative net change in businesses establishments. Population-wise, this means that almost one-third of the U.S. population lived in counties that had fewer establishments in 2014 than they did in 2010. Both these figures have dramatically increased over the previous five-year recovery time periods. For the 2002 - 2006 recovery time period, 37 percent of counties had a negative net change in establishments. The figure stood at 17 percent during the 1992 - 1996 recovery time period and these counties represented only 14 percent of the population.
Additionally, a highly select number of larger and more urban counties emerged as home to an increasingly larger share of net establishment growth, and when taken together emerge as the center of gravity for the most recent economic recovery. A stark sense of the apparent geographic consolidation of economic dynamism and new establishment development is provided by the fact that just 20 large cosmopolitan counties produced half of the net increase in business establishments across the United States from 2010 - 2014 (See Figure 1.1 on page 7). These counties included and surrounded large urban centers such as Los Angeles, Miami, New York, and Dallas. The 20 counties were located in just seven states and together represented 17 percent of the U.S. population. In terms of population ranking, this list includes the top ten in the United States with the remaining counties ranging from 15th to 73rd most populous.
15 Economic Innovation Group (May 2016) “The New Map of Economic Growth and Recovery,” Available at: http://eig.org/recoverymap.
16 Economic Innovation Group (May 2016) “The New Map of Economic Growth and Recovery,” Available at: http://eig.org/recoverymap.

7
Along with providing a snapshot of the level of concentration of net establishment growth in such a small number of very populous counties over the 2010 - 2014 period, the report places this recovery in context of the previous two and finds greater concentration in each successive recovery (See Figure 1.2 on page 8). For example, during the 2002 - 2006 recovery time period, the commensurate figure was three times higher: 64 counties, located in 17 states, and representing 27 percent of the population, produced half of the net increase in business establishments. For the 1992 - 1996 recovery time period, the figure was six times higher: 125 counties, located in 37 states, and representing 32 percent of the population, produced half of the net increase in business establishments.
As the geographical distribution of net establishment growth became more concentrated in a smaller number of very large counties, various manifestations of this phenomenon emerged. In the 1992 - 1996 recovery time period, nearly every region of the country contained counties that had a high volume of net establishment growth. The Northeast and Midwest fell off dramatically in the next recovery time period and the counties driving net establishment growth were concentrated in the Southeast, Southwest and Northwest. In the most recent recovery time period, nearly all of the high volume counties were located in the South and, as noted earlier, in only a handful of states. The absence of counties in the vast majority of major urban centers of the Northeast, Midwest, and Northwest is striking.
1 Los Angeles County CA Los Angeles 1
2 Miami-Dade County FL Miami 8
3 Kings County NY New York 7
4 Harris County TX Houston 3
5 Orange County CA Los Angeles 6
6 Queens County NY New York 10
7 San Diego County CA San Diego 5
8 Travis County TX Austin 39
9 Palm Beach County FL Miami 28
10 Broward County FL Miami 18
11 Maricopa County AZ Phoenix 4
12 Cook County IL Chicago 2
13 Santa Clara County CA San Jose 17
14 Collin County TX Dallas 73
15 Orange County FL Orlando 35
16 Tarrant County TX Dallas 15
17 San Francisco County CA San Francisco 67
18 Clark County NV Las Vegas 13
19 New York County NY New York 20
20 Dallas County TX Dallas 9
RANK RANKCOUNTY COUNTYSTATE STATEPOPULATION RANK
POPULATION RANK
METRO AREA
METRO AREA
Figure 1.1
EIG REPORT: 20 COUNTIES IN THE US GENERATED HALF OF NET ESTABLISHMENT GROWTH (2010 - 2014)
Note: Ranking is based on the increase in net establishment growth.

8
Figure 1.2
EIG REPORT: MAP OF COUNTIES ACCOUNTING FOR HALF OF RECOVERY-ERA NET ESTABLISHMENT GROWTH17
1992 - 1996
2002 - 2006
2010 - 2014
17 Economic Innovation Group (May 2016) “The New Map of Economic Growth and Recovery,” (Reproduction of Maps, pg. 11) Available at: http://eig.org/recoverymap
Another trend over the last three economic recovery periods revealed by EIG is a complete drop off of net establishment growth in rural areas and a dramatic shift to the country’s largest markets. In the most recent recovery time period, counties with populations exceeding 1 million people were responsible for 58 percent of net establishment growth. When counties that have a population

9
between 500,000 and one million people are included, this figure rises to 81 percent. Counties with under 100,000 people had no net establishment growth. This is a substantial change from the previous recovery and a complete reversal from 1992 - 1996. In the 2002 - 2006 recovery time period, 51 percent of net establishment growth came from counties with fewer than 500,000 people while those with greater than one million people produced only 29 percent of the net establishment growth. In the 1992 - 1996 recovery time period, 71 percent of net establishment growth came from counties with under 500,000 people and only 13 percent originated in counties with over one million people.
COUNTY LEVEL ANALYSIS OF EBAY COMMERCIAL SELLER DATA ON NEW ENTERPRISE FORMATION
The eBay Public Policy Lab released a report in April 2016 titled the United States Small Online Business Growth Report18, which presented global trade and growth data related to eBay Commercial Sellers across America on a state-by-state level, and included a county level analysis of eBay Commercial Seller activity. To provide a ranking of the counties based on the most active eBay-enabled SME communities, and appropriately account for the wide disparities in population levels that exists among counties across the United States, we analyzed two indicators of small online business activity on a per capita basis within each county: (1) the number of “Commercial Sellers” per 100,000 inhabitants and (2) sales by “Commercial Sellers” per 100,000 inhabitants. We labeled the index based on these two indicators of per capita activity “Digital Density”. Measured on this per capita activity basis, we discovered the highest levels of eBay Commercial Seller activity were mixed among a range of county sizes, including some of the super counties highlighted in the EIG report, but also some low population rural and mid-population suburban counties. A list of the eBay Digital Density Top 100 counties in America in 2014 can be found in Appendix A of this report.
In an effort to compare the economy-wide findings (based on US Census Bureau data) of EIG with eBay data, economists at Sidley Austin LLP studied data covering transactions on the eBay Marketplace from 2010 - 2014. The economists then looked at which sellers are registered to addresses in the United States and broke them down by county. To ensure the community of small online businesses on eBay was fully captured, the data was limited to transactions by what we call Commercial Sellers, who are those with $10,000 USD or more in sales annually on the eBay Marketplace. Just as the analysis done by EIG is based on the net growth in the number of establishments in a county as reflected in US Census Bureau data, the eBay Commercial Seller data reflects the net growth of the number of Commercial Sellers in each county. Likewise, the results are reported as percentages of net growth and shares of new enterprises rather than absolute numbers.
18 eBay (April 2016) “United States Small Online Business Growth Report,” Available at: http://www.ebaymainstreet.com/policy-papers/us-small-online-business-growth-report.
10
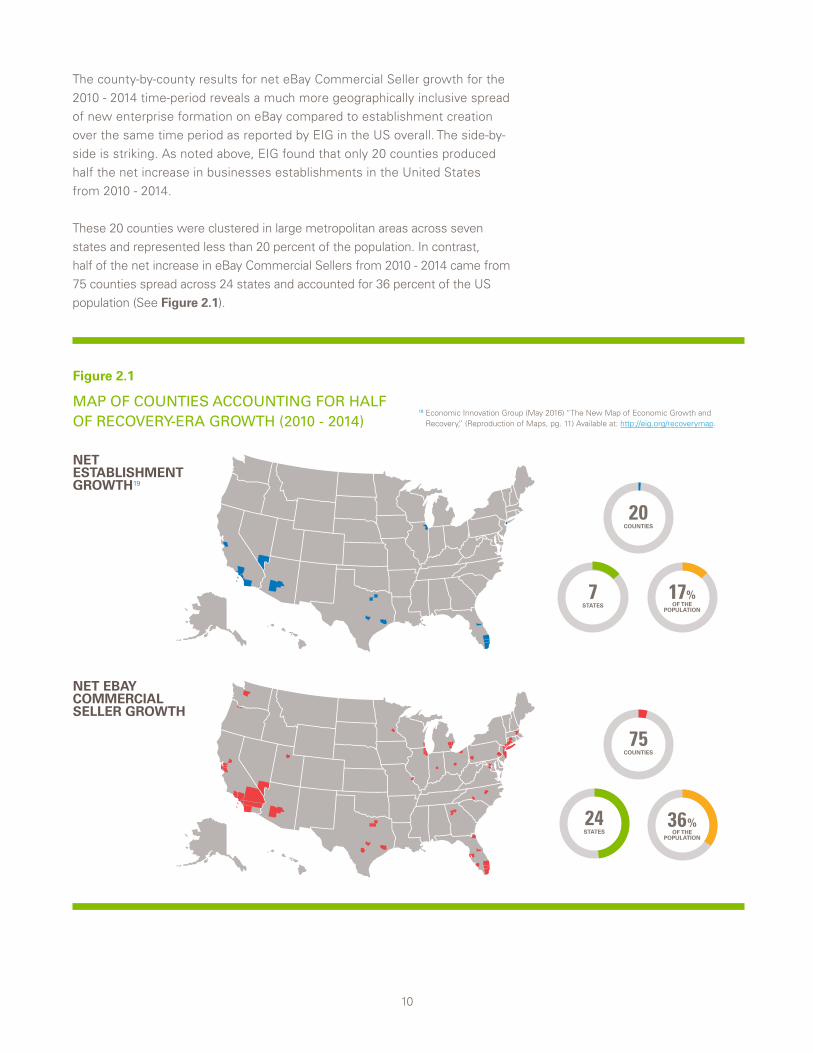
The county-by-county results for net eBay Commercial Seller growth for the 2010 - 2014 time-period reveals a much more geographically inclusive spread of new enterprise formation on eBay compared to establishment creation over the same time period as reported by EIG in the US overall. The side-by-side is striking. As noted above, EIG found that only 20 counties produced half the net increase in businesses establishments in the United States from 2010 - 2014.
These 20 counties were clustered in large metropolitan areas across seven states and represented less than 20 percent of the population. In contrast, half of the net increase in eBay Commercial Sellers from 2010 - 2014 came from 75 counties spread across 24 states and accounted for 36 percent of the US population (See Figure 2.1).
19 Economic Innovation Group (May 2016) “The New Map of Economic Growth and Recovery,” (Reproduction of Maps, pg. 11) Available at: http://eig.org/recoverymap.
Figure 2.1
MAP OF COUNTIES ACCOUNTING FOR HALF OF RECOVERY-ERA GROWTH (2010 - 2014)
NET ESTABLISHMENT GROWTH19
NET EBAY COMMERCIAL SELLER GROWTH

11
20 Economic Innovation Group (May 2016) “The New Map of Economic Growth and Recovery,” (Reproduction of Maps, pg. 11) Available at: http://eig.org/recoverymap.
21 Economic Innovation Group (May 2016) “The New Map of Economic Growth and Recovery,” (Reproduction of Maps, pg. 11) Available at: http://eig.org/recoverymap.
Figure 2.2
MAP OF COUNTIES ACCOUNTING FOR HALF OF RECOVERY-ERA GROWTH
NET ESTABLISHMENT GROWTH (1992 - 1996)20
NET ESTABLISHMENT GROWTH (2002 - 2006)21
NET EBAY COMMERCIAL SELLER GROWTH (2010 - 2014)
As noted, the EIG analysis of the three recovery periods, 1992 - 1996, 2002 - 2006, and 2010 - 2014, revealed an increasing concentration of net establishment growth over time. The geographic distribution of the 75 counties in the eBay results very much resembles the traditional economy business growth in the previous two economic recovery periods (See Figure 2.2).

12
These top 75 counties based on net eBay Commercial Seller growth include each of the 20 identified in the EIG study, but the remainder extended across the Northeast, Southeast, Midwest and Northwest United States. Each of the top forty most populous counties in America are included in the top 75, including metropolitan areas such as Philadelphia, Cleveland, Indianapolis, St. Louis, Minneapolis, Atlanta, Salt Lake City, Portland and Seattle, with the remaining counties ranging from 42nd to 139th most populous (See Figure 2.3).
1 Los Angeles County CA Los Angeles 1
2 Orange County CA Los Angeles 6
3 Miami-Dade County FL Miami 8
4 Kings County NY New York 7
5 Cook County IL Chicago 2
6 Maricopa County AZ Phoenix 4
7 Queens County NY New York 10
8 San Diego County CA San Diego 5
9 Broward County FL Miami 18
10 Harris County TX Houston 3
11 Clark County NV Las Vegas 13
12 San Bernardino County CA Los Angeles 12
13 Riverside County CA Los Angeles 11
14 New York County NY New York 20
15 Orange County FL Orlando 35
16 Santa Clara County CA San Jose 17
17 King County WA Seattle 14
18 Dallas County TX Dallas 9
19 Nassau County NY New York 27
20 Sacramento County CA Sacramento 25
21 Suffolk County NY New York 24
22 Bergen County NJ New York 55
23 Alameda County CA San Francisco 22
24 Palm Beach County FL Miami 28
25 Gwinnet County GA Atlanta 65
26 Oakland County MI Detroit 32
27 Hillsborough County FL Tampa 30
28 Tarrant County TX Dallas 15
29 Philadelphia County PA Philadelphia 21
30 Salt Lake County UT Salt Lake City 38
31 Cuyahoga County OH Cleveland 29
32 Pinellas County FL Tampa 53
33 Wake County NC Raleigh 54
34 DuPage County IL Chicago 52
35 Montgomery County PA Philadelphia 70
36 Middlesex County NJ New York 64
37 Bexar County TX San Antonio 19
38 New Haven County CT New Haven 60
39 Middlesex County MA Boston 23
40 Hennepin County MN Minneapolis 34
41 Fairfax County VA Washington, DC 36
42 Contra Costa County CA San Francisco 37
43 Ventura County CA Los Angeles 63
44 Monmouth County NJ New York 95
45 Franklin County OH Columbus 33
46 Fairfield County CT New York 50
47 Duval County FL Jacksonville 59
48 Collin County TX Dallas 73
49 Alleghany County PA Pittburgh 31
50 San Francisco County CA San Francisco 67
51 Fulton County GA Atlanta 48
52 Montgomery County MD Washington, DC 42
53 Mecklenburg County NC Charlotte 49
54 Travis County TX Austin 39
55 Multnomah County OR Portland 79
56 Wayne County MI Detroit 16
57 Macomb County MI Detroit 62
58 Hartford County CT Hartford 57
59 St. Louis County MO St. Louis 40
60 Bucks County PA Philadelphia 99
61 Ocean County NJ Trenton 108
62 Essex County NJ New York 74
63 Lee County FL Ft. Myers 101
64 Bronx County NY New York 26
65 Lake County IL Chicago 84
66 Richmond County NY New York 139
67 Marion County IN Indianapolis 56
68 Cobb County GA Atlanta 86
69 Milwaukee County WI Milwaukee 45
70 Hudson County NJ New York 94
71 Westchester County NY New York 44
72 Fresno County CA Fresno 46
73 San Mateo County CA San Francisco 82
74 Passaic County NJ New York 128
75 Union County NJ New York 117
RANK RANKCOUNTY COUNTYSTATE STATEPOPULATION RANK
POPULATION RANK
METRO AREA
METRO AREA
Figure 2.3
EBAY: 75 COUNTIES IN THE US GENERATED HALF OF THE NET INCREASE IN EBAY COMMERCIAL SELLERS (2010 - 2014)
Note: Ranking is based on the increase in net establishment growth.

13
22 Economic Innovation Group (May 2016) “The New Map of Economic Growth and Recovery,” Available at: http://eig.org/recoverymap.
A further measure of net establishment growth concentration involves the share of 3,143 counties in the United States that experienced this growth in the 2010 - 2014 recovery period. EIG analysis of US Census Bureau data reveals that to be only 41 percent of counties. On the other hand, 71 percent of the counties in the United States saw a net increase in their number of eBay Commercial Sellers, and those counties comprised 95 percent of US population.
Another measure of the county-level geographic spread of net establishment growth in the United States reported by EIG involved the share of growth located in counties of different sizes (See Figure 2.4). As opposed to US economy overall, where EIG analysis reports a zero share of net establishment growth in counties of less than 100,000 residents, 12 percent of the nationwide increase in eBay Commercial Sellers came from counties with under 100,000 people, which are often rural counties spread across America. Counties with under 500,000 people produced 40 percent of the net increase in eBay Commercial Sellers compared to just 19 percent of the net increase in establishments according to US Census Bureau data during the same time period. Looking at counties with 500,000 or more people we find they produced 60 percent of the net growth in eBay Commercial Sellers vs. 81 percent of the net establishment growth in the overall economy. Once again, we see these eBay results more in line with that of net establishment growth in the 2002 - 2006 recovery.
Figure 2.4
SHARE OF NET ESTABLISHMENT GROWTH22 AND NET EBAY COMMERCIAL SELLER GROWTH BY COUNTY POPULATION SIZES

14
CONCLUSIONS AND QUESTIONS FOR FURTHER STUDY
The county-level analysis of the distribution of net enterprise growth on eBay in the form of Commercial Sellers points toward Internet-enabled small business growth as a force for economic dynamism and inclusive economic growth that is potentially bucking, or even countering, the trends seen in the traditional economy. Where the majority of establishment growth in the overall economy appears to have been concentrated in an increasingly small handful of very large and prosperous urban centers, eBay appears to have allowed micro and small retail businesses in the US between 2010 and 2014 to buck depressed entrepreneurship trends that merged over the past three recoveries.
We believe that the differences in the results in the overall economy based on US Census Bureau data and reported by EIG, and those based on eBay Commercial Seller activity and reported here, raises interesting questions related to the nature of small business entrepreneurship in the new Internet economy, the possibility that traditional government statistical models are missing some Internet-enabled micro business growth, and, the possibility that entrepreneurial growth in more remote areas tends to use Internet platforms because they facilitate remote commerce which is key to expanding market opportunities beyond the immediate localities.
The long-time challenge to traditional economic statistical methods and models posed by independent workers, who can be thought of as individual entrepreneurs and micro businesses, is understood. In their report, “Independent Work: Choice, Necessity and the Gig Economy” (2016), the McKinsey Global Institute (MGI) concluded that independent work is a much bigger phenomenon than official statistics indicate.23 The 2016 Economic Report of the President describes “on-demand economy platforms” as a relatively nascent phenomenon that have been the subject of little economic research, and of the entrepreneurial activity going on over the platforms, states that, “many of these activities cannot be isolated in official statistics, and in some cases, may in fact be omitted from these statistics.”24
For example, it is possible that the more geographically dispersed distribution of the net growth in eBay Commercial Sellers as compared to the traditional economic data is primarily a reflection of a measurement failure, where, as noted above, some share of the participants in Internet-enabled like platforms are not counted in the official statistics and therefore are missed in the economic analyses based on those statistics.
23 McKinsey Global Institute (October 2016) “Independent Work: Choice, Necessity, and The Gig Economy,” Available at: http://www.mckinsey.com/global-themes/employment-and-growth/independent-work-choice-necessity-and-the-gig-economy.
24 Council of Economic Advisors (February 2016) “Economic Report of the President,” (p. 242) Available at: https://www.whitehouse.gov/sites/default/files/docs/ERP_2016_Book_Complete%20JA.pdf.

15
From a county analysis perspective, this phenomenon could be intensified by the well-understood value of global platforms to allow for commerce over great distances by small Internet-enabled enterprises, which could disproportionately attract small business entrepreneurs in smaller and more remote counties to business models that are undercounted.
The combination of the existing scale of independent work, which MGI pegs at 27 percent of the total US workforce, and the certain expansion of the use of on-demand economy platforms, which MGI identifies as being used by just 15 percent of independent workers in the US (although 63 percent of independent workers in the retail sector use a technology platform like eBay or Etsy), will increase the importance of better understanding the impact of platform-enabled entrepreneurs and micro-businesses on measurements of new business formation.25
25 McKinsey Global Institute (October 2016) “Independent Work: Choice, Necessity, and The Gig Economy,” Available at: http://www.mckinsey.com/global-themes/employment-and-growth/independent-work-choice-necessity-and-the-gig-economy.

APPENDIX A: DIGITAL DENSITY TOP 100 COUNTIES26
26 The Digital Density ranking is based on a score that is a weighted combination of two indicators of small online business activity on a per capita basis within each county: (1) the number of “Commercial Sellers” per 100,000 inhabitants; and (2) sales by “Commercial Sellers” per 100,000 inhabitants. The weighted average puts more emphasis on the sales per small online business, as starting up a business is the first step to selling.

17
DIGITAL DENSITY TOP 100 COUNTIES
1) Essex County Vermont
2) Fulton County Ohio
3) Sarasota County Florida
4) Rockland County New York
5) Kings County New York
6) Middlesex County New Jersey
7) Casey County Kentucky
8) Los Angeles County California
9) Orange County California
10) Bergen County New Jersey
11) Whatcom County Washington
12) Nelson County North Dakota
13) New York County New York
14) Nassau County New York
15) Montgomery County Pennsylvania
16) Broward County Florida
17) Seminole County Florida
18) Clinton County New York
19) Gwinnett County Georgia
20) Clackamas County Oregon
21) Falls Church City Virginia
22) Taney County Missouri
23) Lake County Illinois
24) Morris County New Jersey
25) Miami-Dade County Florida
26) Lapeer County Michigan
27) Monmouth County New Jersey
28) Ventura County California
29) Bucks County Pennsylvania
30) Warren County New Jersey
31) Lake County Ohio
32) DuPage County Illinois
33) Rockingham County New Hampshire
34) Lewis County Idaho
35) Hunterdon County New Jersey
36) Oakland County Michigan
37) Pinellas County Florida
38) Washington County Utah
39) Worcester County Maryland
40) Bloomfield County Colorado
41) Ocean County New Jersey
42) Allen County Indiana
43) Carson City Nevada
44) Cherokee County Georgia
45) Santa Clara County California
46) Clay County North Carolina
47) Palm Beach County Florida
48) Cheshire County New Hampshire
49) Sevier County Tennessee
50) Placer County California
51) Douglas County Nevada
52) Monroe County Florida
53) San Diego County California
54) Camden County New Jersey
55) Flagler County Florida
56) San Francisco County California
57) Orange County Florida
58) Hinsdale County Colorado
59) McHenry County Illinois
60) Medina County Ohio
61) Niagara County New York
62) Blaine County Nebraska
63) Monroe County Pennsylvania
64) Mille Lacs County Minnesota
65) Macomb County Michigan
66) Clark County Nevada
67) Citrus County Florida
68) Suffolk County New York
69) Multnomah County Oregon
70) Litchfield County Connecticut
71) Lancaster County Pennsylvania
72) Richmond County New York
73) Waukesha County Wisconsin
74) Racine County Wisconsin
75) Orange County New York
76) El Dorado County California
77) Hillsborough County New Hampshire
78) Washington County Rhode Island
79) Pembina County North Dakota
80) Volusia County Florida
81) Haines Borough Alaska
82) Josephine County Oregon
83) Rutland County Vermont
84) Hamilton County Indiana
85) Washington County Oregon
86) Union County Georgia
87) Lincoln County Oregon
88) Pasco County Florida
89) Hernando County Florida
90) Martin County Florida
91) Lake County Florida
92) Pike County Pennsylvania
93) Lebanon County Pennsylvania
94) Colonial Heights City Virginia
95) Kent County Rhode Island
96) Ulster County New York
97) Luzerne County Pennsylvania
98) Costilla County Colorado
99) Lee County Florida
100) Dawson County Georgia
