playing with the social network: social cohesion in...
TRANSCRIPT

Playing with the social network:
Social cohesion in resettled and
non-resettled communities in
Cambodia
Simone Gobien, Bj
¨
oern Vollan
Working Papers in Economics and Statistics
2013-16
forthcoming in American Journal of Agricultural
Economics
University of Innsbruck
http://eeecon.uibk.ac.at/

University of Innsbruck
Working Papers in Economics and Statistics
The series is jointly edited and published by
- Department of Economics
- Department of Public Finance
- Department of Statistics
Contact Address:
University of Innsbruck
Department of Public Finance
Universitaetsstrasse 15
A-6020 Innsbruck
Austria
Tel: + 43 512 507 7171
Fax: + 43 512 507 2970
E-mail: [email protected]
The most recent version of all working papers can be downloaded at
http://eeecon.uibk.ac.at/wopec/
For a list of recent papers see the backpages of this paper.

PLAYING WITH THE SOCIAL NETWORK: SOCIAL COHESION IN RESETTLED AND
NON-RESETTLED COMMUNITIES IN CAMBODIA
Simone Gobien*a, Björn Vollanb
ABSTRACT
Mutual aid among villagers in developing countries is often the only means of insuring against
economic shocks. We use “lab-in-the-field experiments” in Cambodian villages to study solidarity
in established and newly resettled communities. Both communities are part of a land distribution
project for which participants signed up voluntarily. Playing a version of the “solidarity game”, we
identify the effect of voluntary resettlement on willingness to help fellow villagers. We find that
resettled players transfer on average between 45% and 75% less money than non-resettled players.
The social costs of voluntary resettlement seem significantly higher than is commonly assumed.
JEL classification: C93, O15, O22, R23
Keywords: Voluntary resettlement; Social cohesion; Risk-sharing networks; “Lab-in-the-field experiment”; Cambodia; Asia
* corresponding author a) Institute for Co-operation in Developing Countries, Department of Business Administration and Economics, Philipps-Universität Marburg, Am Plan 2, 35037 Marburg, Germany, +49 6421 2823732; [email protected] b) Universität Innsbruck, Institut für Finanzwissenschaft, Universitätsstraße 15, A-6020 Innsbruck, +43 512 507 7174; [email protected] ______________________________
+ We gratefully acknowledge the opportunity to do research in the LASED project. We thank the Deutsche Gesellschaft für Internationale Zusammenarbeit (GIZ) and the LASED project team of IP/Gopa in Kratie, especially Michael Kirk, Franz-Volker Müller, Karl Gerner, Pen Chhun Hak, Phat Phalit, Siv Kong, Sok Lina, and Uch Sopheap, for financial, organizational, and logistical support; Hort Sreynit, Soun Phara, and the team of research assistants, for excellent support in the field; and Boban Aleksandrovic, Esther Blanco, Thomas Dufhues, Thomas Falk, Tom Gobien, Andreas Landmann, Fabian Pätzold, Sebastian Prediger, Susan Steiner, Susanne Väth, the participants of the 2011 IASC European Meeting for valuable comments, the participants of the World Bank Conference on Land and Poverty 2012, the participants of the 2013 annual meeting of the Verein für Socialpolitik and the participants of the Brown Bag Seminar in Marburg and at Duke University for valuable comments.
2
1. INTRODUCTION
Land reforms in developing countries are believed to have the potential to eradicate food
insecurity, to alleviate rural poverty and to reduce vulnerability to shocks due to higher income,
larger savings, better access to the credit market, and increased returns to family labor. But
households have to redirect time and effort to agriculture rather than to less risky activities thereby
reducing income diversification as a common mean of informal insurance. Moreover, evidence on
benefits of land reform is mixed. Valente (2009) shows for example higher food insecurity for land
reform beneficiaries in South Africa, McCulloch and Baulch (2000) calculate only minor returns of
land distribution to rural households in Pakistan concerning income smoothing and poverty
reduction, and Ravallion and Sen (1994) claim that redistributive land reform in Bangladesh falls
short to fulfill expectations for poverty reduction even if optimal circumstances are assumed.
Moreover, if resettlement is involved it is often neglected that the potential economic
benefits for an individual farmer may be dampened by counteracting social effects of leaving a well-
functioning, cohesive community. The negative consequences of leaving one’s birthplace may be
underestimated both by the people who are resettled and by the project staff. Geographic proximity
is one of the main determinants of social networks (Fafchamps and Lund 2003; Fafchamps and
Gubert 2007). Due to the weakening of the ties to one’s social network individuals lose access to
mutual aid, informal credit and informal insurance (Dinh, Dufhues, and Buchenrieder 2012; Okten
and Osili 2004; Attanasio et al. 2012). Most importantly, political institutions and social networks
need to be re-established at the new destination in order for social norms to emerge that enforce
solidarity, cooperation, trust and altruism and sanction free-riding and spite. Thus, coping with risks
might become more difficult after resettlement as both reciprocal risk-sharing arrangements as well
as solidarity towards others might be drastically lower. The few available studies of social

3
consequences of voluntary resettlement, concentrate mainly on redistributive land reform in
Zimbabwe, suggesting that negative effects may arise even 20 years after voluntary resettlement
(Dekker 2004; Barr 2003; Barr, Dekker, and Fafchamps 2010).1 Dekker (2004) finds evidence that
while non-resettled households in Zimbabwe rely on their network and solidarity in the village,
voluntarily resettled households are more likely to rely on individual risk-coping strategies.2 The
seminal study by Barr (2003) explores the implications of resettlement on trust in Zimbabwe using a
standard trust experiment. Her findings show that resettled players trust each other significantly less
than non-resettled players even 20 years after resettlement, and that the players’ responsiveness to
expected trustworthiness is lower in resettled communities.3 However, these studies lack data before
resettlement and thus cannot rule out that their effect is driven by selection instead of resettlement. It
is possible that in Zimbabwe especially those favoring a certain political party or those willing to
use violence were resettled. Similar to Barr (2003) we measure “solidarity” by implementing a “lab-
in-the-field” experiment. Our participants are recruited from a land distribution project in rural
Cambodia. We compare solidarity among voluntarily resettled farmers with solidarity among
beneficiaries who stayed in their established villages (non-resettled farmers).
Barr (2003) argues that the lower level of trust in resettled communities is mainly the result
of missing altruism. A trust game, however, might not be an adequate measure for altruism as it also
measures risk and trust. The dictator game might be an easier way of measuring altruism, yet it is a
very artificial measure (Bardsley 2008). Thus, we decided to use a modified version of the solidarity
experiment (Selten and Ockenfels 1998) which captures transfers motivated by pro-social concerns
like altruism and inequity aversion and in addition provides a measure for risk aversion. Selten and
Ockenfels (1998, 518) define solidarity as the “willingness to help people in need who are similar to
oneself but victims of outside influences such as unforeseen illness, natural catastrophes, etc.”
Hence, our experimental game mimics insurance against shocks based on unconditional help within
4
the village which are extremely important for resettled households but might be lost with
resettlement inducing high social costs. The experimental game consists of two stages in which
participants interact only with randomly chosen land reform beneficiaries from their same village. In
the first stage all participants play a risk game. Then winners of the risk game make a one-shot
decision on whether to transfer payments to anonymous losers in their group of three or not. This
experimental set-up makes it possible to reduce disparities by equalizing game outcomes through the
transfer of money. Moreover, it allows us to understand whether solidarity payments are influenced
by the risk choice of the person in need (compare for example Trhal and Radermacher (2009) for the
influence of self-inflicted neediness in the solidarity game). Interactions are between anonymous
villagers, there are no future interactions, and monetary transfers are not revealed. Thus, our
experiment eliminates the possibility of reciprocal risk-sharing and captures a village norm of
solidarity expressed in the willingness to transfer payments to anonymous villagers.4
In our study, farmers in the control group (non-resettled players) received only agricultural
land and still live in their village of origin, whereas farmers in the treatment group (resettled players)
received agricultural and residential land. The resettled players moved to a newly founded village
about one year prior to our behavioral experiment, whereas non-resettled farmers stay in their
village of origin and have to commute to their new plots. The new village is composed only of
project farmers who come from different villages in the region. The agricultural land is of similar
size for both groups. We hypothesize that transfers in the solidarity experiment are higher in the
non-resettled villages.
In line with our hypothesis we find a sizeable reduction in the willingness to help others.
Resettled players transfer on average between 47% and 75% less money than non-resettled players.
This effect remains large and significant after controlling for personal network and when controlling
for differences in transfer expectations. At the same time, there is a greater need for support in the
5
new village. Resettled farmers in the new village made 36% less income, (but since they received
subsidies their overall income was only 20% lower). Since both groups obtained land of a similar
size in the same area, the income differences are not due to weather effects or different soil
productivity. Most likely the lower income is due to lacking support of fellow villagers in planting,
harvesting and selling their rice as well as in coping with shocks. The costs of voluntary
resettlement, not only monetary but especially social, seem significantly higher than is commonly
assumed by development planners. People who have been resettled will therefore need not only
longer and more intensive external support but inevitably also adequate micro-insurance and better
access to credit. Compensation transfers for both voluntary and forced resettlement, made by the
government, aid agencies or investors (e-g- "land grabbing"), need to consider these risks.
Our study provides new evidence on the social cost of voluntary resettlement. It differs from
Barr (2003) in several ways. Firstly, we measure rather short-term effects of resettlement. This is
relevant since agricultural risk is highest immediately after obtaining agricultural land, when farmers
are still inexperienced (Lam and Paul 2013). Secondly, we use an experimental design that mimics
insurance against shocks based on unconditional help and measures willingness to transfer resources
which is motivated by pro-social preferences as a proxy for solidarity on the village level. This is
supported by our post-game questionnaire, as 96 % of all players see the similarity of the
experiments with real life situations related to agricultural investment decisions incorporating
different risk of failure and mutual support. Thirdly, we enrich our experimental results with survey
data on income before and after resettlement to provide evidence of the welfare effects of the land
distribution program. Lastly, and most importantly, we present evidence in interpreting our
resettlement results as causal. It could be that resettled people are inherently different than non-
resettled people in a way that affects both the settlement decision and the willingness to transfer. We
address this concern in several steps: Our treatment and control groups were both willing to relocate

6
and thus share similar unobservable characteristics such as motivation to migrate and personality.
They are closely homogeneous samples in terms of observable socio-economic factors due to the
enforcement of eligibility criteria for the entire LASED project (i.e. also non-resettled participants
fulfill the criteria to be resettled). Both groups have lived in their village of origin for at least four
years and were therefore able to establish strong social ties. We confirm this with ex ante data
showing that the groups did not differ in a range of observable socio-economic conditions and social
embeddedness in their village of origin. We also perform several econometric robustness tests. Most
importantly, following Altonji, Elder, and Taber (2005) and Bellows and Miguel (2009), we
calculate that the selection on unobservables would need to be 15.62 times stronger than selection
on observed variables in order to compensate the entire resettlement effect on solidarity transfers.
The paper relates to several strands in the literature. Firstly, our results complement the
existing literature on the impact of resettlement. As the voluntary nature of resettlement is often
questionable (Morris-Jung and Roth 2010; Schmidt-Soltau and Brockington 2007) most studies on
social consequences concentrate on involuntary displacement e.g. because of “development
projects”, natural catastrophe or environmental protection (Berg 1999; Eguavoen and Tesfai 2012;
Colchester 2004; Zhang et al. 2013; Schmidt–Soltau 2003; Rogers and Wang 2006; Abutte 2000;
Goodall 2006; Lam and Paul 2013). But voluntary resettlement often combined with a land reform
becomes increasingly common (see for example Dekker and Kinsey (2011) and Barr (2004) for
Zimbabwe, Cousins and Scoones (2010) for South Africa, Namibia and Zimbabwe, or Karanth
(2007), Tefera (2009) and Margolius, Beavers, and Paiz (2002) for conservation areas in India,
Ethiopia and Guatemala) and further research is highly needed. Our work introduces the notion of
solidarity as an additional dimension in this context.
Secondly, our results fill an important gap in the literature on conflict resolution as land
reform programs often intend to reverse historical inequalities and give poor people new

7
opportunities for their lives as for example in Southern Africa or Latin America. In line with
psychological research that emphasizes the role of vulnerability, distrust, injustice and helplessness
as significant belief domains that trigger or constrain conflict between groups (Eidelson and
Eidelson 2003), Albertus and Kaplan (2013) and Mason (1998, 1986) have found a reduction in
civil unrest due to land reform programs. Thirdly, our study relates to the literature on solidarity
giving, confirming the importance of the social and economic setting to the emergence of solidarity
(compare Ockenfels and Weimann (1999) and Brosig-Koch et al. (2011) for the consequences of
economic and social differences within Germany, and more generally Henrich et al. (2001) and
Leibbrandt, Gneezy, and List (2013) for the endogenous formation of social preferences).
The rest of the paper is organized as follows. Section 2(a) offers a brief introduction to the
institutional setting and the selection of farmers for the resettlement project. Section 2(b) describes
the socio-economic data before resettlement stemming from two earlier household surveys. Section
3 describes the field experiment we used to measure a person’s propensity to express solidarity, our
hypotheses for why solidarity should decrease with resettlement and socio-demographic variables of
our subject pool. Section 4 identifies and quantifies the resettlement effect, followed by robustness
tests and data on the importance of network transfers for project participants in real life. Section 5
summarizes and offers concluding remarks.
2. BACKGROUND INFORMATION
Land scarcity, environmental degradation and unequal distribution of productive land
prevent the economic development of the many people living in rural areas who rely on agriculture
as their main source of income. In Cambodia (our study region) more than 50% of the rural
population are land-poor, with less than half a hectare of land, and about 20% are landless (MoP and
8
UNDP 2007).5 These land-poor and landless rural people constitute the poorest and most vulnerable
part of the population.
(a) Resettlement context: The LASED project
The experiment was carried out in the context of the Land Allocation for Social and
Economic Development (LASED) project. This pilot project of the Royal Government of
Cambodia, supported by the German Agency for International Co-operation (GIZ) and the World
Bank, allocates one to three hectares of agricultural land to land-poor and landless people and
supports them in starting to farm on the land.6 The project is most advanced in Kratie Province,
where we carried out our research. Applicants could apply for residential and agricultural land
parcels, only agricultural land parcels or only residential land parcels. All those who received
residential land migrated permanently to a newly founded village. All the agricultural plots are
around this new village. Non-resettled farmers have to commute to their agricultural plots. The
project beneficiaries (both resettled and non-resettled) had to be living in the project communes.
They are the neediest people in the communities: to qualify they had to be landless or land-poor (i.e.
owning less than half a hectare of agricultural land).According to estimations from the project staff,
only between 1-2% of poor households, which would have been eligible for the project, did not
apply. All applicants applied for both types of land agricultural and residential. Hence all of them
were willing to relocate. As there was more demand for both agricultural and residential land than
could be supplied, applicants were selected according to the degree of neediness.7 Residential land
was granted to those households who did not have any residential land before the land allocation.
However, we do not find any differences in housing conditions (size and material of the house)
between households accepted for resettlement and those refused in our ex-ante data before land
distribution (see Table 1). Moreover, both groups had similar income, land holdings, assets and
9
other socio-economic characteristics before land allocation. Therefore, our data does not suffer from
bias caused by motivation to relocate and differences in poverty status.
Conditional on acceptance for the project, specific agricultural and residential land plots
were allocated by lottery. In Kratie Province, land had been distributed to 525 households by the end
of 2008 as a pilot project. Land recipients obtained either only agricultural land (44%), agricultural
and residential land (52%) or only residential land (four %). We excluded households who received
only residential land from our sample as conclusions about this group of 20 households are not
reliable. We refer to these two groups as the “non-resettled” group: those who were already resident
in the established villages and were given agricultural land by the project, and the “resettled” group:
those who were given both residential and agricultural land by the project and were resettled in the
new village near the established villages.). At the time of writing, around 10,000 hectares had been
allocated to approximately 5,000 households.
(b) Some evidence on ex ante differences of project members
With non-random selection of resettled farmers from the general population it is always hard
to obtain an appropriate comparison group of non-resettled farmer. The advantage of this set-up for
our experiment is that our two groups have many similarities: they were all willing to relocate, come
from the same villages, have obtained agricultural land of a similar size and thus similar potential
income, have a similar ex ante status of poverty, and are similarly motivated to farm.8 Most
importantly, the vast majority of beneficiaries in both groups had lived in the project communes for
at least four years and could therefore establish strong social relations, Moreover, we use data
originating from a random survey conducted with 84 project households in 2008 before the
allocation of land by the project and retrospective data from 2010 which provide information on the
situation of 106 project households before resettlement (Table 1) to see whether resettled and non-
10
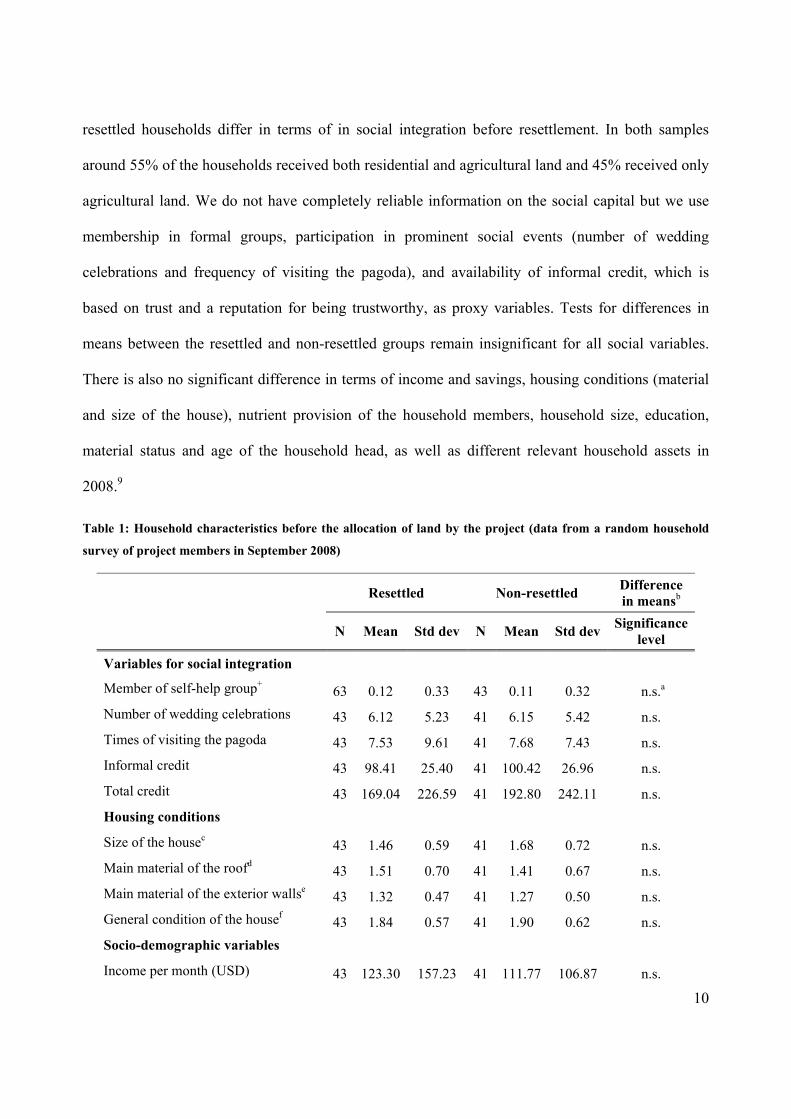
resettled households differ in terms of in social integration before resettlement. In both samples
around 55% of the households received both residential and agricultural land and 45% received only
agricultural land. We do not have completely reliable information on the social capital but we use
membership in formal groups, participation in prominent social events (number of wedding
celebrations and frequency of visiting the pagoda), and availability of informal credit, which is
based on trust and a reputation for being trustworthy, as proxy variables. Tests for differences in
means between the resettled and non-resettled groups remain insignificant for all social variables.
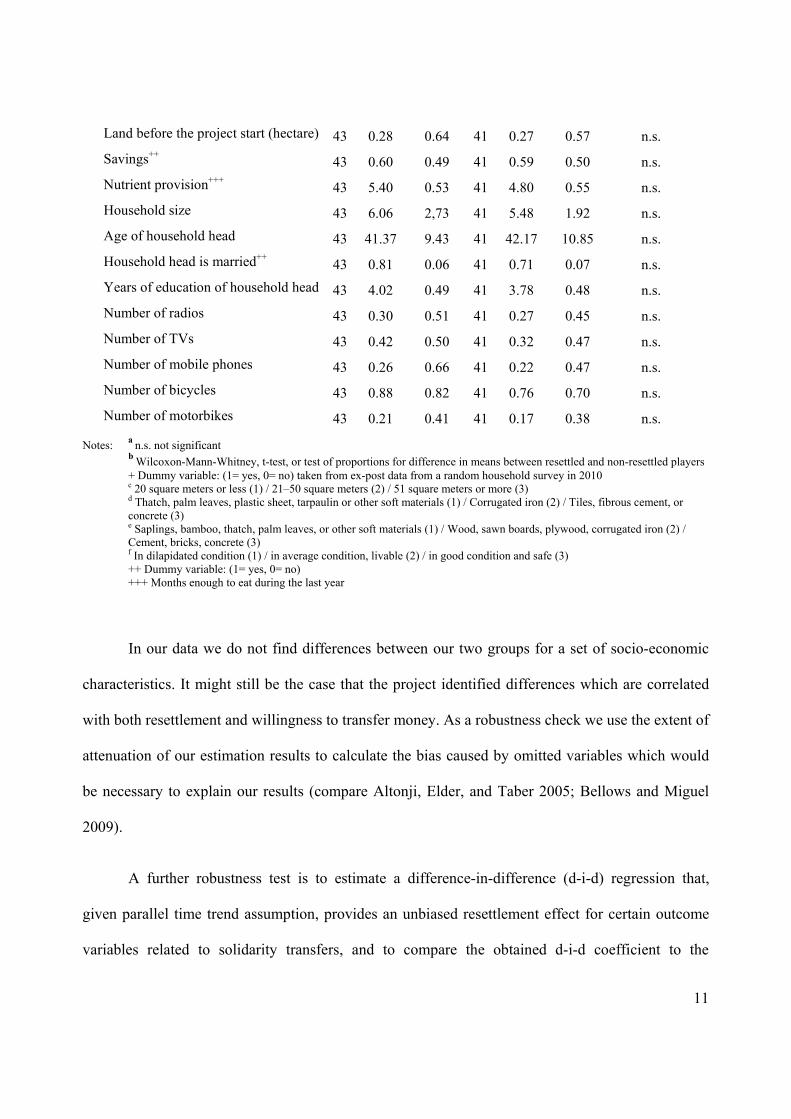
There is also no significant difference in terms of income and savings, housing conditions (material
and size of the house), nutrient provision of the household members, household size, education,
material status and age of the household head, as well as different relevant household assets in
2008.9
Table 1: Household characteristics before the allocation of land by the project (data from a random household
survey of project members in September 2008)
Resettled Non-resettled Difference
in meansb
N Mean Std dev N Mean Std dev Significancelevel
Variables for social integration Member of self-help group+
63 0.12 0.33 43 0.11 0.32 n.s.a Number of wedding celebrations 43 6.12 5.23 41 6.15 5.42 n.s. Times of visiting the pagoda
43 7.53 9.61 41 7.68 7.43 n.s. Informal credit 43 98.41 25.40 41 100.42 26.96 n.s. Total credit 43 169.04 226.59 41 192.80 242.11 n.s. Housing conditions Size of the housec
43 1.46 0.59 41 1.68 0.72 n.s. Main material of the roofd 43 1.51 0.70 41 1.41 0.67 n.s. Main material of the exterior wallse 43 1.32 0.47 41 1.27 0.50 n.s. General condition of the housef 43 1.84 0.57 41 1.90 0.62 n.s. Socio-demographic variables Income per month (USD) 43 123.30 157.23 41 111.77 106.87 n.s.
11
Land before the project start (hectare) 43 0.28 0.64 41 0.27 0.57 n.s. Savings++ 43 0.60 0.49 41 0.59 0.50 n.s. Nutrient provision+++ 43 5.40 0.53 41 4.80 0.55 n.s. Household size 43 6.06 2,73 41 5.48 1.92 n.s. Age of household head 43 41.37 9.43 41 42.17 10.85 n.s. Household head is married++ 43 0.81 0.06 41 0.71 0.07 n.s. Years of education of household head 43 4.02 0.49 41 3.78 0.48 n.s. Number of radios 43 0.30 0.51 41 0.27 0.45 n.s. Number of TVs 43 0.42 0.50 41 0.32 0.47 n.s. Number of mobile phones 43 0.26 0.66 41 0.22 0.47 n.s. Number of bicycles 43 0.88 0.82 41 0.76 0.70 n.s. Number of motorbikes 43 0.21 0.41 41 0.17 0.38 n.s.
Notes: a n.s. not significant b Wilcoxon-Mann-Whitney, t-test, or test of proportions for difference in means between resettled and non-resettled players + Dummy variable: (1= yes, 0= no) taken from ex-post data from a random household survey in 2010 c 20 square meters or less (1) / 21–50 square meters (2) / 51 square meters or more (3) d Thatch, palm leaves, plastic sheet, tarpaulin or other soft materials (1) / Corrugated iron (2) / Tiles, fibrous cement, or concrete (3) e Saplings, bamboo, thatch, palm leaves, or other soft materials (1) / Wood, sawn boards, plywood, corrugated iron (2) / Cement, bricks, concrete (3) f In dilapidated condition (1) / in average condition, livable (2) / in good condition and safe (3) ++ Dummy variable: (1= yes, 0= no) +++ Months enough to eat during the last year
In our data we do not find differences between our two groups for a set of socio-economic
characteristics. It might still be the case that the project identified differences which are correlated
with both resettlement and willingness to transfer money. As a robustness check we use the extent of
attenuation of our estimation results to calculate the bias caused by omitted variables which would
be necessary to explain our results (compare Altonji, Elder, and Taber 2005; Bellows and Miguel
2009).
A further robustness test is to estimate a difference-in-difference (d-i-d) regression that,
given parallel time trend assumption, provides an unbiased resettlement effect for certain outcome
variables related to solidarity transfers, and to compare the obtained d-i-d coefficient to the
12
resettlement coefficient of simple ex post estimation. A significant different coefficient highlights
potential ex ante differences. Although we cannot do this for our experimental measure of
willingness-to-transfer, we can test for potential bias in related variables of social ties and income.
Tables A.1 and A.2 in the appendix show that the coefficients of a difference-in-difference
estimation and a “naïve” ex post estimation for 2010 do not differ for a range of relevant variables.10
Thus, we do not expect a large bias when using simple ex-post measure of solidarity in our
experiment. Lastly, we also provide different matching estimations for our experimental solidarity
measure that also suggest that there is no strong selection bias in resettlement.
3. METHODS
Those who had received only agricultural land played the game with other project members
from their old community, and those who had received both agricultural and residential land played
it with members of their new community. In both cases the participant pool was restricted to project
members.
(a) The solidarity experiments
Our experiment consists of a risk stage followed by a solidarity stage. Each participant was
randomly allocated to two other players that formed a group. When making their risk decision
participants knew about the second stage. However, they neither knew with whom they were paired
nor could they communicate. Our risk lottery follows an ordered lottery selection design adapted
from Binswanger (1980; 1981) (see Table 2).11 We reduced the risk choices to three lotteries instead
of eight. This was necessary to reduce complexity once the risk game was combined with the
strategy method in the solidarity game. In the event of losing, the payoff is zero to activate pro-
13
social motives in the following stage. The outcome of the risk game is decided by the participant
rolling a die. Option A provides a small but secure payoff (0.50 USD). Options B and C offer a
higher expected payoff than option A, but also incorporate the risk of getting zero payoff. Option B
has a winning probability of 2/3 and appeals to players who will accept a moderate risk, whereas
option C with a winning probability of 1/3 is most attractive for risk-loving players willing to
venture a higher risk.
We were interested in measuring solidarity at the village level independent of reputation and
reciprocal network ties. Therefore we implemented an anonymous one-shot solidarity experiment in
the second stage. Decisions to transfer money were taken after the risk choice only by winners of the
game. We believe that this increases the validity of the transfers, since players already knew that
transfers were going to be made in the event of there being losers in their three person group.
However, since winning option B or C is determined by pure chance the sample of winners does not
differ from the losers. Players were asked to make transfer decisions for different possible
combinations of
a) the number of players with zero payoff in the player’s group (one or two) and
b) the risk choice of these players (B or C).
This leads to a total number of six decisions per player (two transfer decisions with one loser
in the group, and four transfer decisions with two losers in the group). To avoid strategic giving,
players were not told about other players’ transfer decisions.
14
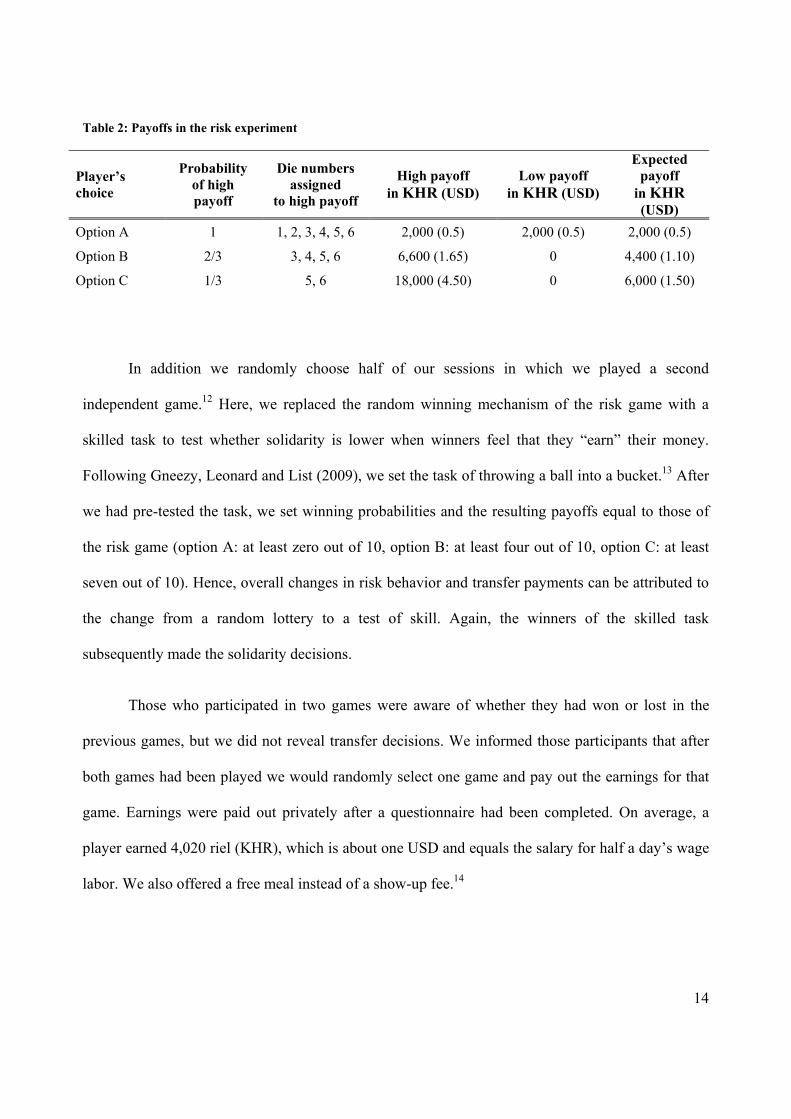
Table 2: Payoffs in the risk experiment
Player’s choice
Probability of high payoff
Die numbers assigned
to high payoff High payoff
in KHR (USD) Low payoff
in KHR (USD)
Expected payoff
in KHR (USD)
Option A 1 1, 2, 3, 4, 5, 6 2,000 (0.5) 2,000 (0.5) 2,000 (0.5) Option B 2/3 3, 4, 5, 6 6,600 (1.65) 0 4,400 (1.10) Option C 1/3 5, 6 18,000 (4.50) 0 6,000 (1.50)
In addition we randomly choose half of our sessions in which we played a second
independent game.12 Here, we replaced the random winning mechanism of the risk game with a
skilled task to test whether solidarity is lower when winners feel that they “earn” their money.
Following Gneezy, Leonard and List (2009), we set the task of throwing a ball into a bucket.13 After
we had pre-tested the task, we set winning probabilities and the resulting payoffs equal to those of
the risk game (option A: at least zero out of 10, option B: at least four out of 10, option C: at least
seven out of 10). Hence, overall changes in risk behavior and transfer payments can be attributed to
the change from a random lottery to a test of skill. Again, the winners of the skilled task
subsequently made the solidarity decisions.
Those who participated in two games were aware of whether they had won or lost in the
previous games, but we did not reveal transfer decisions. We informed those participants that after
both games had been played we would randomly select one game and pay out the earnings for that
game. Earnings were paid out privately after a questionnaire had been completed. On average, a
player earned 4,020 riel (KHR), which is about one USD and equals the salary for half a day’s wage
labor. We also offered a free meal instead of a show-up fee.14

15
(b) Experimental procedure and participants
Experimental sessions were carried out in April and May 2010 in four randomly chosen non-
resettled project villages and in the newly founded village. In total, we conducted 16 sessions (two
sessions in each of the four non-resettled village and eight sessions in the resettled village) with 225
participants (127 resettled players and 98 non-resettled players). Participants in the experiment were
randomly chosen from a complete list of project participants (around 35% of all project households).
Household members who were at least 18 years old were eligible for the experiment. Only one
person per household could take part in each session and a maximum of two players per household
were allowed to participate in total. A few days in advance, the village chief informed the people
that they could participate in an activity in which they could earn money.
Instructions were read out loud by the same person to all players in the common room of the
village community centre. All decisions took place in private. We illustrated the risk decision during
the instruction by showing posters and reading out examples for gambling choices. Every player
practiced throwing the die three times. Each time a different gambling choice was assumed and the
players verified that they understood the outcomes of the game. To reduce the complexity of the
game, every player practiced in addition the risk game by playing a practice game which was
independent of the actual game.15 When they were making their decisions, posters of the different
gambling choices were available to the players. We explained money transfer decisions in the same
way: firstly, in the common room with examples and posters for different numbers and types of
losers and secondly in private with test questions about the solidarity game. Here no practice game
took place.
As Table 3 shows, all participants played the risk game (N= 225). The transfer decisions in
the second stage were only recorded for those players who won the risk game in the first stage (N=

16
126, 76 resettled and 50 non-resettled players). Each player made six transfer decisions, leading to
756 observations. For game two with the skilled task, we randomly determined half of the sessions
for each group that played the game involving a skilled task (N= 116). Finally 64 subjects won the
skills game and made transfer decisions (34 resettled and 30 non-resettled players).
Table 3: Number of participants (number of observations) in each game
1st game 2nd gameRisk Solidarity Skilled task Solidarity
Resettled 127 76 (456) 67 34 (204)Non-resettled 98 50 (300) 49 30 (180)Total 225 126 (756) 116 64 (384)
Although we chose participants randomly from a homogeneous group, there was a small
difference between the two groups in terms of age, which we control for in our regression (Table 4).
There are also more households who have some savings in the non-resettled group and household
who have more than 50 USD credit in the resettled group, which might be a consequence of
resettlement, since resettled farmers have higher investment needs. Furthermore, as expected, the
non-resettled players reported on average significantly more friends and family members than the
resettled players in the experimental sessions.16 However, this difference is not very large (the
average percentage of friends in the session is 10% for resettled players and 20% for non-resettled
players). Also, 30% of players in both samples reported having no friends taking part in the session.
In our analysis we control for the network a person had within the experimental session.
Table 4: Individual characteristics of the experimental participants from the post-game questionnaire
Resettled, N= 127
Non-resettled, N= 98
Difference in meansb
Mean Std dev Mean Std dev Significance level
Income per month (USD) 124.40 101.89 113.52 85.71 n.s. Savings+
0.27 0.44 0.40 0.49 5%

17
Nutrient provision++ 2.65 0.48 2.63 0.48 n.s.
Household size 5.46 1.88 5.74 1.92 n.s. Gender of experimental participant (1= female, 0= male) 0.58 0.49 0.58 0.49 n.s.a
Experimental participant is household head+ 0.48 0.50 0.50 0.50 n.s.
Age 37.08 10.66 41.14 12.31 1%
Married+ 0.77 0.41 0.81 0.38 n.s.
Years of education 3.92 2.75 3.95 2.28 n.s.
More than 50 USD debt 0.71 0.45 0.50 0.50 1% Years living in the village 1.15 0.51 33.45 13.92 1% Relative number of friends+++ 10.54 12.00 19.71 22.10 1%
Relative number of family members+++ 2.24 5.59 7.47 11.52 1%
Notes: a n.s. not significant b Wilcoxon-Mann-Whitney, t-test, or test of proportions for difference in means between resettled and non-resettled players + Dummy variable: (1= yes, 0= no) ++ Average number of meals with enough food for all household members during the last month +++ In relation to the session size
(c) Hypotheses
Selten and Ockenfels (1998) find that what they call “giving behavior” in a solidarity game
depends on one’s expectations about the giving behavior of others. As our groups are anonymous,
expectations about transfers at the village level are relevant. Coming into a new community leads to
uncertainties about other people’s behavior. Moreover, as solidarity can be unconditional and based
on feelings of togetherness and cohesion, resettlement may have an effect on transfer sending
beyond rational expectations. We expect a negative effect of resettlement on solidarity as a result of
i) lower expectations that others would have helped, ii) lower desire to support fellow villagers
stemming from lower solidarity, and iii) fewer family members and friends taking part in the
session.
18
In the second game, players could actively influence the outcome of the game, which
induced a stronger feeling of being entitled to the money. As Cherry, Frykblom and Shogren (2002)
and Hoffman, McCabe, Shachat and Smith (1994) show for an ultimatum game, subjects transfer
substantially lower amounts if they earn their winnings or earn the right to be the first mover. This
effect is in part attributed to a difference in performance or “status” (Cox, Friedman, and Gjerstad
2007), “mental accounting” (Cherry and Shogren 2008), or a reduction of the supply effect in
experimental economics (Carpenter, Liati, and Vickery 2010). Furthermore, losers in the skilled task
are fully responsible for their failure because they misjudged their skills. According to Trhal and
Radermacher (2009), self-inflicted neediness reduces solidarity payments. Therefore, when it comes
to the skilled game we expect a reduction of transfers in both resettled and non-resettled groups and
maybe even an increase in the difference between resettled and non-resettled players.
4. RESULTS
(a) Descriptive analysis
Transfers in the second stage are contingent on winning the random mechanism in game one
and the skilled task in game two and therefore on the choice of the players in the first stage. Figure 1
shows choices of resettled and non-resettled participants for the first stage.17 For both games we do
not find a significant difference in choices between the resettlement groups.18
Due to the combination of the risk game with the solidarity game a player might expect a
non-zero payoff in the event of losing the game (depending on the player’s expectation of transfers
from fellow villagers). Hence the risk of losing can be partly shared within the solidarity group and
transfers can be interpreted as an informal insurance mechanism. People might want to avoid being
a burden to anyone and thus play the safe lottery more often. This is, however, an unrealistic
interpretation since the choices were anonymous, and thus humility, shame or other motives cannot

19
be involved. With informal insurance, players might rather choose a higher risk option as they do
not have to bear the cost of losing alone. Choosing a higher risk is also more efficient for the group
of three, provided that redistribution among them takes place.
After the player took her risk choice but before rolling the die (or throwing the ball), we ask
her to state how much transfer she expects from a player winning the different risk options. Hence
expectations are contingent on own risk choice and the possibility of losing. Therefore expectations
are only available for players who were at risk of losing the risk game (risk option B or C). In line
with our interpretations, we find that higher transfer expectations go along with taking higher risks
(mean expectation of players who chose option B: 643.91 KHR, mean expectation of players who
chose option C: 838.81 KHR, p-value 0.02). Mean expectations differ at the one % significance
level between resettled and non-resettled players (resettled players: 584.28 KHR, non-resettled
players: 905.55 KHR, p-value: 0.00) likely being caused by stronger solidarity in the established
villages.19
Fig. 1: Choice of non-resettled and resettled players with the random winning mechanism and the skilled task
18.11
49.61
32.28
18.37
43.88
37.76
020
4060
A B C A B C
Resettled, N= 127 Non-resettled, N= 98
Per
cent
age
of p
laye
rs
Risk choice with random winning mechanism
20
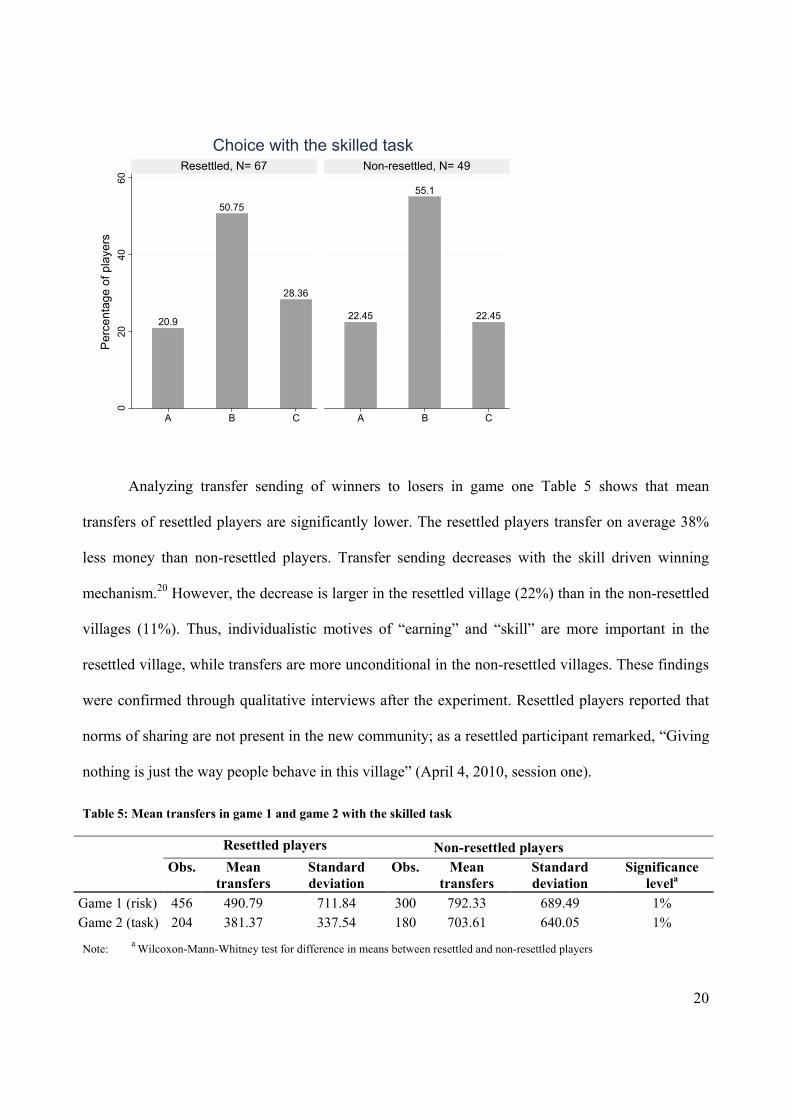
Analyzing transfer sending of winners to losers in game one Table 5 shows that mean
transfers of resettled players are significantly lower. The resettled players transfer on average 38%
less money than non-resettled players. Transfer sending decreases with the skill driven winning
mechanism.20 However, the decrease is larger in the resettled village (22%) than in the non-resettled
villages (11%). Thus, individualistic motives of “earning” and “skill” are more important in the
resettled village, while transfers are more unconditional in the non-resettled villages. These findings
were confirmed through qualitative interviews after the experiment. Resettled players reported that
norms of sharing are not present in the new community; as a resettled participant remarked, “Giving
nothing is just the way people behave in this village” (April 4, 2010, session one).
Table 5: Mean transfers in game 1 and game 2 with the skilled task
Resettled players Non-resettled players Obs. Mean
transfers Standard deviation
Obs. Mean transfers
Standard deviation
Significance levela
Game 1 (risk) 456 490.79 711.84 300 792.33 689.49 1% Game 2 (task) 204 381.37 337.54 180 703.61 640.05 1%
Note: a Wilcoxon-Mann-Whitney test for difference in means between resettled and non-resettled players
20.9
50.75
28.36
22.45
55.1
22.45
020
4060
A B C A B C
Resettled, N= 67 Non-resettled, N= 49
Per
cent
age
of p
laye
rs
Choice with the skilled task

21
When we analyze transfers with respect to how much money a potential sender has at hand
(whether the player chose option A or won option B or C) and how high a risk the potential
receiver(s) took (lost option B or option C), we observe the following patterns (see Table C.1 in the
appendix). Firstly, transfer per person was lower to two losers in their group than to one loser
(except the few C-senders who transferred similar amounts no matter whether one or two other
players lost) but the total sum of transfers is bigger in the case of two losers. Secondly, even though
absolute transfers increased with the available budget, A-senders were willing to give, with an
average of 14.19%, the highest proportion of their earning (283.76 KHR), followed by B-senders
(9.52%, 628.26 KHR) and C-senders (6.94%, 1,250 KHR).21 Higher relative contributions of less
wealthy people are also found in public good games (Hofmeyr, Burns, and Visser 2007; Buckley
and Croson 2006). Thirdly, there is no evidence that senders discriminate over the risk choice of the
loser. This holds both in resettled and non-resettled communities. Contrary to Trhal and
Radermacher (2009) who played with German university students, we find no evidence that wealthy
individuals help less if they realize that neediness is self-inflicted. Given the importance of 'fate' in
asian countries this seems not too surprising. High risk participants who are incautious are not
“punished” with lower transfers. Average sending to C-losers has a tendency to be lower but this
difference is small and insignificant. We also do not find any evidence of homophily or in-group
bias with higher transfer sending towards people with the same risk choice. If high risk investments
are insured the same way as low risk investments there does not seem to be an innovation bias
caused by a lack of insurance.
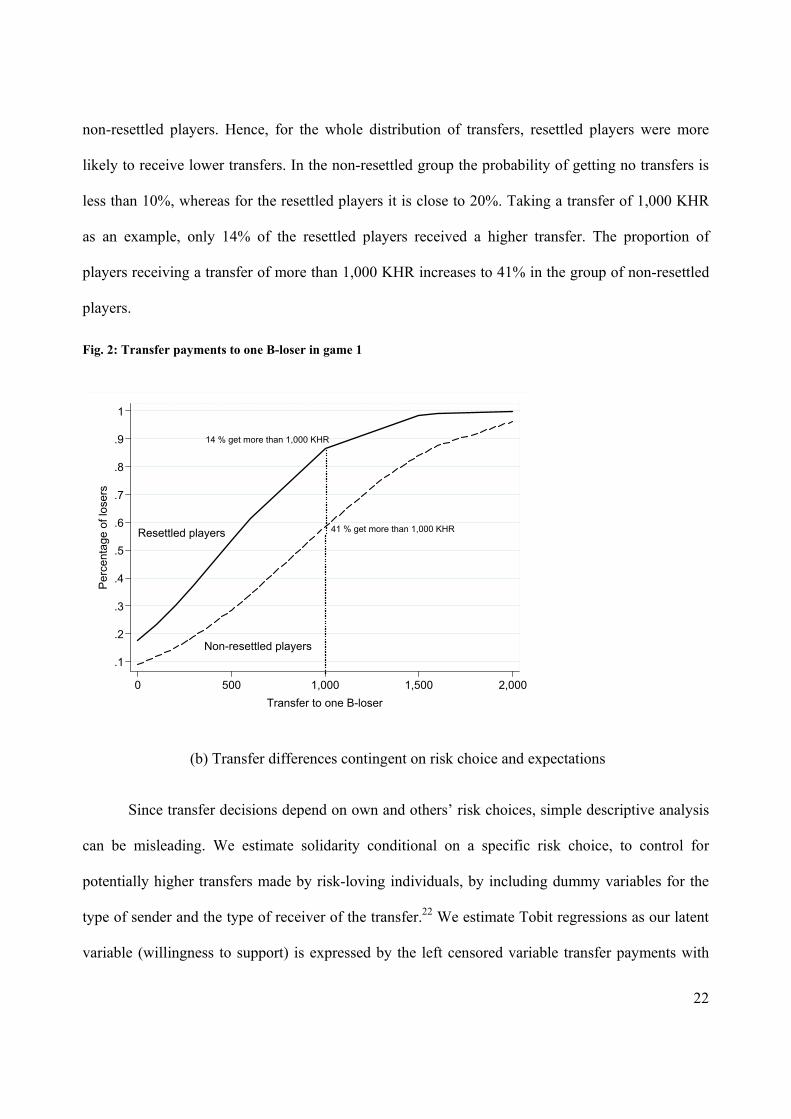
Figure 2 shows the cumulated density function of potential transfers to one B-loser for
resettled and non-resettled players. The curve for the resettled players lies entirely above that for the
22
non-resettled players. Hence, for the whole distribution of transfers, resettled players were more
likely to receive lower transfers. In the non-resettled group the probability of getting no transfers is
less than 10%, whereas for the resettled players it is close to 20%. Taking a transfer of 1,000 KHR
as an example, only 14% of the resettled players received a higher transfer. The proportion of
players receiving a transfer of more than 1,000 KHR increases to 41% in the group of non-resettled
players.
Fig. 2: Transfer payments to one B-loser in game 1
(b) Transfer differences contingent on risk choice and expectations
Since transfer decisions depend on own and others’ risk choices, simple descriptive analysis
can be misleading. We estimate solidarity conditional on a specific risk choice, to control for
potentially higher transfers made by risk-loving individuals, by including dummy variables for the
type of sender and the type of receiver of the transfer.22 We estimate Tobit regressions as our latent
variable (willingness to support) is expressed by the left censored variable transfer payments with
Non-resettled players
Resettled players
14 % get more than 1,000 KHR
41 % get more than 1,000 KHR
.1
.2
.3
.4
.5
.6
.7
.8
.9
1
Per
cent
age
of lo
sers
0 500 1,000 2,0001,500Transfer to one B-loser

23
24% of all observations censored at zero. Table 6 contains the results of Tobit regressions on the six
transfer choices that every winner of a risk game made for all possible types of losers in that
person’s group. Individual socio-demographic controls and session size are included in all
regressions.
We focus on the transfer difference between resettled and non-resettled players. We start by
analyzing only the transfer decisions in game one with the random winning mechanism (regression
(1), N= 126, observations= 756). Here, the resettlement dummy is negative and significant at the
five % level. In a second step, we estimate a random effects Tobit regression which also includes the
transfer decisions in game two with the skilled task (regression (2), N= 156, observations= 1,140).
The resettlement dummy increases in magnitude and remains negatively significant at the one %
level.
The solidarity experiment further includes elements of trust, since transfers depend on
expectations about the solidarity of others (Selten and Ockenfels, 1998). To separate the effects of
solidarity from reciprocal motives, we include transfer expectations in regression (3) (N= 112,
observations= 810).These have a significant positive influence on transfers, confirming the results of
Selten and Ockenfels (1998). The more interesting finding, however, is that resettlement remains
negatively significant. That is, lower transfers are driven not only by lower expectations about the
support of others, but also by a preference for not helping people in the resettled village.23
In regression (4) (N= 156, observations= 1,140) we exclude the controls for the network of
family and friends in the session. The negative coefficient of the resettlement dummy increases, as it
now also accounts for the loss of social relations in the new village (compare regressions (2) and
(4)). The increase in the coefficient is merely -40.9 KHR. Thus, we believe that the anonymity of
our experiment cancelled out the effect of familiarity in the session. As a robustness check, we

24
estimate the average treatment effect on the treated using the relative number of family members
and friends with regard to session size as matching variables to estimate the propensity score (Table
C.4 in the appendix). With all different matching methods we still find a significant negative
coefficient of the resettlement dummy ranging from -163 to -391 KHR. These results show that
unconditional giving is driven not so much by the presence of a personal social network as by
solidarity at the village level. Furthermore, the relatively small influence of number of family
members and friends in the session suggests that anonymity, independence of games and no
communication successfully removed personalized trust motivations from the experiment.
Lastly, we estimate transfers without controlling for the risk choices of senders and receivers,
which gives us the total effect of voluntary resettlement (regression (5), N= 156, observations=
1,140). Since there are no significant differences in risk choices between resettled and non-resettled
players we find hardly any differences between regressions (2) and (5).
Table 6: Multivariate analysis explaining transfers (marginal effects)
(1) (2) (3) (4) (5) (6)
Tobit regression+
Random-effects Tobit
regression++
Random-effects Tobit regression++
Random-effects Tobit regression++
Random-effects Tobit regression++
Random-effects Tobit
regression++
VARIABLES Transfers game 1
(risk choice)
Transfers game 1 and
2 (skilled task)
Transfers game 1 and 2 (skilled task) for B- and C-
senders
Transfers game 1 and 2 (skilled task)
Transfers game 1 and
2 (skilled task)
Transfers game 1 and
2 (skilled task)
Resettlement -371.6** -549.7*** -413.9** -590.6*** -556.8*** -514.5***
(179.9) (151.5) (197.6) (140.6) (160.3) (152.2)
Skilled task -100.9*** -186.2*** -100.1*** -107.9*** -106.2***
(28.93) (40.53) (28.92) (30.00) (30.03)
Transfer 0.424*** expectations (0.137) Controls for session
Yes Yes Yes No Yes No
25
network Controls for sender and receiver type
Yes Yes Yes Yes No No
Individual controls
Yes Yes Yes Yes Yes No
Observations 756 1,140 810 1,140 1,140 1,140
Number of individuals
126 156 112 156 156 156
Notes: Standard errors in parentheses; *** p<0.01, ** p<0.05, * p<0.1 + Standard errors are clustered on the individual level ++ Random effects are implemented on the individual level
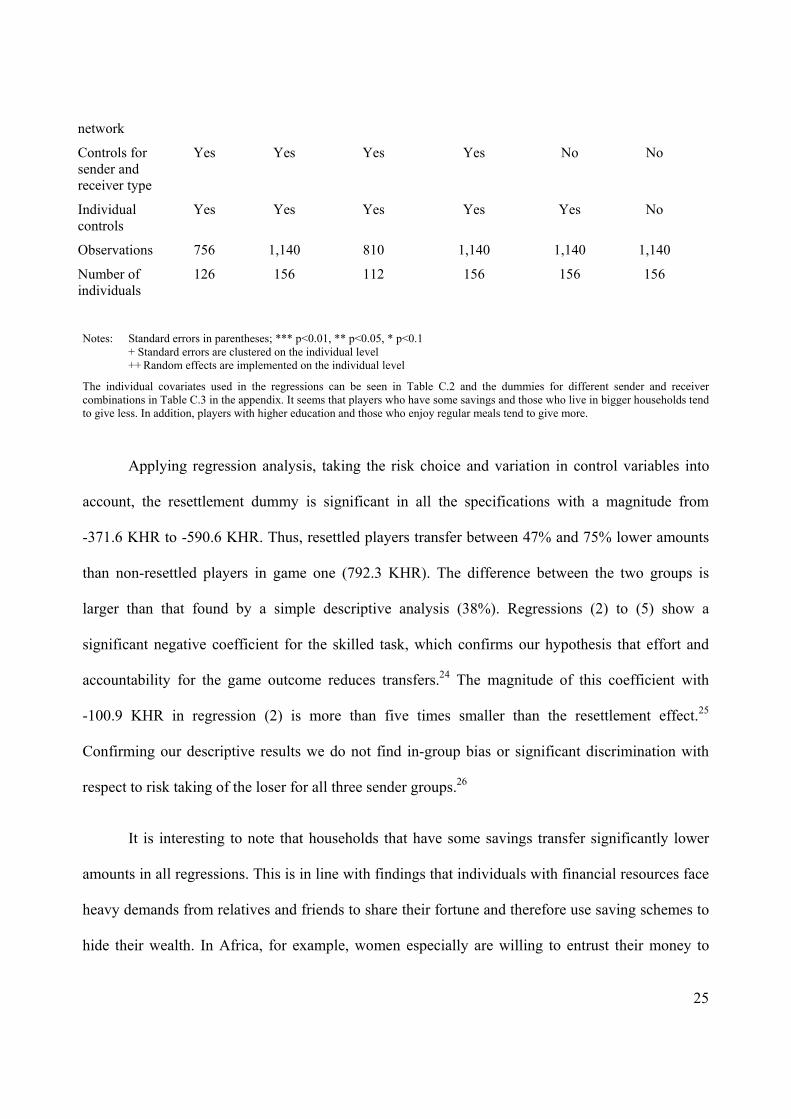
The individual covariates used in the regressions can be seen in Table C.2 and the dummies for different sender and receiver combinations in Table C.3 in the appendix. It seems that players who have some savings and those who live in bigger households tend to give less. In addition, players with higher education and those who enjoy regular meals tend to give more.
Applying regression analysis, taking the risk choice and variation in control variables into
account, the resettlement dummy is significant in all the specifications with a magnitude from
-371.6 KHR to -590.6 KHR. Thus, resettled players transfer between 47% and 75% lower amounts
than non-resettled players in game one (792.3 KHR). The difference between the two groups is
larger than that found by a simple descriptive analysis (38%). Regressions (2) to (5) show a
significant negative coefficient for the skilled task, which confirms our hypothesis that effort and
accountability for the game outcome reduces transfers.24 The magnitude of this coefficient with
-100.9 KHR in regression (2) is more than five times smaller than the resettlement effect.25
Confirming our descriptive results we do not find in-group bias or significant discrimination with
respect to risk taking of the loser for all three sender groups.26
It is interesting to note that households that have some savings transfer significantly lower
amounts in all regressions. This is in line with findings that individuals with financial resources face
heavy demands from relatives and friends to share their fortune and therefore use saving schemes to
hide their wealth. In Africa, for example, women especially are willing to entrust their money to
26
“susu men” in order to withdraw it from their network (Besley 1995, 2150) or to put it into formal
saving accounts with effectively negative interest rates (Dupas and Robinson 2013). Since non-
resettled households are significantly more likely to have savings, these findings reduce the size of
our resettlement effect.
Considering the non-random nature of the resettlement choice, the work of McKenzie,
Stillman, and Gibson (2010) provides some information on the magnitude of the bias. Comparing
income improvements after migration, McKenzie, Stillman, and Gibson (2010) find a 25–35% bias
in OLS regressions with non-experimental data in comparison to experimental migration data. But
even then, the resettlement effect identified in regression (2), with -357.3 KHR and 45% of the
average transfer payment of the non-resettled players in game one (792.3 KHR), is still substantial.
As a further robustness check we follow Altonji, Elder, and Taber (2005) and Bellows and
Miguel (2009) who use the attenuation caused by selection on observables as a guide to the degree
of selection on unobservables. Comparing regression (2) with a resettlement coefficient of -549.7
Riel (including full controls) with regression (6) leading to a resettlement coefficient of -514.5 Riel
(without any controls), shows that attenuation is with 35.2 Riel very small. Given these estimates,
the selection on unobservables would need to be 15.62 times stronger than selection on observed
variables in order to compensate the entire resettlement effect. Given the rich set of control variables
this seems highly unlikely.27
(c) Ex post survey data on the importance of network support
When we consider the prevalence of various types of shock – such as bad weather
conditions, livestock disease, severe illness of a household member, or fire or theft destroying a
household’s property – the importance of solidarity for our sample becomes evident. About two-
thirds of the players reported having experienced at least one severe shock during the last two years,
27
and more than 28% reported several shocks. Furthermore, 97% of these players had experienced
difficulties in coping with these shocks. Taking the monetary transfers in the games as an indicator
of general willingness to support fellow villagers, coping with these shocks in the resettled
community is clearly more difficult.
The importance of solidarity becomes even more pronounced when we look at the poverty
status before and after resettlement of project participants. Before resettlement in 2008, about 85%
of the project households earned less than 1.25 USD per day. In 2010, the proportion increased in
the group of resettled participants to 88%, whereas it decreased in the group of non-resettled
participants to 79%. Similarly, there were no income differences in 2008 between the households
which got residential land and those who did not get residential land (see Table 1). After
resettlement in 2010, the yearly household income of resettled beneficiaries was on average about
20% lower than that of non-resettled participants (resettled participants: 1,130.61 USD, non-
resettled participants: 1,429.09 USD, p-value: 0.09). Nevertheless, in our specific case, project
transfers could compensate for the greater vulnerability of resettled players. On average 33.5% of
the yearly income of resettled participants came from project transfers, while in the group of non-
resettled participants project transfers account only for 18% of the average yearly income.
Considering the yearly income per household without transfers, participants in the resettled village
had a 36% lower income than non-resettled participants (resettled participants: 751.19 USD, non-
resettled participants: 1,175.55 USD, p-value: 0.02). Here, 98% of the resettled participants would
have fallen below the poverty line and 86% of the non-resettled beneficiaries. Furthermore, resettled
participants’ income was lower in 2010 than it had been in 2008, whereas for non-resettled
participants it was higher. The resettled participants’ income was probably lower because of time
lost building a new home and new community facilities, but more importantly because of the lack of
social capital. Intuitively, a person’s family and friends, community norms, institutions and

28
associations constitute an important asset people can call for in a crisis but also in the normal
production process (i.e. knowledge transfer, mutual help in clearing the field, planting, weeding,
harvesting, selling, etc.). As stated by Narayan and Pritchett (1999) “a village’s social capital has an
effect on the incomes of the households in that village, an effect that is empirically large, definitely
social, and plausibly causal”. One year after the land distribution, in both groups agricultural income
is with around 25% of income excluding transfers for the resettled and 30% of income excluding
transfers for the non-resettled project members, the second most important income source. But, non-
resettled participants were earning significantly more income with agricultural production in 2010
(resettled participants: 230.89 USD, non-resettled participants: 164.89 USD, p-value: 0.08).
These findings illustrate the heavy dependence of resettled participants on transfers mainly
coming from the project. It is therefore not surprising that perceived ‘future security’ in 2010 was
weaker in the group of resettled participants (p-value: 0.07). We anticipated that especially after the
end of the project in 2013, when no more transfer could be expected, solidarity and solidarity inside
the new village would become essential for the farmers if they are to succeed.
5. CONCLUSIONS
Solidarity is required for the well functioning of communities and even the society as a
whole. But, because other-regarding preferences evolve endogenously depending on the context
(compare for example Ockenfels and Weimann (1999) and Brosig-Koch et al. (2011) who identify
significant differences in solidarity (and cooperation) between East and West German subject
tracing back to opposing economic and social history) close monitoring of interventions is needed.
The aim of this paper is to investigate systematic the impact of resettlement on the propensity
of individual's to express solidarity norms with fellow villagers. We carry out this investigation in
the context of a unique resettlement project in Cambodia. We conducted a lab-in-the-field
29
experiment comparing voluntarily resettled and non-resettled participants of a land reform project.
All farmers applied for residential and agricultural land and were hence willing to relocate but
farmers in our control group (non-resettled players) received only agricultural land and were still
living in their villages of origin. Our treatment group (resettled players) received residential as well
as agricultural land and moved to a newly founded village about one year prior to our behavioral
experiment. We conducted a solidarity experiment measuring willingness to transfer money to
anonymous community members and then compare transfer between the resettled village and the
non-resettled villages.
We found that resettled players in the experimental game transferred on average between
47% and 75% lower amounts than non-resettled players. Close to 20% of the losers in the resettled
group received no transfers at all, whereas less than 10% of the non-resettled group received no
transfers. One might argue that non-resettled farmers are richer (given the survey data) and therefore
more likely to transfer money. However, this income effect was not significant for our experimental
participants. On the contrary, we suggest that our analysis estimates a lower bound of the “social
effect of resettlement” carried out in less carefully designed resettlement programs. This is because
we would expect even less giving if (i) resettlement was forced instead of voluntary, (ii) no project
support was offered, (iii) we used an experiment to also measure reciprocal ties, (iv) savings were
equally distributed, or (v) village composition in the non-resettled villages was taken into account,
instead of including only the poorest individuals, since richer community members often constitute
the main source of financial and technological assistance and share their agricultural equipment with
poorer neighbors (Lin 2001). A survey carried out before resettlement indicates that there were no
observable differences regarding social integration predating resettlement. Consequently, the
transfer difference is probably caused by voluntary resettlement. We further find that the
resettlement effect remains large and significant when we match participants with respect to their
30
network size and when we include expectations. Both results support our view that transfer
difference is the result of lower solidarity in resettled communities and that this difference is not
mainly driven by the specific network people have and goes beyond consideration of reciprocity.
We do not find that people “punish” high risk taking; instead, the norm of solidarity applies
similarly to everyone and is on average 10% of available income. However, we find a slight
decrease in solidarity when participants could earn their experimental money.
Our findings on solidarity transfers in the experiment also relate to the lower real world
income of resettled project participants after resettlement. Solidarity transfers are related to ‘social
capital’ which is thought to be an important ingredient for coping with shocks and production
(planting, weeding, harvesting, and selling). Considering the low income level of project
participants, especially in the resettled community, network support plays a vital role. Two-thirds of
all players in our experiment reported experiencing substantial shocks such as bad harvests or illness
since receiving the land from the project. Hence, besides support from their network of family and
friends, willingness to support each other inside the village is a major source of help at the moment.
At the time of our study, reciprocal ties of friendship in the resettled village were not yet established
and solidarity was very low. With the loss of solidarity, our study identifies an important effect of
voluntary resettlement that has not been fully explored up to now. Most likely the lower income of
resettled farmers (although they did not need to commute) is stemming from the lack of mutual aid
in production.
Land reforms are high on the international agenda but studies on their consequences mostly
concentrate on economic variables, revealing mixed results, or on involuntary resettlement.
Therefore, we believe that our study presents useful insights on the social and economic losses
caused by voluntary resettlement within a land reform program. Our results of lower solidarity in
31
resettled communities complement the analysis of Barr (2003) who finds that resettled players show
lower trust. While trust is important for investment and reciprocal arrangements, solidarity is a
better measure for altruism.
Our findings are relevant for resettlement policies based on the “economics of
compensation”, which often neglect these and other social costs by offering too small compensation
amounts. They have important implications for the design of resettlement policies underlining that
the provision of community building measures and their monitoring is mandatory. Moreover, the
availability of insurance against shocks in developing countries and in particular in remote rural
areas is urgently needed. There are several directions for future fruitful research. Monitoring social
changes and their interaction with economic changes over time, both in the medium and in the long
run, would provide deeper guidance for policy makers. Thereby, solidarity and reciprocal relations
within the resettled village, but also the development of networks with the village of origin should
be in the focus.

32
NOTES
1 Unsurprisingly, forced resettlement can lead to a poverty trap consisting of poor harvest and damaged informal risk-
coping networks (Lam and Paul 2013).
2 Somewhat related to the topic of resettlement is the experimental literature on “social distance”, which captures
people’s increased willingness to give when they have clues about nationality, occupation, race, religion (Charness and
Gneezy 2008), or friendship and kinship (Vollan 2011).
3 Barr and Genicot (2008) construct a game in which participants form risk-sharing groups to insure against income
shocks. This study does not explicitly test an effect of resettlement. The authors do not find a significant difference
between resettled and non-resettled players’ willingness to share risks, but they do find that resettled villagers form
significantly larger risk-sharing groups.
4 While reciprocal, incentive-based risk-sharing motives also play a role, altruism seems to explain the largest part of
transfers in previous lab-in-the-field experiments (Leider et al. 2009; Ligon and Schechter 2012).
5 Furthermore, the risk of losing land mainly through forced eviction because of large infrastructure development
projects is substantial. Amnesty International (2008) estimates that at least 150,000 Cambodians (one % of the rural
population) are living at risk of forced eviction.
6 The average land parcel in Cambodia is 0.69 hectares and small-scale farming is common, with 68% owning less than
0.5 hectares (MoP and UNDP 2007). Since the yearly average rice yield between 2000 and 2008 was 2.26 ton/ hectare
(Yu and Fan 2011), the distributed land parcels provide a good opportunity for the project participants.
7 Out of 1,139 applicants 525 households were selected as land recipients.
8 There is thus no influence of social distance due to variation in nationality, education, occupation, race, or religion
between the two groups.
9 Additionally, we estimate a probit regression that includes those proxies available for 2008 and socio-demographic
information about the households. None of the social variables is found to be significant. We also do not find any
difference at the village level between the non-resettled villages and the newly founded village with regard to
availability of credit, types of shocks, fluctuation inside the villages, income composition, market integration, living
conditions in the village relative to the rest of the country, collective action on the village level, presence of minorities
including religious differences, or availability of insurance.

33
10 The same holds true if we restrict the sample to those households with panel data.
11 This game was also used by Barr and Genicot (2008) in Zimbabwe.
12 Due to time constraints we could not play a second game in all sessions.
13 Gneezy, Leonard, and List (2009) do not find any gender differences. In our task men performed slightly better than
women (mean value men: 4.38, mean value women: 3.92) but the difference is only significant at the 10% level. We also
do not find a correlation between performance in the task and age.
14 The experimental protocol and posters used for visualization are included in appendix D and E.
15 Even though, the practice game is independent from the actual game, we controlled for the outcome of the practice
game in another specification. All results remained robust and no significant influence of the outcome is identified.
16 The non-resettled players also reported a slightly higher number of players they disliked in their session. As there
were only three non-resettled and two resettled players who disliked other players, we do not discuss the possible
consequences of this.
17 We assume an ordinal scale: option A=1, option B= 2, and option C= 3.
18 We use the Wilcoxon-Mann-Whitney test, t-test, or test of proportions to compare resettled and non-resettled players
and the Wilcoxon signed rank sum test to compare the behavior of players over the three games.
19 Additional information on the risk choice with the skilled task is provided in appendix B.
20 As there is no significant difference between the mean risk choices of resettled and non-resettled players in both
games, we only report mean solidarity transfers independent of the risk choice. But also comparing those players who
made the same risk choice in game one and in the skilled task shows a significant reduction in transfer sending (N= 21,
game one: 638.89, skilled task: 607.14, p-value: 0.02). Regression analysis controls for the type of sender. Graphs of the
transfer difference between resettled and non-resettled players in game one and in the skilled task are shown in Figures
C.1, C.2 and C.3 in the appendix. In all risk groups in game one, considerably more resettled players sent no transfer
than non-resettled players.
21 Figure C.1 in the appendix shows a Gaussian probability curve for the relative transfers from the three risk groups.
Even though A-senders have the highest probability of sending no transfer, the above described order of relative
transfers becomes evident for transfers bigger than 0.3% of the payoff.
34
22 In total 17 dummies are considered. The coefficients of the dummies and other control variables are presented in
Tables C. 2 and C. 3 in the appendix.
23 The resettlement coefficient also remains significant and of relevant size if we run the estimation only on A-senders
which are non-randomly determined as winners (-345.9 Riel on the 1% significance level) and if we run the estimation
on B- and C- senders excluding expectations for which winning is randomly determined (-529.3 Riel on the 1%
significance level).
24 We test also for heterogeneity of treatment effects for resettlement by stepwise including interaction terms between
resettlement status and all socio-demographic variables included in our regression. We also test an interaction term
between resettlement and the skilled task. All interaction terms turn out to be insignificant.
25 As robustness check we follow Cameron and Trivedi (2009). The resettlement effect remains significant when by
exclude the upper five % of transfer sending, when we use the natural logarithm and estimate with Tobit or OLS
specification. The effect also holds when we separate censored data from non-censored data using two specifications.
Firstly, we estimate a two-part model which models the decision to send transfers as a logit estimation and secondly the
level of transfers conditional on the transfer being non-zero as an OLS estimation. Secondly, we estimate the same
decisions with a Heckman selection model. In both cases the resettlement dummy is negatively significant for the
decision to send transfers and negatively significant for the level of transfers.
26 Mean comparison tests for all three sender types over adequate receiver types are insignificant in all regressions.
27 Including the controls for sender and receiver types the resettlement coefficient is with -508.51 only slightly smaller
than without any controls. Here attenuation caused by unobservables would have to be 13.35 times bigger to explain
away the resettlement effect.

REFERENCES
Abutte, W.S. 2000. Social re-articulation after resettlement: Observing the Beles valley
scheme in Ethiopia. In Risks and reconstruction: Experiences of resettlers and
refugees, edited by M. M. Cernea and C. McDowell. Washington: The World Bank.
Albertus, Michael, and Oliver Kaplan. 2013. Land Reform as a Counterinsurgency Policy
Evidence from Colombia. Journal of Conflict Resolution 57 (2):198-231.
Altonji, Joseph G., Todd E. Elder, and Christopher R. Taber. 2005. Selection on
observed and unobserved variables: Assessing the effectiveness of Catholic
schools. Journal of political economy 113 (1):151-184.
Amnesty International. 2008. Rights Razed; Forced evictions in Cambodia.
http://www.amnesty.org/en/library/asset/ASA23/002/2008/en/b1328237-07c2-11dd-
badf-1352a91852c5/asa230022008eng.pdf.
Attanasio, Orazio, Abigail Barr, Juan-Camilo Cardenas, Garance Genicot, and Costas
Meghir. 2012. Risk Pooling, Risk Preferences, and Social Networks. American
Economic Journal: Applied Economics 4 (2):134-167.
Bardsley, Nicholas. 2008. Dictator game giving: altruism or artefact? Experimental
Economics 11 (2):122-133.
Barr, Abigail. 2003. Trust and Expected Trustworthiness: Experimental Evidence from
Zimbabwean Villages. The Economic Journal 113 (489):614-630.
Repeated Author. 2004. Forging Effective New Communities: The Evolution of Civil
Society in Zimbabwean Resettlement Villages. World Development 32 (10):1753-
1766.
Barr, Abigail, Marleen Dekker, and Marcel Fafchamps. 2010. The formation of
community based organizations in sub-Saharan Africa:An analysis of a quasi-
experiment. Economic and Social Research Council (UK).
Barr, Abigail, and Garance Genicot. 2008. Risk Sharing, Commitment and Information:
An experimental analysis. Journal of the European Economic Association 6
(6):1151-1185.

Bellows, John, and Edward Miguel. 2009. War and local collective action in Sierra
Leone. Journal of Public Economics 93 (11):1144-1157.
Berg, Todd M. Vanden. 1999. “We Are Not Compensating Rocks”: Resettlement and
Traditional Religious Systems. World Development 27 (2):271-283.
Besley, Timothy. 1995. Savings, Credit and Insurance. In Handbook of Development
Economics, edited by J. Behrman and T. N. Srinivasan. Amsterdam: North-Holland
Press.
Binswanger, Hans P. 1981. Attitudes Toward Risk: Theoretical Implications of an
Experiment in Rural India. The Economic Journal 91 (364):867-890.
Binswanger, Hans Peter. 1980. Attitudes Toward Risk: Experimental Measurement in
Rural India. American journal of agricultural economics 62 (3):395-407.
Brosig-Koch, Jeannette, Christoph Helbach, Axel Ockenfels, and Joachim Weimann.
2011. Still different after all these years: Solidarity behavior in East and West
Germany. Journal of Public Economics 95 (11):1373-1376.
Buckley, Edward, and Rachel Croson. 2006. Income and wealth heterogeneity in the
voluntary provision of linear public goods. Journal of Public Economics 90 (4–
5):935-955.
Cameron, Adrian Colin, and Pravin K. Trivedi. 2009. Microeconometrics using stata. Vol.
5: Stata Press College Station, TX.
Carpenter, Jeffrey, Allison Liati, and Brian Vickery. 2010. They Come To Play.
Rationality and Society 22 (1):83-102.
Charness, Gary, and Uri Gneezy. 2008. What's in a name? Anonymity and
socialdistance in dictator and ultimatumgames. Journal of Economic Behavior and
Organization 68 (1):29-35.
Cherry, Todd, Peter Frykblom, and Jason Shogren. 2002. Hardnose the Dictator. The
American Economic Review 92 (4):1218-1221.
Cherry, Todd, and Jason F. Shogren. 2008. Self-interest, sympathy and the origin of
endowments. Economics Letters 101 (1):69-72.
Colchester, Marcus. 2004. Conservation policy and indigenous peoples. Environmental
Science & Policy 7 (3):145-153.
Cousins, Ben, and Ian Scoones. 2010. Contested paradigms of ‘viability’ in redistributive
land reform: perspectives from southern Africa. Journal of Peasant Studies 37
(1):31-66.
Cox, J., D. Friedman, and S. Gjerstad. 2007. A tractable model of reciprocity and
fairness. Games and Economic Behavior 59 (1):17-45.
Dekker, Marleen. 2004. Sustainability and Resourcefulness: Support Networks During
Periods of Stress. World Development 32 (10):1735-1751.
Dekker, Marleen, and Bill Kinsey. 2011. Contextualizing Zimbabwe's land reform: long-
term observations from the first generation. The Journal of Peasant Studies 38
(5):995-1019.
Dinh, Quoc Hoang, Thomas Bernhard Dufhues, and Gertrud Buchenrieder. 2012. Do
connections matter? Individual social capital and credit constraints in Vietnam.
European Journal of Development Research 24 (3).
Dupas, Pascaline, and Jonathan Robinson. 2013. Savings Constraints and
Microenterprise Development: Evidence from a Field Experiment in Kenya.
American Economic Journal: Applied Economics 5 (1):163-192.
Eguavoen, Irit, and Weyni Tesfai. 2012. Social impact and impoverishment risks of the
Koga irrigation scheme, Blue Nile basin, Ethiopia. Afrika Focus 25 (1):39-60.
Eidelson, Roy J., and Judy I. Eidelson. 2003. Dangerous ideas: Five beliefs that propel
groups toward conflict. American Psychologist 58 (3):182.
Fafchamps, Marcel, and Flore Gubert. 2007. The formation of risk sharing networks.
Journal of Development Economics 83 (2):326-350.
Fafchamps, Marcel, and Susan Lund. 2003. Risk-sharing networks in rural Philippines.
Journal of Development Economics 71 (2):261-287.
Gneezy, Uri, Kenneth L. Leonard, and John A. List. 2009. Gender Differences in
Competition: Evidence From a Matrilineal and a Patriarchal Society. Econometrica
77 (5):1637-1664.

Goodall, Heather. 2006. Exclusion and re-emplacement: Tensions around protected
areas in Australia and Southeast Asia. Conservation and Society 4:383–395.
Henrich, Joseph, Robert Boyd, Samuel Bowles, Colin Camerer, Ernst Fehr, Herbert
Gintis, and Richard McElreath. 2001. In search of homo economicus: behavioral
experiments in 15 small-scale societies. The American Economic Review 91
(2):73-78.
Hoffman, Elizabeth, Kevin McCabe, Keith Shachat, and Vernon Smith. 1994.
Preferences, Property Rights, and Anonymity in Bargaining Games. Games and
Economic Behavior 7 (3):346-380.
Hofmeyr, Andre, Justine Burns, and Martine Visser. 2007. Income inequality, reciprocity
and public good provision: An experimental analysis. South African Journal of
Economics 75 (3):508-520.
Karanth, Krithi K. 2007. Making resettlement work: The case of India’s Bhadra Wildlife
Sanctuary. Biological Conservation 139 (3–4):315-324.
Lam, Lai Ming, and Saumik Paul. 2013. Displacement and Erosion of Informal Risk-
Sharing: Evidence from Nepal. World Development 43 (0):42-55.
Leibbrandt, Andreas, Uri Gneezy, and John A. List. 2013. Rise and fall of
competitiveness in individualistic and collectivistic societies. Proceedings of the
National Academy of Sciences 110 (23):9305-9308.
Leider, Stephen, Markus M. Möbius, Tanya Rosenblat, and Quoc-Anh Do. 2009.
Directed Altruism and Enforced Reciprocity in Social Networks. The Quarterly
Journal of Economics 124 (4):1815-1851.
Ligon, Ethan, and Laura Schechter. 2012. Motives for sharing in social networks.
Journal of Development Economics 99 (1):13-26.
Lin, N. 2001. Social capital. Cambridge: Cambridge University Press.
Margolius, Cheryl, John Beavers, and Marie Claire Paiz. 2002. Relocating People Out of
Private Reserves Voluntary Resettlement as a Conservation Tool in Guatamala.
Conservation in Practice 3 (2):30-33.
Mason, T. David. 1986. Land reform and the breakdown of clientelist politics in El
Salvador. Comparative Political Studies 18 (4):487-516.
Repeated Author. 1998. “Take Two Acres and Call Me in the Morning”: Is Land Reform
a Prescription for Peasant Unrest? The Journal of Politics 60 (01):199-230.
McCulloch, Neil, and Bob Baulch. 2000. Simulating the impact of policy upon chronic
and transitory poverty in rural Pakistan. The Journal of Development Studies 36
(6):100-130.
McKenzie, David, Steven Stillman, and John Gibson. 2010. How Important is Selection?
Experimental VS. Non-Experimental Measures of the Income Gains from Migration.
Journal of the European Economic Association 8 (4):913-945.
MoP, and UNDP. 2007. Expanding Choices for Rural Cambodia. In Cambodian Human
Development Report. Phnom Penh: Ministry of Planning Cambodia and United
Nations Development Programme Cambodia.
Morris-Jung, Jason, and Robin Roth. 2010. The Blurred Boundaries of Voluntary
Resettlement: A Case of Cat Tien National Park in Vietnam. Journal of Sustainable
Forestry 29 (2-4):202-220.
Narayan, D., and L. Pritchett. 1999. Cents and sociability: Household income and social
capital in rural Tanzania. Economic Development and Cultural Change 47 (4):871–
897.
Ockenfels, Axel, and Joachim Weimann. 1999. Types and patterns: an experimental
East-West-German comparison of cooperation and solidarity. Journal of Public
Economics (71:2):275-287.
Okten, Cagla, and Una Okonkwo Osili. 2004. Social Networks and Credit Access in
Indonesia. World Development 32 (7):1225-1246.
Ravallion, Martin, and Binayak Sen. 1994. Impacts on rural poverty of land-based
targeting: further results for Bangladesh. World Development 22 (6):823-838.
Rogers, Sarah, and Mark Wang. 2006. Environmental Resettlement and Social
Dis/Rearticulation in Inner Mongolia, China. Population and Environment 28 (1):41-
68.

Schmidt-Soltau, Kai, and Dan Brockington. 2007. Protected Areas and Resettlement:
What Scope for Voluntary Relocation? World Development 35 (12):2182-2202.
Schmidt–Soltau, Kai. 2003. Conservation–related Resettlement in Central Africa:
Environmental and Social Risks. Development and Change 34 (3):525-551.
Selten, Reinhard, and Axel Ockenfels. 1998. An experimental solidarity game. Journal of
Economic Behavior and Organization 34 (4):517-539.
Tefera, Messay Mulugeta. 2009. Challenges and opportunities of voluntary resettlement
schemes in Ethiopia: A case frm Jiru Gamachu resettlement village, Nonno district,
Central Ethiopia. Journal of Sustainable Development in Africa 11 (3).
Trhal, Nadja, and Ralf Radermacher. 2009. Bad luck vs. self-inflicted neediness - An
experimental investigation of gift giving in a solidarity game. Journal of Economic
Psychology 30 (4):517-526.
Valente, Christine. 2009. The food (in) security impact of land redistribution in South
Africa: microeconometric evidence from national data. World Development 37
(9):1540-1553.
Vollan, Björn. 2011. The difference between kinship and friendship: (Field-) experimental
evidence on trust and punishment. Journal of Socio-Economics 40 (1):14-25.
Yu, Bingxin, and Shenggen Fan. 2011. Rice production response in Cambodia.
Agricultural Economics 42 (3):437-450.
Zhang, Yong, Daming He, Ying Lu, Yan Feng, and Jake Reznick. 2013. The influence of
large dams building on resettlement in the Upper Mekong River. Journal of
Geographical Sciences 23 (5):947-957.

PLAYING WITH THE SOCIAL NETWORK 36
APPENDIX A: INFORMATION BEFORE RESETTLEMENT
Table A.1: Difference-in-difference and ex-post (2010 after resettlement) estimations for indicators of social integration
(1) (2) (3) (4) (5) (6) (7) (8) (9) (10)
D-i-d+ Ex-post D-i-d+ Ex-post D-i-d+ Ex-post D-i-d+ Ex-post D-i-d+ Ex-post VARIABLES Wedding
celebrations Wedding
celebrations Pagoda
visits Pagoda
visits Informal
credit Informal
credit Income per year
Income per year
Income per year
without transfers
Income per year
without transfers
Interaction resettlement and ex-post dummy
-2.706 -1.427 -8.999 -253.0 -370.0
(2.703) (2.765) (41.27) (446.7) (444.6) Resettlement dummy 1.830 -0.876 -0.148 -1.575 -2.007 -11.01 138.3 -114.6 143.3 -226.7
(2.003) (1.353) (2.049) (1.968) (30.58) (22.05) (331.0) (282.7) (329.5) (281.3) Ex-post dummy -0.588 0.178 -47.73 87.80 -126.9
(2.003) (2.049) (30.58) (331.0) (329.5) Constant 6.146*** 5.558*** 7.683*** 7.860*** 100.4*** 52.70*** 1,341*** 1,429*** 1,302*** 1,176*** (1.433) (1.043) (1.466) (1.517) (21.88) (17.00) (236.8) (217.9) (235.7) (216.9)
Observations 190 106 190 106 190 106 190 106 190 106
R-squared 0.018 0.004 0.005 0.006 0.036 0.002 0.002 0.002 0.016 0.006Notes: Standard errors in parentheses;*** p<0.01, ** p<0.05, * p<0.1 + D-i-d= difference-in-difference estimation
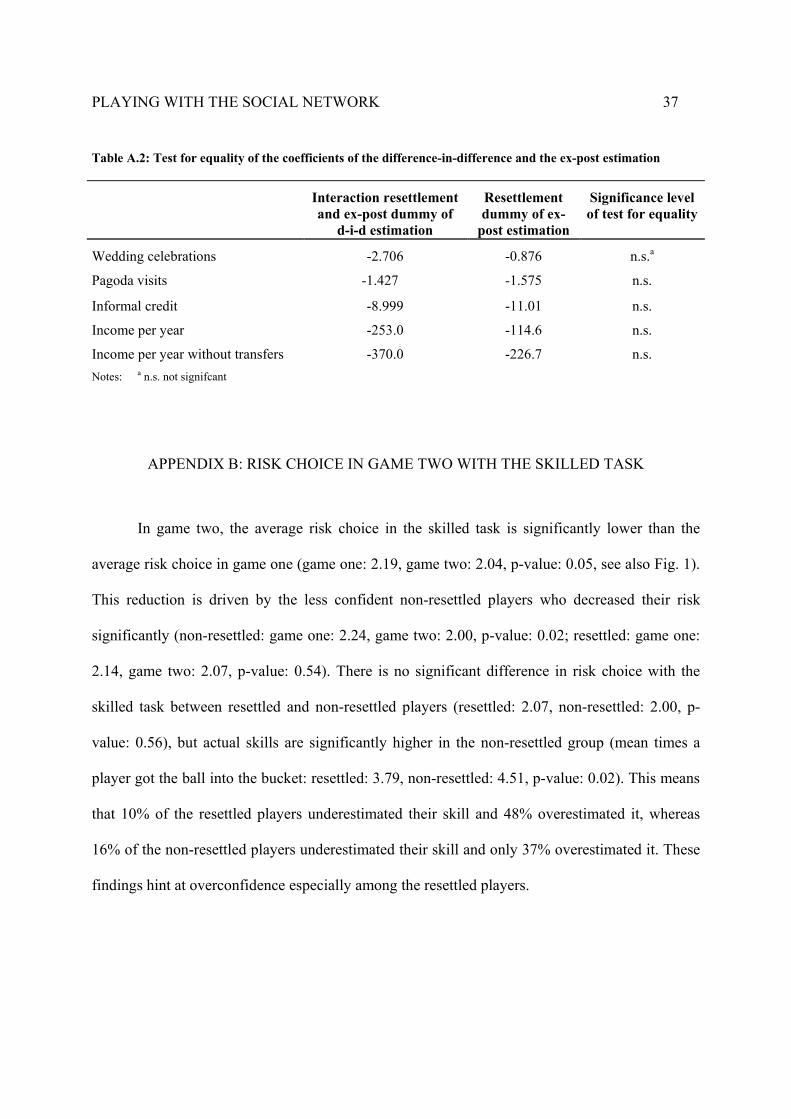
PLAYING WITH THE SOCIAL NETWORK 37
Table A.2: Test for equality of the coefficients of the difference-in-difference and the ex-post estimation
Interaction resettlement and ex-post dummy of
d-i-d estimation
Resettlement dummy of ex-
post estimation
Significance level of test for equality
Wedding celebrations -2.706 -0.876 n.s.a
Pagoda visits -1.427 -1.575 n.s.
Informal credit -8.999 -11.01 n.s. Income per year -253.0 -114.6 n.s. Income per year without transfers -370.0 -226.7 n.s. Notes: a n.s. not signifcant
APPENDIX B: RISK CHOICE IN GAME TWO WITH THE SKILLED TASK
In game two, the average risk choice in the skilled task is significantly lower than the
average risk choice in game one (game one: 2.19, game two: 2.04, p-value: 0.05, see also Fig. 1).
This reduction is driven by the less confident non-resettled players who decreased their risk
significantly (non-resettled: game one: 2.24, game two: 2.00, p-value: 0.02; resettled: game one:
2.14, game two: 2.07, p-value: 0.54). There is no significant difference in risk choice with the
skilled task between resettled and non-resettled players (resettled: 2.07, non-resettled: 2.00, p-
value: 0.56), but actual skills are significantly higher in the non-resettled group (mean times a
player got the ball into the bucket: resettled: 3.79, non-resettled: 4.51, p-value: 0.02). This means
that 10% of the resettled players underestimated their skill and 48% overestimated it, whereas
16% of the non-resettled players underestimated their skill and only 37% overestimated it. These
findings hint at overconfidence especially among the resettled players.

PLAYING WITH THE SOCIAL NETWORK 38
APPENDIX C: ADDITIONAL ANALYSES ON TRANSFER SENDING
Table C.1: Mean transfer per person dependent on risk choices of winners and losers in game 1
1 B-loser
1 C-loser
2 B-losers
2 C-losers
2 losers: 1 B- and 1 C-loser;
transfer to the B-loser
2 losers: 1 B- and 1 C-loser;
transfer to the C-loser
Average over
senderA-sender 328.21 323.08 255.13 264.38 264.10 266.67 283.76 B-sender 752.17 692.75 581.16 569.57 605.80 568.12 628.26 C-sender 1,222.22 1,277.78 1,277.78 1,194.44 1,250.00 1,277.78 1,250.00Average over receiver
688.09 661.90 579.76 564.68 592.06 576.19 -
Significance levelb n.s. n.s. 10% -
Notes: b Wilcoxon-Mann-Whitney, t-test, or test of proportions for difference in means between resettled and non-resettled players
Fig. C.1: Transfer payments according to risk choices in game 1
54.55
22.73
13.649.091 11.76
17.65
52.94
17.65
010
2030
4050
60
0 1,000 2,000 3,000 0 1,000 2,000 3,000
Resettled, N= 22 Non-resettled, N= 17
Per
cent
age
of p
laye
rs
Transfer to one B-loser
Risk option A
28.89
6.667
35.56
17.78
8.8892.222
16.6720.83
25
4.167
12.516.67
4.167
010
2030
4050
60
0 1,000 2,000 3,000 0 1,000 2,000 3,000
Resettled, N= 45 Non-resettled, N= 24
Per
cent
age
of p
laye
rs
Transfer to one B-loser
Risk option B
37.5
12.5
37.5
12.5 11.11
44.44
11.11
33.33
010
2030
4050
60
0 1,000 2,000 3,000 0 1,000 2,000 3,000
Resettled, N= 9 Non-resettled, N= 9
Per
cent
age
of p
laye
rs
Transfer to one B-loser
Risk option CC-sender B-sender
A-sender
.2
.4
.6
.8
1
Per
cent
age
of lo
sers
0 .1 .2 .3 .4 .5Transfer to one B-loser in round 2 realtive to earnings
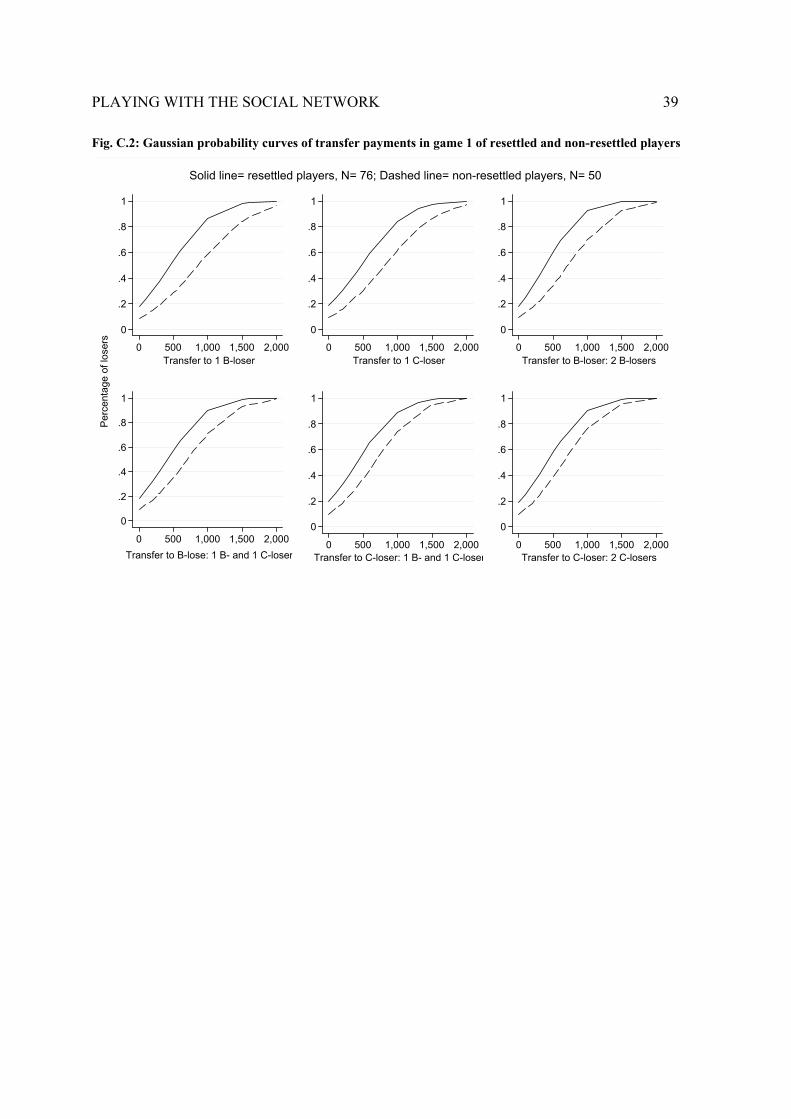
PLAYING WITH THE SOCIAL NETWORK 39
Fig. C.2: Gaussian probability curves of transfer payments in game 1 of resettled and non-resettled players
0
.2
.4
.6
.8
1
0 500 1,000 1,500 2,000Transfer to 1 B-loser
0
.2
.4
.6
.8
1
0 500 1,000 1,500 2,000Transfer to 1 C-loser
0
.2
.4
.6
.8
1
0 500 1,000 1,500 2,000Transfer to B-loser: 2 B-losers
0
.2
.4
.6
.8
1
0 500 1,000 1,500 2,000Transfer to B-lose: 1 B- and 1 C-loser
Per
cent
age
of lo
sers
0
.2
.4
.6
.8
1
0 500 1,000 1,500 2,000Transfer to C-loser: 1 B- and 1 C-loser
0
.2
.4
.6
.8
1
0 500 1,000 1,500 2,000Transfer to C-loser: 2 C-losers
Solid line= resettled players, N= 76; Dashed line= non-resettled players, N= 50

PLAYING WITH THE SOCIAL NETWORK 40
Fig. C.3: Gaussian probability curves of transfer payments with the skilled task of resettled and non-resettled
players
0
.2
.4
.6
.8
1
0 500 1,000 1,500 2,000Transfer to 1 B-loser
0
.2
.4
.6
.8
1
0 500 1,000 1,500 2,000Transfer to 1 C-loser
0
.2
.4
.6
.8
1
0 500 1,000 1,500 2,000Transfer to B-loser: 2 B-losers
0
.2
.4
.6
.8
1
0 500 1,000 1,500 2,000Transfer to B-loser: 1 B-loser and 1 C-loser
0
.2
.4
.6
.8
1
0 500 1,000 1,500 2,000Transfer to C-loser: 1 B- and 1 C-loser
0
.2
.4
.6
.8
1
0 500 1,000 1,500 2,000Transfer to C-loser: 2 C-losers
Solid line= resettled players, N= 34; Dashed line= non-resetteld players, N= 30
Per
cent
age
of lo
sers

PLAYING WITH THE SOCIAL NETWORK 41
Table C.2: Individual control variables for the transfer regressions in table 6
VARIABLES (1) (2) (3) (4) (5)
Gender of experimental participant -74.77 -108.0 -151.0 -114.0 -92.66
(1= female, 0= male) (159.4) (134.9) (177.8) (133.3) (143.4)
Age 2.887 3.278 1.814 3.188 3.016
(6.514) (6.085) (7.949) (6.101) (6.393)
Years of education 65.74** 45.70* 46.03 45.97* 56.00**
(26.05) (26.59) (33.84) (26.67) (28.09)
Household size -61.73 -91.25*** -62.24 -86.00** -93.14**
(37.89) (35.06) (46.40) (34.79) (36.88)
Married+ 198.1 139.7 237.8 136.5 106.0
(163.7) (163.4) (202.5) (163.8) (172.2)
Income per month -0.101 0.147 -0.329 0.0631 0.0270
(0.650) (0.713) (1.002) (0.710) (0.755)
Nutrient provision++ 428.1** 360.6** 284.4 339.0** 384.7**
(173.6) (141.7) (189.4) (139.5) (149.6)
Savings+ -378.3*** -373.4*** -467.1** -358.6*** -398.7***
(142.9) (137.1) (186.1) (136.4) (144.9)
More than 50 USD debt+ 39.64 146.4 87.57 134.4 189.0
(131.7) (136.9) (185.6) (136.8) (144.6)
Shock during the last 3 years+++ -83.75 -26.84 106.6 -13.08 -37.04
(123.3) (137.3) (167.5) (136.9) (145.2)
Shocks of friends or family+++ 272.4* 157.8 196.1 156.5 131.5
(148.4) (132.1) (163.1) (132.3) (140.1)
Relative number of friends++++ 0.761 3.653 0.0750 4.613
(4.435) (3.838) (5.164) (4.057)
Relative number of family members++++
1.834 0.735 -5.043 0.158
(7.335) (7.358) (10.46) (7.774)
Responsibility for own fate+++++ 114.7 121.7 70.57 121.5 147.8
(118.6) (122.0) (159.8) (122.1) (129.2)
Always somebody in the village who helps -123.3 -98.47 -147.4 -93.01 -89.97+++++ (109.6) (111.2) (141.3) (111.3) (118.1)
Session size -13.78 13.71 2.698 19.07 11.42
(36.13) (27.33) (33.64) (26.88) (29.06)
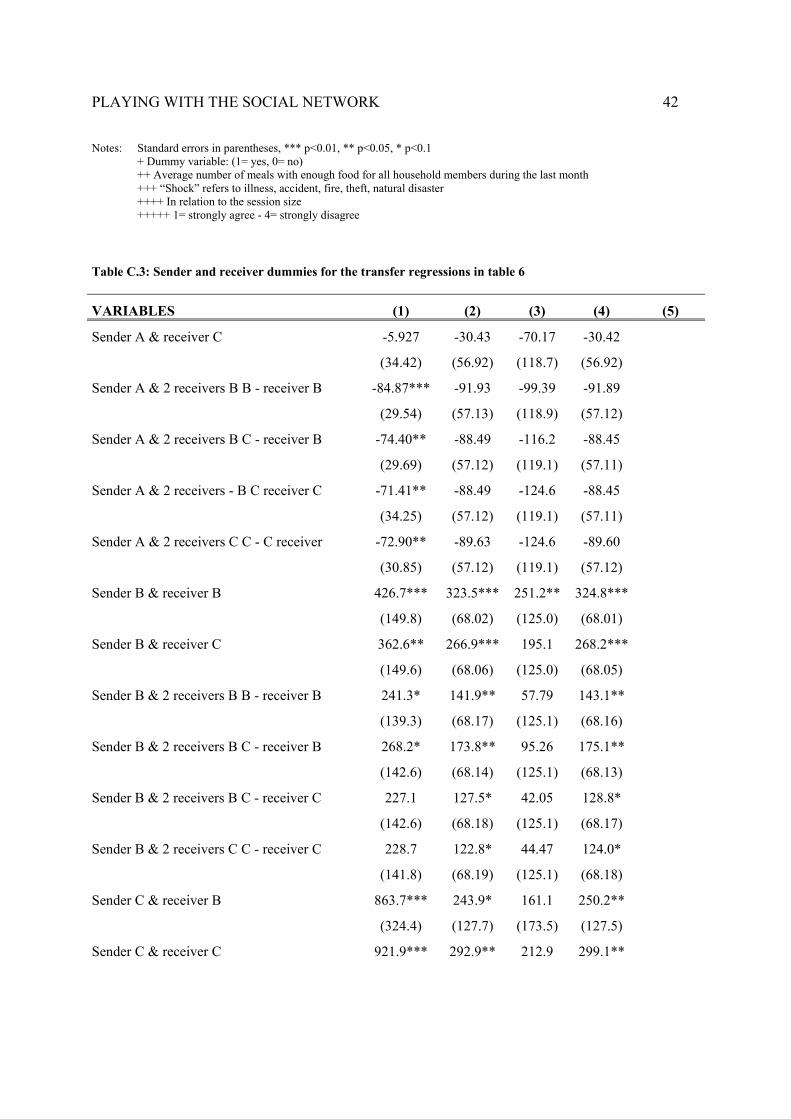
PLAYING WITH THE SOCIAL NETWORK 42
Notes: Standard errors in parentheses, *** p<0.01, ** p<0.05, * p<0.1 + Dummy variable: (1= yes, 0= no) ++ Average number of meals with enough food for all household members during the last month +++ “Shock” refers to illness, accident, fire, theft, natural disaster ++++ In relation to the session size +++++ 1= strongly agree - 4= strongly disagree
Table C.3: Sender and receiver dummies for the transfer regressions in table 6
VARIABLES (1) (2) (3) (4) (5)
Sender A & receiver C -5.927 -30.43 -70.17 -30.42
(34.42) (56.92) (118.7) (56.92) Sender A & 2 receivers B B - receiver B -84.87*** -91.93 -99.39 -91.89
(29.54) (57.13) (118.9) (57.12) Sender A & 2 receivers B C - receiver B -74.40** -88.49 -116.2 -88.45
(29.69) (57.12) (119.1) (57.11) Sender A & 2 receivers - B C receiver C -71.41** -88.49 -124.6 -88.45
(34.25) (57.12) (119.1) (57.11) Sender A & 2 receivers C C - C receiver -72.90** -89.63 -124.6 -89.60
(30.85) (57.12) (119.1) (57.12) Sender B & receiver B 426.7*** 323.5*** 251.2** 324.8***
(149.8) (68.02) (125.0) (68.01) Sender B & receiver C 362.6** 266.9*** 195.1 268.2***
(149.6) (68.06) (125.0) (68.05) Sender B & 2 receivers B B - receiver B 241.3* 141.9** 57.79 143.1**
(139.3) (68.17) (125.1) (68.16) Sender B & 2 receivers B C - receiver B 268.2* 173.8** 95.26 175.1**
(142.6) (68.14) (125.1) (68.13) Sender B & 2 receivers B C - receiver C 227.1 127.5* 42.05 128.8*
(142.6) (68.18) (125.1) (68.17) Sender B & 2 receivers C C - receiver C 228.7 122.8* 44.47 124.0*
(141.8) (68.19) (125.1) (68.18) Sender C & receiver B 863.7*** 243.9* 161.1 250.2**
(324.4) (127.7) (173.5) (127.5) Sender C & receiver C 921.9*** 292.9** 212.9 299.1**
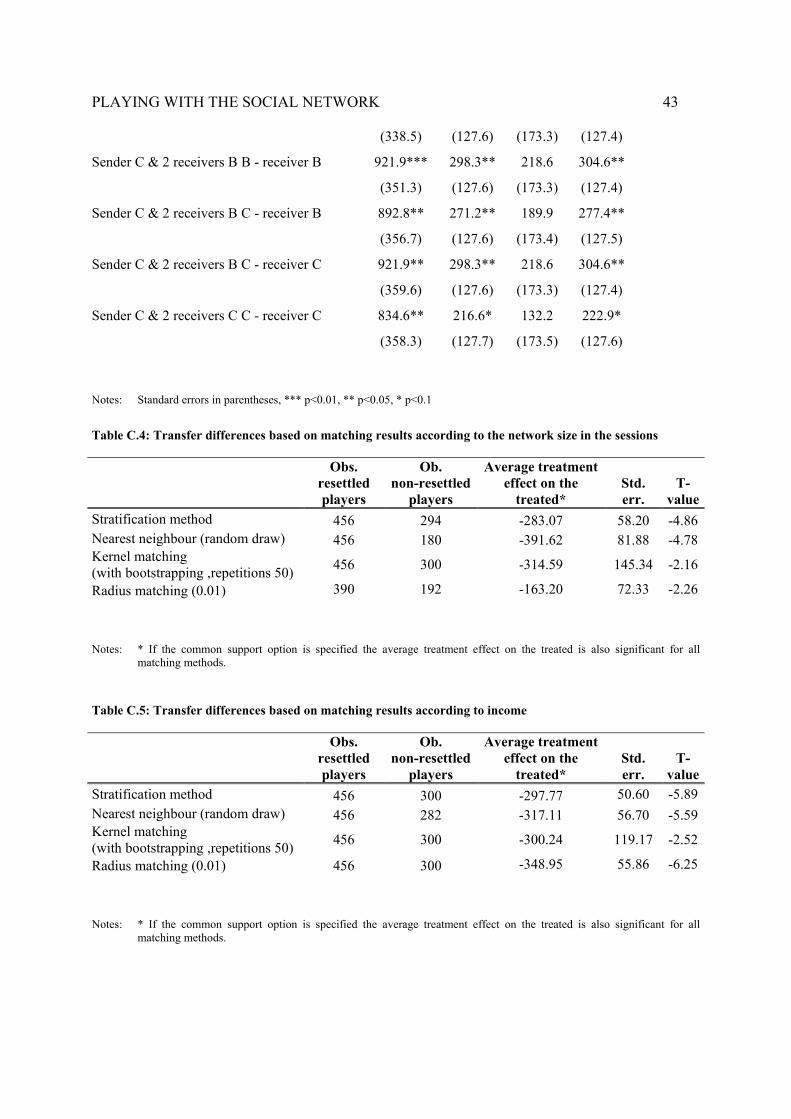
PLAYING WITH THE SOCIAL NETWORK 43
(338.5) (127.6) (173.3) (127.4) Sender C & 2 receivers B B - receiver B 921.9*** 298.3** 218.6 304.6**
(351.3) (127.6) (173.3) (127.4) Sender C & 2 receivers B C - receiver B 892.8** 271.2** 189.9 277.4**
(356.7) (127.6) (173.4) (127.5) Sender C & 2 receivers B C - receiver C 921.9** 298.3** 218.6 304.6**
(359.6) (127.6) (173.3) (127.4) Sender C & 2 receivers C C - receiver C 834.6** 216.6* 132.2 222.9*
(358.3) (127.7) (173.5) (127.6)
Notes: Standard errors in parentheses, *** p<0.01, ** p<0.05, * p<0.1
Table C.4: Transfer differences based on matching results according to the network size in the sessions
Obs. resettled players
Ob. non-resettled
players
Average treatment effect on the
treated* Std. err.
T-value
Stratification method 456 294 -283.07 58.20 -4.86Nearest neighbour (random draw) 456 180 -391.62 81.88 -4.78Kernel matching (with bootstrapping ,repetitions 50) 456 300 -314.59 145.34 -2.16
Radius matching (0.01) 390 192 -163.20 72.33 -2.26
Notes: * If the common support option is specified the average treatment effect on the treated is also significant for all matching methods.
Table C.5: Transfer differences based on matching results according to income
Obs. resettled players
Ob. non-resettled
players
Average treatment effect on the
treated* Std. err.
T-value
Stratification method 456 300 -297.77 50.60 -5.89Nearest neighbour (random draw) 456 282 -317.11 56.70 -5.59Kernel matching (with bootstrapping ,repetitions 50) 456 300 -300.24 119.17 -2.52
Radius matching (0.01) 456 300 -348.95 55.86 -6.25
Notes: * If the common support option is specified the average treatment effect on the treated is also significant for all matching methods.

University of Innsbruck - Working Papers in Economics and StatisticsRecent Papers can be accessed on the following webpage:
http://eeecon.uibk.ac.at/wopec/
2013-16 Simone Gobien, Bjorn Vollan: Playing with the social network: Socialcohesion in resettled and non-resettled communities in Cambodia
2013-15 Bjorn Vollan, Sebastian Prediger, Markus Frolich: Co-managing com-mon pool resources: Do formal rules have to be adapted to traditional ecolo-gical norms?
2013-14 Bjorn Vollan, Yexin Zhou, Andreas Landmann, Biliang Hu, CarstenHerrmann-Pillath: Cooperation under democracy and authoritarian norms
2013-13 Florian Lindner, Matthias Sutter: Level-k reasoning and time pressure inthe 11-20 money request game forthcoming in Economics Letters
2013-12 Nadja Klein, Thomas Kneib, Stefan Lang: Bayesian generalized additivemodels for location, scale and shape for zero-inflated and overdispersed countdata
2013-11 Thomas Stockl: Price e�ciency and trading behavior in limit order marketswith competing insiders forthcoming in Experimental Economics
2013-10 Sebastian Prediger, Bjorn Vollan, Benedikt Herrmann: Resource scar-city, spite and cooperation
2013-09 Andreas Exenberger, Simon Hartmann: How does institutional changecoincide with changes in the quality of life? An exemplary case study
2013-08 E. Glenn Dutcher, Loukas Balafoutas, Florian Lindner, Dmitry Ryv-kin, Matthias Sutter: Strive to be first or avoid being last: An experimenton relative performance incentives.
2013-07 Daniela Glatzle-Rutzler, Matthias Sutter, Achim Zeileis: No myopicloss aversion in adolescents? An experimental note
2013-06 Conrad Kobel, Engelbert Theurl: Hospital specialisation within a DRG-Framework: The Austrian case
2013-05 Martin Halla, Mario Lackner, Johann Scharler: Does the welfare statedestroy the family? Evidence from OECD member countries
2013-04 Thomas Stockl, Jurgen Huber, Michael Kirchler, Florian Lindner:Hot hand belief and gambler’s fallacy in teams: Evidence from investmentexperiments
2013-03 Wolfgang Luhan, Johann Scharler: Monetary policy, inflation illusion andthe Taylor principle: An experimental study
2013-02 Esther Blanco, Maria Claudia Lopez, James M. Walker: Tensions bet-ween the resource damage and the private benefits of appropriation in thecommons
2013-01 Jakob W. Messner, Achim Zeileis, Jochen Broecker, Georg J. Mayr:Improved probabilistic wind power forecasts with an inverse power curve trans-formation and censored regression
2012-27 Achim Zeileis, Nikolaus Umlauf, Friedrich Leisch: Flexible generationof e-learning exams in R: Moodle quizzes, OLAT assessments, and beyond
2012-26 Francisco Campos-Ortiz, Louis Putterman, T.K. Ahn, Loukas Ba-lafoutas, Mongoljin Batsaikhan, Matthias Sutter: Security of propertyas a public good: Institutions, socio-political environment and experimentalbehavior in five countries
2012-25 Esther Blanco, Maria Claudia Lopez, James M. Walker: Appropriationin the commons: variations in the opportunity costs of conservation
2012-24 Edgar C. Merkle, Jinyan Fan, Achim Zeileis: Testing for measurementinvariance with respect to an ordinal variable forthcoming in Psychometrika
2012-23 Lukas Schrott, Martin Gachter, Engelbert Theurl: Regional develop-ment in advanced countries: A within-country application of the Human De-velopment Index for Austria
2012-22 Glenn Dutcher, Krista Jabs Saral: Does team telecommuting a↵ect pro-ductivity? An experiment
2012-21 Thomas Windberger, Jesus Crespo Cuaresma, Janette Walde: Dirtyfloating and monetary independence in Central and Eastern Europe - The roleof structural breaks
2012-20 Martin Wagner, Achim Zeileis: Heterogeneity of regional growth in theEuropean Union
2012-19 Natalia Montinari, Antonio Nicolo, Regine Oexl: Mediocrity and indu-ced reciprocity
2012-18 Esther Blanco, Javier Lozano: Evolutionary success and failure of wildlifeconservancy programs
2012-17 Ronald Peeters, Marc Vorsatz, Markus Walzl: Beliefs and truth-telling:A laboratory experiment

2012-16 Alexander Sebald, Markus Walzl: Optimal contracts based on subjectiveevaluations and reciprocity
2012-15 Alexander Sebald, Markus Walzl: Subjective performance evaluations andreciprocity in principal-agent relations
2012-14 Elisabeth Christen: Time zones matter: The impact of distance and timezones on services trade
2012-13 Elisabeth Christen, Joseph Francois, Bernard Hoekman: CGE mode-ling of market access in services
2012-12 Loukas Balafoutas, Nikos Nikiforakis: Norm enforcement in the city: Anatural field experiment forthcoming in European Economic Review
2012-11 Dominik Erharter: Credence goods markets, distributional preferences andthe role of institutions
2012-10 Nikolaus Umlauf, Daniel Adler, Thomas Kneib, Stefan Lang, AchimZeileis: Structured additive regression models: An R interface to BayesX
2012-09 Achim Zeileis, Christoph Leitner, Kurt Hornik:History repeating: Spainbeats Germany in the EURO 2012 Final
2012-08 Loukas Balafoutas, Glenn Dutcher, Florian Lindner, Dmitry Ryvkin:The optimal allocation of prizes in tournaments of heterogeneous agents
2012-07 Stefan Lang, Nikolaus Umlauf, Peter Wechselberger, Kenneth Hartt-gen, Thomas Kneib: Multilevel structured additive regression
2012-06 Elisabeth Waldmann, Thomas Kneib, Yu Ryan Yu, Stefan Lang:Bayesian semiparametric additive quantile regression
2012-05 Eric Mayer, Sebastian Rueth, Johann Scharler: Government debt, in-flation dynamics and the transmission of fiscal policy shocks forthcoming in
Economic Modelling
2012-04 Markus Leibrecht, Johann Scharler: Government size and business cyclevolatility; How important are credit constraints? forthcoming in Economica
2012-03 Uwe Dulleck, David Johnston, Rudolf Kerschbamer, Matthias Sut-ter: The good, the bad and the naive: Do fair prices signal good types or dothey induce good behaviour?
2012-02 Martin G. Kocher, Wolfgang J. Luhan, Matthias Sutter: Testing aforgotten aspect of Akerlof’s gift exchange hypothesis: Relational contractswith individual and uniform wages
2012-01 Loukas Balafoutas, Florian Lindner, Matthias Sutter: Sabotage in tour-naments: Evidence from a natural experiment published in Kyklos

University of Innsbruck
Working Papers in Economics and Statistics
2013-16
Simone Gobien, Bjorn Vollan
Playing with the social network: Social cohesion in resettled and non-resettled com-munities in Cambodia
AbstractMutual aid among villagers in developing countries is often the only means of insu-ring against economic shocks. We use “lab-in-the-field experiments” in Cambodianvillages to study social cohesion in established and newly resettled communities.Both communities are part of a land distribution project. The project participantsall signed up voluntarily, and their socio-demographic attributes and pre-existingnetwork ties are similar. We use a version of the “solidarity game” to identify thee↵ect of voluntary resettlement on willingness to help fellow villagers after an incomeshock. We find a sizeable reduction in willingness to help others. Resettled playerstransfer on average between 47% and 74% less money than non-resettled players.The e↵ect remains large and significant after controlling for personal network andwhen controlling for di↵erences in transfer expectations. The costs of voluntaryresettlement, not only monetary but also social, seem significantly higher than iscommonly assumed by development planners.
ISSN 1993-4378 (Print)ISSN 1993-6885 (Online)