plc-to-dsl interference: statistical model and impact … · plc-to-dsl interference: statistical...
TRANSCRIPT
PLC-to-DSL Interference:Statistical Model and Impact on DSL (Revised)
Stefano Galli, Fellow, IEEE, Kenneth J. Kerpez, Fellow, IEEE,Hubert Mariotte, Fabienne Moulin
Abstract—Newly available standards for broadband accessusing Digital Subscriber Lines (DSL) have a high degree ofspectrum overlap with home networking technologies usingbroadband Power Line Communications (BB-PLC) and thisoverlap leads to Electromagnetic Compatibility issues that maycause performance degradation in DSL systems. This paperstudies the characteristics of measured PLC-to-DSL interferenceand presents novel results on its statistical characterization. Thefrequency-dependent couplings between power line cables andtwisted-pairs are estimated from measurements and a statisticalmodel based on a mixture of two truncated Gaussian distributionsis set forth. The proposed statistical model allows the accurateevaluation of the impact of BB-PLC interference on various DSLtechnologies, in terms of both average and worst-case impacts ondata rate. This paper further provides an extensive assessmentof the impact of PLC-to-DSL interference at various loop lengthsand for multiple profiles of Very-high speed Digital SubscriberLines 2 (VDSL2), Vectored VDSL2 (V-VDSL2), and G.fast. Theresults of this paper confirm that the impact of PLC interferencevaries with loop length and whether Vectoring is used or not.Furthermore, the average impact is found to be generally smallbut strong couplings can lead to substantial degradation of DSL.
Index Terms—Power Line Communications, Digital SubscriberLines, G.fast, VDSL2, Vectoring, EMC, interference.
I. INTRODUCTION
OVER the past two decades, broadband access technolo-gies have seen an increasing level of sophistication
across a variety of media, allowing consumers to enjoy an un-precedented growth in access speed [1]. The most widespreadbroadband technology in the world is Digital Subscriber Lines(DSLs), a family of technologies that provides broadband ac-cess over the local telephone network [2]. Roughly two-thirdsof broadband subscribers worldwide are DSL subscribers, andthere are more new DSL subscribers each month than newsubscribers for all other access technologies combined [3].
One of the recent DSL technologies being deployed todayby operators is Very-high speed Digital Subscriber Lines2 (VDSL2) [4]. VDSL2 operates on frequencies from 138kHz up to 17 MHz or, more recently, 35 MHz [5], andtransmits at speeds up to a few hundred Mbps and overdistances up to 1.5 km. VDSL2 can still be limited by far-end crosstalk (FEXT) which can severely degrade VDSL2data rates in dense deployments. Vectoring is a technique that
Stefano Galli ([email protected]) is a consultant in New York City, USA.Ken Kerpez ([email protected]) is with ASSIA, Redwood City,
California, USA.Hubert Mariotte ([email protected]) and Fabienne Moulin (fa-
[email protected]) are with Orange Labs in Lannion, France.
allows canceling self-FEXT in both directions under certaindeployment conditions. Vectoring has been standardized foruse with VDSL2 [6], [7].
The latest DSL technology that has been standardized inthe ITU-T is G.fast (Fast Access to Subscriber Terminals) [8].G.fast aims at providing ultra-high speeds over copper twistedpairs up to and sometimes even exceeding speeds of 1 Gbps.Initial requirements foresaw G.fast operating up to 250 meters,but more recently some operators are interested in longerdistances such as 400-500 meters. G.fast uses Vectoring tocancel self-FEXT and is specified to operate over frequenciesup to 106 MHz [9]. A 212-MHz profile to be used withVectoring implemented with a non-linear precoder is in initialstages of standardization in the ITU-T.
As the speed of access technologies keeps growing, homenetworking technologies will have to keep up in terms ofdata rate. A good candidate for high speed home networkingis Broadband Power Line Communication (BB-PLC) as itleverages the existing power cables in the home and has todayreached a good technological maturity [10]–[13]. Up to afew years ago, PLC data rates of a few hundred Mbps wereavailable using technologies operating in the 1.8-30 MHz bandand based on the IEEE 1901 Broadband Powerline Standard[14] and the ITU-T G.hn standard [15]. Recently, new PLCtechnologies using frequencies up to 86 MHz with MIMOcapabilities have also been specified, e.g. HomePlug AV2[16] and the ITU-T MIMO G.hn [17]. These advanced PLCtechnologies achieve data rates between 1-2 Gbps.
In PLC, signals are transmitted over existing power cableswhich are neither shielded nor balanced, especially in thehome. As a consequence, unwanted radiated emissions occurwhen PLC is used and this phenomenon can cause Electro-Magnetic Compatibility (EMC) issues with other services thatoperate in the same frequency band of PLC. The issue ofcoexistence between technologies sharing the same spectrumis well known in wireless communications, e.g. see [18],[19]. However, while PLC EMC issues have been extensivelystudied for the case of PLC interference to radio services,little is known today about the effects of PLC interference onother wired communications services - except for the case ofself-PLC interference between non-interoperable PLC devicessharing the same band [20].
Since over the past decade the amount of frequency overlapbetween BB-PLC and DSL has grown considerably, an impor-tant example of such EMC issues is the interference that BB-PLC may create to DSL technologies such as VDSL2, Vec-tored VDSL2 (V-VDSL2), and G.fast. Furthermore, the new
arX
iv:1
509.
0045
3v2
[cs
.IT
] 5
Dec
201
5
2 SUBMITTED TO IEEE JSAC SPECIAL ISSUE – 15 JULY 2015/REVISED 4 DECEMBER 2015
Vectoring capabilities of the most recent DSL technologiesmakes DSL more susceptible to PLC interference (as well as toany other in-home noise) because the time-invariant “blanket”of crosstalk that once covered most in-home noises is nowgone thanks to Vectoring.
The issue of whether PLC can create harmful interference toDSL or not has been addressed for example in [21]–[25], seealso see the excellent bibliographic review in [26]. The goal ofavailable studies was mostly to understand the general effect ofPLC interference on DSL, especially its dependency on cabletopologies (e.g., length, separation, load, twisting) and theeffectiveness of interference mitigation techniques. However,to the best of the Authors’ knowledge, statistical models forevaluating PLC-to-DSL interference are not publicly availableand the impact of PLC interference on DSL has not yet beenassessed accurately.
This paper reports results from a vast measurement cam-paign of PLC-to-DSL interference. Orange performed themeasurement campaign, reporting a first set of results in [23],[24], with the focus being the impact on PLC interference oftopological aspects (length, separation, etc.). This paper usesthat data to develop a novel statistical model for PLC-to-DSLinterference couplings in the frequency domain1. Furthermore,an analysis of the impact of PLC-to-DSL interference onthree wideband DSL technologies (VDSL2, V-VDSL2, G.fast)is also presented based on couplings either estimated frommeasurements or generated according to the model proposedhere. The impact on data rate was assessed via computersimulation, using also measured loop responses and measuredFEXT.
Achieving a good understanding of the impact that BB-PLCinterference may have on DSL is important today as proposalsfor relaxing the PLC PSD above 30 MHz have been recentlydiscussed in CENELEC and a decision is expected by theend of 2015. Furthermore, following the concern expressed byseveral telecom operators, the ITU-T and ETSI have started towork on specifying techniques that allow mitigation of PLC-to-DSL interference – see for example the ongoing ITU-TQ4/Q18 joint effort on Recommendation G.9977 (Mitigationof interference between DSL and PLC).
Initial results were first presented in March 2014 at theITU-T DSL Standardization Working Group [28] and then atthe IEEE ISPLC 2015 conference [29], [30]. In this paperadditional new results are presented:
1) An additional 113 measured traces were used to refineprevious results.
2) More accurate statistical models are presented here asthey are tailored to specific DSL bandplans.
3) A new VDSL2 profile currently under standardizationthat specifies a 35 MHz profile is also considered.
4) A new G.fast profile operating over a 212 MHz band-width with a non-linear GDFE-based pre-coder is alsoconsidered.
1 The term “coupling” is used in this paper in the same way it is normallyused in the DSL literature for crosstalk [27], i.e. the attenuation in dB at acertain frequency between the excitation signal on a first wire (in our case,the PLC signal on the power line) and the interference observed on a secondwire (in our case, the twisted-pair).
5) A new and simple model for the 50% and 99% worst-case coupling
6) Additional new simulations on the validation of thestatistical model proposed here are presented.
7) Additional new simulations are presented to confirm thepossibility of using the proposed model for worst-caseanalysis and for evaluating the effects of raising the PLCtransmit PSD in certain bands.
The paper is organized as follows. In Sect. II, the measure-ment campaign is described in detail. Considerations on themain characteristics of PLC-to-DSL interference are given inSect. III. Statistical considerations on the estimated couplingsare given in Sect. IV, and the proposed statistical modelis set forth in Sect.V. Finally, the impact of PLC-to-DSLinterference on VDSL2, V-VDSL2, and G.fast is assessed onthe basis of both estimated and simulated couplings in thefollowing Sections: in terms of data rate decrease in Sect. VI,and in terms of varying the PLC transmit power above 30MHz in Sect. VII. Conclusive remarks are given in Sect. VIII.
II. THE MEASUREMENT CAMPAIGN
A PLC-like signal was injected into a set of in-home powerline outlets and the interference that coupled into telephonecables in the same home and at various telephone sockets wasdigitally sampled and stored. Measurements available to thiswork were carried out in 32 residential customer premises inFrance, including houses and apartments both old and new.Interior walls are about about 10 cm thick and are madeof plasterboard or brick and plaster. All measurement wereperformed from Monday to Friday, between hours 9:00 and18:00.
The domestic phone networks presented the followingtopologies: bus, star, bus-star and star-bus. The number ofphone sockets per location ranged between 1-5, and the mediannumber of sockets was 2. The number of power outlets perlocation ranged between 3 and 14, and the median numberof outlets was 5. This allowed collection of between 4 and25 PLC interference traces per home - with a median of 11traces per home. In all cases, the in-home phone cabling wasconnected to the outside plant.
In France, the preferred solution to deploy DSL is to usemicrofilters. This means that the customer can install the CPEanywhere in the premises by using a microfilter for POTS/DSLseparation. In other words, for the tested configurations, thereis no master telephone jack that is close to where the telephonecable enters the home (NID) and isolates the DSL modem fromthe rest of the noisy inside wiring. Furthermore, in the caseof houses, the NID is located in the garage whereas the DSLmodem is in the living room. In other countries, the situationmay be different and separation from inside wiring would bebeneficial to DSL.
A total of 353 time-domain PLC interference traces werecollected, where each measurement represents an interferencerealization between the PLC-like signal injected into a powerline outlet and the resulting interference measured at a phonesocket in the same home. Also a total of 64 time-domainambient noise traces on twisted-pairs were collected in the
GALLI et al. “PLC-TO-DSL INTERFERENCE: STATISTICAL MODEL AND IMPACT ON DSL (REVISED)” 3
absence of PLC-like signals present on the power cables, andwe will refer to these as “baseline” noise traces.
A. The Set-Up
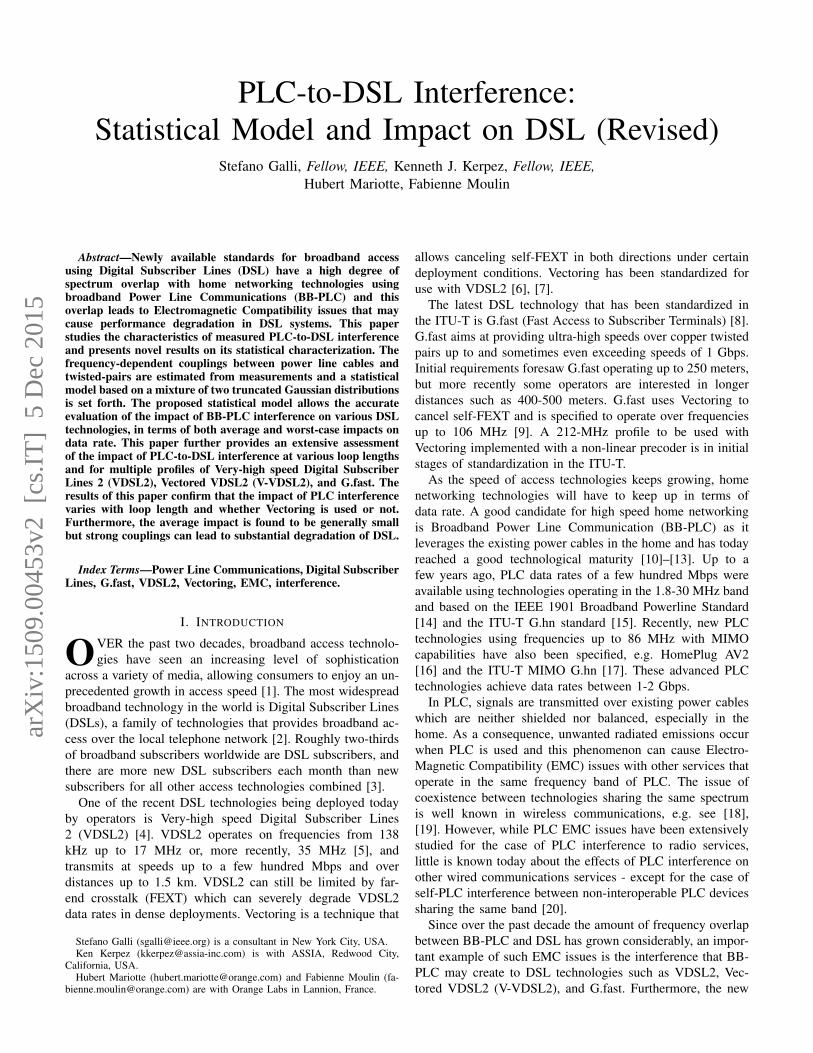
The measurement set-up is shown in Figure 1. An ArbitraryWaveform Generator (AWG, Tektronix AWG5002) was usedas a PLC transmitter. By means of a passive coupler, a PLCsignal was continuously injected in the electrical outlet.
The coupled PLC noise on the telephone copper pair in thesame home is measured at the phone sockets in the time do-main using a digital oscilloscope (Lecroy Waverunner 64Xi).A balun was used to adapt the impedance of the oscilloscope(50 Ohms) to the characteristic impedance of the telephonecopper pairs (100 Ohms). The waveform generator and theoscilloscope were powered using the home electrical networkbut, in order to minimize the influence of the measurementequipment on the noise measurements, they were poweredusing a filtered power supply and they were also powered froma distant outlet. The sampling frequency both at the transmitterand the receiver was set to 250 MHz.
Fig. 1: The measurement set-up.
B. The injected PLC signal
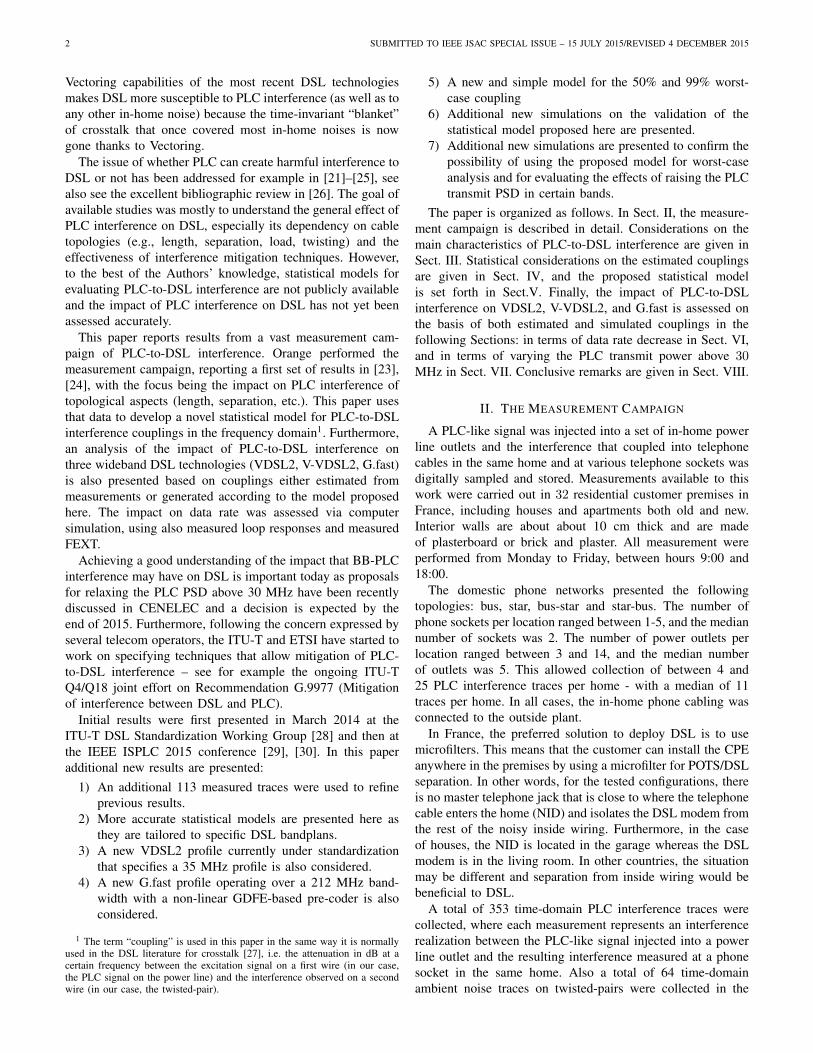
The injected PLC-like signal had a flat Power SpectralDensity (PSD) of −60 dBm/Hz over a band up to 125 MHz.The coupler used for the injection of the PLC noise on theelectrical line was custom built, exhibited good widebandcharacteristics between 0.5 − 100 MHz, and introduced onlya few dB attenuation. The coupler transfer function is shownin Figure 2
We point out that both radiated and conducted PLC inter-ference are present on twisted pairs, but in this work we didnot attempt to separate the two contributions. We consideredthe cumulative effect of both components by measuring theinterference observed on the twisted pair and by estimating thevalue of the interference coupling in the frequency domain.
0 20 40 60 80 100−20
−18
−16
−14
−12
−10
−8
−6
−4
−2
0
Frequency (MHz)
PLC
Cou
pler
Tra
nsfe
r F
unct
ion
(dB
)
Fig. 2: The PLC coupler used in the measurement campaign.
Modern PLC technologies avoid transmitting in the FMbroadcast band2 to avoid creating interference to it. ITU-TG.hn allows limiting transmission up 80 MHz and HomePlugAV2 uses frequencies up to 86.13 MHz. The statistical con-siderations made here for the PLC-to-DSL interference in the1.8− 100 MHz band apply also to the 1.8− 86.13 MHz bandas the estimated couplings Probability Density Function (PDF)for the two bands is basically identical (see Figure 3.(a) in[30]).
C. Processing of Measured Interference
The baseline and PLC-induced noise present on the cus-tomer’s telephone copper pairs were measured with a digitaloscilloscope sampling at 250 Msamples/sec and connected viaan impedance matching balun to a phone socket. Each time-domain trace contained 25 million samples, corresponding toa duration of 100 ms. Each time-domain measured noise tracerepresents an “interference realization” between a power lineoutlet and a phone socket or simply the ambient baselinenoise measured at the phone socket in the absence of PLC-like excitation over the power lines in the same home. Thereare often multiple traces per home, each from different outlet-phone jack pairs.
The PSD of the interference traces was estimated using amodified Welch algorithm [31]. PLC-to-twisted pair couplingswere then computed by subtracting from the estimated noisePSD the PLC-like excitation signal of −60 dBm/Hz. Thenumber of estimated couplings available for this study were1.3 million for the 17 MHz VDSL2 profile VDSL2-17a (1.8-17.6 MHz band), 2.8 million for the 35 MHz VDSL2 profileVDSL2-35b (1.8-35.3 MHz band), and around 680 thousandfor the 106 MHz G.fast profile FAST-106 (1.8-100 MHz band).
The estimated interference couplings between power linesand phone lines have been used to simulate PLC-to-DSL
2 The FM broadcast band varies in different parts of the world. In ITURegion 1 (Europe and Africa) this band spans 87.5 − 108 MHz, while inITU Region 2 (Americas) it spans 87.9 − 107.9 MHz. The FM broadcastband in Japan uses the 76-90 MHz band.
4 SUBMITTED TO IEEE JSAC SPECIAL ISSUE – 15 JULY 2015/REVISED 4 DECEMBER 2015
interference and assess its impact on the performance ofVDSL2, V-VDSL2, and G.fast.
III. INITIAL CONSIDERATIONS ON THE MEASUREMENTS
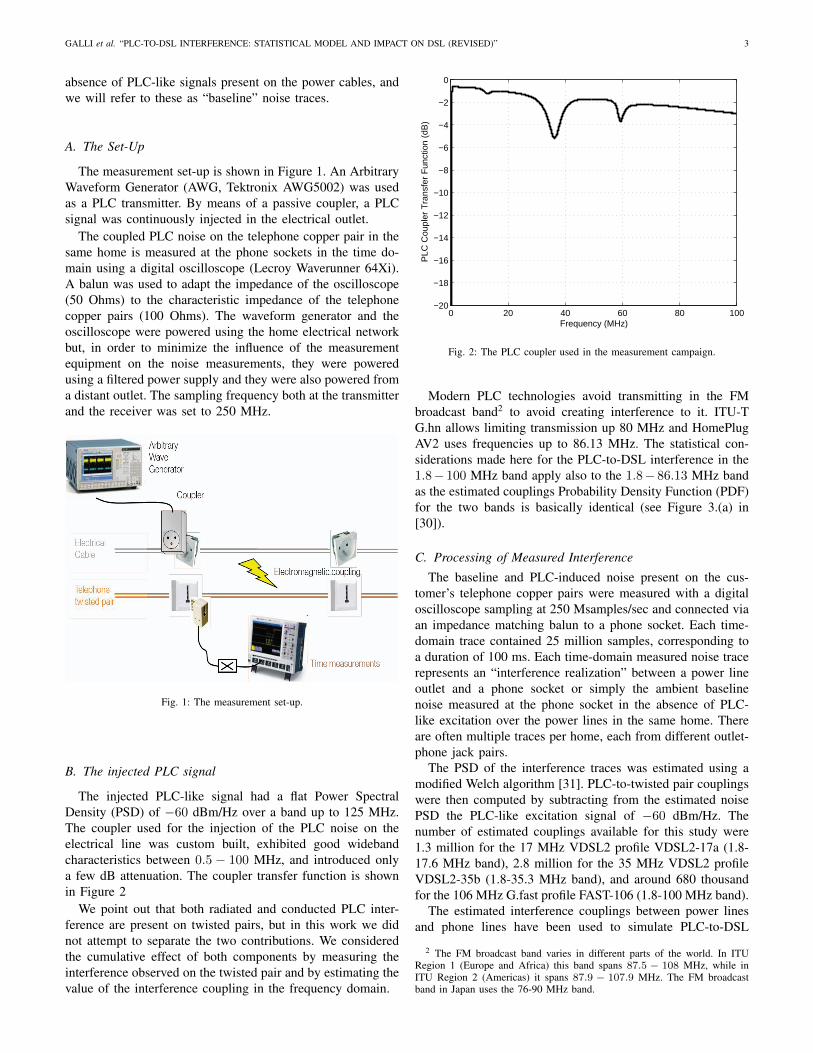
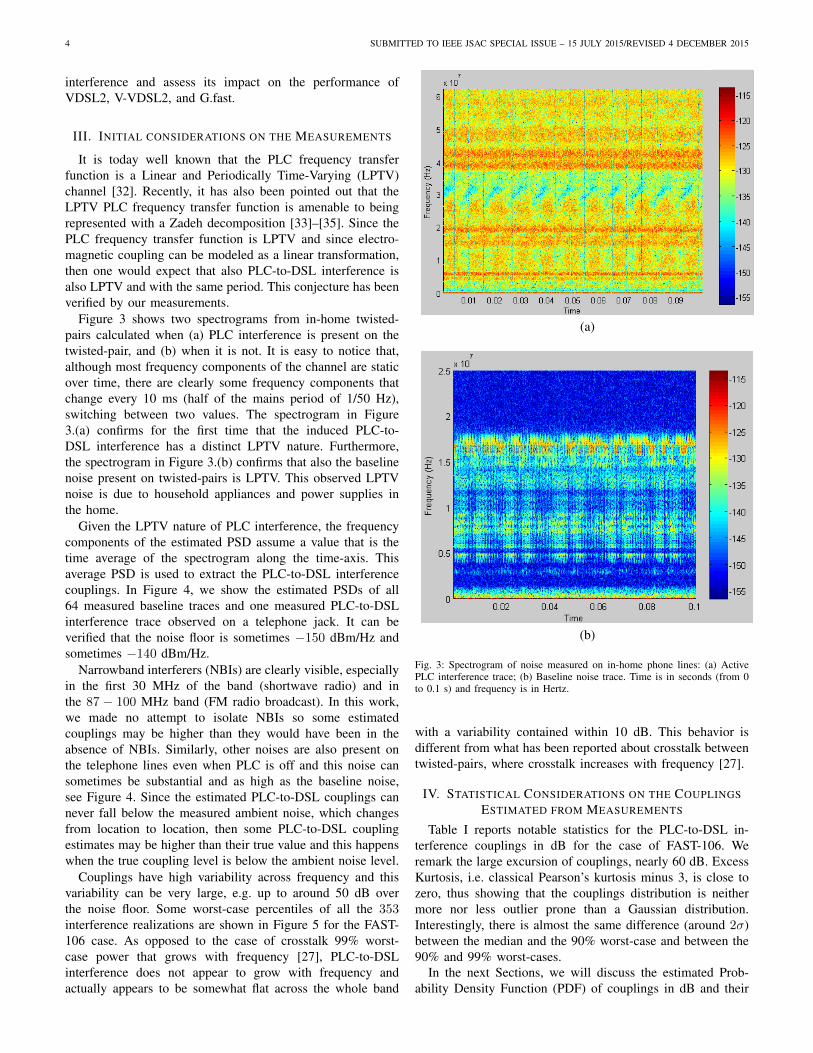
It is today well known that the PLC frequency transferfunction is a Linear and Periodically Time-Varying (LPTV)channel [32]. Recently, it has also been pointed out that theLPTV PLC frequency transfer function is amenable to beingrepresented with a Zadeh decomposition [33]–[35]. Since thePLC frequency transfer function is LPTV and since electro-magnetic coupling can be modeled as a linear transformation,then one would expect that also PLC-to-DSL interference isalso LPTV and with the same period. This conjecture has beenverified by our measurements.
Figure 3 shows two spectrograms from in-home twisted-pairs calculated when (a) PLC interference is present on thetwisted-pair, and (b) when it is not. It is easy to notice that,although most frequency components of the channel are staticover time, there are clearly some frequency components thatchange every 10 ms (half of the mains period of 1/50 Hz),switching between two values. The spectrogram in Figure3.(a) confirms for the first time that the induced PLC-to-DSL interference has a distinct LPTV nature. Furthermore,the spectrogram in Figure 3.(b) confirms that also the baselinenoise present on twisted-pairs is LPTV. This observed LPTVnoise is due to household appliances and power supplies inthe home.
Given the LPTV nature of PLC interference, the frequencycomponents of the estimated PSD assume a value that is thetime average of the spectrogram along the time-axis. Thisaverage PSD is used to extract the PLC-to-DSL interferencecouplings. In Figure 4, we show the estimated PSDs of all64 measured baseline traces and one measured PLC-to-DSLinterference trace observed on a telephone jack. It can beverified that the noise floor is sometimes −150 dBm/Hz andsometimes −140 dBm/Hz.
Narrowband interferers (NBIs) are clearly visible, especiallyin the first 30 MHz of the band (shortwave radio) and inthe 87 − 100 MHz band (FM radio broadcast). In this work,we made no attempt to isolate NBIs so some estimatedcouplings may be higher than they would have been in theabsence of NBIs. Similarly, other noises are also present onthe telephone lines even when PLC is off and this noise cansometimes be substantial and as high as the baseline noise,see Figure 4. Since the estimated PLC-to-DSL couplings cannever fall below the measured ambient noise, which changesfrom location to location, then some PLC-to-DSL couplingestimates may be higher than their true value and this happenswhen the true coupling level is below the ambient noise level.
Couplings have high variability across frequency and thisvariability can be very large, e.g. up to around 50 dB overthe noise floor. Some worst-case percentiles of all the 353interference realizations are shown in Figure 5 for the FAST-106 case. As opposed to the case of crosstalk 99% worst-case power that grows with frequency [27], PLC-to-DSLinterference does not appear to grow with frequency andactually appears to be somewhat flat across the whole band
(a)
(b)
Fig. 3: Spectrogram of noise measured on in-home phone lines: (a) ActivePLC interference trace; (b) Baseline noise trace. Time is in seconds (from 0to 0.1 s) and frequency is in Hertz.
with a variability contained within 10 dB. This behavior isdifferent from what has been reported about crosstalk betweentwisted-pairs, where crosstalk increases with frequency [27].
IV. STATISTICAL CONSIDERATIONS ON THE COUPLINGSESTIMATED FROM MEASUREMENTS
Table I reports notable statistics for the PLC-to-DSL in-terference couplings in dB for the case of FAST-106. Weremark the large excursion of couplings, nearly 60 dB. ExcessKurtosis, i.e. classical Pearson’s kurtosis minus 3, is close tozero, thus showing that the couplings distribution is neithermore nor less outlier prone than a Gaussian distribution.Interestingly, there is almost the same difference (around 2σ)between the median and the 90% worst-case and between the90% and 99% worst-cases.
In the next Sections, we will discuss the estimated Prob-ability Density Function (PDF) of couplings in dB and their

GALLI et al. “PLC-TO-DSL INTERFERENCE: STATISTICAL MODEL AND IMPACT ON DSL (REVISED)” 5
0 20 40 60 80 100−160
−150
−140
−130
−120
−110
−100
−90
Frequency (MHz)
Pow
er S
pect
ral D
ensi
ty (
dBm
/Hz)
Fig. 4: The ambient baseline noise PSDs of all 64 baseline measurements andone measured PLC-to-DSL interference trace (bold black).
0 20 40 60 80 100−90
−80
−70
−60
−50
−40
−30
Frequency (MHz)
Wor
st C
ase
Cou
plin
gs (
dB)
FAST−106
Fig. 5: Some typical worst-case estimated couplings for the FAST-106 case.From top to bottom: 99%, 90%, and 50%.
Quantile-Quantile (QQ) plots.
A. The Estimated Probability Density Functions
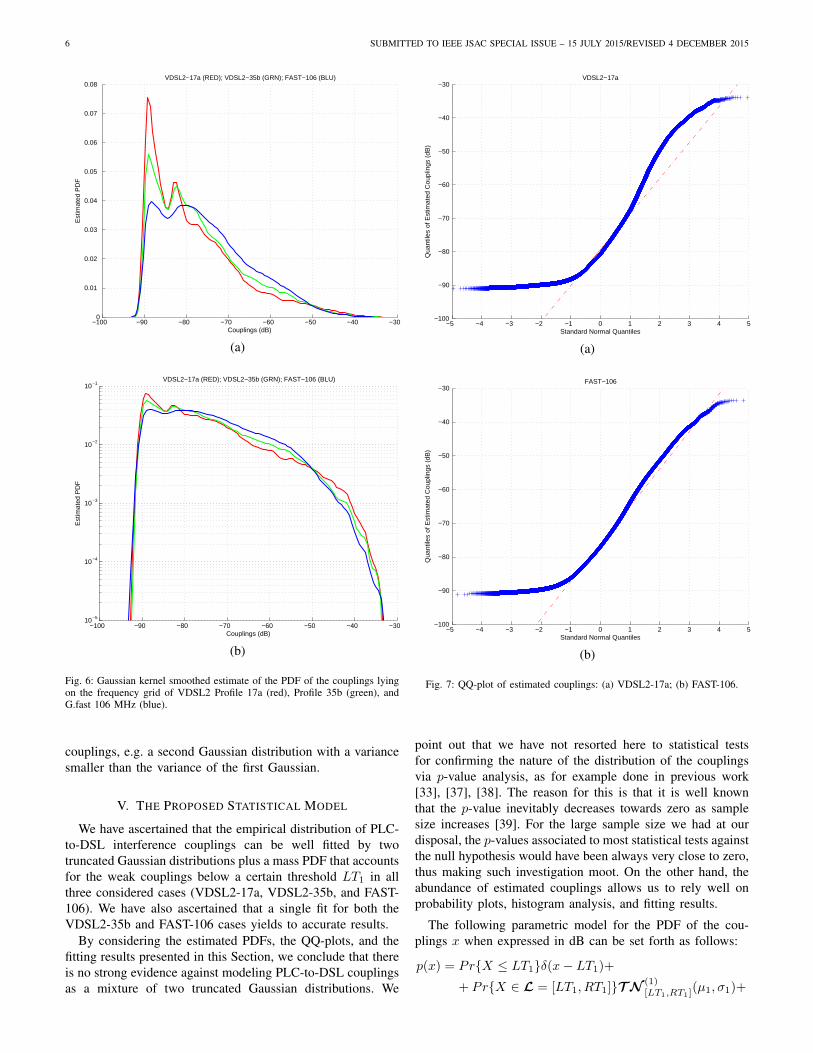
The Probability Density Functions (PDFs) of the estimatedcouplings lying on the frequency grid of VDSL2-17a, VDSL2-35b, and FAST-106 are shown in Figure 6, both in linear(a) and log (b) scales. The PDFs have been estimated viaGaussian kernel smoothing [36] and the population includesall couplings regardless of frequency or location.
The choice of putting in the same population all estimatedcouplings will lead to a statistical model where couplings areassigned to carriers randomly and independently. The advan-tage of this approach is that a single model can be set forthrather than having multiple models devised on a per-frequencyor per-band basis. Although this method is able to reproduce(over many realizations) the statistics of estimated couplings,it does not emulate well a single realization of interference
TABLE I: Notable statistics of PLC-to-DSL interference couplings in dB inthe 1.8-100 MHz band.
Couplings (dB)
Min −91.0Max −33.6Mean −75.2Std. Dev. (unbiased) 10.5Kurtosis 2.9Skewness 0.750%-Percentile −77.090%-Percentile −59.899%-Percentile −47.8
between a specific outlet and phone jack as the information onthe correlation between couplings across frequency would belost. However, as simulations in Sect. VI will confirm, the lossof this information will not prevent us from getting accurateresults on the average DSL data rate in the presence of PLCinterference, as well as accurate worst-case (outage) analysisbased on worst-case couplings. In the case it is important toreplicate the correlation between couplings across frequenciesthat is typical of a single realization, this can be done bygenerating fewer random couplings than the number of DSLsub-carriers, spacing them across the band of interest, and theninterpolating the couplings for example via polynomial fit orcubic spline.
The effect of the noise floor at −150 dBm/Hz is noticeableby looking at truncation of the estimated PDF around −90dB. However, the left side of the estimated PDF in Figure 6.(a)seems to suggest that there is a large number of low couplingsin the range between −83 dB and −90 dB. This behavior couldbe due to the fact that the values of the estimated couplingsare never below the baseline noise and, therefore, couplingswith low values can be estimated to have higher values thanwhat they should have had if no baseline noise were present.
Two interesting observations about the PDFs in the threeDSL bandplans are can be made:
1) For the VDSL2-17a case, both very low values andvery high values of couplings are much more likely tooccur compared to the VDSL2-35b and FAST-106 caseswhereas intermediate values of couplings are less likelyto occur.
2) The PDF for the VDSL2-35b case lies somewhat in-between the two PDFs of VDSL2-17a and FAST-106.
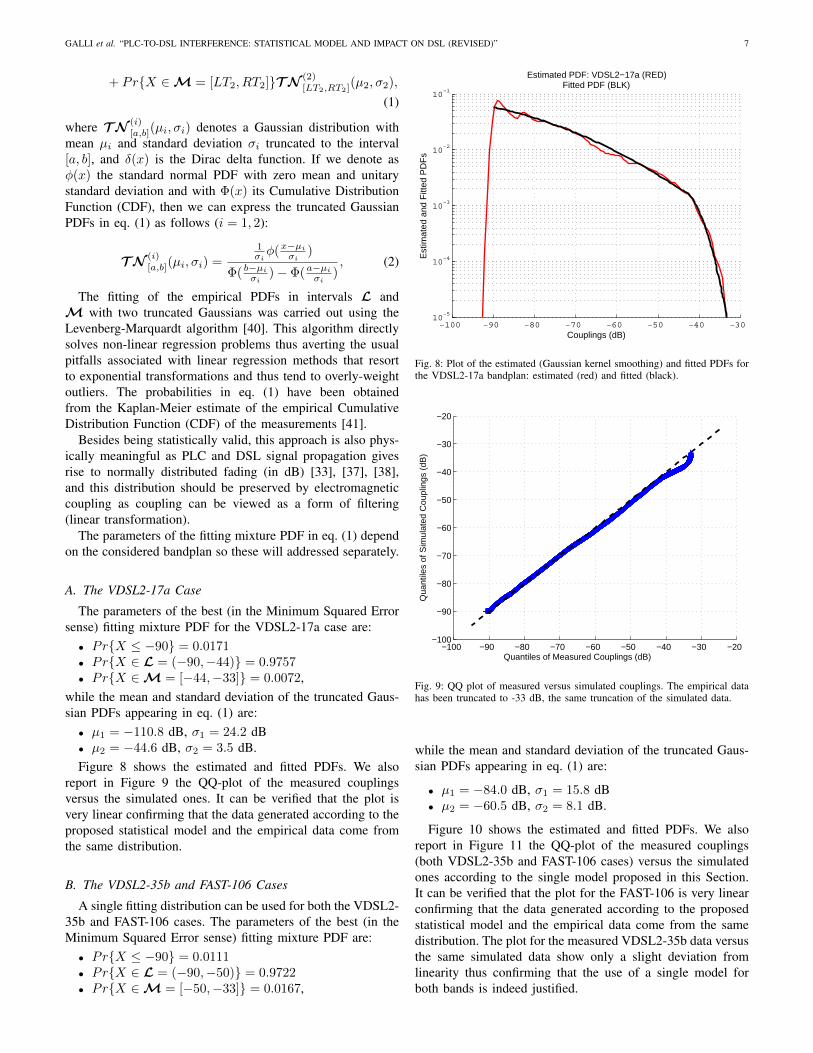
B. QQ Plots
The quantile-quantile (QQ) plots of the couplings lying onthe frequency grids of VDSL2-17a and FAST-106 are shownin Figure 7. The case of VDSL2-35b is intermediate to theones reported in Figure 7 but it is not reported for the sakeof brevity. Apart from the obvious evidence of truncation, theQQ-plots exhibit a rather linear trend for low to moderate cou-plings and then start deviating above the reference line. Thistype of QQ-plot may be interpreted as suggesting the presenceof mixture of PDFs: a Gaussian one for low-to-moderatecouplings and a lighter-tailed distribution for moderate-to-high
6 SUBMITTED TO IEEE JSAC SPECIAL ISSUE – 15 JULY 2015/REVISED 4 DECEMBER 2015
−100 −90 −80 −70 −60 −50 −40 −300
0.01
0.02
0.03
0.04
0.05
0.06
0.07
0.08
Couplings (dB)
Est
imat
ed P
DF
VDSL2−17a (RED); VDSL2−35b (GRN); FAST−106 (BLU)
(a)
−100 −90 −80 −70 −60 −50 −40 −3010−5
10−4
10−3
10−2
10−1
Couplings (dB)
Est
imat
ed P
DF
VDSL2−17a (RED); VDSL2−35b (GRN); FAST−106 (BLU)
(b)
Fig. 6: Gaussian kernel smoothed estimate of the PDF of the couplings lyingon the frequency grid of VDSL2 Profile 17a (red), Profile 35b (green), andG.fast 106 MHz (blue).
couplings, e.g. a second Gaussian distribution with a variancesmaller than the variance of the first Gaussian.
V. THE PROPOSED STATISTICAL MODEL
We have ascertained that the empirical distribution of PLC-to-DSL interference couplings can be well fitted by twotruncated Gaussian distributions plus a mass PDF that accountsfor the weak couplings below a certain threshold LT1 in allthree considered cases (VDSL2-17a, VDSL2-35b, and FAST-106). We have also ascertained that a single fit for both theVDSL2-35b and FAST-106 cases yields to accurate results.
By considering the estimated PDFs, the QQ-plots, and thefitting results presented in this Section, we conclude that thereis no strong evidence against modeling PLC-to-DSL couplingsas a mixture of two truncated Gaussian distributions. We
−5 −4 −3 −2 −1 0 1 2 3 4 5−100
−90
−80
−70
−60
−50
−40
−30
Standard Normal Quantiles
Qua
ntile
s of
Est
imat
ed C
oupl
ings
(dB
)
VDSL2−17a
(a)
−5 −4 −3 −2 −1 0 1 2 3 4 5−100
−90
−80
−70
−60
−50
−40
−30
Standard Normal Quantiles
Qua
ntile
s of
Est
imat
ed C
oupl
ings
(dB
)
FAST−106
(b)
Fig. 7: QQ-plot of estimated couplings: (a) VDSL2-17a; (b) FAST-106.
point out that we have not resorted here to statistical testsfor confirming the nature of the distribution of the couplingsvia p-value analysis, as for example done in previous work[33], [37], [38]. The reason for this is that it is well knownthat the p-value inevitably decreases towards zero as samplesize increases [39]. For the large sample size we had at ourdisposal, the p-values associated to most statistical tests againstthe null hypothesis would have been always very close to zero,thus making such investigation moot. On the other hand, theabundance of estimated couplings allows us to rely well onprobability plots, histogram analysis, and fitting results.
The following parametric model for the PDF of the cou-plings x when expressed in dB can be set forth as follows:
p(x) = Pr{X ≤ LT1}δ(x− LT1)+
+ Pr{X ∈ L = [LT1, RT1]}T N (1)[LT1,RT1]
(µ1, σ1)+
GALLI et al. “PLC-TO-DSL INTERFERENCE: STATISTICAL MODEL AND IMPACT ON DSL (REVISED)” 7
+ Pr{X ∈M = [LT2, RT2]}T N (2)[LT2,RT2]
(µ2, σ2),
(1)
where T N (i)[a,b](µi, σi) denotes a Gaussian distribution with
mean µi and standard deviation σi truncated to the interval[a, b], and δ(x) is the Dirac delta function. If we denote asφ(x) the standard normal PDF with zero mean and unitarystandard deviation and with Φ(x) its Cumulative DistributionFunction (CDF), then we can express the truncated GaussianPDFs in eq. (1) as follows (i = 1, 2):
T N (i)[a,b](µi, σi) =
1σiφ(x−µi
σi)
Φ( b−µi
σi)− Φ(a−µi
σi), (2)
The fitting of the empirical PDFs in intervals L andM with two truncated Gaussians was carried out using theLevenberg-Marquardt algorithm [40]. This algorithm directlysolves non-linear regression problems thus averting the usualpitfalls associated with linear regression methods that resortto exponential transformations and thus tend to overly-weightoutliers. The probabilities in eq. (1) have been obtainedfrom the Kaplan-Meier estimate of the empirical CumulativeDistribution Function (CDF) of the measurements [41].
Besides being statistically valid, this approach is also phys-ically meaningful as PLC and DSL signal propagation givesrise to normally distributed fading (in dB) [33], [37], [38],and this distribution should be preserved by electromagneticcoupling as coupling can be viewed as a form of filtering(linear transformation).
The parameters of the fitting mixture PDF in eq. (1) dependon the considered bandplan so these will addressed separately.
A. The VDSL2-17a Case
The parameters of the best (in the Minimum Squared Errorsense) fitting mixture PDF for the VDSL2-17a case are:
• Pr{X ≤ −90} = 0.0171• Pr{X ∈ L = (−90,−44)} = 0.9757• Pr{X ∈M = [−44,−33]} = 0.0072,
while the mean and standard deviation of the truncated Gaus-sian PDFs appearing in eq. (1) are:
• µ1 = −110.8 dB, σ1 = 24.2 dB• µ2 = −44.6 dB, σ2 = 3.5 dB.Figure 8 shows the estimated and fitted PDFs. We also
report in Figure 9 the QQ-plot of the measured couplingsversus the simulated ones. It can be verified that the plot isvery linear confirming that the data generated according to theproposed statistical model and the empirical data come fromthe same distribution.
B. The VDSL2-35b and FAST-106 Cases
A single fitting distribution can be used for both the VDSL2-35b and FAST-106 cases. The parameters of the best (in theMinimum Squared Error sense) fitting mixture PDF are:
• Pr{X ≤ −90} = 0.0111• Pr{X ∈ L = (−90,−50)} = 0.9722• Pr{X ∈M = [−50,−33]} = 0.0167,
−100 −90 −80 −70 −60 −50 −40 −3010
−5
10−4
10−3
10−2
10−1
Couplings (dB)
Est
imat
ed a
nd F
itted
PD
Fs
Estimated PDF: VDSL2−17a (RED)Fitted PDF (BLK)
Fig. 8: Plot of the estimated (Gaussian kernel smoothing) and fitted PDFs forthe VDSL2-17a bandplan: estimated (red) and fitted (black).
−100 −90 −80 −70 −60 −50 −40 −30 −20−100
−90
−80
−70
−60
−50
−40
−30
−20
Quantiles of Measured Couplings (dB)
Qua
ntile
s of
Sim
ulat
ed C
oupl
ings
(dB
)
Fig. 9: QQ plot of measured versus simulated couplings. The empirical datahas been truncated to -33 dB, the same truncation of the simulated data.
while the mean and standard deviation of the truncated Gaus-sian PDFs appearing in eq. (1) are:
• µ1 = −84.0 dB, σ1 = 15.8 dB• µ2 = −60.5 dB, σ2 = 8.1 dB.
Figure 10 shows the estimated and fitted PDFs. We alsoreport in Figure 11 the QQ-plot of the measured couplings(both VDSL2-35b and FAST-106 cases) versus the simulatedones according to the single model proposed in this Section.It can be verified that the plot for the FAST-106 is very linearconfirming that the data generated according to the proposedstatistical model and the empirical data come from the samedistribution. The plot for the measured VDSL2-35b data versusthe same simulated data show only a slight deviation fromlinearity thus confirming that the use of a single model forboth bands is indeed justified.

8 SUBMITTED TO IEEE JSAC SPECIAL ISSUE – 15 JULY 2015/REVISED 4 DECEMBER 2015
−100 −90 −80 −70 −60 −50 −40 −3010
−5
10−4
10−3
10−2
10−1
Couplings (dB)
Est
imat
ed a
nd fi
tted
PD
Fs
Estimated PDFs: VDSL2−35b (GRN); FAST−106 (BLU)Fitted PDF (BLK)
Fig. 10: Plot of the estimated (Gaussian kernel smoothing) and fitted PDFsfor the VDSL2-35b and FAST-106 bandplans: estimated VDSL2-35b (green),estimated FAST-106 (blue) and fitted (black).
−100 −90 −80 −70 −60 −50 −40 −30 −20−100
−90
−80
−70
−60
−50
−40
−30
−20
Quantiles of Measured Data (dB)
Qua
ntile
s of
Sim
ulat
ed D
ata
(dB
)
VDSL2−35b
FAST−106
Fig. 11: QQ plot of VDSL2-35b (blue) and FAST-106 (red) measured versusthe same set of simulated couplings. The two empirical data sets have beentruncated to -33 dB, the same truncation of the simulated data.
VI. EVALUATION OF THE IMPACT OF PLC-TO-DSLINTERFERENCE ON DSL DATA RATE
The simulations presented in this section assess the impactof PLC-to-DSL interference using the couplings estimatedon the basis of measurements or generated via the statisticalmodel in Sect. V. Unless otherwise specified, the data rateswhen PLC interference is absent have been calculated usingthe measured baseline traces.
A. Simulation Methodology
1) PLC Interference: PLC interference was generated usinga maximum allowed PSD of -55 dBm/Hz in 2-30 MHz andof -85 dBm/Hz in 30-87 MHz, while no PLC transmission ispresent in the FM broadcast band of 87-100 MHz. This choiceis consistent with the recent HomePlug AV2 [12] and ITU-T
G.hn [15] specifications. We point out that most PLC devicesin the field today transmit up to 67.5 MHz so that allowingPLC to go up to 87 MHZ in our simulations will translate ina larger impact to DSL.
This transmit PSD is added, in dB, to the estimated cou-plings to form a realization of the noise PSD into the DSLdownstream receiver. This methodology assumes that the PLCnode is continuously transmitting at maximum power, whichis not the case under normal operations.
2) VDSL2 and V-VDSL2: VDSL2 uses high frequenciesand loop lengths typically up to 1.5 km to transmit at speedsof at most a few hundred Mbps. VDSL2 uses frequency-division duplexing, upstream and downstream, to avoid near-end crosstalk (NEXT). Vectoring removes the FEXT createdwithin a Vectored group by performing precoding at the trans-mitter (downstream) and crosstalk cancelation at the receiver(upstream). Thus, Vectoring allows maintaining single-lineVDSL2 data rate regardless of the number of self-crosstalkers.
The simulations here calculate downstream (V-)VDSL2 bitrates. The simulations use models and parameters from ANSIStd. T1.413 [42]. Both VDSL2 Profile 17a (VDSL2-17a) andProfile 35b (VDSL2-35b) are simulated. For VDSL2-17a, thetransmit PSD is at most 3.5 dB below the VDSL2 profile998ADE17-M2x-A PSD limit mask defined in Annex B ofG.993.2 [4]. For VDSL2-35b, the Draft Annex additionallyspecifies -60 dBm/Hz from 17.7 to 30 MHz and -76.7 dBm/Hzabove 30 MHz, all downstream. Additionally, the maximumtransmit PSD is limited to meet the G.993.2 average powerconstraint 3 and there is no Downstream Power Back-Off.AWGN at -140 dBm/Hz is also added in all cases.
For VDSL2, the simulations include two 99% worst-caseFEXT crosstalkers. For V-VDSL2, the simulations model theideal case of complete in-domain crosstalk cancelation andno out-of-domain/alien crosstalk present [43]. The measuredbaseline noise is added to the received signal.
For the downstream data rate calculation, margin is 6 dBand total coding gain is 3 dB. Bit rates are calculated bysumming the capacity of each 4.3125 kHz sub-carrier witha 9.75 dB SNR gap, with bits per Hz per sub-carrier lowerlimited to at least one bit and upper limited to 14 bits/Hzper sub-carrier. A guard-band of 12 sub-carriers is imposedbetween each passband and these guard-bands carry no bits.Loops are all 0.5mm/24 AWG. VDSL2 has 10% overhead butall presented data rates are pure line rates.
3) G.fast: G.fast was simulated for both the 106 MHz and212 MHz Profiles. For both profiles, the following commonassumptions were made:
• The transmit frequency band goes from 2.5 MHz up to106 MHz or 212 MHz.
• A full cable of 10 active and Vectored lines was simu-lated.
• The G.fast PSD is always normalized, so that the transmitPSD is unaltered by precoding at all frequencies.
• Loop response and FEXT are measured on a 100m
3The maximum PSD level is lowered to a point where the transmit poweracross all frequencies meets the total power constraint. The same thing isdone for G.fast. This is common industry practice.

GALLI et al. “PLC-TO-DSL INTERFERENCE: STATISTICAL MODEL AND IMPACT ON DSL (REVISED)” 9
0.5mm/24 AWG distribution cable4.• Background noise is simulated using the measured base-
line noise traces, and AWGN is -140 dBm/Hz below 30MHz and -150 dBm/Hz above 30 MHz.
For the 106 MHz case (FAST-106) we additionally have:
• DMT with 2048 carriers equally spaced between DC and106 MHz, at a spacing of 51.75 kHz.
• Vectoring is performed using linear zero-forcing pre-coders. No channel estimation is performed (perfectknowledge of the channel matrix is assumed at thetransmitter) and there is no precoder quantization error.
• The G.fast PSD is limited as in Recommendation ITU-TG.9700, with PSD mask of -65 dBm/Hz below 30 MHz,and linearly sloping from -73 dBm/Hz at 30 MHz down to-76 dBm/Hz at 106 MHz. This is further limited to meetthe 4.0 dBm total transmit power limit by limiting themax transmit PSD to -76.15 dBm/Hz when transmittingfrom 2.5 to 106 MHz.
For the 212 MHz case (FAST-212), we also have:
• DMT with 4096 carriers equally spaced between DC and212 MHz, at a spacing of 51.75 kHz.
• Vectoring is performed using a non-linear precoder basedon the QR factorization of the complex conjugate of chan-nel matrix as described in [45]. No channel estimationis performed (perfect knowledge of the channel matrixis assumed at the transmitter) and there is no precoderquantization error.
• The PSD is the same as that of FAST-106 below 106MHz, and then exhibits a linear slope from -76 dBm/Hzat 106 MHz to -79 dBm/Hz at 212 MHz.
Data rate is calculated by summing the capacity of each51.75 kHz G.fast sub-carrier with a 9.75 dB SNR gap, withbits per Hz lower limited to at least one bit per Hz andupper limited to 12 bits per Hz. Margin was set to 6 dB andtotal coding gain to 3 dB. Differently from the VDSL2 case,speeds of G.fast are maximum total line rate5. G.fast has 10%overhead but all presented data rates are net of this overhead.
Since measured cable responses and FEXT were used, thedirect and crosstalk channels are different from line to lineand this leads to data rate variation across lines even when noPLC-to-DSL interference is present.
B. Assessing Impact on DSL Using Estimated Couplings
The simulations presented in this section assess the impactof PLC interference using the couplings estimated on thebasis of measurements. In all cases, the data rates when PLCinterference is off have been calculated using the measuredbaseline noise traces.
4 There is no commonly agreed upon channel model for twisted-pairs thatextends beyond 50 MHz. Thus, for G.fast, we limit our analysis to looplengths of 100 meters only for which there is the availability of measurementsperformed by British Telecom [44].
5 Unlike previous DSL standards, G.fast uses Time Division Duplexing(TDD) and the asymmetry ratio can be varied. Rather than arbitrarilypicking an asymmetry ratio, we used the maximum data rate (upstream plusdownstream) as if 100% of resources were devoted to downstream.
1) VDSL2: In Figure 12, the downstream data rates ofVDSL2 impaired by two 99% worst-case FEXT crosstalkersand PLC interference are shown versus loop length for bothconsidered profiles. The median curve confirms that, in at least50% of cases, the data rate degradation is negligible up toaround 400m-500m, and still small at longer loop lengths.However, in the case of strong couplings, the performancedegradation can be substantial.
0.1 0.2 0.3 0.4 0.5 0.6 0.7 0.8 0.9 10
20
40
60
80
100
120
140
160
180
Loop Length (km)
Dat
a R
ate
(Mbp
s)
VDSL2−17a (RED), VDSL2−35b (BLK)No PLC (solid); With PLC min/median/max (dashed)
VDSL2−35b
VDSL2−17a
Fig. 12: Data rates achievable by VDSL2 profiles 17a and 35b versus distance,with and without PLC interference. For the performance in the presence ofPLC-to-DSL interference, the minimum, median, and maximum data rates areshown as dashed lines. Two 99% worst-case FEXT crosstalkers are present.
The average and maximum data rate loss due to PLCinterference are plotted in Figure 13. As distance grows, theSNR at the DSL receiver decreases due to loop attenuationand the data rate loss increases (percentage-wise). At a certainpoint, however, the impact on DSL decreases. This is due totwo causes: (a) after 500-700 meters the number of activehigh-frequency sub-carriers decreases due to loop attenuation,while the sub-carriers below 1.8 MHz remain active but arePLC-interference free; (b) there is a higher probability ofencountering low coupling values at lower frequencies (seeFigure 6).
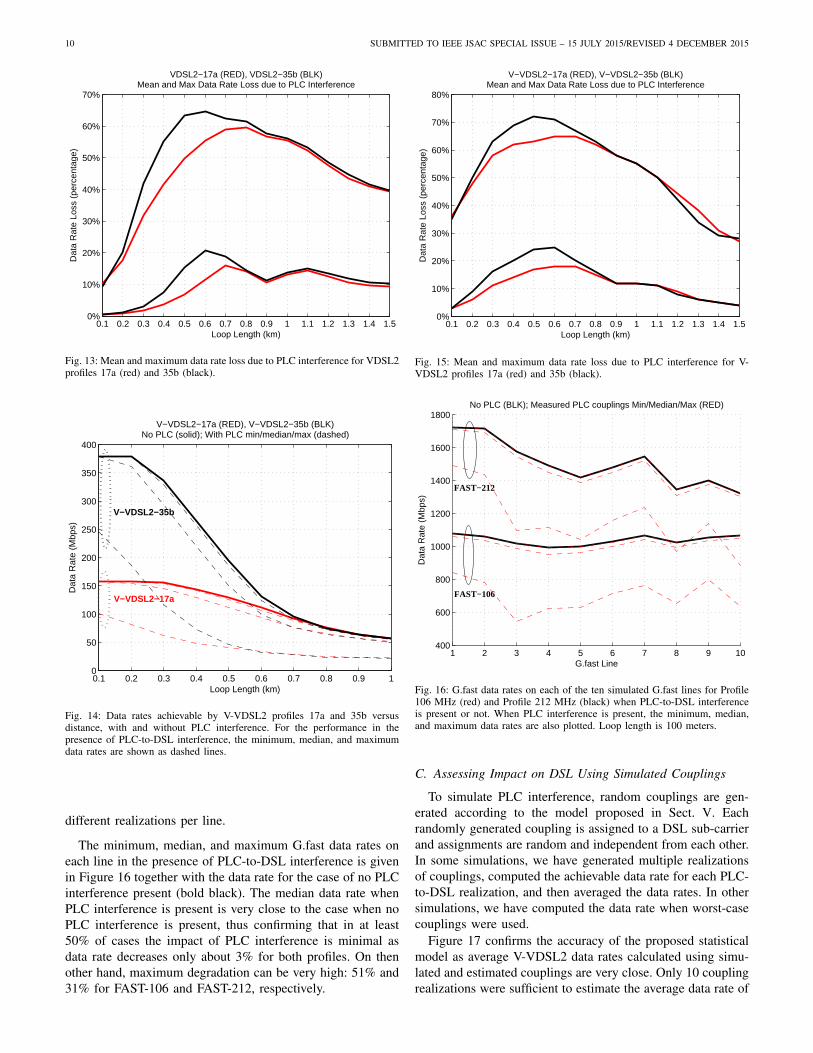
2) Vectored VDSL2: In Figure 14, the downstream datarates of V-VDSL2 impaired by PLC interference are shownversus loop length for both considered profiles. The mediancurve confirms that, in at least 50% of cases, the data ratedegradation is limited up to 15%-25%. However, in the caseof strong couplings, the performance degradation can besubstantial.
The average and maximum data rate loss due to PLCinterference are plotted in Figure 15. Impact on V-VDSL2follows the same trend already described for the case ofVDSL2.
3) G.fast: The performance of a G.fast system was evalu-ated on the basis of real loop and FEXT measurements andfor a loop length of 100m. The 353 available PLC-to-DSLinterference realizations were used for the calculation of thedata rates of 10 G.fast Vectored lines, allowing the use of 35
10 SUBMITTED TO IEEE JSAC SPECIAL ISSUE – 15 JULY 2015/REVISED 4 DECEMBER 2015
0.1 0.2 0.3 0.4 0.5 0.6 0.7 0.8 0.9 1 1.1 1.2 1.3 1.4 1.50%
10%
20%
30%
40%
50%
60%
70%
VDSL2−17a (RED), VDSL2−35b (BLK)Mean and Max Data Rate Loss due to PLC Interference
Loop Length (km)
Dat
a R
ate
Loss
(pe
rcen
tage
)
Fig. 13: Mean and maximum data rate loss due to PLC interference for VDSL2profiles 17a (red) and 35b (black).
0.1 0.2 0.3 0.4 0.5 0.6 0.7 0.8 0.9 10
50
100
150
200
250
300
350
400
Loop Length (km)
Dat
a R
ate
(Mbp
s)
V−VDSL2−17a (RED), V−VDSL2−35b (BLK)No PLC (solid); With PLC min/median/max (dashed)
V−VDSL2−35b
V−VDSL2−17a
Fig. 14: Data rates achievable by V-VDSL2 profiles 17a and 35b versusdistance, with and without PLC interference. For the performance in thepresence of PLC-to-DSL interference, the minimum, median, and maximumdata rates are shown as dashed lines.
different realizations per line.
The minimum, median, and maximum G.fast data rates oneach line in the presence of PLC-to-DSL interference is givenin Figure 16 together with the data rate for the case of no PLCinterference present (bold black). The median data rate whenPLC interference is present is very close to the case when noPLC interference is present, thus confirming that in at least50% of cases the impact of PLC interference is minimal asdata rate decreases only about 3% for both profiles. On thenother hand, maximum degradation can be very high: 51% and31% for FAST-106 and FAST-212, respectively.
0.1 0.2 0.3 0.4 0.5 0.6 0.7 0.8 0.9 1 1.1 1.2 1.3 1.4 1.50%
10%
20%
30%
40%
50%
60%
70%
80%
V−VDSL2−17a (RED), V−VDSL2−35b (BLK)Mean and Max Data Rate Loss due to PLC Interference
Loop Length (km)
Dat
a R
ate
Loss
(pe
rcen
tage
)
Fig. 15: Mean and maximum data rate loss due to PLC interference for V-VDSL2 profiles 17a (red) and 35b (black).
1 2 3 4 5 6 7 8 9 10400
600
800
1000
1200
1400
1600
1800
G.fast Line
Dat
a R
ate
(Mbp
s)
No PLC (BLK); Measured PLC couplings Min/Median/Max (RED)
FAST−106
FAST−212
Fig. 16: G.fast data rates on each of the ten simulated G.fast lines for Profile106 MHz (red) and Profile 212 MHz (black) when PLC-to-DSL interferenceis present or not. When PLC interference is present, the minimum, median,and maximum data rates are also plotted. Loop length is 100 meters.
C. Assessing Impact on DSL Using Simulated Couplings
To simulate PLC interference, random couplings are gen-erated according to the model proposed in Sect. V. Eachrandomly generated coupling is assigned to a DSL sub-carrierand assignments are random and independent from each other.In some simulations, we have generated multiple realizationsof couplings, computed the achievable data rate for each PLC-to-DSL realization, and then averaged the data rates. In othersimulations, we have computed the data rate when worst-casecouplings were used.
Figure 17 confirms the accuracy of the proposed statisticalmodel as average V-VDSL2 data rates calculated using simu-lated and estimated couplings are very close. Only 10 couplingrealizations were sufficient to estimate the average data rate of
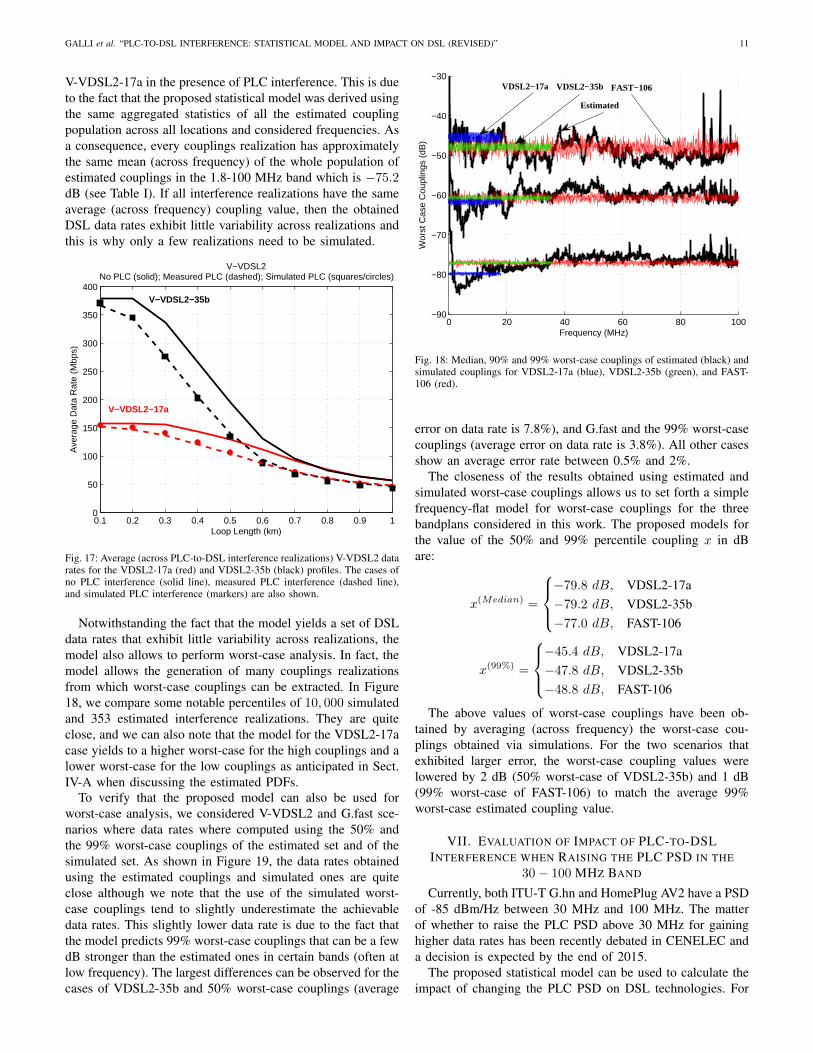
GALLI et al. “PLC-TO-DSL INTERFERENCE: STATISTICAL MODEL AND IMPACT ON DSL (REVISED)” 11
V-VDSL2-17a in the presence of PLC interference. This is dueto the fact that the proposed statistical model was derived usingthe same aggregated statistics of all the estimated couplingpopulation across all locations and considered frequencies. Asa consequence, every couplings realization has approximatelythe same mean (across frequency) of the whole population ofestimated couplings in the 1.8-100 MHz band which is −75.2dB (see Table I). If all interference realizations have the sameaverage (across frequency) coupling value, then the obtainedDSL data rates exhibit little variability across realizations andthis is why only a few realizations need to be simulated.
0.1 0.2 0.3 0.4 0.5 0.6 0.7 0.8 0.9 10
50
100
150
200
250
300
350
400
Loop Length (km)
Ave
rage
Dat
a R
ate
(Mbp
s)
V−VDSL2No PLC (solid); Measured PLC (dashed); Simulated PLC (squares/circles)
V−VDSL2−17a
V−VDSL2−35b
Fig. 17: Average (across PLC-to-DSL interference realizations) V-VDSL2 datarates for the VDSL2-17a (red) and VDSL2-35b (black) profiles. The cases ofno PLC interference (solid line), measured PLC interference (dashed line),and simulated PLC interference (markers) are also shown.
Notwithstanding the fact that the model yields a set of DSLdata rates that exhibit little variability across realizations, themodel also allows to perform worst-case analysis. In fact, themodel allows the generation of many couplings realizationsfrom which worst-case couplings can be extracted. In Figure18, we compare some notable percentiles of 10, 000 simulatedand 353 estimated interference realizations. They are quiteclose, and we can also note that the model for the VDSL2-17acase yields to a higher worst-case for the high couplings and alower worst-case for the low couplings as anticipated in Sect.IV-A when discussing the estimated PDFs.
To verify that the proposed model can also be used forworst-case analysis, we considered V-VDSL2 and G.fast sce-narios where data rates where computed using the 50% andthe 99% worst-case couplings of the estimated set and of thesimulated set. As shown in Figure 19, the data rates obtainedusing the estimated couplings and simulated ones are quiteclose although we note that the use of the simulated worst-case couplings tend to slightly underestimate the achievabledata rates. This slightly lower data rate is due to the fact thatthe model predicts 99% worst-case couplings that can be a fewdB stronger than the estimated ones in certain bands (often atlow frequency). The largest differences can be observed for thecases of VDSL2-35b and 50% worst-case couplings (average
0 20 40 60 80 100−90
−80
−70
−60
−50
−40
−30
Frequency (MHz)
Wor
st C
ase
Cou
plin
gs (
dB)
VDSL2−17a VDSL2−35b FAST−106
Estimated
Fig. 18: Median, 90% and 99% worst-case couplings of estimated (black) andsimulated couplings for VDSL2-17a (blue), VDSL2-35b (green), and FAST-106 (red).
error on data rate is 7.8%), and G.fast and the 99% worst-casecouplings (average error on data rate is 3.8%). All other casesshow an average error rate between 0.5% and 2%.
The closeness of the results obtained using estimated andsimulated worst-case couplings allows us to set forth a simplefrequency-flat model for worst-case couplings for the threebandplans considered in this work. The proposed models forthe value of the 50% and 99% percentile coupling x in dBare:
x(Median) =
−79.8 dB, VDSL2-17a−79.2 dB, VDSL2-35b−77.0 dB, FAST-106
x(99%) =
−45.4 dB, VDSL2-17a−47.8 dB, VDSL2-35b−48.8 dB, FAST-106
The above values of worst-case couplings have been ob-tained by averaging (across frequency) the worst-case cou-plings obtained via simulations. For the two scenarios thatexhibited larger error, the worst-case coupling values werelowered by 2 dB (50% worst-case of VDSL2-35b) and 1 dB(99% worst-case of FAST-106) to match the average 99%worst-case estimated coupling value.
VII. EVALUATION OF IMPACT OF PLC-TO-DSLINTERFERENCE WHEN RAISING THE PLC PSD IN THE
30− 100 MHZ BAND
Currently, both ITU-T G.hn and HomePlug AV2 have a PSDof -85 dBm/Hz between 30 MHz and 100 MHz. The matterof whether to raise the PLC PSD above 30 MHz for gaininghigher data rates has been recently debated in CENELEC anda decision is expected by the end of 2015.
The proposed statistical model can be used to calculate theimpact of changing the PLC PSD on DSL technologies. For

12 SUBMITTED TO IEEE JSAC SPECIAL ISSUE – 15 JULY 2015/REVISED 4 DECEMBER 2015
0.1 0.2 0.3 0.4 0.5 0.6 0.7 0.8 0.9 10
50
100
150
200
250
300
350
400
V−VDSL2−17a (RED), V−VDSL2−35b (BLK)50% & 99% worst−case couplings: measured (solid), simulated (markers)
Loop Length (km)
Dat
a R
ate
(Mbp
s)
(a)
1 2 3 4 5 6 7 8 9 10400
500
600
700
800
900
1000
1100
1200
Loop Length (km)
Dat
a R
ate
(Mbp
s)
FAST−10650% & 99% worst−case couplings: measured (solid), simulated (markers)
(b)
Fig. 19: Data rates achieved when using the 50% and 99% worst-caseestimated couplings (solid) and simulated couplings (markers): (a) V-VDSL2;(b) G.fast.
example, we evaluated such impact for the case of FAST-106and FAST-212. Simulations in this Section are for a 100m looplength with measured loop response as in Sect. VI-A3.
Figure 20 shows that an increase of 10 dB in the PLC PSDabove 30 MHz would cause an average data rate decreaseof about 3%-5% for FAST-106 and 2%-3% for FAST-212.Solid/dashed lines report results where estimated couplingswere used, while results based on simulated couplings areshown with square/circle markers. The data rates obtainedusing simulated couplings yield results with an average error of0.4% and 1.2% compared to the ones obtained using estimatedcouplings for the FAST-106 case with standard PLC PSD andraised PLC PSD, respectively.
Although the average degradation is small, the 99% worst-case degradation is considerable and consistent with the results
1 2 3 4 5 6 7 8 9 10400
500
600
700
800
900
1000
1100
G.fast Line
Dat
a R
ate
(Mbp
s)
FAST−106 (average)
FAST−106 (99%)
(a)
1 2 3 4 5 6 7 8 9 10600
800
1000
1200
1400
1600
1800
G.fast Line
Dat
a R
ate
(Mbp
s)
FAST−212 (average)
FAST−212 (99%)
(b)
Fig. 20: Average (across PLC-to-DSL estimated interference realizations) and99% worst-case data rate achieved by (a) FAST-106 and (b) FAST-212 whenthe PLC PSD above 30 MHz is either -85 dBm/Hz (blue) or -75 dBm/Hz(red). The case when no PLC interference is present is also plotted (black).Circle markers show results using simulated couplings – only for FAST-106,average case.
in Figure 16. An increase of 10 dB in the PLC PSD above 30MHz causes the 99% wort case to diminish of around 100-130Mbps for FAST-106 and 100-180 Mbps for FAST-212.
VIII. CONCLUSIONS
In this work the first statistical model for PLC-to-DSLinterference has been proposed. The model has been derivedon the basis of PLC-to-DSL couplings estimated from a large-scale measurement campaign of PLC-to-DSL interference.The proposed model is based on a mixture of two truncatedGaussian distributions, it exhibits a good fit to the measureddata both in the PDF body and the tail, and is also physicallyreasonable. The model allows accurate calculation of the

GALLI et al. “PLC-TO-DSL INTERFERENCE: STATISTICAL MODEL AND IMPACT ON DSL (REVISED)” 13
average data rate in the presence of PLC interference, as wellas accurate worst-case analysis based on worst-case couplings.A simple yet accurate frequency-flat model for the medianand 99% worst-case couplings has also been proposed andvalidated. The results presented here have been derived usingmeasurements made in France and their applicability to othercountries should be further validated, especially for thosecountries that have different wiring practices and regulations.
The impact of PLC interference on various DSL technolo-gies has also been assessed using both estimated and simulatedcouplings. The impact on DSL is smaller on shorter loops,grows quickly as loop length increases, and decreases againbeyond loop lengths around 500-600 meters. It has beenascertained that impact depends also on whether Vectoring isused or not, i.e. whether crosstalk is present or not. In fact,the use of Vectoring greatly increases the sensitivity of DSLtechnologies to PLC interference, as Vectoring removes thetime-invariant “blanket” of crosstalk and leaves DSL exposedto PLC interference as well as to any other alien noise. Averageimpact is small but can become substantial when high valuesof couplings occur. The average impact of PLC interferenceon non-Vectored VDSL2 is small because of the presence ofcrosstalk, but V-VDSL2 and G.fast are much more sensitiveto PLC interference due to the use of Vectoring.
ACKNOWLEDGMENT
The Authors express their warmest gratitude to Dr. AhmedZeddam of Orange Labs for providing the initial set datagathered in the Orange measurement campaign.
REFERENCES
[1] S. Gorshe, A. Raghavan, T. Starr, and S. Galli, Broadband Access:Wireline and Wireless - Alternatives for Internet Services. New York,NY: John Wiley & Sons, 2014.
[2] T. Starr, J. Cioffi, and P. Silverman, Understanding Digital SubscriberLine Technology. Prentice–Hall, 1999.
[3] The Broadband Forum (BBF), Press Release. (2013, April 16)“FTTx Supercharges Broadband Deployment”. [Online]. Avail-able: https://www.broadband-forum.org/news/download/pressreleeases/2013/BBF FTTx13.pdf
[4] Very High Speed Digital Subscriber Line Transceivers 2, ITU-T Std.Rec. G.993.2, 2015.
[5] Very High Speed Digital Subscriber Line Transceivers 2 – Amendment1, ITU-T Std. Rec. G.993.2, 2015.
[6] Self-FEXT Cancellation (Vectoring) for Use with VDSL2 Transceivers,ITU-T Std. Rec. G.993.5, 2010.
[7] V. Oksman, H. Schenk, A. Clausen, J. Cioffi, M. Mohseni, G. Ginis,C. Nuzman, J. Maes, M. Peeters, K. Fisher, and P. Eriksson, “The ITU-T’s new G.vector standard proliferates 100 Mb/s DSL,” IEEE Commun.Mag., vol. 48, no. 10, pp. 140–148, Oct. 2010.
[8] Fast Access to Subscriber Terminals (G.fast) - Physical layer specifica-tion, ITU-T Std. Rec. G.9701, 2014.
[9] M. Timmers, M. Guenach, C. Nuzman, and J. Maes, “G.fast: evolvingthe copper access network,” IEEE Commun. Mag., vol. 51, no. 8, pp.74–79, Aug. 2013.
[10] E. Biglieri, S. Galli, Y.-W. Lee, H. Poor, and H. Vinck, “PowerLine Communications (Guest Editorial),” IEEE J. Sel. Areas Commun.,vol. 24, no. 7, pp. 1261–1266, Jul. 2006.
[11] H. Ferreira, L. Lampe, J. Newbury, and T. Swart, Eds., Power LineCommunications, 1st ed. New York, NY: John Wiley & Sons, 2010.
[12] L. Berger, A. Schwager, P. Pagani, and D. Schneider, Eds., MIMO PowerLine Communications: Narrow and Broadband Standards, EMC, andAdvanced Processing. New York: Taylor & Francis Group, 2014.
[13] S. Galli, A. Scaglione, and Z. Wang, “For the Grid and Through theGrid: The Role of Power Line Communications in the Smart Grid,”Proc. IEEE, vol. 99, no. 6, pp. 998–1027, Jun. 2011.
[14] S. Galli and O. Logvinov, “Recent developments in the standardizationof power line communications within the IEEE,” IEEE Commun. Mag.,vol. 46, no. 7, pp. 64–71, Jul. 2008.
[15] V. Oksman and S. Galli, “G.hn: The new ITU-T home networkingstandard,” IEEE Commun. Mag., vol. 47, no. 10, Oct. 2009.
[16] L. Yonge et al., “An overview of the HomePlug AV2 technology,” J. ofElectrical and Computer Engineering, vol. Article ID 892628, 2013.
[17] Unified high-speed wireline-based home networking transceivers - Mul-tiple input/multiple output specification, ITU-T Rec. G.9963, Dec. 2011.
[18] N. Golmie, N. Chevrollier, and O. Rebala, “Bluetooth and WLAN Co-existence: Challenges and Solutions,” IEEE Wireless Commun., vol. 10,no. 6, pp. 22–29, Jun. 2003.
[19] S. Galli, D. Famolari, and T. Kodama, “Bluetooth: Channel codingconsiderations,” in IEEE Veh. Techn. Conf. (VTC), vol. 5, May 17–19,2004, pp. 2605–2609.
[20] S. Galli, A. Kurobe, and M. Ohura, “The Inter-PHY Protocol (IPP):A Simple Co-Existence Protocol,” in IEEE Intl. Symp. on Power LineCommun. and Its Appl. (ISPLC), Dresden, Germany, Mar. 29 – Apr. 1,2009.
[21] “Compatibility of VDSL & PLT with radio services in the range 1.6MHz to 30 MHz - final report of the Technical Working Group,” Ofcom,TWG(07)09rev4, Oct. 2002.
[22] “Powerline Telecommunications (PLT); Study on signal processingimproving the coexistence of VDSL2 and PLT,” ETSI, TR 102 930V1.1.1, Sep. 2010. [Online]. Available: http://www.etsi.org/deliver/etsitr/102900 102999/102930/01.01.01 60/tr 102930v010101p.pdf
[23] F. Moulin, P. Peron, and A. Zeddam, “PLC and VDSL2 coexistence -An Experimental Study,” in IEEE Intl. Symp. on Power Line Commun.and Its Appl. (ISPLC), Rio de Janeiro, Brazil, Mar. 28–31, 2010.
[24] B. Praho, M. Tlich, F. Moulin, A. Zeddam, and F. Nouvel, “PLCcoupling effect on VDSL2,” in IEEE Intl. Symp. on Power Line Commun.and Its Appl. (ISPLC), Udine, Italy, Apr. 3–6, 2011.
[25] J. Maes, M. Timmers, and M. Guenach, “Spectral compatibility of in-home and access technologies,” in IEEE Intl. Symp. on Power LineCommun. and Its Appl. (ISPLC), Udine, Italy, Apr. 3–6, 2011.
[26] K. Ali, G. Messier, and S. Lai, “DSL and PLC co-existence: Aninterference cancellation approach,” IEEE Trans. Commun., vol. 62,no. 9, pp. 3336–3350, Sep. 2014.
[27] S. Galli and K. J. Kerpez, “Methods of summing crosstalk from mixedsources – Part I: Theoretical analysis,” IEEE Trans. Commun., vol. 50,no. 3, pp. 453–461, Mar. 2002.
[28] S. Galli, K. Kerpez, H. Mariotte, and F. Moulin, “A first statistical modelof PLC interference on twisted pairs,” ITU-T SG15/Q4, Geneva, CH,Contribution 2014-03-Q4-PLC into DSL Model ASSIA Orange, Mar.3, 2014.
[29] K. Kerpez, S. Galli, H. Mariotte, and F. Moulin, “The impact of PLC-to-DSL interference on VDSL2, Vectored VDSL2, and G.fast,” in IEEEIntl. Symp. on Power Line Commun. and Its Appl. (ISPLC), Austin, TX,Mar. 29 – Apr. 1, 2015.
[30] S. Galli, K. Kerpez, H. Mariotte, and F. Moulin, “Statistical modeling ofPLC-to-DSL interference,” in IEEE Intl. Symp. on Power Line Commun.and Its Appl. (ISPLC), Austin, TX, Mar. 29 – Apr. 1, 2015.
[31] F. Harris, “On the Use of Windows for Harmonic Analysis with theDiscrete Fourier Transform,” Proc. IEEE, vol. 66, no. 1, pp. 51–83, Jan.1978.
[32] F. Canete, J. Cortes, L. Dıez, and J. Entrambasaguas, “Analysis of thecyclic short-term variation of indoor power line channels,” IEEE J. Sel.Areas Commun., vol. 24, no. 7, pp. 1327– 1338, Jul. 2006.
[33] S. Galli, “A simple two-tap statistical model for the power line channel,”in IEEE Intl. Symp. on Power Line Commun. and Its Appl. (ISPLC), Riode Janeiro, Brazil, Mar. 28–31, 2010.
[34] S. Galli and A. Scaglione, “Discrete-time block models for transmissionline channels: Static and doubly selective cases,” 2011. [Online].Available: http://arxiv.org/abs/1109.5382
[35] F. Gianaroli, F. Pancaldi, and G. Vitetta, “On the use of Zadeh’s seriesexpansion for modeling and estimation of indoor powerline channels,”IEEE Trans. Commun., vol. 62, no. 7, pp. 2558–2568, Jul. 2014.
[36] M. Wand and M. Jones, Kernel Smoothing. Chapman & Hall/CRC,1994.
[37] S. Galli, “A simplified model for the indoor power line channel,” in IEEEIntl. Symp. on Power Line Commun. and Its Appl. (ISPLC), Dresden,Germany, Mar. 29 – Apr. 1, 2009.
[38] ——, “A novel approach to the statistical modeling of wireline chan-nels,” IEEE Trans. Commun., vol. 59, no. 5, pp. 1332–1345, May 2011.
[39] C. Chatfield, Problem Solving: A Statisticians Guide, 2nd ed. NewYork: Taylor & Francis, 1995.

14 SUBMITTED TO IEEE JSAC SPECIAL ISSUE – 15 JULY 2015/REVISED 4 DECEMBER 2015
[40] D. Bates and D. Watts, Nonlinear Regression and Its Applications. NewYork: John Wiley & Sons, Inc., 1988.
[41] E. Kaplan and P. Meier, “Non-parametric estimation from incompleteobservations,” Journal of the American Statistical Association, vol. 53,no. 282, pp. 457–481, Jun. 1958.
[42] American National Standard for Telecommunications - Spectrum Man-agement for Loop Transmission Systems - Issue 2, ANSI Std. T1.417,2003.
[43] Techniques to Mitigate Uncancelled Crosstalk on Vectored VDSL2 Lines,
Broadband Forum (BBF), Std. TR-320, 2014.[44] British Telecom, “G.fast: Release of BT cable measurements for use in
simulations,” ITU-T SG15/Q4, Chengdu, China, Contribution 2012-11-4A-034, Nov. 5–9, 2012.
[45] G. Ginis and J. M. Cioffi, “A multi-user precoding scheme achievingcrosstalk cancellation with application to DSL systems,” in IEEE Asilo-mar Conference on Signals, Systems & Computers, Oct. 29– Nov. 1,2000.