plug-in hybrids: an environmental and economic performance ... · quantifying the fuel savings of a...
TRANSCRIPT

PLUG-IN HYBRIDS: AN ENVIRONMENTAL AND ECONOMIC
PERFORMANCE OUTLOOK
James Kliesch and Therese Langer
September 2006
Report Number T061
©American Council for an Energy-Efficient Economy 1001 Connecticut Avenue, NW, Suite 801, Washington, D.C. 20036
202-429-8873 phone, 202-429-2248 fax, www.aceee.org

Plug-In Hybrids, ACEEE
Contents Acknowledgments........................................................................................................................... ii Executive Summary ....................................................................................................................... iii Introduction..................................................................................................................................... 1 Plug-Ins Today................................................................................................................................ 1 Batteries .......................................................................................................................................... 2 Fuel Savings.................................................................................................................................... 4 Emissions ........................................................................................................................................ 5 Economics....................................................................................................................................... 9 Conclusions................................................................................................................................... 11 References..................................................................................................................................... 13 Appendix....................................................................................................................................... 15
List of Tables
Table 1. Battery Size Requirements and Costs for Hybrid and Plug-Ins Using NiMH Batteries .. 3 Table 2. Relationship Between Electric-Only Range and Gasoline Savings for an Average
Driver........................................................................................................................................ 5 Table 3. Annual CO2, NOx, and SOx Emissions for a Plug-In Running 100% Electric, by
Generation Mix, 2005............................................................................................................... 6 Table 4. Annual CO2, NOx, and SOx Emissions for Conventional (Non-Hybrid) and Hybrid
Vehicles .................................................................................................................................... 7 Table 5. Emissions of a Plug-In with 40-Mile Range Relative to a Hybrid, Various 2005
Generation Mixes...................................................................................................................... 7 Table 6. DOE Projections of Change in Per-kWh Emissions from Electricity Generation, 2005 to
2020 .......................................................................................................................................... 8 Table 7. Emissions of a Plug-In with 40-Mile Range Relative to a Hybrid, Three 2020
Generation Mixes...................................................................................................................... 8 Table 8. Cost-Effectiveness of a Hybrid and a 40-Mile-Range Plug-In Relative to a 30-Mile-
per-Gallon Conventional Vehicle ........................................................................................... 10 Table A1. Projected Annual CO2, NOx, SO2, and Mercury Emissions for a Plug-In Running
100% Electric, by Generation Mix, 2005 to 2030.................................................................. 15
i

Plug-In Hybrids, ACEEE
ACKNOWLEDGMENTS The authors would like to thank the following individuals for sharing their comments, suggestions, and expertise: Steven Nadel and William Prindle at ACEEE; Menahem Anderman at Advanced Automotive Batteries; Roger Duncan at Austin Energy; John Davi at CalCars; Joseph Romm at the Center for Energy & Climate Solutions; Robert Graham and Mark Duval at the Electric Power Research Institute; Luke Tonachel at the Natural Resources Defense Council; and David Ganss, Simon Mui, and Michael Shelby at the U.S. Environmental Protection Agency (EPA). Thanks also to Dan Becker of the Sierra Club for asking the questions that launched this work. Any remaining errors, however, as well as the opinions expressed in this report, are the sole responsibility of the authors.
ii

Plug-In Hybrids, ACEEE
EXECUTIVE SUMMARY Plug-in hybrid-electric vehicles (“plug-ins”) could offer a number of important advantages over the cleanest of today’s passenger vehicles. Their ability to run on electricity from the grid will reduce both their fuel consumption and their emissions of various pollutants relative to current vehicles, including non-plug-in hybrid-electric vehicles (“hybrids”). Consumption- and emissions-related benefits of plug-ins will vary substantially, however, depending upon the fuel mix from which the electricity is generated and the vehicle’s “electric-only range,” operational logic, and drive cycle characteristics. Quantifying the fuel savings of a plug-in requires proper characterization of plug-in design. Performance and cost requirements will likely dictate that the internal combustion engine engage regularly in a plug-in, even during trips far shorter than the nominal electric-only range of the vehicle. Assuming average driving patterns, a plug-in with an electric-only range of 20 miles could be expected to reduce fuel use by about one-third relative to a current hybrid. These potential savings are highly significant, but are less than the savings commonly proffered for plug-ins in the popular media. A plug-in with a 60-mile range could cut gasoline consumption by about two-thirds, though battery cost would be nearly three times that of the 20-mile plug-in. With regard to greenhouse gas emissions, the advantage of plug-ins over hybrids is large in areas where electricity is generated with low-carbon fuels, and much more modest elsewhere. In California, where electricity is comparatively low-carbon, a plug-in with a 40-mile range could cut carbon dioxide (CO2) emissions about one-third relative to a hybrid; in regions with coal-heavy electricity generation, the plug-in would not reduce CO2 emissions at all. Under the average U.S. power generation mix, the CO2 reduction of the plug-in relative to a hybrid would be about 15%. In most locations, achieving a major CO2 advantage from plug-ins will require greatly reducing power sector carbon emissions. From a public health perspective, the benefits of plug-ins are again highly dependent upon electricity generation mix. Charging on the grid today, a plug-in would emit 5% to 40% less oxides of nitrogen (NOx) than a hybrid, depending on geographic region. Emissions of oxides of sulfur (SOx) associated with a plug-in would be much higher than for a hybrid, except in areas with the cleanest generation mixes. Power plant emissions of mercury also continue to be a concern. According to federal agency projections, however, full implementation of the Clean Air Interstate and Clean Air Mercury Rules will greatly reduce power plants’ emissions of all three pollutants by 2020. Battery cost is a major hurdle to the commercialization of plug-ins with extensive electric-only range. The cost of a plug-in battery exceeds $10,000 today but could drop to a few thousand dollars in the long term. Such a cost reduction may be achievable largely through economies of scale in the case of nickel-metal hydride batteries, though issues of performance, size and weight remain. Smaller, lighter lithium-ion batteries are considered more promising for plug-ins, but these batteries will still require major advances in durability and cost before they are ready for this application.
iii

Plug-In Hybrids, ACEEE
Assuming that current low-end battery cost projections can be met in the future, a plug-in should be able to recover its incremental cost through fuel savings in well under the life of the vehicle. Plug-ins with more than modest electric-only range will have difficulty passing the often-cited “three-year payback” test, however, even under such a favorable battery cost scenario and with $3 per gallon gasoline. A further increase in fuel prices or a shift in consumer priorities could nonetheless create a sizable market for plug-ins. Emerging electric-drive technologies should not be allowed to fall prey to the cart-before-the-horse phenomenon that has proven counterproductive to new technologies in the past. Overselling plug-ins to policymakers or to the general public today is likely to result in disenchantment and a corresponding loss of support before the technology has even had a chance to reach the market. Plug-ins are likely to emerge through gradual increases in the electric-only range of hybrids and can therefore be regarded as one of several elements in the evolution of the hybrid, albeit one with enormous potential to lessen the vehicles’ environmental impact. Work to lower battery costs and resolve other issues central to plug-in development should proceed vigorously, but this work must not divert attention from readily available measures to lessen the oil dependence and greenhouse gas emissions of the transportation sector. Indeed, a major and sustained commitment to improving average fuel economy would be among the most effective steps toward accelerating the arrival of plug-ins.
iv

Plug-In Hybrids, ACEEE
INTRODUCTION A technology generating much interest today is the plug-in hybrid-electric vehicle (“plug-in”), a variant of current hybrids that uses on-board batteries to provide substantial pure-electric, zero-emission driving. Plug-ins are touted by energy security and environmental advocates alike as a promising approach to reducing U.S. oil dependence and the environmental impacts of motor vehicles. They garnered mention in President Bush’s 2006 State of the Union address, and several bills increasing funding for the technology have been introduced in Congress. The appeal of plug-ins is their ability to operate as electric vehicles for much of their daily driving (commuting to/from work, local trips, etc.) and yet still offer the longer range of a conventional vehicle when necessary. Design distances for pure-electric operation of plug-ins range from 10 to 60 miles, a property determined largely by the size of the battery pack, though also affected by factors such as the power capability of the electric motor. Batteries of smaller plug-in vehicles could be recharged in standard 120-volt AC power outlets, enabling easy overnight recharging. Larger plug-ins, as well as models providing long electric-only ranges (e.g., 60 miles), would likely require larger, 240-volt AC power supplies (EPRI 2001). This report investigates how a plug-in’s performance would be likely to compare in the near term with that of a non-plug-in hybrid (henceforth “hybrid”) with respect to crucial performance criteria for a new vehicle technology entering the market. A comparison with today’s average vehicle, rather than a hybrid, would of course give a much larger advantage to the plug-in; our comparison with a hybrid is intended to highlight what the plug-in has to offer beyond the capabilities of the most environmentally friendly vehicles on the road today. The purpose of the report is to sketch the characteristics of plug-ins in the near term, so as to highlight and quantify the milestones to making this a technology that could live up to the high expectations that have been set for it. PLUG-INS TODAY Plug-ins are under development in a variety of settings. For a number of years, the Electric Power Research Institute (EPRI) has partnered with universities, auto manufacturers, national laboratories, and other research institutes to investigate the viability of this technology. Recently, EPRI and DaimlerChrysler partnered to develop and build five plug-in hybrid Sprinter vans capable of providing 20 to 30 miles of electric-only range. These vehicles, which have been built with both gasoline and diesel engines, began testing in the United States in the fall of 2005. Other car manufacturers have expressed a cautious interest in developing the technology of late (see, for example, Hyde 2006). Smaller research outfits are also investigating plug-ins. Plug-ins need enough battery power to provide a substantial range of electric-only driving, and this capability requires batteries that are quite expensive today. One nonprofit group developing a plug-in hybrid conversion for the Toyota Prius estimates its kit, which includes eighteen lithium-ion batteries, to cost $15,000 (Kher 2005). The group hopes in time to reduce the incremental cost to $10,000, but this would still limit the technology to niche applications. Others working on plug-ins believe that, with mass production, the premium could drop to between $3,000 and $6,000 (EPRI 2004; Molloy 2005).
1
Plug-In Hybrids, ACEEE
BATTERIES The viability of plug-ins will hinge in large part upon the performance and cost of their battery packs. Research efforts to improve battery performance (e.g., specific energy, specific power, and longevity) have yielded some notable advances over the past few years. In particular, nickel-metal hydride battery durability has improved substantially, suggesting that a battery pack lasting the life of the vehicle may be within reach. On the other hand, durability improvements demonstrated in practice have largely been in power-assist applications such as hybrids, which differ substantially from plug-in applications that utilize a broader state of charge (SOC) operational window. Cost continues to be a challenge for all battery types and especially for those used to provide electric-only functionality in vehicles. The importance of the various battery properties differs among plug-ins, hybrids, and EVs (battery-electric vehicles). EVs require batteries capable of providing constant energy output for an extended period of time, running from a full state of charge to relatively deep levels of discharge. Hybrids require batteries that can provide short bursts of boost power while maintaining a nearly constant state of charge in order to ensure battery longevity. A battery that can provide the high-power boost duty of hybrids, yet also be capable of handling the full-charge-to-deep-discharge duty cycle of EVs, is the goal for plug-in applications. Challenges persist in developing batteries capable of meeting these requirements while achieving adequate lifetimes (Anderman 2006a). At this time, the two types of battery chemistries showing the greatest potential in electric-drive applications are nickel-metal hydride (NiMH) and lithium-ion (Li-ion) batteries. Nickel-metal hydride batteries are used in all of today’s hybrids and a number of recent EV models. Emerging markets for hybrids have spurred improvements in NiMH battery properties, including increased specific power and better high temperature operation. Li-ion batteries are a much newer design still seeing major advances. They offer power and energy densities higher than those of NiMH, which lead to physical advantages: for a given amount of energy storage, Li-ion batteries can take up one-quarter the size of NiMH batteries and weigh approximately half as much. These attributes make them appealing for electric drive vehicle use, but the durability, cost, and safety of Li-ion batteries need substantial improvement (Anderman 2006b). Battery lifetimes can be extended by increasing size; for a given application, a larger battery will require a lesser percent discharge than will a smaller battery, and consequently will have a longer life. However, the use of larger batteries would of course increase cost, size, and weight. Li-ion batteries suitable for plug-in use are unlikely to make their first commercial appearance in vehicles for several more years. The selection and incorporation of batteries in a plug-in design is a balancing act in meeting operational needs, size constraints, and cost requirements of the vehicle. For example, a plug-in with a 20-mile range may well require a battery pack sized in the neighborhood of 8 kWh. If a NiMH battery is chosen, this will add more than 250 pounds to the weight of the vehicle1 and take up roughly 4 cubic feet of space (Anderman 2006a). This is approximately 25% of typical cargo space; decline in cargo space (model year 2006 midsize sedans ranged from 14–17 cubic
1 Assuming a specific energy of 70 Wh/kg, the approximate level of NiMH batteries (Anderman 2003).
2

Plug-In Hybrids, ACEEE
feet of space), which could lessen appeal to consumers. Furthermore, the increased weight will adversely affect both fuel economy and performance. The use of Li-ion batteries could ease weight and cargo space challenges, assuming the above-mentioned issues can be resolved. Battery capacities in electric-drive vehicles vary dramatically. A typical hybrid battery pack contains 1–2 kWh of energy, while a pure EV is closer to 30 kWh. Plug-in battery requirements depend on the range of the vehicle, with low-end estimates of 6–8 kWh for those with an electric-only range of 20 miles and 18–21 kWh for a 60-mile range.2 As shown in Table 1, the battery capacity will have a large impact on vehicle cost. Battery costs are dependent upon a range of parameters, including type, materials, design, and production volume. NiMH battery modules used in today’s full hybrids are believed to cost around $2,000/kWh at present, with a high-volume lower bound of around $400 per kWh (Markel and Simpson 2006; EPRI 2004). Battery designs with lower power-to-total-energy ratios (kW/kWh) are a configuration more appropriate for plug-in hybrid use; their near-term costs (again, NiMH) range from approximately $1,400 to $1,600 per kWh. Experts believe that costs could fall below $300/kWh, but not without volumes in the hundreds of thousands and production relocation to China or similar foreign markets. Furthermore, achieving the long-term costs of NiMH batteries shown in Table 1 depends upon a major reduction in the cost of nickel. There has in fact been a substantial increase in the price of nickel over the past few years. Table 1. Battery Size Requirements and Costs for Hybrid and Plug-Ins Using NiMH Batteries
Vehicle Design (Midsize Car)
Approximate Size
(kWh)3
Approx. Near-Term Cost
($ per kWh)
Approx. Long-Term Cost4 ($ per kWh)
Near-Term, per Vehicle
($)
Long-Term, per Vehicle
($) Hybrid 1–2 2,000 400 2,000–4,000 400–800 Plug-in, 20-mile range 6–8 1,600 320 9,600–12,800 1,920–2,560 Plug-in, 60-mile range 18–21 1,400 270 25,200–29,400 4,860–5,670 Source: Data for this table are compiled from EPRI (2004), with the exception of approximate near-term costs (Markel and Simpson 2006) and approximate size for a hybrid vehicle (based on current hybrid specifications). Lithium-ion batteries are currently more expensive than NiMH batteries. Economies of scale will help improve the cost of Li-ion, though it is not believed they will achieve significantly lower prices than NiMH without major manufacturing and/or materials breakthroughs (Anderman 2003, 2006a).
2 There is a notable lack of consensus among battery and electric vehicle experts about battery requirements. One prominent battery specialist believes that plug-in battery capacities would likely be higher than shown in Table 1 to ensure battery longevity: 10–15 kWh for a plug-in with a 20-mile range, and 25–30 kWh for a 60-mile plug-in (Anderman 2006a). 3 See footnote 2 above. 4 Long term is defined as a period in which volume is in the hundreds of thousands of units per year. These costs also assume a reduction in the cost of nickel.
3

Plug-In Hybrids, ACEEE
FUEL SAVINGS The most clear-cut benefit of plug-ins is their ability to reduce petroleum consumption by providing electric-only operation for a substantial fraction of daily driving. Battery cost and performance constraints have focused current test plug-ins toward all-electric ranges of 20–30 miles (Graham 2005). Household vehicles in the U.S. travel about 32 miles per day on average (Davis and Diegel 2006), and a large fraction of daily trips would fall within the range of these first-generation plug-ins. A more detailed characterization of driving patterns is needed to determine the percent of total miles that could be driven on electricity, however; in particular deviation from that average daily distance is an important factor. Data from the federal government’s 2001 National Household Travel Survey (NHTS) (DOT 2004) can be used to estimate the fraction of miles that the average driver could travel on electricity in a plug-in of a given range. If a plug-in operates solely on electricity until reaching its range and is charged once per day, then the distance traveled on gasoline (or diesel) on a given day would be the excess of miles traveled over the range. Under these assumptions, the distribution of daily travel distances found by the NHTS implies that the approximate percent electric-only driving as a function of vehicle range is as shown in Table 2 (second column).5 For example, a plug-in sized for 30 miles of all-electric range could be expected to drive 50% of its miles on electricity on average. The figures in Table 2 also represent the percent gasoline savings that a plug-in would achieve relative to a comparable hybrid under the previously stated assumptions regarding charging frequency and all-electric driving. As one would expect, the percent savings per mile of range declines with increasing range. A key point that is often overlooked, however, is that battery cost and performance requirements make it unlikely that a plug-in will be designed to run continuously in electric mode over its full range. Although this “electric-then-gasoline” depiction is helpful in conceptualizing their operation, plug-ins under development today are designed to engage the internal combustion engine whenever necessary to meet performance requirements; trips within the vehicle’s electric-only range will use some fuel in common driving conditions (Markel and Simpson 2006). EDrive’s Prius+ modification of the Toyota Prius, for example, engages the gasoline engine when its speed reaches 35 mph or when the driver accelerates aggressively (EDrive 2006). According to the EPA, 57% of the miles driven by automobiles are driven under “highway” driving conditions (EPA 2006), the remainder being “city” miles, where “highway” and “city” driving are approximated by two EPA drive cycles. Speed over the highway cycle barely dips below 40 miles per hour. Therefore, if the internal combustion engine of a plug-in takes over at 35 miles per hour, one would expect that fewer than half of the miles traveled would use electric-only drive, regardless of how far the battery has been depleted. Factoring this consideration into the above approach for estimating percent electric-only driving yields the third column of Table
5 This method of calculating percent electric-only driving is essentially the same as the “all-electric usage estimation” used in EPRI (2001) and related to (though different from) the approach of the Society of Automotive Engineers test SAE J1711 (SAE 1999). These two sources predate the release of the 2001 NHTS data, however, and instead use 1995 NPTS data.
4
Plug-In Hybrids, ACEEE
2. For a given range, the percentage fuel savings shown in the third column is calculated as one-half of the trip-miles that fall within twice the all-electric range.6 Table 2. Relationship Between Electric-Only Range and Gasoline Savings for an Average Driver
Electric-Only Range (miles)
Gasoline Savings Assuming All-Electric within Range
Gasoline Savings Assuming 50% Electric Over 2X Range
10 21% 19% 20 37% 30% 30 50% 36% 40 60% 40% 50 67% 42% 60 72% 44%
Source: ACEEE based on 2001 NHTSA data, as tabulated by ORNL (2006) In fact, optimizing plug-in operation will call for a vehicle logic more subtle than either of the two represented in Table 2. Future plug-ins will operate not only in all-electric and hybrid modes, but also in “battery-dominant” modes in which the gasoline engine serves to boost power.7 This will reduce battery power requirements and therefore cost. Gasoline savings from this more complex logic would fall between the figures in the second and third columns on Table 2. In light of the above discussion, it is assumed in the sections below that a plug-in with a 40-mile electric-only range will achieve a 50% gasoline savings relative to a comparable hybrid. Driving patterns vary widely, and percent fuel savings for some drivers could far exceed those shown in Table 2. The averages cited here are nonetheless relevant for estimating the contribution that a wholesale switch to plug-ins could make to reducing U.S. dependence on oil. Fueling plug-ins with E85 (85% ethanol) could further reduce gasoline usage. The same could be said for conventional vehicles; but given the constraints on the volume of ethanol that could plausibly be produced in the U.S., a more efficient vehicle fleet will be a prerequisite for meeting a large fraction of fuel demand with ethanol. EMISSIONS The environmental appeal of an advanced vehicle technology depends not only on the fuel savings it offers, but on its effect on emissions of greenhouse gases and other pollutants as well. Operating in electric-only mode, plug-ins have no tailpipe emissions, providing a potential health benefit over hybrids as well as conventional vehicles. As in the case of EVs, indirect emissions of plug-ins while running on electricity are a function of the fuel mix and efficiency of generation, transmission and distribution of the power systems producing that electricity.8
6 That is, the battery lasts for twice the all-electric range, but only powers the vehicle half of the time while it lasts. 7 The Chrysler Sprinter Van plug-in, for example, engages the engine to meet performance and driving conditions, using a “charge depleting strategy” to maximize efficiency and yield a 20% state of charge at the end of the day (Graham 2006). 8 The mixes of fuels used by power plants, and thus their emissions profiles, vary by time of day. Overnight power, for example, is typically generated using base load sources with low marginal costs, such as coal and nuclear power,
5

Plug-In Hybrids, ACEEE
Electricity used to power the vehicle may come from any combination of energy sources, including coal, nuclear, natural gas, oil, or renewable sources such as hydropower or wind. These mixes vary dramatically from region to region. Climate-friendly renewables and nuclear power, for example, together account for 45% of electricity generation in California, while in the coal-heavy East Central Area (including Indiana, Ohio, Kentucky, and West Virginia, and parts of Michigan, Pennsylvania, and Virginia), they account for under 10% combined (EIA 2006a). To explore the implications of these variations for plug-in emissions, suppose that a plug-in has an efficiency of 4 miles per kWh, which is slightly higher than the reported 3.85 mi/kWh (260 Wh/mi) efficiency of the CalCars Prius+ plug-in (Davi 2006).9 Table 3 below shows estimated CO2, NOx, and SOx emissions associated with the plug-in run for one year (12,000 miles) entirely on grid electricity generated in California and in the East Central Area, as well as using a theoretical average fuel mix for the U.S. as a whole.10 The range of emissions for these sample locations varies by a factor of almost 3 for CO2, 5 for NOx, and 19 for SOx. Table 3. Annual CO2, NOx, and SOx Emissions for a Plug-In Running 100% Electric, by Generation Mix, 2005 CO2 (lbs) NOx (lbs) SOx (lbs) U.S. 4,241 6.3 17.4 California 2,172 2.3 1.8 East Central Area 6,154 10.6 33.9 Source: ACEEE based on EIA (2006a) To relate these emissions levels to emissions from vehicles on the market today, Table 4 shows annual CO2, NOx, and SOx emissions of a clean, fuel-efficient hybrid, as well as two conventional cars meeting commonly occurring tailpipe emission standards.11 Estimates in Table 4 include both in-use and upstream (fuel cycle) emissions and are adjusted upward to reflect real-world pollution levels rather than simple emission standard levels. On the other hand, “up-upstream” emissions for the plug-in, such as those associated with the mining and transport of coal and production of natural gas, are not included in Table 3. These emissions are a much smaller percentage of full fuel-cycle emissions of the pollutants listed for a vehicle operating on electricity than are upstream emissions for a vehicle operating on gasoline (Wang 1999).
while peak load periods (which are themselves affected by geographic region and season) see a broader range of fuels, including natural gas and even oil, put into play to meet peak demand. These issues are not reflected in the discussion below and are beyond the scope of this analysis; a power sector dispatch model could be used to investigate plug-in impacts in greater detail. 9 Recent OEM battery-electrics have had lower efficiencies, but we assume ongoing optimization efforts will lead to somewhat higher efficiencies in the near term. 10 Sulfur dioxide, SO2, comprises 98–99.5% of a power plant’s SOx emissions (EPRI 2005). For ease of comparison, we assume power plant SOx and SO2 emissions to be equivalent throughout the paper. 11 Conventional vehicle listings are assumed to have a combined city/highway fuel economy of 30 miles per gallon and meet one of two common passenger vehicle emissions certifications, Tier 2 bin 5 (average) and Tier 2 bin 8. Assumed emission standard of the hybrid is Tier 2 bin 3, that of the 2006 Toyota Prius. The hybrid is assumed to have a combined city/highway fuel economy of 50 miles per gallon, based upon 160 real-world reports submitted to hybridcars.com by Toyota Prius drivers across the United States (Berman 2005).
6

Plug-In Hybrids, ACEEE
A comparison with Table 3 illustrates that a conventional vehicle emits considerably more CO2 and NOx than a plug-in running on 100% electricity, while relative SOx emissions performance depends upon the electric power fuel mix. When the comparison vehicle is a hybrid, however, the performance of the plug-in with respect to CO2 and NOx emissions also becomes highly dependent upon generation mix. Table 4. Annual CO2, NOx, and SOx Emissions for Conventional (Non-Hybrid) and Hybrid Vehicles CO2 (lbs) NOx (lbs) SOx (lbs) Bin 8 Conv. Vehicle 10,000 20.1 7.0 Bin 5 Conv. Vehicle 10,000 16.5 7.0 Bin 3 Hybrid 6,000 11.8 4.2 Source: In-use and upstream emission factors used in this analysis were taken from the methodology for ACEEE’s Green Book®: The Environmental Guide to Cars and Trucks, Model Year 2006. For more information on methodology, see Kliesch (2004). Given that plug-ins will not run as pure electric vehicles all of the time, the most appropriate comparison to hybrids would be that of plug-ins operating a portion of their time as standard hybrids. As discussed in the Fuel Savings section above, a plug-in with a 40-mile range would be expected to have a breakdown of gasoline- and electricity-fueled miles in the vicinity of 50%–50% for the average driver. Assuming that the plug-in, when operating on gasoline, matches the emissions and fuel economy performance of the hybrid shown in Table 4, the change in emissions of the plug-in from the levels of the hybrid would be as shown in Table 5. Table 5. Emissions of a Plug-In with 40-Mile Range Relative to a Hybrid, Various 2005 Generation Mixes CO2 NOx SOx U.S. -15% -23% 157% California -32% -40% -29% East Central Area 1% -5% 354% Thus, under the U.S. average power generation mix, a plug-in with 40-mile range would offer a 15% reduction of CO2 emissions relative to today’s hybrids. In California, the plug-in would reduce CO2 emissions by one-third relative to a hybrid, while in the East Central Area CO2 emissions would be about the same for the plug-in as for the hybrid. These numbers should not be regarded as conclusive, but rather as first-order estimates. Numerous factors can increase or decrease the pollution estimates, including fuel efficiencies of plug-ins and hybrids, and time of day during recharging. From a public health perspective, emissions of criteria pollutants from power plants are less threatening than emissions from vehicle tailpipes, as the latter are released in much closer proximity to individuals. Thus, the direct health impacts on a per-ton basis of NOx and SOx emissions from power plants will be less than those from vehicle tailpipes. Nonetheless, the role of NOx and SOx as precursors to regional pollution problems such as smog and acid rain means that total emissions of these pollutants are also an important consideration. In addition, mercury emissions from coal-burning power plants continue to pose a serious risk to public health.
7

Plug-In Hybrids, ACEEE
Given that plug-ins are not expected to appear in large numbers for several years, power plant emissions most relevant to the environmental performance of plug-ins will be future levels, not current levels. With the recent adoption of the Clean Air Interstate Rule (CAIR), total U.S. emissions of NOx and SOx are forecast to decline sharply over the next two decades. Mercury emissions should decline under CAIR as well, and the Clean Air Mercury Rule (CAMR) is intended to reduce them further. According to the DOE, average U.S. power plant emissions per kWh will decline by 57% for NOx, 70% for SOx, and 72% for mercury by 2020 (EIA 2006a). Projected reductions in the two electricity market regions discussed above are shown in Table 6; detailed projected reductions from 2005 to 2030 for all electricity market regions are shown in Appendix Table A. It should be noted that both rules establish cap-and-trade schemes rather than limiting per-plant emissions and therefore will not necessarily address local pollution concerns. Furthermore, Clean Air Act implementation has proved contentious and unpredictable over the past fifteen years; in fact both of the rules mentioned here are being challenged in court. Achieving the projected reductions in NOx, SOx, and mercury will require a consistent effort in the years to come. Table 6. DOE Projections of Change in Per-kWh Emissions from Electricity Generation, 2005 to 2020 CO2 NOx SOx Hg U.S. -5% -57% -70% -72% California 30% -4% -17% -25% East Central Area -6% -75% -75% -71% Table 7 translates these projections into a hybrid/plug-in comparison for 2020; note that this comparison assumes, unrealistically, no change in the vehicle technologies, with respect either to fuel economy or to emissions and is meant only to illustrate the effect of the clean-up of the grid on the above comparisons. Table 7. Emissions of a Plug-In with 40-Mile Range Relative to a Hybrid, Three 2020 Generation Mixes CO2 NOx SOx U.S. -16% -39% 12% California -26% -41% -32% East Central Area -2% -39% 50% With regard to greenhouse gases, there is no national program in place that offers the prospect of declining power plant emissions, so the carbon savings associated with plug-ins remain at the 15–16% level in the generally cleaner grid projected for 2020. California recently announced a cap on CO2 emissions,12 and the Northeast has adopted a CO2 trading scheme for the power sector through the Regional Greenhouse Gas Initiative. Other regions may follow, but a meaningful cap on U.S. greenhouse gas emissions cannot be regarded as imminent. Thus, greenhouse gas emissions from the power sector will continue to be a key consideration for 12 This recent commitment is not reflected in the projections of CO2 emissions from California facilities in this report.
8
Plug-In Hybrids, ACEEE
assessing the benefits of plug-ins. Indeed, the promise of plug-ins should serve as an added impetus for the transition to low-carbon power generation. ECONOMICS The viability of plug-ins will depend upon cost as well as performance. As noted previously, plug-ins cost considerably more than either conventional vehicles or hybrids, due largely to high battery costs; but this high incremental cost is offset to some extent by fuel cost savings over the life of the vehicle. The battery cost estimates in Table 1 allow quantification of this tradeoff in various scenarios. With a gasoline price of $3 per gallon, fuel for a 30-mile-per-gallon conventional vehicle driven 12,000 miles (the average annual miles per vehicle in the U.S.) costs $1,200. A hybrid (e.g., a Prius) achieving 50 miles per gallon and driven the same amount uses $720 per year on gasoline, saving $480 per year. If the incremental cost of the hybrid over the comparable conventional vehicle is $3,500, the simple payback period (i.e., without discounting) for the hybrid relative to the conventional vehicle is just over seven years. Now consider a comparable plug-in that achieves an efficiency of 4.0 miles per kWh when operating in electric-only mode. At the average residential retail electricity price of nine cents per kWh,13 the electricity to drive 12,000 miles would cost $270. Suppose now that the plug-in has a range of 40 miles, using gasoline approximately half of the time (cf. Fuel Savings, above), and has the fuel economy of a hybrid while running on gasoline. The annual fuel savings of the plug-in relative to the conventional vehicle would be $495. Interpolating between the 20- and 60-mile plug-in battery cost estimates in Table 1, incremental costs for a 40-mile plug-in today would be close to $20,000, resulting in a payback period far longer than the life of the vehicle (see Table 8). With battery costs at the long-term levels in Table 1, however, the picture is quite different. Assume that, aside from battery cost, incremental costs for both a plug-in and a hybrid relative to a conventional vehicle are $1,500, declining to $1,000 in the long term. The long-term scenario in Table 8, which assumes high-volume battery costs of $400 for the hybrid and $3,500 (interpolated) for a 40-mile plug-in, results in payback periods of 2.9 years for the hybrid and 6.4 years for the plug-in. At a gasoline price of $4 per gallon, these figures decline to 2.5 and 4.6, respectively.14
13 Average 2005 retail price of electricity to ultimate consumers in the U.S. was 9.43 cents per kWh (EIA 2006b). 14 One might also consider halving the price of electricity to reflect the possibility of gaining for plug-ins the off-peak electricity rates now available to some industrial customers; but this does not substantially improve the payback.
9
Plug-In Hybrids, ACEEE
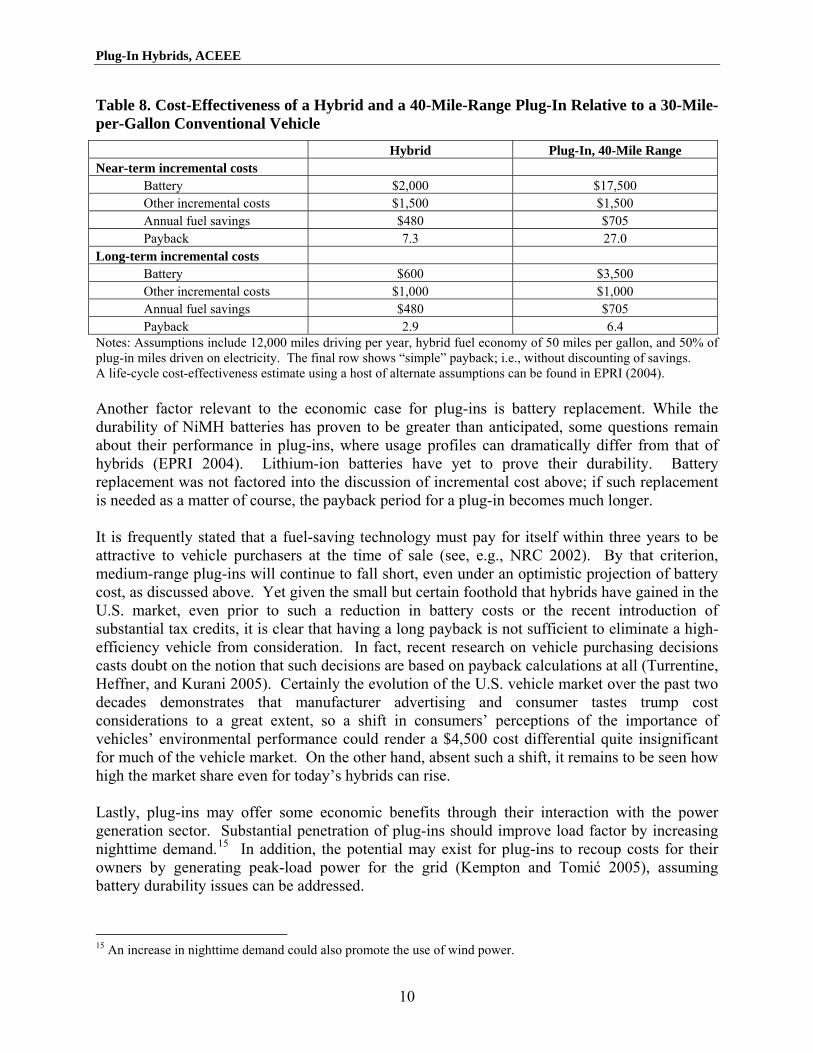
Table 8. Cost-Effectiveness of a Hybrid and a 40-Mile-Range Plug-In Relative to a 30-Mile-per-Gallon Conventional Vehicle Hybrid Plug-In, 40-Mile Range Near-term incremental costs
Battery $2,000 $17,500 Other incremental costs $1,500 $1,500 Annual fuel savings $480 $705 Payback 7.3 27.0
Long-term incremental costs Battery $600 $3,500 Other incremental costs $1,000 $1,000 Annual fuel savings $480 $705 Payback 2.9 6.4
Notes: Assumptions include 12,000 miles driving per year, hybrid fuel economy of 50 miles per gallon, and 50% of plug-in miles driven on electricity. The final row shows “simple” payback; i.e., without discounting of savings. A life-cycle cost-effectiveness estimate using a host of alternate assumptions can be found in EPRI (2004). Another factor relevant to the economic case for plug-ins is battery replacement. While the durability of NiMH batteries has proven to be greater than anticipated, some questions remain about their performance in plug-ins, where usage profiles can dramatically differ from that of hybrids (EPRI 2004). Lithium-ion batteries have yet to prove their durability. Battery replacement was not factored into the discussion of incremental cost above; if such replacement is needed as a matter of course, the payback period for a plug-in becomes much longer. It is frequently stated that a fuel-saving technology must pay for itself within three years to be attractive to vehicle purchasers at the time of sale (see, e.g., NRC 2002). By that criterion, medium-range plug-ins will continue to fall short, even under an optimistic projection of battery cost, as discussed above. Yet given the small but certain foothold that hybrids have gained in the U.S. market, even prior to such a reduction in battery costs or the recent introduction of substantial tax credits, it is clear that having a long payback is not sufficient to eliminate a high-efficiency vehicle from consideration. In fact, recent research on vehicle purchasing decisions casts doubt on the notion that such decisions are based on payback calculations at all (Turrentine, Heffner, and Kurani 2005). Certainly the evolution of the U.S. vehicle market over the past two decades demonstrates that manufacturer advertising and consumer tastes trump cost considerations to a great extent, so a shift in consumers’ perceptions of the importance of vehicles’ environmental performance could render a $4,500 cost differential quite insignificant for much of the vehicle market. On the other hand, absent such a shift, it remains to be seen how high the market share even for today’s hybrids can rise. Lastly, plug-ins may offer some economic benefits through their interaction with the power generation sector. Substantial penetration of plug-ins should improve load factor by increasing nighttime demand.15 In addition, the potential may exist for plug-ins to recoup costs for their owners by generating peak-load power for the grid (Kempton and Tomić 2005), assuming battery durability issues can be addressed.
15 An increase in nighttime demand could also promote the use of wind power.
10

Plug-In Hybrids, ACEEE
CONCLUSIONS Plug-in hybrids could offer important advantages over even the cleanest and most efficient of today’s vehicles. Care should be exercised in stating what they do and don’t promise relative to existing vehicle technologies, however, and how that translates to a greener future vehicle stock. The clearest benefit of the plug-in over today’s hybrid is reduced oil consumption: for the average driver, a plug-in with an electric-only range of 20 miles could reduce fuel use by about one-third, and one with a 40-mile range could eliminate about half of fuel use. Given technology and cost constraints, 40 miles is likely to be at or beyond the upper end of plug-in ranges for some time to come. With regard to greenhouse gas emissions, the advantage of plug-ins over hybrids is large in areas with clean power, and modest elsewhere. In regions with a low-carbon power generation mix, such as California, CO2 reductions of a 40-mile plug-in relative to a hybrid could reach one-third. Running on the average U.S. power generation mix, the same plug-in would reduce CO2 emissions by about 15%. Plug-ins’ greenhouse gas benefits would grow only in a future scenario in which power sector CO2 emissions are reduced from present levels. While one might view a dramatic reduction in GHG emissions from power generation as inevitable given the urgent need to address global warming, the U.S. is experiencing a resurgence in the construction of coal-fired power plants, which could in fact raise the electricity sector’s carbon emissions substantially in the coming decades. From a public health perspective, electricity generation mix is again a crucial determinant of the benefit of plug-ins. Using today’s electricity grid, NOx emissions will be 5% to 40% lower for a plug-in than for a hybrid, depending on geographic region, while SOx would be much higher for a plug-in, except with the cleanest generation mix. Furthermore, power generation emits mercury. U.S. Department of Energy projections of power plant emissions in 2020, which assume full implementation of the Clean Air Interstate and Mercury Rules, imply that plug-ins at that point would reduce NOx relative to hybrids by 40% across the U.S., while SOx increases due to plug-ins would decline dramatically. Power plant mercury emissions would drop by over 72% from today’s levels, on average. Clean Air Act implementation has proved contentious and unpredictable, however, and achieving the projected reductions in NOx, SOx, and mercury will require a consistent effort in the years to come. The ability of a plug-in to become cost-competitive in the vehicle market depends on several factors, some of which are unrelated to the vehicles themselves. Taking a narrow perspective, one can predict that a plug-in with a range of 40 miles would approach, though not attain, a three-year payback of incremental cost if future gasoline prices reach $4 per gallon and batteries reach the low end of the plausible price range. This is a very substantial decline from current battery costs, but one that may be achievable for NiMH primarily through economies of scale. Given the general belief that Li-ion batteries are more promising for plug-ins of this range, however, further breakthroughs in battery technology will be necessary. Taking a broader view, one might observe that the cost-competitiveness of even today’s hybrid is unclear, and that plug-ins, like hybrids, will be able to capture large shares of the vehicle market if and only if circumstances require a sustained reduction in oil consumption or there is a
11

Plug-In Hybrids, ACEEE
fundamental shift in consumer values that entails the embrace of low-consuming vehicles. Another possibility is that improvements in battery technology will far exceed expectations and the power grid will become much cleaner, in which case the EV, which does not require a second power source as hybrids and plug-ins do, could become a broadly applicable technology. The plug-in is a promising technology that should not be allowed to fall prey to the cart-before-the-horse phenomenon that has proven counterproductive to new technologies in the past. In particular, overselling plug-ins to policymakers or to the general public today is likely to result in disenchantment and a corresponding loss of support before the technology has even had a chance to reach the market. Plug-in demonstration programs, incentives for advanced battery production, and other means to keep the technology moving forward should be pursued at all levels. At the same time, currently available measures to reduce the oil dependence of the U.S. transportation sector should be at the center of the policy agenda. A major and sustained commitment to improving average fuel economy would be among the most effective steps toward accelerating the arrival of plug-ins.
12

Plug-In Hybrids, ACEEE
REFERENCES Anderman, M. 2003. Brief Assessment of Improvements in EV Battery Technology Since the BTAP
June 2000 Report. Agreement # 02-611. Online. http://www.arb.ca.gov/msprog/zevprog/2003rule/03board/andermanreport.pdf. California Air Resources Board.
——— (Advanced Automotive Batteries). 2006a. Personal communication with J. Kliesch. July 18,
July 24. ———. 2006b. “Batteries for HEV—2006 to 2010: NiMH Expansion, Li Ion Introduction.” In
Proceedings of the 2006 Advanced Automotive Battery and Ultracapacitor Conference. Oregon House, Calif.: Advanced Automotive Batteries.
Berman, B. 2005. Vehicle fuel economy data reported to the hybridcars.com Web site by individual
vehicle owners. Data shared with authors September 9. Davi, J. (CalCars). 2006. E-mail correspondence with J. Kliesch. February 28. Davis, S. and S. Diegel. 2006. Transportation Energy Data Book, 25th Edition. ORNL-6974. Oak
Ridge, Tenn.: Oak Ridge National Laboratory, Center for Transportation Analysis. [DOT] U.S. Department of Transportation. 2004. 2001 National Household Travel Survey CD-ROM.
Washington, D.C.: U.S. Department of Transportation. [EDrive] EDrive Systems LLC. 2006. “EDrive FAQ.” Online.
http://www.edrivesystems.com/faq.html. EDrive Systems LLC. [EIA] Energy Information Administration. 2006a. “Supplemental Tables to the Annual Energy
Outlook 2006.” http://www.eia.doe.gov/oiaf/aeo/supplement/index.html. Washington, D.C.: Energy Information Administration.
———. 2006b. Electric Power Monthly, July 2006. DOE/EIA-0226 (2006/07). Washington, D.C.:
Energy Information Administration. [EPA] U.S. Environmental Protection Agency. 2006. Fuel Economy Labeling of Motor Vehicles:
Revisions to Improve Calculation of Fuel Economy Estimates. Draft Technical Support Document. EPA420-D-06-002. Washington, D.C.: U.S. Environmental Protection Agency, Office of Transportation and Air Quality.
[EPRI] Electric Power Research Institute. 2001. Comparing the Benefits and Impacts of Hybrid Electric Vehicle Options. 1000349. Palo Alto, Calif.: Electric Power Research Institute.
———. 2004. Advanced Batteries for Electric-Drive Vehicles: A Technology and Cost-Effectiveness
Assessment for Battery Electric Vehicles, Power Assist Hybrid Electric Vehicles, and Plug-In Hybrid Electric Vehicles. 1009299. Palo Alto, Calif.: Electric Power Research Institute.
13

Plug-In Hybrids, ACEEE
———. 2005. “Power Plants and Particulate Matter: Formation and Direct Emissions.” Online. http://www.epriweb.com/public/000000000001011505.pdf. Palo Alto, Calif.: Electric Power Research Institute.
Graham, R. (Electric Power Research Inst.). 2005. Personal communication with authors. September
8. ———. (Electric Power Research Inst.). 2006. Personal communication with J. Kliesch. May 18. Hyde, J. 2006. “Toyota Exec: E85 Vehicles an Option.” Detroit Free Press, July 19. Kempton, W. and J. Tomić. 2005. “Vehicle to Grid Fundamentals: Calculating Capacity and Net
Revenue.” Journal of Power Sources, 144 (1), June 1. Kher, U. 2005. “Breaking that Dirty Oil Habit.” Time Magazine Bonus Section, July. Kliesch, J. 2004. Rating the Environmental Impacts of Motor Vehicles: ACEEE’s Green Book®
Methodology, 2004 Edition. Washington, D.C.: ACEEE. Markel, T. and A. Simpson. 2006. “Plug-In Hybrid Electric Vehicle Energy Storage System Design.”
In Proceedings of the 2006 Advanced Automotive Battery and Ultracapacitor Conference. Oregon House, Calif.: Advanced Automotive Batteries.
Molloy, T. 2005. “Experimental Hybrid Cars Get Up to 250 Mpg.” Common Dreams News Center.
Associated Press, August 16. http://www.commondreams.org/headlines05/0816-01.htm. [NRC] National Research Council. 2002. Effectiveness and Impact of Corporate Average Fuel
Economy (CAFE) Standards. Washington, D.C.: National Academy Press.
[ORNL] Oak Ridge National Laboratory. 2006. “2001 National Household Transportation Survey.” Online analysis tool. http://nhts.ornl.gov/2001/index.shtml. Oak Ridge, Tenn.: Oak Ridge National Laboratory.
[SAE] Society of Automotive Engineers. 1999. Recommended Practice for Measuring the Exhaust
Emissions and Fuel Economy of Hybrid-Electric Vehicles. SAE J1711. Warrendale, Penn.: Society of Automotive Engineers.
Turrentine, T., R. Heffner, and K. Kurani. 2005. Are Consumers Rational? And, Will That Change?
Presentation by Ken Kurani at the 10th Biennial Meeting on Transportation Energy and Environmental Policy, Asilomar, Calif. August 22–24.
Wang, M. 1999. GREET 1.5—Transportation Fuel-Cycle Model. Volume 1: Methodology,
Development, Use, and Results. ANL/ESD-39. Argonne, Ill.: Argonne National Laboratory.
14

Plug-In Hybrids, ACEEE
APPENDIX Table A1. Projected Annual CO2, NOx, SO2, and Mercury Emissions for a Plug-In Running 100% Electric, by Generation Mix, 2005 to 2030
2005 2010 2015 2020 2025 2030 ECAR CO2 (lbs) 6,154.4 6,060.1 5,929.8 5,808.5 5,684.1 5,582.8 SO2 (lbs) 33.9 15.1 10.8 8.4 8.0 7.2 NOx (lbs) 10.6 3.6 2.8 2.6 2.5 2.3 Mercury (grams) 0.058 0.036 0.022 0.017 0.015 0.013 ERCOT CO2 (lbs) 3,678.7 3,572.7 3,440.5 3,263.6 3,116.5 3,199.8 SO2 (lbs) 5.1 3.9 2.9 2.2 2.0 1.8 NOx (lbs) 3.0 1.9 1.8 1.6 1.5 1.4 Mercury (grams) 0.031 0.024 0.008 0.006 0.006 0.006 MAAC CO2 (lbs) 3,641.9 3,835.7 3,767.4 3,657.4 3,648.3 3,719.1 SO2 (lbs) 29.4 7.8 5.8 5.3 4.8 4.4 NOx (lbs) 5.6 2.7 2.2 2.1 2.0 1.8 Mercury (grams) 0.058 0.021 0.014 0.012 0.012 0.010 MAIN CO2 (lbs) 4,302.7 4,414.5 4,383.9 4,358.9 4,287.5 4,150.4 SO2 (lbs) 18.2 13.6 9.2 7.9 7.0 6.4 NOx (lbs) 5.8 2.7 2.6 2.5 2.5 2.4 Mercury (grams) 0.045 0.039 0.025 0.016 0.012 0.011 MAPP CO2 (lbs) 5,500.9 5,510.7 5,465.1 5,352.6 5,180.5 5,073.9 SO2 (lbs) 14.5 8.6 7.6 6.8 5.6 5.3 NOx (lbs) 10.1 6.5 5.8 5.6 5.3 4.8 Mercury (grams) 0.064 0.048 0.032 0.027 0.014 0.012 NPCC-NY CO2 (lbs) 2,571.5 2,608.0 2,565.1 2,558.1 2,634.7 2,816.8 SO2 (lbs) 11.0 9.4 6.3 5.1 4.5 5.2 NOx (lbs) 2.9 1.9 1.8 1.6 1.4 1.4 Mercury (grams) 0.035 0.009 0.004 0.003 0.004 0.004 NPCC-NE CO2 (lbs) 2,850.5 2,847.5 2,752.7 2,674.3 2,795.7 2,929.1 SO2 (lbs) 11.7 7.2 5.5 4.8 4.2 4.3 NOx (lbs) 3.3 2.9 2.8 2.6 2.4 2.3 Mercury (grams) 0.018 0.018 0.015 0.005 0.003 0.003 FRCC CO2 (lbs) 4,301.7 4,145.2 4,102.1 3,948.3 4,157.0 4,306.0 SO2 (lbs) 13.1 6.5 5.6 4.7 3.7 3.4 NOx (lbs) 7.7 3.7 3.0 2.7 2.7 2.5 Mercury (grams) 0.020 0.010 0.008 0.006 0.006 0.005 SERC CO2 (lbs) 3,957.7 3,863.4 3,784.2 3,727.6 3,776.6 3,810.2 SO2 (lbs) 21.5 9.8 6.9 5.4 4.4 3.7 NOx (lbs) 5.9 3.2 2.5 2.2 1.9 1.6 Mercury (grams) 0.037 0.022 0.012 0.009 0.008 0.007
15

Plug-In Hybrids, ACEEE
2005 2010 2015 2020 2025 2030 SPP CO2 (lbs) 6,076.7 5,968.3 5,636.4 5,541.5 5,518.7 5,439.9 SO2 (lbs) 14.3 12.8 9.3 7.0 5.8 5.5 NOx (lbs) 9.0 6.9 5.9 5.6 5.5 5.0 Mercury (grams) 0.067 0.056 0.027 0.017 0.011 0.009 WECC-NW CO2 (lbs) 2,668.6 2,471.7 2,432.7 2,434.7 2,528.4 2,687.3 SO2 (lbs) 3.3 3.0 2.6 2.4 2.4 2.4 NOx (lbs) 4.3 4.0 3.8 3.6 3.5 3.4 Mercury (grams) 0.021 0.017 0.014 0.012 0.011 0.008 WECC-RM+ CO2 (lbs) 4,699.2 4,773.3 4,544.7 4,785.7 5,071.1 5,208.3 SO2 (lbs) 4.1 4.0 3.5 3.1 3.1 2.8 NOx (lbs) 6.7 6.7 4.4 4.4 4.5 4.3 Mercury (grams) 0.024 0.021 0.014 0.012 0.008 0.006 WECC-CA CO2 (lbs) 2,172.5 2,327.7 2,436.8 2,820.3 3,029.4 3,190.6 SO2 (lbs) 1.8 1.6 1.5 1.5 1.4 1.4 NOx (lbs) 2.3 2.3 2.1 2.2 2.3 2.2 Mercury (grams) 0.004 0.003 0.003 0.003 0.002 0.002 US CO2 (lbs) 4,241.3 4,194.1 4,090.7 4,033.3 4,037.7 4,068.5 SO2 (lbs) 17.4 8.9 6.5 5.2 4.6 4.1 NOx (lbs) 6.3 3.5 2.9 2.7 2.6 2.4 Mercury (grams) 0.039 0.026 0.015 0.011 0.009 0.008 Legend ECAR East Central Area Reliability Coordination Agreement ERCOT Electric Reliability Council of Texas MAAC Mid-Atlantic Area Council MAIN Mid-America Interconnected Network MAPP Mid-Continent Area Power Pool NPCC-NY Northeast Power Coordinating Council/New York NPCC-NE Northeast Power Coordinating Council/New England FRCC Florida Reliability Coordinating Council SERC Southeastern Electric Reliability Council SPP Southwest Power Pool WECC-NW Western Electricity Coordinating Council/Northwest Power Pool Area WECC-RM+ Western Electricity Coordinating Council/Rocky Mountain Power Area and Arizona-New
Mexico-Southern Nevada Power Area WECC-CA Western Electricity Coordinating Council / California US United States
Note: Assumes 3,000 kWh consumed (12,000 miles at 4 mi/kWh) and 9% transmission and distribution losses. Source: ACEEE based on EIA (2006a)
16