pluto.mscc.huji.ac.ilpluto.mscc.huji.ac.il/~mswiener/teaching/inv03s/weeklyfibygs.pdfsimilarly, the...
TRANSCRIPT
April 25, 2003
US Treasuries, Agencies, & Derivatives
Alan Brazil [email protected] New York: 1-212-902-4822 Hayley Boesky David Homan Alex Kuznetsov
Mortgage & Asset-Backed Securities
Alan Brazil [email protected] New York: 1-212-902-4822
Matthew Jozoff Jeremy Primer Kyle Nagel Limin Zhang Suzanne Sears Deeb Salem Eric Splaver
Goldman Sachs Fixed Income Strategies
http://www.gs.com See last page for Reg AC Certification. Important disclosures appear at the back of this report.�
�������������� ������ ������� ������������
Interest Rate Products: All Eyes on Supply The Treasury’s refunding announcement is rapidly approaching, and we update our views on the impact of Treasury supply on Treasuries, swaps, and agencies. We also present our estimates for the benchmark rolls and discuss the prospects for the new three-year note.
Mortgage Securities: Adopt an Orphan IO Today While mortgages have tightened, they haven’t richened, as lower implied volatility has helped to keep OASs wide. We recommend taking advantage of selected opportunities to sell liquidity and pick up significant value. Orphan IOs are one such example: They allow investors to create collateral substitutes more than three-quarters of a point cheap versus higher coupons.
Prepayments: Prepayment Update for FHA/VA Reperforming Collateral The Goldman Sachs reperforming FHA/VA collateral continues to prepay slowly and stably. When averaged by vintage, three-month CPRs are virtually unchanged from last month (22-23% CPR). This combination of slow speeds and premium coupons provides investors with an opportunity to pick up spread versus other premiums or seasoned collateral. This month, we add delinquency information to our prepayment report. Delinquencies have been level in recent months. Differences in reporting standards can make interpreting delinquency information difficult; we discuss these problems below.
This report is being furnished to you solely for your information and is not to be reproduced or redistributed to any other person. In particular, this report is intended solely for the information of Qualified Institutional Buyers under Rule 144A.

Fixed Income Weekly Market Outlook United States �
� Goldman Sachs Fixed Income Strategies
���������������1 US Economics
5 Interest Rate Products
15 Mortgage Securities
19 Prepayments
Market Strategy Group Armen Avanessians [email protected] New York: 1-212-902-7321 US Treasuries, Agencies, & Derivatives Hayley Boesky David Homan Alex Kuznetsov Ian McDonald [email protected] [email protected] [email protected] [email protected] New York: 1-212-902-5009 New York: 1-212-902-0363 New York: 1-212-357-2809 New York: 1-212-357-9230 Mortgage & Asset-Backed Securities Alan Brazil Matthew Jozoff Jeremy Primer Kyle Nagel [email protected] [email protected] [email protected] [email protected] New York: 1-212-902-4822 New York: 1-212-902-4137 New York: 1-212-902-3839 New York: 1-212-902-1730 Suzanne Sears Limin Zhang Deeb Salem Eric Splaver [email protected] [email protected] [email protected] [email protected] New York: 1-212-357-8787 New York: 1-212-902-9281 New York: 1-212-357-0324 New York: 1-212- 357-9673 Corporates Paula Dominick (Credit) [email protected] New York: 1-212-902-9757 International Markets Stefano Nannizzi Hiroyoshi Sandaya Takayoshi Nakamura Koichi Miyazaki [email protected] [email protected] [email protected] [email protected] London: 44-207-774-5883 Tokyo: 81-3-3589-8976 Tokyo: 81-3-3589-9232 Tokyo: 81-3-3589-8979 Elsa Sitruk [email protected] London: 44-20-7774-5111 Editorial Ron Krieger Eileen Baecher Beverly Bell [email protected] [email protected] [email protected] New York: 1-212-902-1724 New York: 1-212-902-0513 New York: 1-212-902-0513 � � � �
Production Carlos J. Gallardo George B. Gallardo [email protected] [email protected] New York: 1-212-902-8797 New York: 1-212-357-1071

United States Fixed Income Weekly Market Outlook
Goldman Sachs Fixed Income Strategies
1
Bill Dudley [email protected] New York: 1-212-902-3394
Ed McKelvey [email protected] New York: 1-212-902-3393
John Youngdahl [email protected] New York: 1-212-902-8124
Jan Hatzius [email protected] New York: 1-212-357-1875
������
�������
����
����
�������� ���������������� �
It is too soon to expect the economic data to clarify the outlook. Areas of weakness such as jobless claims could still just reflect war-induced weakness. Areas of strength such as durable goods orders and retail chain-store sales are suspect because they are extremely volatile and/or tainted by other factors such as the timing of Easter. Only when the data that apply to May are firmly in hand will be it possible to reach firm conclusions about the magnitude (if any) of a post-war bounce.
Not surprisingly, market participants have put most of the weight on the recent claims data. The rise in initial claims to 455,000 – the highest in more than a year – and the rise in continuing claims to 3.589 million were disturbing. But the initial claims data should be discounted a bit because the most recent week included Good Friday, which makes seasonal adjustment for the week suspect. Also, the recent deterioration in the labor market could reflect decisions undertaken while the Iraq war outcome was still very uncertain.
Conversely, retail chain-store sales were boosted by Easter. For example, the UBS-Warburg BTM index during the past two weeks was about 1% above the average of the preceding month. Similarly, the Johnson Redbook index showed a month-to-date (through April 19) increase of 4.6%, compared to a 1.9% decline in March. However, the bounce due to Easter is at the high end of the range in recent years, suggesting that the war’s end could also be at work.
It is a bit more difficult to dismiss the strength in durable goods orders in March, which rose by 2.0% overall and 3.2% for the nondefense capital goods orders, excluding aircraft, category. These gains were accompanied by rises in unfilled orders of 0.3% and 1.3%, respectively. The March data were surprisingly good considering that such orders have tended to be very weak during the last month of the quarter during the past year and that one might have expected firms to have postponed orders while Iraq war uncertainty was at its highest point.
Real GDP growth was slightly weaker than expected in the first quarter – 1.6% at an annual rate. Relative to our forecast, there were three sizable misses: (1) much less defense spending, (2) slightly less inventory accumulation, and (3) a greater positive contribution from trade. Although the price deflator rose by 2.5%, energy was the culprit, with the core PCE deflator rising at only a 0.9% annual rate. The report does not change our expectations for the second quarter – our growth estimate remains +1%.
April 25, 2003
Fixed Income Weekly Market Outlook United States
� Goldman Sachs Fixed Income Strategies
2
Chairman Greenspan wants to stay patient
The major implication of the GDP report is to put more pressure on Chairman Greenspan to ease monetary policy further. After all, the so-called “soft spot” has lengthened in duration. At this point, Chairman Greenspan’s preference is to be patient. He believes that the recent weakness is due mainly to war-related uncertainties. Now that that cloud has lifted, he anticipates that the economy will rebound.
Whether he can afford to be patient is another question entirely. Inflation is below the implicit target held by most Fed officials, and the risks of waiting too long are readily apparent in the Japanese situation. As a result, what the FOMC will do at the May 6 meeting has become a very close call that could easily turn on next week’s economic data.
Fortunately, Chairman Greenspan may clarify the monetary policy outlook next Wednesday when he testifies before the House Financial Services Committee. We expect him to be optimistic about the economic outlook because he believes that the end of the Iraq war removes an important barrier to business activity, but uncertain because he is not sure that the war can explain the degree of weakness that is evident, especially in US labor markets.
Tax receipts falter again, foreshadowing the huge Treasury refunding ahead
Final settlements of 2002 tax receipts have faltered for the second consecutive year. This is disappointing relative to the Congressional Budget Office’s assumptions. Thus, the CBO budget deficit estimates are likely to climb significantly when they are next updated. The cost of the war in Iraq will also be explicitly included in these projections for the first time as well. We remain comfortable that the budget deficit in fiscal 2003 will be about $425 billion. Halfway through the current fiscal year, the deficit for fiscal 2003 totals $252.3 billion, compared with $131.9 billion at the same point a year earlier.
The sharp deterioration in the budget is leading to a big jump in the size of the upcoming quarterly refunding. We expect the Treasury to auction $51 billion of new securities, about evenly divided between three-year notes ($16 billion), five-year notes ($17 billion), and 10-year notes ($18 billion). Our estimate is considerably smaller than consensus for several reasons including: (1) Financing needs are seasonally low in the April-June quarter; (2) the Treasury has flexibility to raise money via coupons in other auctions, having decided to reopen five-year notes; and (3) officials will be especially averse to a sloppy auction in the refunding at a time when the auction schedule is in flux.
Stay short 10-year T-note futures
Note: The following comments reflect trading views and may differ from our longer-term interest rate forecast. So far we have not gotten much satisfaction from our short recommendation despite a rise in the equity market and improving consumer confidence. But we would stick with it for a while longer – short the June ’03 10-year T-note futures contract with a target of 110.00 and a stop on a close above 116.00. A significant increase in supply is imminent, and investors are already anticipating very weak economic news next week.
April 25, 2003

United States Fixed Income Weekly Market Outlook
Goldman Sachs Fixed Income Strategies
3
������
�������
����
����
Exhibit 1: Late Easter lifts retail activity Exhibit 2: Capital spending: a rebound in the making?
28211472821147
8
6
4
2
0
-2
8
6
4
2
0
-2
Percent change, year ago Percent change, year agoExhibit 1: Late Easter Lifts Retail Activity
March April
Easter 2002 Easter 2003
BTM Chain-Store Sales
20022003
Source: UBS Warburg and Bank of Tokyo-Mitsubishi
MFJDNOSAJJMAMFJDNOSAJJMAMFJ200320022001
64
62
60
58
56
54
52
50
64
62
60
58
56
54
52
50
Billions of dollars Billions of dollarsA Rebound in the Making?
Nondefense Capital GoodsOrders Excl Aircraft,Three-Month Moving Average
ShipmentsNew Orders
Source: Department of Commerce
Exhibit 3: The soft spot persists Exhibit 4: Another tax receipt shortfall
IIVIIIIIIIVIIIIII200320022001
6
4
2
0
-2
6
4
2
0
-2
Annualized percent change Annualized percent changeExhibit 3: The Soft Spot Persists
Real GDPReal Domestic Final Sales
Source: Department of Commerce
343230282624222018161412108642
250
200
150
100
50
0
250
200
150
100
50
0
Business Days From April 1
Billions of dollars Billions of dollars
* Month-to-date.
Exhibit 4: Another Tax Receipt Shortfall
Non-Withheld IndividualIncome Tax Receipts
200120022003*
Source: Treasury Department
Exhibit 5: GS financial conditions index
20022001200019991998
98.5
98.0
97.5
97.0
96.5
96.0
95.5
95.0
98.5
98.0
97.5
97.0
96.5
96.0
95.5
95.0
Index, 1987-1995=100 Index, 1987-1995=100Exhibit 5: GS Financial Conditions Index
Easier
Tighter
Real GS Financial Conditions Index
Source: Goldman Sachs
April 25, 2003

Fixed Income Weekly Market Outlook United States
� Goldman Sachs Fixed Income Strategies
4
April 25, 2003

United States Fixed Income Weekly Market Outlook
Goldman Sachs Fixed Income Strategies
5
David Homan [email protected] New York: 1-212-902-0363
Alex Kuznetsov [email protected] New York: 1-212-357-2809
������������
������ ����
����
��
������������� �����
The Treasury’s refunding announcement is rapidly approaching, and we update our views on the impact of Treasury supply on Treasuries, swaps, and agencies. We also present our estimates for the benchmark rolls and discuss the prospects for the new three-year note.
Trade recommendations
Spotlight on supply
The main theme of our trade recommendations this week continues to be the market impact of the upcoming changes in Treasury supply:
• Stick with swap spread tighteners. We expect that the main result of the anticipated surge in Treasury supply will be a significant tightening of swap spreads across the curve, especially in intermediates. Swap spreads have tightened about 5 bp in the last three weeks, but we continue to believe that this trend still has a lot of potential and maintain our target range of 20-30 bp for 10-year swap spreads. For a detailed discussion of implementing this trade, please refer to the Weekly Market Outlook, April 4 and April 11, 2003.
• Hedge mortgage positions with Treasuries. In light of our expectation for swap spread tightening, we recommend that investors use five- and 10-year Treasuries instead of swaps to hedge lower coupon mortgage positions. We would not extend this recommendation to higher coupon mortgages, which will probably have more sensitivity to the shorter end of the yield curve. Negative carry (including financing and rolldown) on short Treasury positions versus swaps is slightly more than 1 bp for five-years and 1.75 bp for 10-years over a three-month horizon, but we think that spread tightening will more than compensate for this.
• Bet against benchmark premiums. Within the Treasury market, we recommend selling current on-the-runs against the seven-year sector and the long end of the Treasury curve. The seven-year sector is additionally supported by the continued suspension of the State and Local Government Series (SLGS) securities program, and we do not expect any supply in the long end. The trade we recommended in the Weekly Market Outlook, March 28, 2003 – the 7-10-30 market-neutral butterfly – is a good expression of that view that also provides positive carry.
• Buy agencies versus Treasuries. We think that agency debt will continue to outperform Treasuries into the refunding and in the weeks that follow. We anticipate that agency debt from five- to 10-years will probably be the greatest beneficiaries of further spread tightening. Versus our fitted Treasury curve, the agency spread curve is extremely flat from seven- to 10-years, and we recommend that investors buy seven-year agencies, such as Freddie Mac’s 7.0% due March 2010, against 10-year Treasury note futures (which have a similar duration exposure). Alternatively, investors can sell $81.2 million of five-year Treasuries and $38 million of 10-year Treasuries versus
April 25, 2003

Fixed Income Weekly Market Outlook United States
� Goldman Sachs Fixed Income Strategies
6
buying $100 million of the Freddie Mac issue. This position is both proceeds- and duration-neutral. Furthermore, over a three-month horizon, the agency issue provides $350,000 of excess carry versus the barbell of Treasuries (net of rolldown). Finally, over the investment horizon, the agency can underperform Treasuries by as much as 5.5 bp and investors will still break even on the trade.
• Sell 10-year agencies versus swaps. Although we expect that agencies will continue to tighten versus Treasuries, we are not as optimistic on the performance of agencies versus swaps. We recommend that investors sell 10-year agencies versus swaps. For example, as of the April 24 close, Freddie Mac’s 4.5% due January 2013, a 10-year Reference Note, traded at a matched maturity swap spread of LIBOR plus 3.3 bp. Over a three-month horizon, this issue is priced on a forward asset swap basis to cheapen to LIBOR plus 4.5 bp. We think that if swap spreads to Treasuries continue to tighten, and the agencies increase their retained portfolio growth, then 10-year agencies could cheapen by more than is implied by the forwards.
US Treasuries
Refunding expectations
For the May refunding (see the April 4, 2003, Weekly Market Outlook), we continue to expect the Treasury to announce $16 billion of three-years maturing in May 2006, $17 billion of five-years (with a subsequent $16 billion reopening in June) maturing in May 2008, and $18 billion of 10-years maturing in May 2013. All of these will be new securities.
Our estimates for the auction sizes are at the low end of consensus estimates, for three reasons. First, the amount of debt maturing on May 15 is unusually small (only $2.3 billion), so the refunding will raise record amounts of new cash in the April-June quarter, when financing needs are seasonally low. Second, the debt limit issue remains unresolved. Third, and of most importance, the Treasury may not want to risk possibly undercutting the success of the upcoming auctions now that the transition to a much more ambitious auction schedule is under way. We expect the refunding announcement to introduce a policy of scheduled reopenings for the 10-year, and perhaps a monthly schedule for the five-year. Our economists discuss these issues in detail in the GS Economics Daily Financial Market Comment for April 25.
Roll analysis
As we described in the January 31 issue of this publication, we estimate the curve value of the benchmark rolls by comparing the yields of the current on-the-runs with the corresponding constant-maturity points on the “benchmarks curve.” Exhibit 1 shows the history of these curve adjustments. Note that the curve values of both the five- and the 10-year rolls are now almost the same as they were ahead of the February refunding. Extrapolating the data in Exhibit 1 to the refunding announcement date (April 30), we find that the curve value of the five-year roll is 7.6 bp, while the corresponding estimate for the 10-year roll is 3.2 bp.
Alex Kuznetsov
April 25, 2003

United States Fixed Income Weekly Market Outlook
Goldman Sachs Fixed Income Strategies
7
������������
������ ����
����
��
Exhibit 1: The curve value of the rolls is about the same as it was in February Constant-maturity five- and 10-year yields from the benchmarks curve less actual yields of current five- and 10-year on-the-runs
-2
-1
0
1
2
3
4
5
6
7
8
9
7-Oct-02
7-Nov-02
7-Dec-02
7-Jan-03
7-Feb-03
7-Mar-03
7-Apr-03
7-May-03
Rol
l adj
ustm
ent (
bp
)
5y
10y
Source : Goldman Sachs FICC Strategies
Both the five-year and 10-year on-the-runs continue to trade special in the repo market, making carry a significant part of the cost of the roll. Using the funding rates of 0.5% for the five-year and 0.4% for the 10-year, we estimate the carry between the announcement date and the May 15 settlement date to be 2.1 bp for the five-year and 1.8 bp for the 10-year.
The main unknown in the roll valuation is the liquidity premium on the new issues. As we argued in our analysis of the February refunding (see the January 31, 2003, Weekly Market Outlook), we can analyze the historical behavior of liquidity premiums by looking at the spread between the old on-the-runs and the matched-maturity point on the benchmarks curve. This measure of liquidity premium is shown in Exhibit 2.
April 25, 2003

Fixed Income Weekly Market Outlook United States
� Goldman Sachs Fixed Income Strategies
8
Exhibit 2: Liquidity premiums – heading south? Yield spread of the old on-the-runs over the benchmarks curve
-2
-1
0
1
2
3
4
5
6
7
7-Oct-02 7-Nov-02 7-Dec-02 7-Jan-03 7-Feb-03 7-Mar-03 7-Apr-03
Liqu
idity
pre
miu
m (
bp
)10y
5y
Source : Goldman Sachs FICC Strategies
For the 10-year, we expect the Treasury to keep the size of the new issue at $18 billion, the same as it was in the last two refundings. Based on its behavior in February, we can expect the 10-year’s liquidity premium to remain constant at around 2 bp. The situation with the five-year is more interesting. At the February refunding announcement, the five-year rolls implied a liquidity premium of about 1 bp. Since then, this measure has ranged from a high of 2.5 bp to its current low of negative 0.5 bp.
It is somewhat unusual that the old five-year note trades through the benchmarks curve. We believe this is because the market is having a particularly hard time estimating the premium on the five-year owing to the announced changes in its issuance pattern. It is true that the size of the initial five-year auction (which we estimate at $17 billion) will be much smaller than the $24 billion we saw in February; however, after the June reopening, the new May 2008 will become the largest Treasury coupon issue ever, with an overall size of about $33 billion. With the liquidity premium on the five-year having gone negative, the market seems to be focusing on the long term when assessing the five-year premium. Nevertheless, we believe that in the short run, the smaller size of the initial auction may make the bidding there more aggressive than it was in February. Therefore, at the time of the announcement, we think the liquidity premium on the five-year will move back to marginally positive values of around 1 bp.
Adding it up
Exhibit 3 summarizes our estimates for the five- and 10-year roll markets. We believe the risks to these estimates are mostly related to uncertainty in liquidity premiums. In particular, if the announced size of the 10-year is larger than our $18 billion
April 25, 2003

United States Fixed Income Weekly Market Outlook
Goldman Sachs Fixed Income Strategies
9
������������
������ ����
����
��
estimate, the liquidity premium on the 10-year may collapse, causing the roll to open 1-2 bp higher than our 2.9 bp estimate. Similarly, for the five-year, if the roll opens above our pick 8.7 bp estimate, it would mean that we were too optimistic in expecting an increase in the five-year liquidity premium. This will almost certainly be the case if the announced size of the five-year auction exceeds our $17 billion estimate.
Exhibit 3: Breakdown of the benchmark rolls
Roll Curve (bp) Carry (bp) Liquidity
premium (bp) Total Five year 7.6 2.1 1 8.710 year 3.2 1.7 2 2.9
Source : Goldman Sachs FICC Strategies
A novel situation for the three-year issue
This May refunding marks the Treasury’s first introduction in decades of a new maturity series – the three-year note. While there will be no roll market for the three-year, we can still assess how it is likely to trade relative to existing issues in the sector.
A snapshot of the three-year sector of the Treasury curve is shown in Exhibit 4. An interesting feature is the relative richness of the 5.625% of February 2006, which is 3.5 bp rich to the Treasury fitted curve (and rich by a similar amount on a matched-maturity swap basis). This suggests that the 5.625% is playing the role of a three-year on-the-run, and being widely used by agency and mortgage market participants to hedge their three-year exposure. The large and liquid 4.625% of May 2006, which is also being used as a proxy for the three-year on-the-run, is in fact fair to the fitted curve (and versus swaps ).
We could reasonably expect both of these issues to cheapen going into the refunding as market participants roll their positions into the newly issued three-year note. It is difficult to estimate the premium that will be paid for the new three-year, as there is no historical precedent. One possibility is looking at the butterfly spread on a market-neutral 2-3-5 butterfly as a measure of the structural richness of the whole three-year sector (see the February 7, 2003, Weekly Market Outlook for a historical plot). Currently, the three-year sector is rich by about 1.5 bp by this measure. We expect that most of this richness will condense into the new three-year at the expense of the neighboring issues, and therefore we expect it to trade 1-2 bp rich to the existing 4.625% of May 2006. Adjusting for carry to the May 15 settlement date does not change this estimate.
April 25, 2003

Fixed Income Weekly Market Outlook United States
� Goldman Sachs Fixed Income Strategies
10
Exhibit 4: Where the new three-year will fit Treasury bond yields as of the April 23, 2003, close and the Treasury fitted curve
1.50
1.70
1.90
2.10
2.30
2.50
2.70
2.90
3.10
2.00 2.50 3.00 3.50 4.00
Years to maturity
Yie
ld (
%)
Feb 06
May 06
Source : Goldman Sachs FICC Strategies
US agencies
Look for agencies to outperform Treasuries and underperform swaps
In our view, the sharp increase in Treasury debt issuance will cause a narrowing of swap spreads to Treasuries. Similarly, we expect that agency spreads to Treasuries will continue to tighten in the coming months.
Agency debt has performed exceptionally well over the past two months. For example, 10-year agencies outperformed 10-year Treasuries by about 10 bp. Meanwhile, 10-year agencies outperformed swaps by 5 bp on a par asset swap basis. As Exhibit 5 shows, at current levels, 10-year agencies are now trading at or close to their historically richest levels versus swaps and Treasuries in the past year.
David Homan
April 25, 2003

United States Fixed Income Weekly Market Outlook
Goldman Sachs Fixed Income Strategies
11
������������
������ ����
����
��
Exhibit 5: 10-year agencies have outperformed swaps and Treasuries 10-year agency spreads to swaps and Treasuries (bp)
30
40
50
60
70
80
Apr-02 Jun-02 Aug-02 Oct-02 Dec-02 Feb-03 Apr-03
10-y
r ag
ency
spr
ead
to U
ST
0
5
10
15
20
10-yr agency par asset swap spread
10-year agency spread to UST
(left axis)
10-year agency par asset sw ap spread(right axis)
Source : Goldman Sachs FICC Strategies
We believe that net supply is a key measure that allows us to interpret the recent performance of the agency market. Exhibit 6 graphs the net supply of agency debt issued by Fannie Mae and Freddie Mac over the past year. Net supply is calculated as the amount of new debt issued less matured, redeemed, or repurchased debt.
Exhibit 6: Agency net issuance has declined in recent months Net debt issuance of Fannie Mae and Freddie Mac
-20
-10
0
10
20
30
40
Mar-02 May-02 Jul-02 Sep-02 Nov-02 Jan-03 Mar-03
Age
ncy
Net
Sup
ply
($, b
illio
ns)
Source : Goldman Sachs FICC Strategies
April 25, 2003

Fixed Income Weekly Market Outlook United States
� Goldman Sachs Fixed Income Strategies
12
As the exhibit shows, net debt issuance from Fannie Mae and Freddie Mac has dropped sharply – from approximately $18 billion in January to minus $17 billion in February. Furthermore, negative net supply of debt continued in March, albeit at less extreme levels.
Looking forward, we form our outlook for agency debt and swap performance versus Treasuries by considering the expected relative changes in net Treasury supply and net agency supply in the months ahead. We expect Treasury issuance to increase sharply relative to agency issuance. In the May refunding alone, we look for at least $51 billion in Treasury supply, of which $48.7 billion will be “new cash.” We think Treasuries will underperform both agencies and swaps as the market positions for and absorbs this supply.
We focus on two key considerations when formulating a view on the performance of agency debt versus swaps. First, agency performance versus swaps tends to be inversely correlated to swap performance versus Treasuries. We illustrate this in Exhibit 7, where we graph 10-year agency asset swap spreads versus 10-year swap spreads to Treasuries over the past two years. For every 10 bp rally in swap spreads, 10-year agencies have historically underperformed swaps by 4 bp. Therefore, from a historical perspective, it seems likely that if 10-year swap spreads to Treasuries tighten to 20-30 bp, as we expect, then agency debt should underperform the swaps curve.
Exhibit 7: As swap spreads tighten, agencies underperform swaps 10-year agency asset swap spreads versus 10-year swap spreads to Treasuries
y = -0.424x + 31.166
-15
-10
-5
0
5
10
15
20
25
35 45 55 65 75 85 95
10-year sw ap spreads to UST
10-y
ear
agen
cy a
sset
sw
ap s
prea
d
Source : Goldman Sachs FICC Strategies
We believe a second factor that influences the valuation of agency debt versus the swaps curve is net agency supply. Although this supply has declined in recent months, and agencies have outperformed swaps, we do not expect this trend to continue. The growth of Fannie Mae’s and Freddie Mac’s retained mortgage
April 25, 2003

United States Fixed Income Weekly Market Outlook
Goldman Sachs Fixed Income Strategies
13
������������
������ ����
����
��
portfolios largely determines the degree of net debt issuance from the agencies. Freddie Mac’s retained portfolio shrank in February, and so far in 2003 growth has been close to flat. Fannie Mae, on the other hand, has expanded its retained portfolio this year at an annualized rate of about 13%, but activity slowed in February and March. In Fannie Mae’s most recent monthly statement, it cites relatively unattractive mortgage- to agency debt-spreads as one reason why its portfolio growth has slowed in recent months. 1 However, in an April 14 press release concerning its first quarter earnings, Fannie Mae’s chief financial officer, Timothy Howard, indicated that the firm expects portfolio growth in 2003 to be in the “mid-teens.” Similarly, Freddie Mac announced on April 24 in a press release that it is on target for 8-12% portfolio growth in 2003. In light of these statements, the low levels of agency supply are unlikely to continue indefinitely. Indeed, according to its monthly volume summary, Freddie Mac seems to have reversed course in March by purchasing $32 billion of mortgages on a forward basis.
1 Fannie Mae’s monthly statement can be found at the following location: http://www.fanniemae.com/ir/pdf/monthly/2003/033103.pdf Freddie Mac’s monthly statement can be found at the following location: http://www.freddiemac.com/investors/volsum/
April 25, 2003

Fixed Income Weekly Market Outlook United States
� Goldman Sachs Fixed Income Strategies
14
April 25, 2003

United States Fixed Income Weekly Market Outlook
Goldman Sachs Fixed Income Strategies
15
Matthew Jozoff [email protected] New York: 1-212-902-4137
����
���������������� �
����
�������������������������
While mortgages have tightened, they haven’t richened, as lower implied volatility has helped to keep OASs wide. We recommend taking advantage of selected opportunities to sell liquidity and pick up significant value. Orphan IOs are one such example: They allow investors to create collateral substitutes more than three-quarters of a point cheap versus higher coupons.
There’s good news and there’s good news: Mortgages continued their tightening trend over the past week, and they’re still cheap. How so? The mortgage tightening has occurred along with a decline in implied volatility, such that static spreads have tightened but OASs (for lower coupon 30-years, for instance) are essentially unchanged over the week. Implied volatility on longer-dated swaptions has declined by 0.2 bp/day over the past week and by 0.6 bp/day over the past month. Meanwhile, volatility on shorter-dated structures (such as three-month into 10-year swaptions) has fallen by 1.2 bp/day over the past month, as geopolitical concerns have eased along with the resolution of the Iraq war. Despite the decline in volatility thus far, we expect implied and realized volatility to either remain at these levels or even soften further, as weakness in the economy will limit the likelihood of a sharp sell-off. As a result, we continue to recommend an overweight in mortgages, owing to bank sponsorship, great roll financing, and low net supply. In particular, we recommend hedging mortgage positions with Treasuries (especially for lower coupons), as a surge in Treasury issuance should keep the bias that currently prevails for swap spreads to tighten further (see related article in the interest rate section of this publication for more detail).
At what price liquidity?
One major theme now running through the mortgage market is the concession that investors can receive for moving into relatively less liquid sectors. Two examples of this stand out: First, reperformer deals currently offer extraordinary fundamental value. With LIBOR static spreads in excess of 100 bp, and with very little negative convexity, we estimate OASs to be in the neighborhood of 75 bp or more, with current coupon pass-throughs at less than half that. Arguably, this sector is nearly one-half to one full point cheap (for more on this, please see the related article in this publication). A second liquidity-related opportunity right now is the so-called “orphan” IO sector, which trades three-quarters of a point or more behind comparable Trust IOs. Though each investor must decide what compensation he or she needs for less liquidity, we believe that a three-quarter point concession is more than adequate as a discount for liquidity in the case of the orphan IOs. We highlight several strategies to extract the value from this sector in the analysis below.
Orphan IOs are simply IO strips created by stripping down a CMO deal to create discounts. These IOs are stripped across the whole deal, so they have no structure (unlike a PAC IO, for instance). Consequently, they are identical to Trust/Strip IOs in terms of their cash flow profile, with the main difference being that they are not actually “Trusts.” One example of an orphan IO is the FNR 2003-44 deal, in which 250
April 25, 2003

Fixed Income Weekly Market Outlook United States
� Goldman Sachs Fixed Income Strategies
16
bp of IO was stripped off the underlying 6.5% collateral to create 4% coupon PAC/supports. Orphan IOs have been created of late as a by-product of the market’s desire for par-priced securities (a rarity when the mortgage market is trading with a 104 handle!).
These orphan IOs are priced three-quarters of a point behind comparable Trusts, despite the similarities mentioned above; therefore, we attribute this price concession primarily to a liquidity difference between orphan and Trust IOs. In spite of its recent strong performance, the IO market is still at cheaper levels than it was a month ago, when the sector repriced in response to adverse prepayment data released in April. Though the sector is fundamentally cheap, investors actually need to monetize the value in orphan IOs. We recommend looking at the sector either through a synthetic premium framework (combining IOs and discount pass-throughs to create a cheap alternative to high coupons), or by combining orphan IOs with same-coupon POs to create a cheaper collateral substitute.
Three factors determine the value of synthetic premiums: (1) the relative richness of higher coupons currently, (2) the attractiveness of the roll in lower coupons, and (3) the cheapness of orphan IO. In fact, over the past month, synthetic premiums have dramatically underperformed high coupon pass-throughs, largely owing to the repricing in IOs during this period. In Exhibit 1, we highlight a combination of 5.5s and orphan IOs backed by 6s. The combination is constructed to have the same dollar duration and market value as a 6.5% position. With the roll in 5.5s at “special” levels, the carry of the combination is 30 ticks over two months, or more than three-quarters of a point better than for 6.5s. Admittedly, this carry does come at the cost of worse convexity than 6.5s. Still, based on hedge-adjusted carry (which calculates the carry minus the cost of hedging, including expected delta-hedging costs), investors are making more than half a point over a two-month period using this analysis. The synthetic premium approach would probably be appealing to money managers, who need to own high coupon mortgages because of the index composition. (Interestingly, 30-year 6.5s are still the biggest coupon in the index, making up more than 22% of it, and the lack of roll financing currently makes them a good candidate to replicate cheaper synthetically.)
Exhibit 1: Using orphan IO to create a cheap synthetic premium Combination of 5.5% pass-through with 6% orphan IO versus 6.5s; prices for May 30 settlement
2-month 2-month Convexity Hedge Adj Coupon WALA $OAD Face Price Mkt Val Carry Cost Carry Vega
FNMA 5.5 5.5 2 3.7 100.0 101.67 101.7 26.5 -8.4 6.3 -0.44 Orphan IO 6.0 4 -10.0 27.0 17.38 4.7 14.2 -5.0 25.3 0.25
Combination 7.1 3 1.0 100.0 106.36 106.4 30.3 -9.8 13.1 -0.37
Conv 6.5 6.5 20 1.0 102.4 103.91 106.4 3.5 -5.1 -5.6 -0.20
Difference 0.6 -17 0.0 -2.4 2.46 0.0 26.8 -4.7 18.7 -0.17
April 25, 2003
United States Fixed Income Weekly Market Outlook
Goldman Sachs Fixed Income Strategies
17
����
���������������� �
����
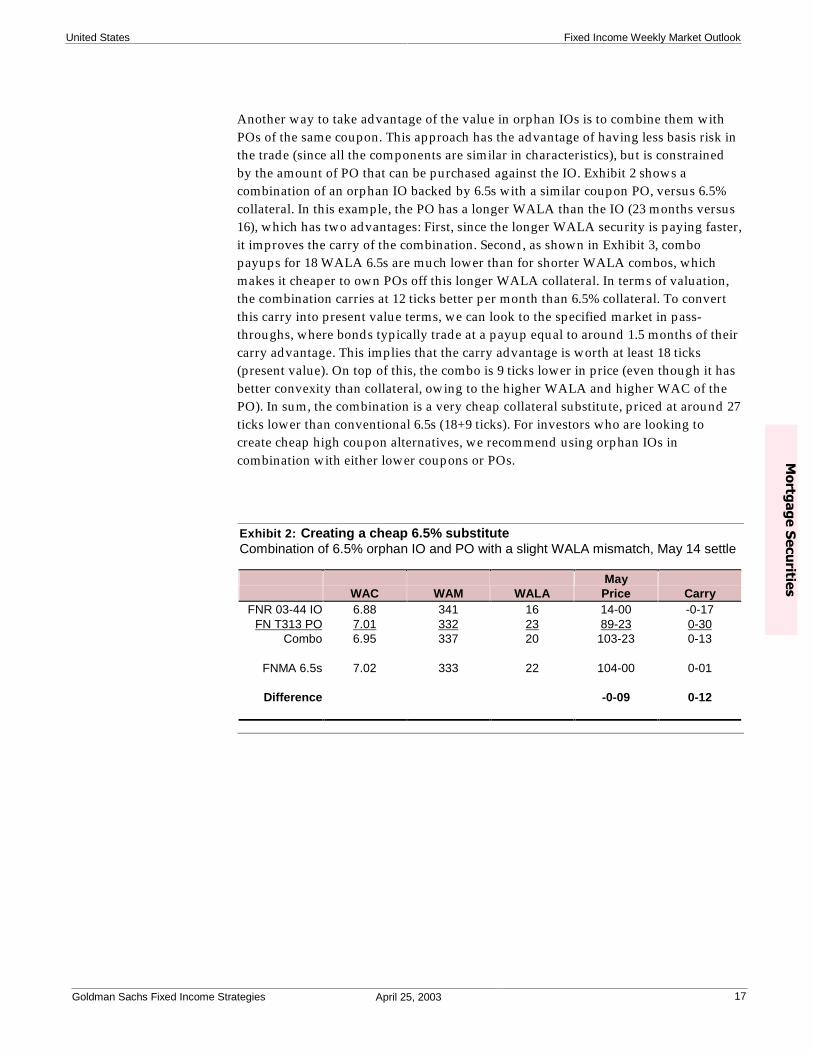
Another way to take advantage of the value in orphan IOs is to combine them with POs of the same coupon. This approach has the advantage of having less basis risk in the trade (since all the components are similar in characteristics), but is constrained by the amount of PO that can be purchased against the IO. Exhibit 2 shows a combination of an orphan IO backed by 6.5s with a similar coupon PO, versus 6.5% collateral. In this example, the PO has a longer WALA than the IO (23 months versus 16), which has two advantages: First, since the longer WALA security is paying faster, it improves the carry of the combination. Second, as shown in Exhibit 3, combo payups for 18 WALA 6.5s are much lower than for shorter WALA combos, which makes it cheaper to own POs off this longer WALA collateral. In terms of valuation, the combination carries at 12 ticks better per month than 6.5% collateral. To convert this carry into present value terms, we can look to the specified market in pass-throughs, where bonds typically trade at a payup equal to around 1.5 months of their carry advantage. This implies that the carry advantage is worth at least 18 ticks (present value). On top of this, the combo is 9 ticks lower in price (even though it has better convexity than collateral, owing to the higher WALA and higher WAC of the PO). In sum, the combination is a very cheap collateral substitute, priced at around 27 ticks lower than conventional 6.5s (18+9 ticks). For investors who are looking to create cheap high coupon alternatives, we recommend using orphan IOs in combination with either lower coupons or POs.
Exhibit 2: Creating a cheap 6.5% substitute Combination of 6.5% orphan IO and PO with a slight WALA mismatch, May 14 settle
May WAC WAM WALA Price Carry
FNR 03-44 IO 6.88 341 16 14-00 -0-17 FN T313 PO 7.01 332 23 89-23 0-30
Combo 6.95 337 20 103-23 0-13
FNMA 6.5s 7.02 333 22 104-00 0-01
Difference -0-09 0-12
April 25, 2003

Fixed Income Weekly Market Outlook United States
� Goldman Sachs Fixed Income Strategies
18
Exhibit 3: With high combo payups for shorter WALAs, POs off slightly more seasoned collateral are cheaper IO/PO combination payups for selected Trusts versus TBA 6.5s
0
2
4
6
8
10
12
14
0 5 10 15 20 25
WALA (months)
Co
mb
o P
ayu
p (
Tic
ks)
Trust 324
Trust 321
Trust 319Trust 313
One interesting result of the stripping that has occurred in the 6.5% coupon is that it could cause 6.5% collateral to trade to much shorter durations than implied by the model. In low interest rate environments, more cheap IO needs to be created in the CMO deal in order to create par-priced bonds. As a result, the stripped-down deals become less feasible when the market rallies, reducing demand from CMO desks for 6.5% collateral. The opposite is true in high-rate environments. Consequently, we wouldn’t be surprised to see 6.5s trade shorter in duration going forward owing to this effect.
April 25, 2003
United States Fixed Income Weekly Market Outlook
Goldman Sachs Fixed Income Strategies
19
����������
Suzanne Baldo [email protected] New York: 1-212-357-8787
����
������������ �������������������������������������
The Goldman Sachs reperforming FHA/VA collateral continues to prepay slowly and stably. When averaged by vintage, three-month CPRs are virtually unchanged from last month (22-23% CPR). This combination of slow speeds and premium coupons provides investors with an opportunity to pick up spread versus other premiums or seasoned collateral.
This month, we add delinquency information to our prepayment report. Delinquencies have been level in recent months. Differences in reporting standards can make interpreting delinquency information difficult; we discuss these problems below.
Slow and stable prepayment speeds
Most reperforming borrowers have been forced to sit out the refinancing wave that’s swept the mortgage world. Whether they’ve relapsed into delinquency or are simply cash-strapped, they often cannot qualify for a good rate or come up with the fees to take out a new mortgage. The Goldman Sachs FHA/VA reperforming deals are perfect examples. While comparable generic GNMA vintages have been prepaying in the 40-45% CPR range, the GSMPS collateral has been prepaying steadily in the low-20% CPR range.
In Exhibit 1, we show the latest speed and delinquency information. As can be seen, differences in seasoning and WAC don’t seem to matter, as all of the deals have three-month speeds between 18 and 25% CPR. One place where a little bit of interest rate sensitivity can be seen are the subgroups of the FNGT 2001-T5 deal. Group 1 has a lower gross WAC (7.01%) than any of the other GSMPS deals and has tended to prepay slower; currently it has a three-month speed of 18 CPR, compared with 24-25% CPR for the other FNGT 2001-T5 groups.
One-month CPRs do fluctuate, as some of the deal balances have become small, but over a longer period the trend is flat. The steadiness of these deals can be seen in the similarity of 12-month, six-month, three-month, and one-month speeds.
Finally, a premium coupon with slow speeds
While most premium coupons are currently trading flat to the E-curve at current speeds, the unusual combination of slow speeds with high coupons leads to value in the GSMPS deals. For example, consider the FNGT 2001-T5 A1 bond, currently trading near 106-12. At 20 CPR, this translates into a static spread of E+113 (see Exhibit 2). With very little option cost, this security most likely offers an OAS of at least 75 bp. Seasoned pass-throughs might offer only half of that. While these deals offer wide spreads, we believe another important component of performance could come from spread tightening. Just as the CMO market was instrumental in repricing the seasoned pass-through market points tighter, the same could ultimately occur in reperformers. Breaking the bond into a floater and an inverse I/O could be worth half a point or more.
April 25, 2003

Fixed Income Weekly Market Outlook United States
� Goldman Sachs Fixed Income Strategies
20
Exhibit 1: April 2003 prepayment speeds update for FHA/VA reperforming collateral
GS
MP
S19
98-1
GS
MP
S19
98-2
GS
MP
S19
98-3
GS
MP
S19
98-4
GS
MP
S19
98-5
FN
GT
1999
-T2
GS
MP
S19
99-2
GS
MP
S19
99-3
GS
MP
S20
00-1
FN
GT
2001
-T5
FN
GT
2001
-T5
GS
MP
S20
01-2
GS
MP
S20
02-1
1998
Avg
1999
Avg
2000
-01
Avg
A1
A2
A3
A4
Pri
cin
g D
ate
5/19
/98
6/22
/98
8/18
/98
9/24
/98
11/1
7/98
4/9/
996/
17/9
911
/30/
993/
30/0
05/
24/0
15/
24/0
15/
24/0
15/
24/0
15/
24/0
17/
30/0
19/
24/0
2N
AN
AN
A
Sec
uri
ty C
ou
po
n8.
00%
7.75
%7.
75%
7.50
%7.
50%
7.50
%8.
00%
8.00
%8.
50%
NA
6.50
%7.
00%
7.50
%8.
00%
7.50
%7.
17%
7.68
%7.
75%
7.83
%
Cu
r G
WA
C9.
57%
9.31
%9.
15%
8.97
%8.
92%
8.64
%8.
88%
8.88
%8.
98%
7.77
%7.
01%
7.51
%8.
17%
9.08
%8.
05%
7.62
%9.
16%
8.76
%7.
98%
Cu
r W
AM
255
200
202
211
205
223
216
219
279
270
297
292
285
216
267
292
214
220
270
Ag
e15
916
516
215
015
713
614
113
890
9072
8186
155
8758
158
138
89
Avg
Lo
an B
al (
$000
)49
.039
.041
.251
.441
.550
.851
.551
.377
.463
.485
.678
.267
.829
.672
.480
.344
.451
.167
.1
Pre
pay
men
t S
pee
ds
1-m
o C
PR
23.3
22.0
18.5
21.3
34.9
21.7
22.1
27.6
21.9
27.7
26.5
32.0
25.1
25.7
22.8
19.4
24.4
23.3
25.9
1-m
o C
PR
ch
ang
e-3
.3-1
.6-1
.48.
114
.4-4
.7-2
.811
.42.
48.
714
.513
.81.
85.
1-6
.94.
23.
9-0
.14.
3
3-m
o C
PR
24.7
21.2
19.6
19.4
24.5
24.9
20.7
21.1
18.6
23.4
17.9
25.1
25.1
23.9
25.1
17.5
21.9
22.9
23.2
3-m
o C
PR
ch
ang
e-1
.4-2
.2-2
.90.
26.
1-0
.1-1
.20.
93.
10.
33.
0-1
.2-0
.62.
1-2
.31.
70.
2-0
.10.
0
6-m
o C
PR
24.1
26.1
21.2
22.2
23.1
23.2
21.2
21.8
20.0
25.6
20.3
28.0
26.8
25.6
24.7
17.1
23.3
22.3
24.7
12-m
o C
PR
23.7
23.7
20.0
20.3
23.4
22.3
22.3
22.6
21.9
21.5
15.2
22.6
23.6
23.6
23.0
N/A
22.2
22.4
21.9
Sin
ce Is
suan
ce17
.216
.415
.616
.116
.416
.716
.316
.415
.517
.413
.917
.918
.418
.819
.816
.416
.316
.517
.7
Cre
dit
Per
form
ance
30-5
9 d
elin
qu
ency
(%
)16
.217
.519
.118
.620
.914
.916
.26.
68.
77.
97.
66.
99.
47.
09.
110
.818
.613
.18.
8
60-8
9 d
elin
qu
ency
(%
)7.
25.
04.
48.
15.
23.
26.
83.
14.
33.
23.
52.
73.
72.
52.
64.
36.
04.
12.
9
90+
del
inq
uen
cy (
%)
6.1
2.7
1.5
7.5
2.8
1.2
5.5
4.9
5.3
2.5
2.1
2.7
2.8
2.2
3.8
5.1
4.1
3.2
3.7
Ban
kru
ptc
y (%
)13
.69.
111
.28.
77.
45.
98.
08.
33.
15.
73.
75.
96.
17.
43.
23.
39.
87.
03.
8
Fo
recl
osu
re (
%)
11.1
11.6
15.8
4.6
11.0
5.0
5.9
4.2
8.0
3.7
3.6
3.1
4.4
3.3
4.2
5.0
10.8
5.0
4.5
To
tal n
on
-cu
rren
t (%
)54
.246
.052
.147
.447
.230
.242
.314
.6*
18.3
*23
.020
.521
.326
.422
.422
.928
.549
.229
.223
.6N
on
-cu
rren
t O
ct 0
2 (%
)55
.745
.953
.146
.147
.829
.748
.416
.7*
21.9
*24
.922
.324
.127
.424
.6N
/A25
.749
.631
.0N
/A
Source: Goldman Sachs Fixed Income Strategies
April 25, 2003

United States Fixed Income Weekly Market Outlook
Goldman Sachs Fixed Income Strategies
21
����
������������
Exhibit 2: At 106-12, FNGT 2001-T5 offers spreads well above premiums and seasoned pass-throughs
LT Speed 16 CPR 18 CPR 20 CPR 22 CPR 24 CPR 26 CPR Static Spread E + 121 E + 117 E + 113 E + 107 E + 101 E + 93
Yield 4.84 4.68 4.51 4.34 4.17 3.98
Source: Goldman Sachs Fixed Income Strategies
Given their lack of convexity, it might not be clear where reperformers fit in the scheme of things; they aren’t really like other mortgages, but they aren’t Treasuries either. We think the best comparison is with very seasoned pass-throughs, and they should be attractive to indexed mortgage money managers.
Delinquencies must be interpreted carefully
This month we add delinquency information to our prepayment update (Exhibit 1). Changes in delinquency status are important to monitor. As borrowers credit cure, more refinancing opportunities become available to them and one may see the sensitivity of the borrowers to interest rates increase. In the current environment, a sharp drop in delinquencies could translate into higher speeds. However, none of the deals surveyed have shown any dramatic improvement or worsening recently (we benchmark to delinquencies six months prior in October 2002).
Comparing deals in Exhibit 1, one might ask why some deals that have experienced higher delinquency rates than others prepay similarly. For example, GSMPS 1998-5 and GSMPS 2000-1 both have gross WACs just shy of 9% and have speeds of 22-23% CPR. Yet the GSMPS 1998-5 collateral is more than twice as delinquent. One would expect the GSMPS 2000-1 borrowers to prepay faster, since they should not have as many personal financial problems.
The reason is that the delinquency information is not reported in the same way. There are two questions that should always be asked when looking at delinquency statistics:
1. Is the MBS or ABS standard used?
2. Are bankruptcies and foreclosures included in the delinquencies?
There are different methods for determining which borrowers are delinquent and which are not. Delinquencies are measured at month-end, but months have different numbers of days. Is a borrower who has missed a payment that was due on the first of the month 30 days delinquent at month-end for 31-day-long months but not for those with fewer days? It might seem like a philosophical question, but when the majority of borrowers make payments on the first of the month, the answer matters.
A number of the GSMPS deals show sharp jumps and drops in delinquencies, sometimes lasting for one month, sometimes lasting for several. For example, in Exhibit 3, we show the reported delinquencies for GSMPS 1999-3. In January 2002, delinquencies rose sharply (30-plus rose from 28% to 50%) only to drop again in July 2002. This may have been caused by a switch from the ABS standard (which never includes borrowers due on the first on the month as 30 days delinquent) to the stricter MBS standard (which always includes borrowers due on the first). Such a
April 25, 2003

Fixed Income Weekly Market Outlook United States
� Goldman Sachs Fixed Income Strategies
22
switch may have occurred because of changes by the trustee or servicer; we are currently looking into the situation and will update readers as we get more information.
Another key issue to keep in mind is whether bankruptcies and foreclosures have been included in the delinquencies. The non-current percentages listed at the bottom of Exhibit 1 do include bankruptcies and foreclosures, with the exception of the starred numbers, which do not.
All in all, delinquencies can be a very important measure of performance, but it is important to know exactly what one is looking at. Even when an apples-to-apples comparison can’t be made, general trends are revealed.
Exhibit 3: Dramatic changes in performance may be caused by changes in delinquency reporting standards 30, 60, and 90+ delinquencies are shown for GSMPS 1999-3. Delinquencies rise sharply in January 2002, dropping off again in July 2002. This may be due to changes in delinquency reporting methods.
0
5
10
15
20
25
Dec-99 Jun-00 Dec-00 Jun-01 Dec-01 Jun-02 Dec-02
���
�����
�����
���
Source: Intex
In conclusion, the GSMPS FHA/VA reperforming collateral continues to prepay slowly and stably. The combination of slow speeds and premium coupon provides investors with an opportunity to pick up spread versus other premiums or seasoned collateral. We note again that delinquency information should be interpreted with care, as reporting standards matter and can be potentially misleading.
April 25, 2003

United States Fixed Income Weekly Market Outlook
Goldman Sachs Fixed Income Strategies
Each of the analysts named hereby certifies that, with respect to each subject issuer or its securities for which the analyst is responsible in this report: (1) all of the views expressed in this report accurately reflect his or her personal views about the subject issuer(s) or securities; and (2) no part of his or her compensation was, is, or will be, directly or indirectly, related to the specific recommendations or views expressed in this report: Suzanne Baldo, David Homan, Matthew Jozoff and Alex Kuznetsov. Goldman, Sachs & Co. or an affiliate makes a market in fixed income securities of issuers discussed in this report and may deal as principal in these securities. Copyright © 2003 by Goldman, Sachs & Co. This report is not to be construed as an offer to sell or the solicitation of an offer to buy any security in any jurisdiction where such an offer or solicitation would be illegal. We are not soliciting any action based upon this material. This material is for the general information of clients of Goldman Sachs. It does not take into account the particular investment objectives, financial situation or needs of individual clients. Before acting on any advice or recommendation in this material, a client should consider whether it is suitable for their particular circumstances and, if necessary, seek professional advice. Certain transactions, including those involving futures, options, and high yield securities, give rise to substantial risk and are not suitable for all investors. The material is based upon information that we consider reliable, but we do not represent that it is accurate or complete, and it should not be relied upon as such. Opinions expressed are our current opinions as of the date appearing on this material only. While we endeavor to update on a reasonable basis the information discussed in this material, there may be regulatory, compliance, or other reasons that prevent us from doing so. We and our affiliates, officers, directors, and employees, including persons involved in the preparation or issuance of this material may, from time to time, have long or short positions in, and buy or sell, the securities, or derivatives (including options) thereof, of companies mentioned herein. No part of this material may be (i) copied, photocopied or duplicated in any form by any means or (ii) redistributed without Goldman, Sachs & Co.'s prior written consent. This material has been issued by Goldman, Sachs & Co. and/or one of its affiliates and has been approved by Goldman Sachs International, which is regulated by the Financial Services Authority, in connection with its distribution in the United Kingdom and by Goldman Sachs Canada in connection with its distribution in Canada. This material is distributed in Hong Kong by Goldman Sachs (Asia) L.L.C., in Korea by Goldman Sachs (Asia) L.L.C., Seoul Branch, in Japan by Goldman Sachs (Japan) Ltd., in Australia by Goldman Sachs Australia Pty Limited (ACN 092 589 770), and in Singapore through Goldman Sachs (Singapore) Pte. This material is not for distribution in the United Kingdom to private customers, as that term is defined under the rules of the Financial Services Authority; and any investments, including any convertible bonds or derivatives, mentioned in this material will not be made available by us to any such private customer. Goldman Sachs International and its non-U.S. affiliates may, to the extent permitted under applicable law, have acted upon or used this research, to the extent it relates to non-U.S. issuers, prior to or immediately following its publication. Foreign-currency-denominated securities are subject to fluctuations in exchange rates that could have an adverse effect on the value or price of, or income derived from, the investment. In addition, investors in securities such as ADRs, the values of which are influenced by foreign currencies, effectively assume currency risk. Further information on any of the securities mentioned in this material may be obtained upon request, and for this purpose persons in Italy should contact Goldman Sachs S.I.M. S.p.A. in Milan, or at its London branch office at 133 Fleet Street, persons in Hong Kong should contact Goldman Sachs (Asia) L.L.C. at 2 Queen’s Road Central, and persons in Australia should contact Goldman Sachs Australia Pty Limited. Unless governing law permits otherwise, you must contact a Goldman Sachs entity in your home jurisdiction if you want to use our services in effecting a transaction in the securities mentioned in this material.

Fixed Income Weekly Market Outlook United States
Goldman Sachs Global Research Centers
Hong Kong London Menlo Park New York Seoul Singapore Sydney Tokyo