plutonium and its alloys - federation of american … this article and “mechanical behavior of...
TRANSCRIPT

290 Los Alamos ScienceNumber 26 2000
Plutonium and Its AlloysFrom atoms to microstructure
Siegfried S. Hecker
Number 26 2000 Los Alamos Science 291
Plutonium is an element at odds with itself—with little provocation, it can change itsdensity by as much as 25 percent; it can be as brittle as glass or as malleable as alu-minum; it expands when it solidifies; and its freshly-machined silvery surface will
tarnish in minutes, producing nearly every color in the rainbow. To make matters evenmore complex, plutonium ages from the outside in and from the inside out. It reacts vigor-ously with its environment—particularly with oxygen, hydrogen, and water—thereby,degrading its properties from the surface to the interior over time. In addition, plutonium’scontinuous radioactive decay causes self-irradiation damage that can fundamentally changeits properties over time. Only physicists would think of using such a material.
In the periodic table, plutonium is element 94, and it fits near the middle of the actinide series (ranging from thorium to lawrencium, atomic numbers 90 to 103). Plutonium is ofpractical interest principally because the 239 isotope has attractive nuclear properties forenergy production and nuclear explosives. Manhattan Project physicists managed to extractthe more than millionfold advantage of plutonium over conventional explosives. It was thechemists and metallurgists who learned how to extract plutonium, fabricate it, and keep itsound until the time of detonation. The Manhattan Project history of plutonium metallurgyrecently published by Edward Hammel (1998) is a remarkable tale of scientific and engi-neering achievement. These pioneers were working with a metal whose electronic structureand consequent engineering properties were even more puzzling than its nuclear properties.In a remarkably short period, they learned enough to accomplish their goal and left the restfor us to decipher.
The end of the Cold War has signaled a dramatic change in the nuclear weapons pro-grams of the nuclear powers. The challenge now is to help reduce the size of the nucleararsenals while ensuring that the nuclear weapons are safe and reliable into the indefinitefuture—without nuclear testing and without a continuous cycle of new nuclear weaponsdevelopment and deployment. Therefore, extending the lifetimes of plutonium componentsis more important now than in the past. Similarly, remanufacturing plutonium componentsfor existing weapons systems has become a greater challenge because no new plutoniumcomponents have been fabricated for almost 12 years. Moreover, the manufacturing facilities no longer exist, and most of the technical experts have now retired. The long-term behavior of plutonium is also important at the back end of the nuclear weaponscycle—the dismantlement and disposition phases. Because many thousands of nuclearweapons are being withdrawn from the nuclear arsenals of Russia and the United States,we must deal with excess plutonium recovered from these warheads. But the reactive and continuously changing nature of plutonium makes this task a serious challenge. Com-pounding this challenge is the fact that excess weapons plutonium must be carefullysecured against diversion or theft. Burning as fuel in nuclear reactors and geologic disposition are the most likely methods for its eventual disposal. In either case, plutoniummust be stored for decades or longer. It has therefore become imperative that we under-stand the aging of plutonium and of its alloys or compounds. And if we are to accomplishthis goal, the next generation of scientists and engineers must become deeply involved in deciphering the complexities of plutonium.
Plutonium and Its Alloys
Both this article and “MechanicalBehavior of Plutonium and Its Alloys”(page 336) describe the fascinatingmysteries of plutonium metallurgy in aforum open to the research communitywith the hope of attracting those youngmen and women into plutonium research. At Los Alamos, we are tryingto move from an empirical approach toone based on fundamental principles.At the moment, however, our knowl-edge rests with the practitioners—andmost of our experienced plutoniumpractitioners have retired or are nearingretirement. To develop a solid funda-mental understanding of plutonium, weneed the most modern ideas and toolsfrom the international scientific researchcommunity. We can then apply this un-derstanding to our practical problems,many of which must naturally remainsecret to the public.
The Unusual Properties of Plutonium
Here, I will describe how plutoniumis unusual before tackling the questionof why it is so.
Manhattan Project pioneers werepuzzled by plutonium’s unusual behav-ior right from the beginning. As soonas they received sufficient amounts ofthe new element to measure its density,they found unexplained variations rang-ing from 8 to 24 grams per cubiccentimeter (g/cm3)—see the article“The Taming of ‘49’” on page 48.Also, some tiny samples were as mal-leable as aluminum, whereas otherswere as brittle as glass. The list of remarkable properties is quite long (seethe box “The Unusual Properties ofPlutonium” on page 294), but it wasonly after the war that those propertieswere studied systematically.
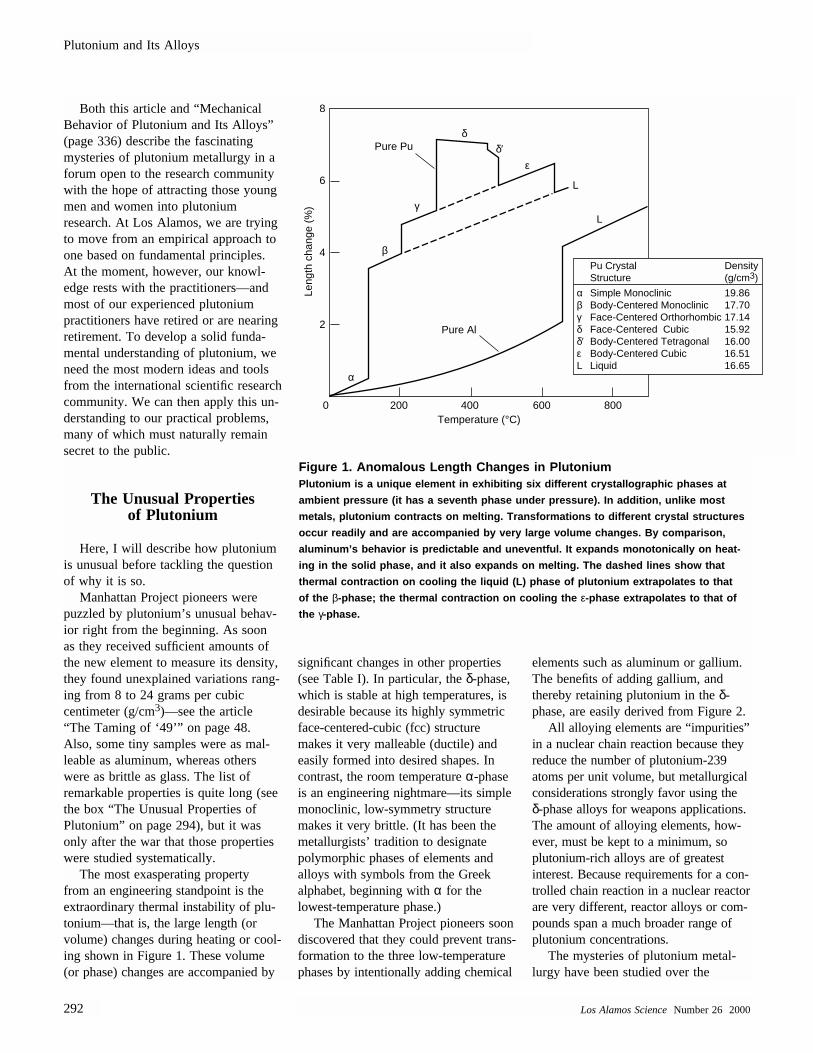
The most exasperating property from an engineering standpoint is theextraordinary thermal instability of plu-tonium—that is, the large length (orvolume) changes during heating or cool-ing shown in Figure 1. These volume(or phase) changes are accompanied by
significant changes in other properties(see Table I). In particular, the δ-phase,which is stable at high temperatures, isdesirable because its highly symmetricface-centered-cubic (fcc) structuremakes it very malleable (ductile) andeasily formed into desired shapes. Incontrast, the room temperature α-phaseis an engineering nightmare—its simplemonoclinic, low-symmetry structuremakes it very brittle. (It has been themetallurgists’ tradition to designatepolymorphic phases of elements and alloys with symbols from the Greek alphabet, beginning with α for the lowest-temperature phase.)
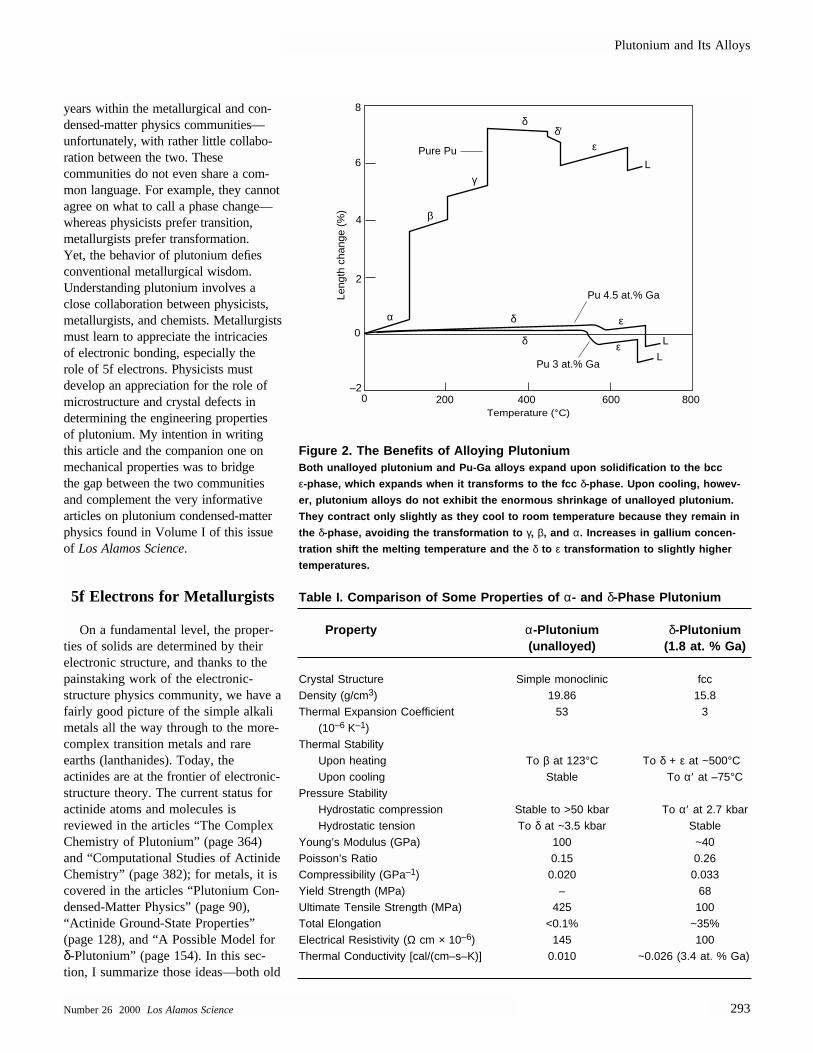
The Manhattan Project pioneers soondiscovered that they could prevent trans-formation to the three low-temperaturephases by intentionally adding chemical
elements such as aluminum or gallium.The benefits of adding gallium, andthereby retaining plutonium in the δ-phase, are easily derived from Figure 2.
All alloying elements are “impurities”in a nuclear chain reaction because theyreduce the number of plutonium-239atoms per unit volume, but metallurgicalconsiderations strongly favor using theδ-phase alloys for weapons applications.The amount of alloying elements, how-ever, must be kept to a minimum, soplutonium-rich alloys are of greatest interest. Because requirements for a con-trolled chain reaction in a nuclear reactorare very different, reactor alloys or com-pounds span a much broader range ofplutonium concentrations.
The mysteries of plutonium metal-lurgy have been studied over the
Plutonium and Its Alloys
292 Los Alamos ScienceNumber 26 2000
Figure 1. Anomalous Length Changes in PlutoniumPlutonium is a unique element in exhibiting six different crystallographic phases at
ambient pressure (it has a seventh phase under pressure). In addition, unlike most
metals, plutonium contracts on melting. Transformations to different crystal structures
occur readily and are accompanied by very large volume changes. By comparison,
aluminum’s behavior is predictable and uneventful. It expands monotonically on heat-
ing in the solid phase, and it also expands on melting. The dashed lines show that
thermal contraction on cooling the liquid (L) phase of plutonium extrapolates to that
of the β-phase; the thermal contraction on cooling the ε-phase extrapolates to that of
the γ-phase.
8
6
4
2
0 200Temperature (°C)
Leng
th c
hang
e (%
)
400 600 800
α
β
γ
δ
ε
L
L
Pure Pu
Pure Al
δ′
Pu Crystal DensityStructure (g/cm3)
α Simple Monoclinic 19.86β Body-Centered Monoclinic 17.70γ Face-Centered Orthorhombic 17.14δ Face-Centered Cubic 15.92δ′ Body-Centered Tetragonal 16.00ε Body-Centered Cubic 16.51L Liquid 16.65
years within the metallurgical and con-densed-matter physics communities—unfortunately, with rather little collabo-ration between the two. Thesecommunities do not even share a com-mon language. For example, they cannotagree on what to call a phase change—whereas physicists prefer transition,metallurgists prefer transformation. Yet, the behavior of plutonium defiesconventional metallurgical wisdom. Understanding plutonium involves aclose collaboration between physicists,metallurgists, and chemists. Metallurgistsmust learn to appreciate the intricaciesof electronic bonding, especially the role of 5f electrons. Physicists must develop an appreciation for the role ofmicrostructure and crystal defects in determining the engineering propertiesof plutonium. My intention in writingthis article and the companion one onmechanical properties was to bridge the gap between the two communitiesand complement the very informative articles on plutonium condensed-matterphysics found in Volume I of this issueof Los Alamos Science.
5f Electrons for Metallurgists
On a fundamental level, the proper-ties of solids are determined by theirelectronic structure, and thanks to thepainstaking work of the electronic-structure physics community, we have afairly good picture of the simple alkalimetals all the way through to the more-complex transition metals and rareearths (lanthanides). Today, the actinides are at the frontier of electronic-structure theory. The current status foractinide atoms and molecules isreviewed in the articles “The ComplexChemistry of Plutonium” (page 364)and “Computational Studies of ActinideChemistry” (page 382); for metals, it iscovered in the articles “Plutonium Con-densed-Matter Physics” (page 90), “Actinide Ground-State Properties”(page 128), and “A Possible Model forδ-Plutonium” (page 154). In this sec-tion, I summarize those ideas—both old
Plutonium and Its Alloys
Number 26 2000 Los Alamos Science 293
Figure 2. The Benefits of Alloying PlutoniumBoth unalloyed plutonium and Pu-Ga alloys expand upon solidification to the bcc
ε-phase, which expands when it transforms to the fcc δ-phase. Upon cooling, howev-
er, plutonium alloys do not exhibit the enormous shrinkage of unalloyed plutonium.
They contract only slightly as they cool to room temperature because they remain in
the δ-phase, avoiding the transformation to γ, β, and α. Increases in gallium concen-
tration shift the melting temperature and the δ to ε transformation to slightly higher
temperatures.
–20 200
Temperature (°C)
Leng
th c
hang
e (%
)
400 600 800
α
β
γ
δ
δ
δ
ε
ε
ε
L
L
L
Pure Pu
Pu 4.5 at.% Ga
Pu 3 at.% Ga
δ′
8
6
4
2
0
Table I. Comparison of Some Properties of α- and δ-Phase Plutonium
Property α-Plutonium δ-Plutonium(unalloyed) (1.8 at. % Ga)
Crystal Structure Simple monoclinic fccDensity (g/cm3) 19.86 15.8Thermal Expansion Coefficient 53 3
(10–6 K–1)Thermal Stability
Upon heating To β at 123°C To δ + ε at ~500°CUpon cooling Stable To α′ at –75°C
Pressure StabilityHydrostatic compression Stable to >50 kbar To α′ at 2.7 kbarHydrostatic tension To δ at ~3.5 kbar Stable
Young’s Modulus (GPa) 100 ~40Poisson’s Ratio 0.15 0.26Compressibility (GPa–1) 0.020 0.033Yield Strength (MPa) – 68Ultimate Tensile Strength (MPa) 425 100Total Elongation <0.1% ~35%Electrical Resistivity (Ω cm × 10–6) 145 100Thermal Conductivity [cal/(cm–s–K)] 0.010 ~0.026 (3.4 at. % Ga)
Plutonium and Its Alloys
294 Los Alamos ScienceNumber 26 2000
The Unusual Properties of Plutonium
Tem
pera
ture
(°C
)
Liquid
bcc
Orthorhombic
fccfcc
dhcp
Elements
Com
plexcubic
Ortho.
Ortho.
Tetragonal
Monoclinic
Monoclinic
Tetragonal
αβγ
δδ′
ε
T (K)
T (°C)
Mag
netic
sus
cept
ibili
ty (
emu/
mol
e)
x (e
mu/
mol
e)
UBe13
Pu inset
α-Pu δ-Pu
Most metals—Nb, Mo, Ta, Hf,Pt, Na, K, Rb
α β γ δ εδ'
PuU He
VacancySelf-Interstitial Frenkel Pair
U Range 12 nm
Cascade Size 7.5 nm
Helium Range 10 µm
0.8 µm
86 keV 5 MeV
2290 Frenkel Pairs 265 Frenkel Pairs
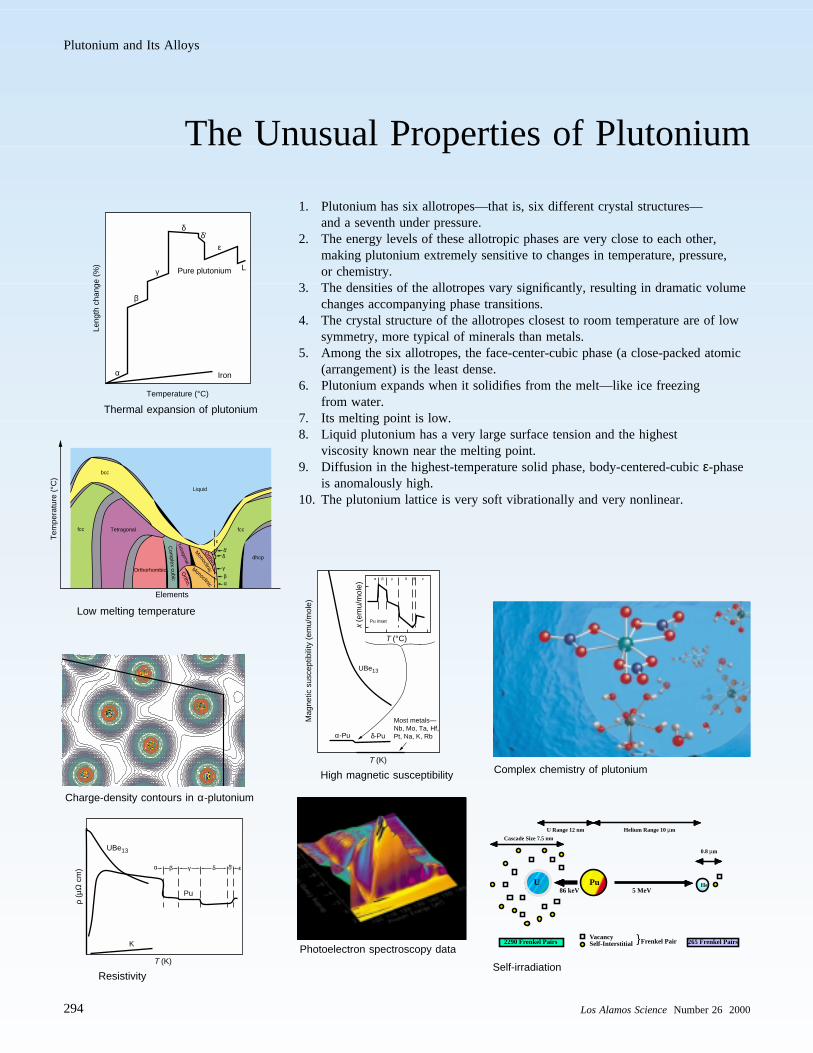
1. Plutonium has six allotropes—that is, six different crystal structures—and a seventh under pressure.
2. The energy levels of these allotropic phases are very close to each other, making plutonium extremely sensitive to changes in temperature, pressure, or chemistry.
3. The densities of the allotropes vary significantly, resulting in dramatic volume changes accompanying phase transitions.
4. The crystal structure of the allotropes closest to room temperature are of low symmetry, more typical of minerals than metals.
5. Among the six allotropes, the face-center-cubic phase (a close-packed atomic (arrangement) is the least dense.
6. Plutonium expands when it solidifies from the melt—like ice freezing from water.
7. Its melting point is low.8. Liquid plutonium has a very large surface tension and the highest
viscosity known near the melting point.9. Diffusion in the highest-temperature solid phase, body-centered-cubic ε-phase
is anomalously high.10. The plutonium lattice is very soft vibrationally and very nonlinear.
T (K)
K
Pu
UBe13
ρ (µ
Ω c
m) α β γ δ εδ'
Temperature (°C)
Leng
th c
hang
e (%
)
α
β
γ
δ
ε
L
Iron
Pure plutonium
δ'
Low melting temperature
Charge-density contours in α-plutonium
Complex chemistry of plutonium
Photoelectron spectroscopy data
Self-irradiationResistivity
High magnetic susceptibility
Thermal expansion of plutonium
Plutonium and Its Alloys
Number 26 2000 Los Alamos Science 295
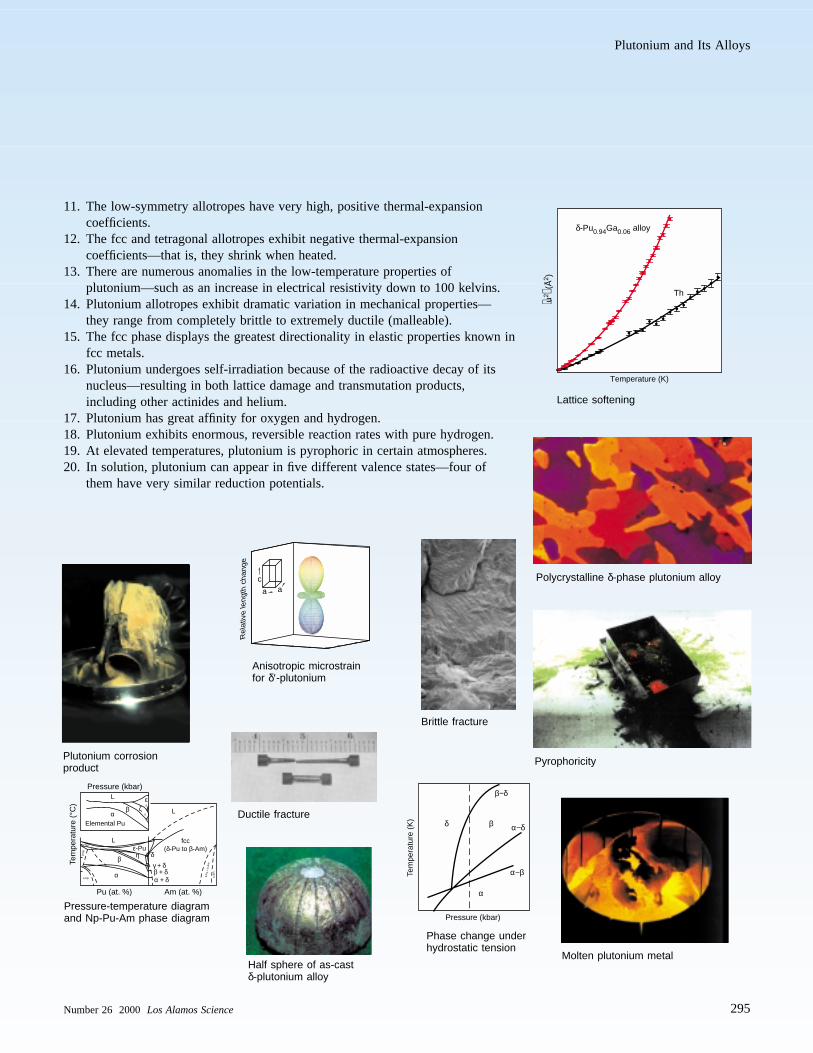
11. The low-symmetry allotropes have very high, positive thermal-expansion coefficients.
12. The fcc and tetragonal allotropes exhibit negative thermal-expansion coefficients—that is, they shrink when heated.
13. There are numerous anomalies in the low-temperature properties of plutonium—such as an increase in electrical resistivity down to 100 kelvins.
14. Plutonium allotropes exhibit dramatic variation in mechanical properties—they range from completely brittle to extremely ductile (malleable).
15. The fcc phase displays the greatest directionality in elastic properties known infcc metals.
16. Plutonium undergoes self-irradiation because of the radioactive decay of its nucleus—resulting in both lattice damage and transmutation products, including other actinides and helium.
17. Plutonium has great affinity for oxygen and hydrogen. 18. Plutonium exhibits enormous, reversible reaction rates with pure hydrogen. 19. At elevated temperatures, plutonium is pyrophoric in certain atmospheres. 20. In solution, plutonium can appear in five different valence states—four of
them have very similar reduction potentials.
caa
Rel
ativ
e le
ngth
cha
nge
Pressure (kbar)
Tem
pera
ture
(K
)
β−δ
β
α
δ α−δ
α−β
Temperature (K)
⟨u2 ⟩ (Å2 )
δ-Pu0.94Ga0.06 alloy
Th
Pressure (kbar)
L
L
L
δ′ζδ
ε
γ
βα
Elemental Pu
Tem
pera
ture
(°C
)
Pu (at. %) Am (at. %)
ε-Pu
β-N
p
α-Npα
βγ + δβ + δα + δ
γ-Npfcc
(δ-Pu to β-Am)
α-A
m
η
δ-P
u+
α-A
m
δ
Pyrophoricity
Brittle fracture
Anisotropic microstrain for δ′-plutonium
Lattice softening
Phase change under hydrostatic tension
Ductile fracture
Pressure-temperature diagramand Np-Pu-Am phase diagram
Polycrystalline δ-phase plutonium alloy
Molten plutonium metalHalf sphere of as-cast δ-plutonium alloy
Plutonium corrosion product
and new—that are crucial for metallur-gists to understand as they ponder overthe unusual behavior of plutonium andits alloys.
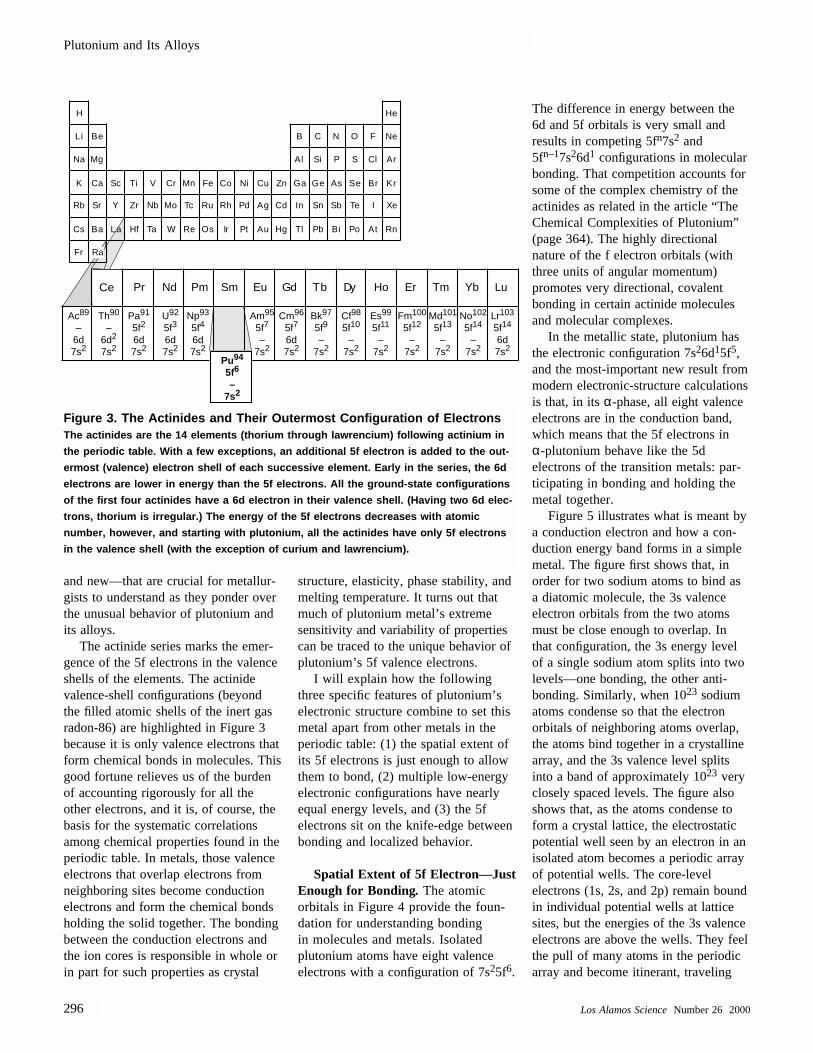
The actinide series marks the emer-gence of the 5f electrons in the valenceshells of the elements. The actinide valence-shell configurations (beyondthe filled atomic shells of the inert gasradon-86) are highlighted in Figure 3because it is only valence electrons thatform chemical bonds in molecules. Thisgood fortune relieves us of the burdenof accounting rigorously for all theother electrons, and it is, of course, thebasis for the systematic correlationsamong chemical properties found in theperiodic table. In metals, those valenceelectrons that overlap electrons fromneighboring sites become conductionelectrons and form the chemical bondsholding the solid together. The bondingbetween the conduction electrons andthe ion cores is responsible in whole orin part for such properties as crystal
structure, elasticity, phase stability, andmelting temperature. It turns out thatmuch of plutonium metal’s extremesensitivity and variability of propertiescan be traced to the unique behavior ofplutonium’s 5f valence electrons.
I will explain how the followingthree specific features of plutonium’selectronic structure combine to set thismetal apart from other metals in theperiodic table: (1) the spatial extent ofits 5f electrons is just enough to allowthem to bond, (2) multiple low-energyelectronic configurations have nearlyequal energy levels, and (3) the 5felectrons sit on the knife-edge betweenbonding and localized behavior.
Spatial Extent of 5f Electron—JustEnough for Bonding. The atomic orbitals in Figure 4 provide the foun-dation for understanding bonding in molecules and metals. Isolatedplutonium atoms have eight valenceelectrons with a configuration of 7s25f6.
The difference in energy between the6d and 5f orbitals is very small and results in competing 5fn7s2 and5fn–17s26d1 configurations in molecularbonding. That competition accounts forsome of the complex chemistry of theactinides as related in the article “TheChemical Complexities of Plutonium”(page 364). The highly directional nature of the f electron orbitals (withthree units of angular momentum) promotes very directional, covalentbonding in certain actinide moleculesand molecular complexes.
In the metallic state, plutonium hasthe electronic configuration 7s26d15f5,and the most-important new result frommodern electronic-structure calculationsis that, in its α-phase, all eight valenceelectrons are in the conduction band,which means that the 5f electrons in α-plutonium behave like the 5d electrons of the transition metals: par-ticipating in bonding and holding themetal together.
Figure 5 illustrates what is meant bya conduction electron and how a con-duction energy band forms in a simplemetal. The figure first shows that, inorder for two sodium atoms to bind asa diatomic molecule, the 3s valenceelectron orbitals from the two atomsmust be close enough to overlap. Inthat configuration, the 3s energy levelof a single sodium atom splits into twolevels—one bonding, the other anti-bonding. Similarly, when 1023 sodiumatoms condense so that the electron orbitals of neighboring atoms overlap,the atoms bind together in a crystallinearray, and the 3s valence level splitsinto a band of approximately 1023 veryclosely spaced levels. The figure alsoshows that, as the atoms condense toform a crystal lattice, the electrostaticpotential well seen by an electron in anisolated atom becomes a periodic arrayof potential wells. The core-level electrons (1s, 2s, and 2p) remain boundin individual potential wells at latticesites, but the energies of the 3s valenceelectrons are above the wells. They feelthe pull of many atoms in the periodicarray and become itinerant, traveling
Plutonium and Its Alloys
296 Los Alamos ScienceNumber 26 2000
Figure 3. The Actinides and Their Outermost Configuration of ElectronsThe actinides are the 14 elements (thorium through lawrencium) following actinium in
the periodic table. With a few exceptions, an additional 5f electron is added to the out-
ermost (valence) electron shell of each successive element. Early in the series, the 6d
electrons are lower in energy than the 5f electrons. All the ground-state configurations
of the first four actinides have a 6d electron in their valence shell. (Having two 6d elec-
trons, thorium is irregular.) The energy of the 5f electrons decreases with atomic
number, however, and starting with plutonium, all the actinides have only 5f electrons
in the valence shell (with the exception of curium and lawrencium).
Pr Nd Pm Sm Eu Gd Tb Dy Ho Er Tm Yb Lu
H
Li Be
Na Mg
He
B C N O F Ne
Al Si P S Cl Ar
K Ca Sc Ti V Cr Mn Fe Co Ni Cu Zn Ga Ge As Se Br Kr
Rb Sr Y Zr Nb Mo Tc Ru Rh Pd Ag Cd In Sn Sb Te I Xe
Cs Ba Hf Ta W Re Os Ir Pt Au Hg Tl Pb Bi Po At Rn
Fr
La
Pu94
5f6
–7s2
Pa91
5f2
6d7s2
Th90
–6d2
7s2
Ac89
–6d7s2
U92
5f3
6d7s2
Np93
5f4
6d7s2
Am95
5f7
–7s2
Cm96
5f7
6d7s2
Bk97
5f9
–7s2
Cf98
5f10
–7s2
Es99
5f11
–7s2
Fm100
5f12
–7s2
Md101
5f13
–7s2
No102
5f14
–7s2
Lr103
5f14
6d7s2
Ce
Ra
Plutonium and Its Alloys
Number 26 2000 Los Alamos Science 297
1.0
0.8
0.6
0.4
0.2
0.043210
Radius (Å)
6d
5f
7p
7s
RelativisticNonrelativistic
Pu3+
4f
5d
6s
6p
RelativisticNonrelativistic
Sm3+
1.0
1.2
0.8
0.6
0.4
0.2
0.0
P(R
)P
(R)
(e)
(f)
z
z
z
z
zz
y y yy y
x
z
y
x xx
x
s py
d3z2–r2 d
x2–y2 fxyz
fz3
––
–
+
++ +
++
+
––
–
––
–+
+
+–
+
(a) (b) (c) (d)
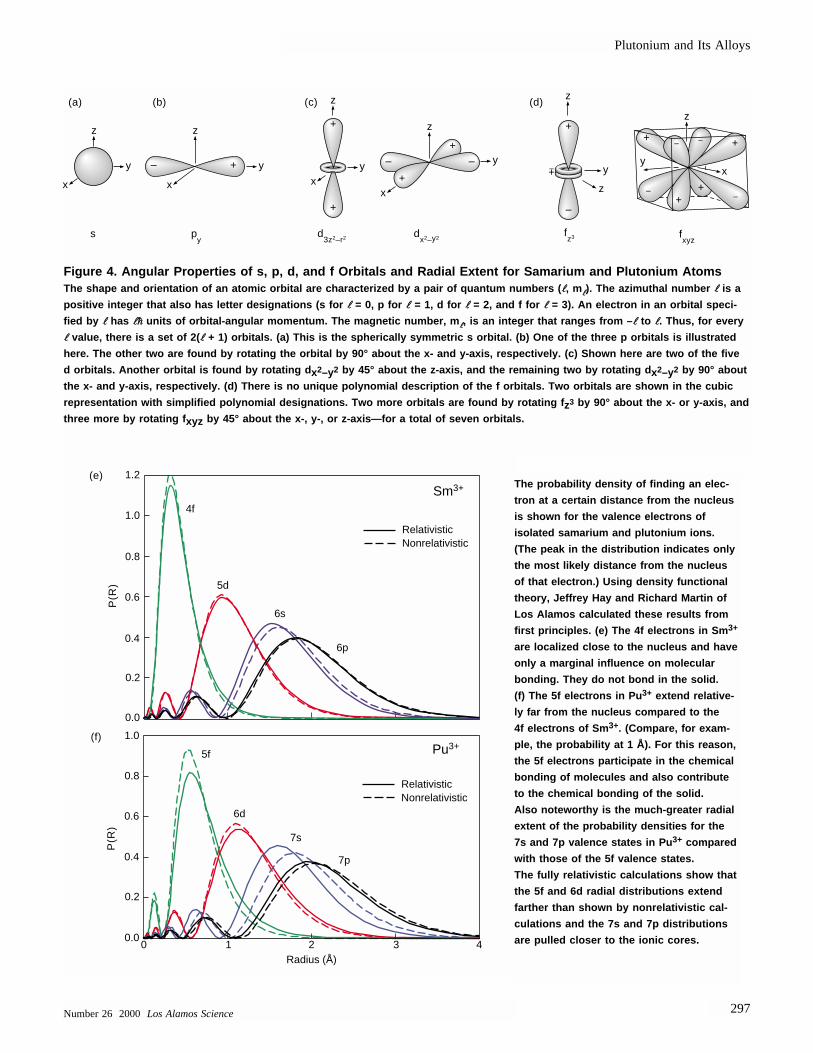
The probability density of finding an elec-
tron at a certain distance from the nucleus
is shown for the valence electrons of
isolated samarium and plutonium ions.
(The peak in the distribution indicates only
the most likely distance from the nucleus
of that electron.) Using density functional
theory, Jeffrey Hay and Richard Martin of
Los Alamos calculated these results from
first principles. (e) The 4f electrons in Sm 3+
are localized close to the nucleus and have
only a marginal influence on molecular
bonding. They do not bond in the solid.
(f) The 5f electrons in Pu 3+ extend relative-
ly far from the nucleus compared to the
4f electrons of Sm 3+. (Compare, for exam-
ple, the probability at 1 Å). For this reason,
the 5f electrons participate in the chemical
bonding of molecules and also contribute
to the chemical bonding of the solid.
Also noteworthy is the much-greater radial
extent of the probability densities for the
7s and 7p valence states in Pu 3+ compared
with those of the 5f valence states.
The fully relativistic calculations show that
the 5f and 6d radial distributions extend
farther than shown by nonrelativistic cal-
culations and the 7s and 7p distributions
are pulled closer to the ionic cores.
Figure 4. Angular Properties of s, p, d, and f Orbitals and Radial Extent for Samarium and Plutonium AtomsThe shape and orientation of an atomic orbital are characterized by a pair of quantum numbers ( ll, mll). The azimuthal number ll is a
positive integer that also has letter designations (s for ll = 0, p for ll = 1, d for ll = 2, and f for ll = 3). An electron in an orbital speci-
fied by ll has llhh units of orbital-angular momentum. The magnetic number, mll, is an integer that ranges from – ll to ll. Thus, for every
ll value, there is a set of 2( ll + 1) orbitals. (a) This is the spherically symmetric s orbital. (b) One of the three p orbitals is illustrated
here. The other two are found by rotating the orbital by 90° about the x- and y-axis, respectively. (c) Shown here are two of the five
d orbitals. Another orbital is found by rotating d x2–y2 by 45° about the z-axis, and the remaining two by rotating d x2–y2 by 90° about
the x- and y-axis, respectively. (d) There is no unique polynomial description of the f orbitals. Two orbitals are shown in the cubic
representation with simplified polynomial designations. Two more orbitals are found by rotating f z3 by 90° about the x- or y-axis, and
three more by rotating f xyz by 45° about the x-, y-, or z-axis—for a total of seven orbitals.
through the entire crystal. Looking at itanother way, we can say that the atomsin the solid are so close together thatthe individual 3s electron orbitals over-lap those of neighboring atoms. As aresult, a single electron has the proba-bility of hopping from neighbor toneighbor throughout the crystal lattice.
Figure 5 also shows that for twoatoms, the sum and difference of twooverlapping 3s atomic orbitals form thebonding and antibonding molecular orbitals, respectively, of the diatomic
molecule. In the solid, a 3s orbital fromeach lattice site combines with all theothers in all possible linear combina-tions to form a set of Bloch states, thesolid-state equivalent of molecular orbitals. Each Bloch state extends overthe entire crystal, and just like a molec-ular orbital, it can be occupied by twoelectrons at the most—one with spinup, the other with spin down. Figure 5shows a one-dimensional version of aBloch state. It is made up of the 3s wave functions at each atomic site
modulated by a plane wave. Because anelectron in a Bloch state has a probabil-ity to be anywhere in the crystal, it hasthe potential to conduct electricity whenan electric field is applied and is calleda conduction electron.
Although each of the 1023 Blochstates has a slightly different energy(thus satisfying the exclusion principlefor fermions), the levels are so close to each other that we treat them as acontinuum and talk about the numberof energy levels per unit energy, or
Plutonium and Its Alloys
298 Los Alamos ScienceNumber 26 2000
Na Atom
3s Wave Function
Electrostatic Potential
Energy Levels
s-Band Wave Function
(a)
(b)Na Metal
Periodic Potential
s Band Formation
Plane waveenvelope
3s Valencestate
2p
2s1s
Ene
rgy s Band-
width
EF
EF
Density of states
3s
A
B
3s2p 2p
AB
2s1s
2s1s
φ(3s)
φA
φB
Na Diatomic Molecule
3s BandstatesCore
states
Core states
Valence states
Bonding states
Antibonding states
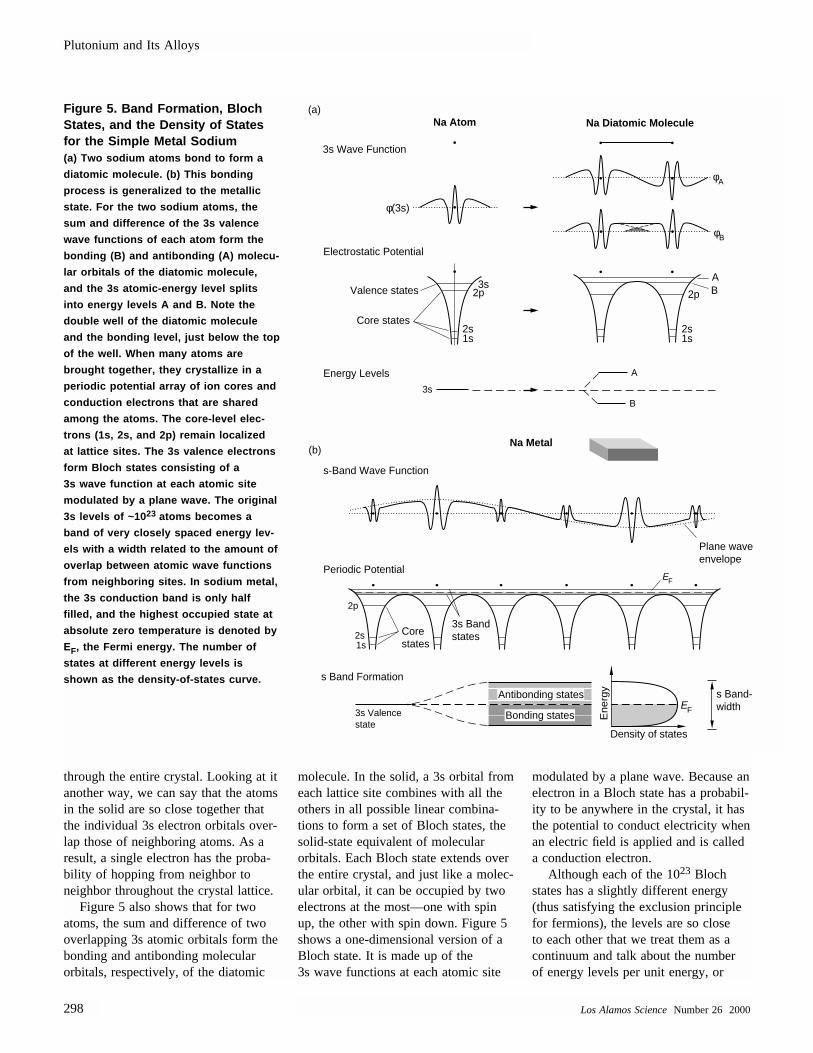
Figure 5. Band Formation, BlochStates, and the Density of Statesfor the Simple Metal Sodium (a) Two sodium atoms bond to form a
diatomic molecule. (b) This bonding
process is generalized to the metallic
state. For the two sodium atoms, the
sum and difference of the 3s valence
wave functions of each atom form the
bonding (B) and antibonding (A) molecu-
lar orbitals of the diatomic molecule,
and the 3s atomic-energy level splits
into energy levels A and B. Note the
double well of the diatomic molecule
and the bonding level, just below the top
of the well. When many atoms are
brought together, they crystallize in a
periodic potential array of ion cores and
conduction electrons that are shared
among the atoms. The core-level elec-
trons (1s, 2s, and 2p) remain localized
at lattice sites. The 3s valence electrons
form Bloch states consisting of a
3s wave function at each atomic site
modulated by a plane wave. The original
3s levels of ~10 23 atoms becomes a
band of very closely spaced energy lev-
els with a width related to the amount of
overlap between atomic wave functions
from neighboring sites. In sodium metal,
the 3s conduction band is only half
filled, and the highest occupied state at
absolute zero temperature is denoted by
EF, the Fermi energy. The number of
states at different energy levels is
shown as the density-of-states curve.
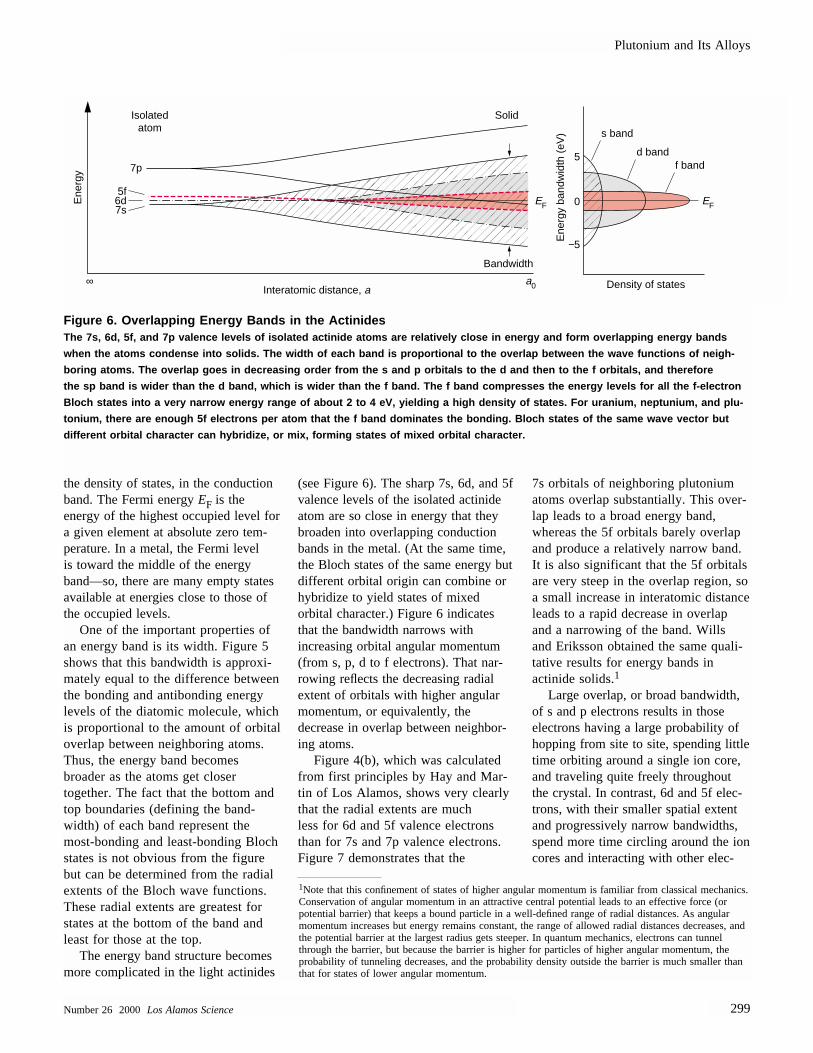
the density of states, in the conductionband. The Fermi energy EF is the energy of the highest occupied level fora given element at absolute zero tem-perature. In a metal, the Fermi level is toward the middle of the energyband—so, there are many empty statesavailable at energies close to those ofthe occupied levels.
One of the important properties ofan energy band is its width. Figure 5shows that this bandwidth is approxi-mately equal to the difference betweenthe bonding and antibonding energylevels of the diatomic molecule, whichis proportional to the amount of orbitaloverlap between neighboring atoms.Thus, the energy band becomes broader as the atoms get closer together. The fact that the bottom andtop boundaries (defining the band-width) of each band represent themost-bonding and least-bonding Blochstates is not obvious from the figurebut can be determined from the radialextents of the Bloch wave functions.These radial extents are greatest forstates at the bottom of the band andleast for those at the top.
The energy band structure becomesmore complicated in the light actinides
(see Figure 6). The sharp 7s, 6d, and 5fvalence levels of the isolated actinideatom are so close in energy that theybroaden into overlapping conductionbands in the metal. (At the same time,the Bloch states of the same energy butdifferent orbital origin can combine orhybridize to yield states of mixed orbital character.) Figure 6 indicatesthat the bandwidth narrows with increasing orbital angular momentum(from s, p, d to f electrons). That nar-rowing reflects the decreasing radialextent of orbitals with higher angularmomentum, or equivalently, the decrease in overlap between neighbor-ing atoms.
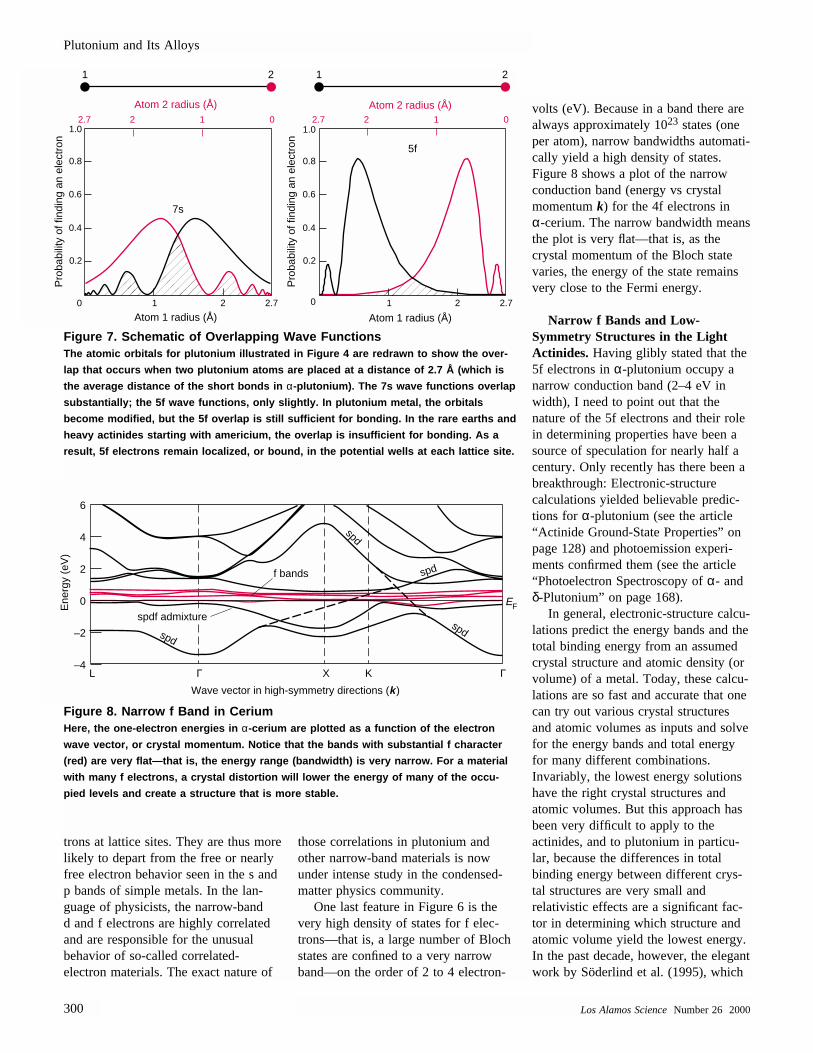
Figure 4(b), which was calculatedfrom first principles by Hay and Mar-tin of Los Alamos, shows very clearlythat the radial extents are much less for 6d and 5f valence electronsthan for 7s and 7p valence electrons.Figure 7 demonstrates that the
7s orbitals of neighboring plutoniumatoms overlap substantially. This over-lap leads to a broad energy band,whereas the 5f orbitals barely overlapand produce a relatively narrow band.It is also significant that the 5f orbitalsare very steep in the overlap region, so a small increase in interatomic distanceleads to a rapid decrease in overlapand a narrowing of the band. Wills and Eriksson obtained the same quali-tative results for energy bands inactinide solids.1
Large overlap, or broad bandwidth,of s and p electrons results in thoseelectrons having a large probability ofhopping from site to site, spending littletime orbiting around a single ion core,and traveling quite freely throughoutthe crystal. In contrast, 6d and 5f elec-trons, with their smaller spatial extentand progressively narrow bandwidths,spend more time circling around the ioncores and interacting with other elec-
Plutonium and Its Alloys
Number 26 2000 Los Alamos Science 299
5f6d7s
7p
a0∞
Isolatedatom
Interatomic distance, a
Ene
rgy
Solid
f band
Bandwidth
EF EF
−5
5
0
Density of states
Ene
rgy
band
wid
th (
eV)
d band
s band
Figure 6. Overlapping Energy Bands in the Actinides The 7s, 6d, 5f, and 7p valence levels of isolated actinide atoms are relatively close in energy and form overlapping energy ban ds
when the atoms condense into solids. The width of each band is proportional to the overlap between the wave functions of neigh-
boring atoms. The overlap goes in decreasing order from the s and p orbitals to the d and then to the f orbitals, and therefore
the sp band is wider than the d band, which is wider than the f band. The f band compresses the energy levels for all the f-ele ctron
Bloch states into a very narrow energy range of about 2 to 4 eV, yielding a high density of states. For uranium, neptunium, and plu-
tonium, there are enough 5f electrons per atom that the f band dominates the bonding. Bloch states of the same wave vector but
different orbital character can hybridize, or mix, forming states of mixed orbital character.
1Note that this confinement of states of higher angular momentum is familiar from classical mechanics.Conservation of angular momentum in an attractive central potential leads to an effective force (or potential barrier) that keeps a bound particle in a well-defined range of radial distances. As angular momentum increases but energy remains constant, the range of allowed radial distances decreases, andthe potential barrier at the largest radius gets steeper. In quantum mechanics, electrons can tunnelthrough the barrier, but because the barrier is higher for particles of higher angular momentum, theprobability of tunneling decreases, and the probability density outside the barrier is much smaller thanthat for states of lower angular momentum.
trons at lattice sites. They are thus morelikely to depart from the free or nearlyfree electron behavior seen in the s andp bands of simple metals. In the lan-guage of physicists, the narrow-band d and f electrons are highly correlatedand are responsible for the unusual behavior of so-called correlated-electron materials. The exact nature of
those correlations in plutonium andother narrow-band materials is nowunder intense study in the condensed-matter physics community.
One last feature in Figure 6 is thevery high density of states for f elec-trons—that is, a large number of Blochstates are confined to a very narrowband—on the order of 2 to 4 electron-
volts (eV). Because in a band there arealways approximately 1023 states (oneper atom), narrow bandwidths automati-cally yield a high density of states.Figure 8 shows a plot of the narrowconduction band (energy vs crystal momentum k) for the 4f electrons in α-cerium. The narrow bandwidth meansthe plot is very flat—that is, as thecrystal momentum of the Bloch statevaries, the energy of the state remainsvery close to the Fermi energy.
Narrow f Bands and Low-Symmetry Structures in the LightActinides. Having glibly stated that the5f electrons in α-plutonium occupy anarrow conduction band (2–4 eV inwidth), I need to point out that the nature of the 5f electrons and their rolein determining properties have been asource of speculation for nearly half acentury. Only recently has there been abreakthrough: Electronic-structure calculations yielded believable predic-tions for α-plutonium (see the article“Actinide Ground-State Properties” onpage 128) and photoemission experi-ments confirmed them (see the article“Photoelectron Spectroscopy of α- andδ-Plutonium” on page 168).
In general, electronic-structure calcu-lations predict the energy bands and thetotal binding energy from an assumedcrystal structure and atomic density (orvolume) of a metal. Today, these calcu-lations are so fast and accurate that onecan try out various crystal structuresand atomic volumes as inputs and solvefor the energy bands and total energyfor many different combinations. Invariably, the lowest energy solutionshave the right crystal structures andatomic volumes. But this approach hasbeen very difficult to apply to the actinides, and to plutonium in particu-lar, because the differences in totalbinding energy between different crys-tal structures are very small andrelativistic effects are a significant fac-tor in determining which structure andatomic volume yield the lowest energy.In the past decade, however, the elegantwork by Söderlind et al. (1995), which
Plutonium and Its Alloys
300 Los Alamos ScienceNumber 26 2000
1.0
0.8
0.6
0.4
0.2
0 2 2.71
Atom 2 radius (Å)
7s
Pro
babi
lity
of fi
ndin
g an
ele
ctro
n
1.0
0.8
0.6
0.4
0.2
0 2 2.71
0122.7
Atom 2 radius (Å)
Atom 1 radius (Å) Atom 1 radius (Å)
5f
01
1 2
22.7
Pro
babi
lity
of fi
ndin
g an
ele
ctro
n
1 2
Figure 7. Schematic of Overlapping Wave FunctionsThe atomic orbitals for plutonium illustrated in Figure 4 are redrawn to show the over-
lap that occurs when two plutonium atoms are placed at a distance of 2.7 Å (which is
the average distance of the short bonds in α-plutonium). The 7s wave functions overlap
substantially; the 5f wave functions, only slightly. In plutonium metal, the orbitals
become modified, but the 5f overlap is still sufficient for bonding. In the rare earths and
heavy actinides starting with americium, the overlap is insufficient for bonding. As a
result, 5f electrons remain localized, or bound, in the potential wells at each lattice site.
6
4
2
0
–2
–4
Ene
rgy
(eV
)
EF
spd
spd
spd
spd
spdf admixture
f bands
L X
Wave vector in high-symmetry directions (k )
KΓ Γ
Figure 8. Narrow f Band in Cerium Here, the one-electron energies in α-cerium are plotted as a function of the electron
wave vector, or crystal momentum. Notice that the bands with substantial f character
(red) are very flat—that is, the energy range (bandwidth) is very narrow. For a material
with many f electrons, a crystal distortion will lower the energy of many of the occu-
pied levels and create a structure that is more stable.
incorporates most of the physics that isdifficult to calculate (for example, low-symmetry structures and the relativisticmotion of core electrons), demonstratesconvincingly that the 5f electrons arebonding in α-plutonium.
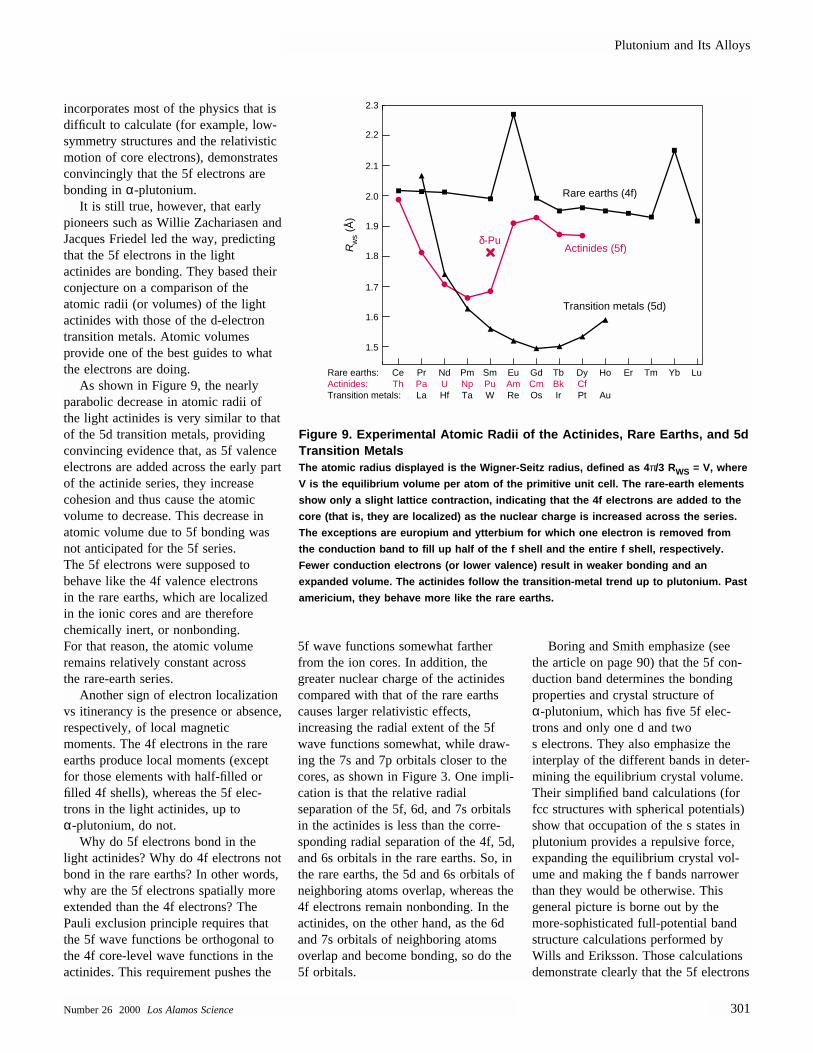
It is still true, however, that early pioneers such as Willie Zachariasen andJacques Friedel led the way, predictingthat the 5f electrons in the light actinides are bonding. They based theirconjecture on a comparison of theatomic radii (or volumes) of the lightactinides with those of the d-electrontransition metals. Atomic volumes provide one of the best guides to whatthe electrons are doing.
As shown in Figure 9, the nearlyparabolic decrease in atomic radii ofthe light actinides is very similar to thatof the 5d transition metals, providingconvincing evidence that, as 5f valenceelectrons are added across the early partof the actinide series, they increase cohesion and thus cause the atomic volume to decrease. This decrease inatomic volume due to 5f bonding wasnot anticipated for the 5f series. The 5f electrons were supposed to behave like the 4f valence electrons in the rare earths, which are localizedin the ionic cores and are thereforechemically inert, or nonbonding. For that reason, the atomic volume remains relatively constant across the rare-earth series.
Another sign of electron localizationvs itinerancy is the presence or absence,respectively, of local magnetic moments. The 4f electrons in the rareearths produce local moments (exceptfor those elements with half-filled orfilled 4f shells), whereas the 5f elec-trons in the light actinides, up toα-plutonium, do not.
Why do 5f electrons bond in thelight actinides? Why do 4f electrons notbond in the rare earths? In other words,why are the 5f electrons spatially moreextended than the 4f electrons? ThePauli exclusion principle requires thatthe 5f wave functions be orthogonal tothe 4f core-level wave functions in theactinides. This requirement pushes the
5f wave functions somewhat fartherfrom the ion cores. In addition, thegreater nuclear charge of the actinidescompared with that of the rare earthscauses larger relativistic effects, increasing the radial extent of the 5fwave functions somewhat, while draw-ing the 7s and 7p orbitals closer to thecores, as shown in Figure 3. One impli-cation is that the relative radialseparation of the 5f, 6d, and 7s orbitalsin the actinides is less than the corre-sponding radial separation of the 4f, 5d,and 6s orbitals in the rare earths. So, inthe rare earths, the 5d and 6s orbitals ofneighboring atoms overlap, whereas the4f electrons remain nonbonding. In theactinides, on the other hand, as the 6dand 7s orbitals of neighboring atomsoverlap and become bonding, so do the5f orbitals.
Boring and Smith emphasize (seethe article on page 90) that the 5f con-duction band determines the bondingproperties and crystal structure of α-plutonium, which has five 5f elec-trons and only one d and two s electrons. They also emphasize the interplay of the different bands in deter-mining the equilibrium crystal volume.Their simplified band calculations (forfcc structures with spherical potentials)show that occupation of the s states inplutonium provides a repulsive force,expanding the equilibrium crystal vol-ume and making the f bands narrowerthan they would be otherwise. Thisgeneral picture is borne out by themore-sophisticated full-potential bandstructure calculations performed byWills and Eriksson. Those calculationsdemonstrate clearly that the 5f electrons
Plutonium and Its Alloys
Number 26 2000 Los Alamos Science 301
1.5
1.6
1.7
1.8
1.9
2.1
2.2
2.3
2.0
Rw
s (Å
)
Actinides (5f)
CeTh
Rare earths:Actinides:Transition metals:
PrPaLa
NdUHf
PmNpTa
SmPuW
EuAmRe
GdCmOs
TbBkIr
DyCfPt
Ho
Au
Er Tm Yb Lu
Rare earths (4f)
Transition metals (5d)
δ-Pu
Figure 9. Experimental Atomic Radii of the Actinides, Rare Earths, and 5dTransition Metals The atomic radius displayed is the Wigner-Seitz radius, defined as 4 π/3 RWS = V, where
V is the equilibrium volume per atom of the primitive unit cell. The rare-earth elements
show only a slight lattice contraction, indicating that the 4f electrons are added to the
core (that is, they are localized) as the nuclear charge is increased across the series.
The exceptions are europium and ytterbium for which one electron is removed from
the conduction band to fill up half of the f shell and the entire f shell, respectively.
Fewer conduction electrons (or lower valence) result in weaker bonding and an
expanded volume. The actinides follow the transition-metal trend up to plutonium. Past
americium, they behave more like the rare earths.
in the light actinides extend just farenough to overlap and form narrowconduction bands, whereas the 4f elec-trons in the rare earths do not.
The calculations of Söderlind et al.(1995) also demonstrate how those narrow 5f bands stabilize low-symmetrystructures. Until recently, the low-symmetry ground-state crystal structuresand many other peculiar properties inthe light actinides up to α-plutoniumwere attributed to the highly directionalnature of the f-electron orbitals (see Figure 3). That orbital directionality wasbelieved to cause covalent-like direc-tional bonding (that is, electron chargebuildup between the ion cores) in thesolid. But band structure calculationsshow no charge buildup between the ioncores, refuting the original assumption.
Instead, Söderlind et al. show that itis the narrowness of the 5f conductionband that favors the stability of low-symmetry structures. As shown inFigure 8, a narrow energy band has avery large number of occupied states(high density of states) right below theFermi energy. If the crystal structure is
highly symmetric, the conduction bandsare degenerate in high-symmetry direc-tions—that is, there are two (or more)states of equal energy for each value ofthe crystal momentum. However, a dis-tortion to a tetragonal, orthorhombic, ormonoclinic lattice will split the degener-ate portion of the band into two (ormore) bands—one lower and the otherhigher in energy. If the band is narrow,the distortion will lower the energy ofbillions of occupied states (there areabout a billion states within 10–14 eV ofthe Fermi energy), thereby tending tolower the total binding energy of the sample. This effect is demonstratedin Figure 11 on page 143 of the article“Actinide Ground-State Properties.”
A competing influence is the electro-static, or Madelung, energy (the result ofconduction electrons not completelyshielding the ion cores on the latticesites). The Madelung energy is lowestfor high-symmetry crystal structures, andit increases if the lattice is distorted.Thus, for moderate and wide bands(moderate to low density of states nearthe Fermi level), the Madelung energy,
which favors high symmetry, wins out,and no distortion occurs. In narrow-bandmaterials, the opposite is true.
Peierls (1955) was the first to sug-gest that lowering the symmetry of aone-dimensional lattice could lower theenergy and increase stability, and Heine(1969) made a similar suggestion for s-p electron metals such as mercury,gallium, and indium, which also exhibitlattice distortions that favor low-symmetry structures. Söderlind et al.(1995) showed that, by forcing transi-tion metals or p-bonded metals to havenarrow bands (that is, by assuming anunnaturally large separation betweenatoms), the low-symmetry structure becomes the lowest-energy structurealthough no f electrons are involved.
One might argue that cerium pro-vides a counter example to the rule thatnarrow bands favor low-symmetrystructures. Cerium transforms from the fcc γ-phase to the much denser fccα-phase when the temperature is low-ered or the pressure is increased.Johansson (1974) suggested that thistransition occurs because localized f states in the fcc γ-phase become itiner-ant (Bloch) states in the fcc α-phase,forming a narrow f band and increasingthe bonding. (This transition is similarto the Mott insulator-to-metal transition,except only the f electrons are involved.) Thus, the existence of a narrow f band in the highly symmetricfcc α-phase of cerium seems to contra-dict the rule that narrow bands producelow-symmetry structures. However, in cerium, there is less than one full f electron per atom that can bond, com-pared with two s electrons and one d electron per atom. Hence, the s and d electrons, which favor high-symmetrystructures, play a dominant role in determining crystal structure.
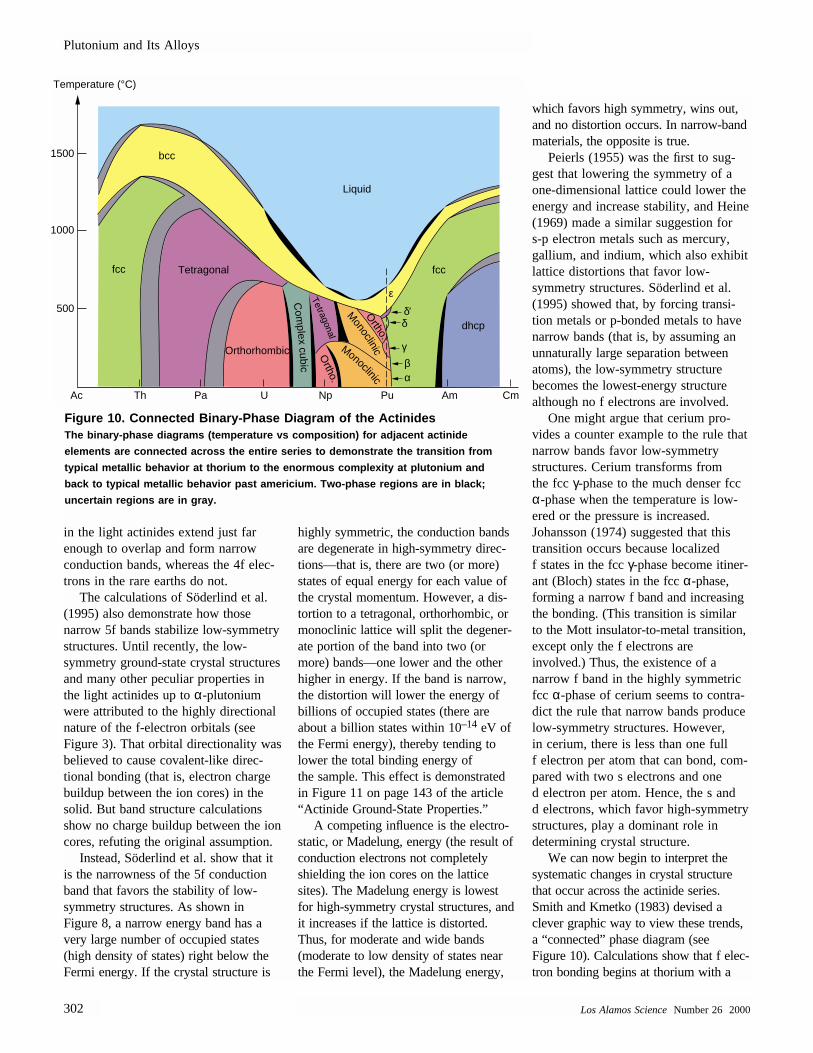
We can now begin to interpret thesystematic changes in crystal structurethat occur across the actinide series.Smith and Kmetko (1983) devised aclever graphic way to view these trends,a “connected” phase diagram (see Figure 10). Calculations show that f elec-tron bonding begins at thorium with a
Plutonium and Its Alloys
302 Los Alamos ScienceNumber 26 2000
1500
Temperature (°C)
Liquid
bcc
Orthorhombic
fccfcc
dhcp
Ac Th Pa U Np Pu Am Cm
1000
500
Com
plexcubic
Ortho.
Ortho.
Tetragonal
Monoclinic
Monoclinic
Tetragonal
αβγ
δδ′
ε
Figure 10. Connected Binary-Phase Diagram of the ActinidesThe binary-phase diagrams (temperature vs composition) for adjacent actinide
elements are connected across the entire series to demonstrate the transition from
typical metallic behavior at thorium to the enormous complexity at plutonium and
back to typical metallic behavior past americium. Two-phase regions are in black;
uncertain regions are in gray.
fraction of an f electron per atom in the conduction band. That contribution to bonding is insufficient to swing theenergy balance toward a low-symmetrydistortion, and cubic crystal structures areobserved. From left to right across theactinide series down to plutonium, thenumber of f electrons in the conductionband increases, the f electrons play alarger role in bonding, and the ground-state crystal structures have increasinglylower-symmetry—plutonium is the leastsymmetric with a monoclinic structure.Beyond plutonium, the f electrons become localized (as in the rare earths),the s and d bands determine the crystalstructure, and high-symmetry ground-state structures become prevalent.
Multiple Electronic Configurationsof Nearly Equal Energy. The secondfundamental feature leading to the unusual properties of plutonium was already mentioned in connection withFigure 5: The energy levels of the 7s,6d, and 5f electrons in the isolated atomare very close to each other, resulting inoverlapping energy bands and hybridized Bloch states. Wills and Eriks-son have shown (in the article on page 128) that, under high pressure, the 6p core states may overlap and formBloch states, producing an energy bandthat overlaps the s, d, and f bands.
Because the energy levels are soclose, very little change in temperature,pressure, or chemical additions is required to prompt a change in crystalstructure. Increasing temperature, forexample, introduces entropy effectsthrough lattice vibrations. The higherthe temperature, the more important theentropy term becomes in determiningthe free energy of the system. So, it iseasy to see why the crystal structures inplutonium are so unstable with respectto temperature. Unfortunately, it is verydifficult to add the effects of vibrating(thermally excited) atoms to electronic-structure calculations because densityfunctional theory, the basis for all mod-ern calculations, only applies to theground state (T = 0).
By varying the atomic volume, we
can, however, model pressure. Increas-ing the pressure (assuming smalleratomic volumes) shifts the relative sta-bility of the bands and broadens thebands. As I discuss later, we know em-pirically that increased pressure quicklysqueezes out the high-volume, high-symmetry phases of the light actinidesin favor of the low-symmetry struc-tures. However, as the pressure isincreased further, the bands will even-tually broaden sufficiently for crystaldistortions not to be energetically favor-able, and high-symmetry structures arepredicted to return. For the heavy ac-tinides, increased pressure will cause adelocalization similar to that in cerium,yielding low-symmetry structures ini-tially. Such calculations can be done atabsolute zero for ground-state predic-tions. The predictions of Wills andEriksson for pressure-induced phasetransformations are highly accurate.
Changing chemistry by alloying canaffect electronic structure. Moreover,alloying can affect vibrational and con-figurational entropy contributions. So,one would expect phase stability in theactinides to be very sensitive to chemi-cal additions. Band structurecalculations cannot yet deal with alloy-ing effects to the level of requiredaccuracy.
Brewer (1983) adopts the chemist’sviewpoint to predict the effect of multi-ple, closely spaced energy levels inplutonium on crystal stability. On thebasis of spectroscopic evidence, heclaims that at least four different atomicconfigurations are of nearly equal energy in plutonium metal. Differentatomic configurations result in atoms ofdifferent sizes, and those atoms accountfor increased liquid stability. Stability isincreased when compared with that forcubic structures that have equivalent lattice sites. He also points out thatatoms of different sizes can pack moreefficiently in a complex structure.Whereas close-packed structures aremost efficient at filling space when theatoms are of equal size, mixing atoms ofdifferent sizes can result in higher densi-ties and larger coordination numbers.
For example, the Laves phases, themost-common intermetallic compounds,can be packed to a coordination numberof 13.3 by A and B atoms with a radiusratio of 1.225 being arranged in eitherthe cubic structure of MgCu2 or thehexagonal structure of MgZn2 or MgNi2(Haasen 1992). The α-phase monoclinicstructure of plutonium is a slightly dis-torted hexagonal structure. Lawson et al.(1996) point out that its nature can beviewed as “self-intermetallic” because itcontains 16 atoms per unit cell and 8 distinct positions for those atoms.They compare the α-plutonium structurewith the very complex structure of α-manganese, which has 58 atoms per unitcell and 4 distinct atomic positions. In addition, short bonds are prevalent onone side of the α-plutonium atom, andlong bonds are prevalent on the otherside, suggesting that the atoms are alsononspherical, a feature that further com-plicates the crystal packing. Therefore, it seems intuitively correct to say that α-plutonium packs more closely than do single-sized hard spheres.
Sitting on the Knife-Edge betweenBonding and Localized Behavior.Plu-tonium has one more feature that sets itapart from uranium, neptunium, andamericium, its neighboring elements.That feature derives from its position inthe actinide series. Plutonium sits rightat the transition point at which the 5f electrons change from being bondingto being localized (chemically inert).As the nuclear charge increases acrossthe actinides, the increase causes theatomic volume to contract slightly because the electron wave functions arepulled slightly closer to the ion cores(in the rare earths this same phenome-non is called the lanthanidecontraction). The much larger effect isthat, much like each additional d elec-tron in transition metals, eachadditional 5f electron produces a rela-tively large decrease in atomic volumebecause the 5f electrons go into the conduction band and add to thebonding (see Figure 9).
The atomic volume of the transition
Plutonium and Its Alloys
Number 26 2000 Los Alamos Science 303
metals reaches a minimum when the d shell, which holds 10 electrons, is halffull. Past that point, cohesion begins todecrease and atomic volume begins toincrease because the antibonding statesof the d band start to be filled. The 5fshell holds 14 electrons, and one mightexpect the atomic volumes of the ac-tinides to decrease in moving towardcurium whose f shell is half full. Instead,the atomic volume of plutonium isslightly greater than that of neptunium.Total energy calculations of Eriksson et al. reproduce this upturn when thelow-symmetry monoclinic structure ofplutonium’s α-phase serves as input.These scientists attribute the upturn tothe openness of that structure. In anycase, the increase in nuclear charge final-ly causes the 5f electrons to localize atamericium, and the atomic volume expands dramatically because now noneof the 5f electrons bond.
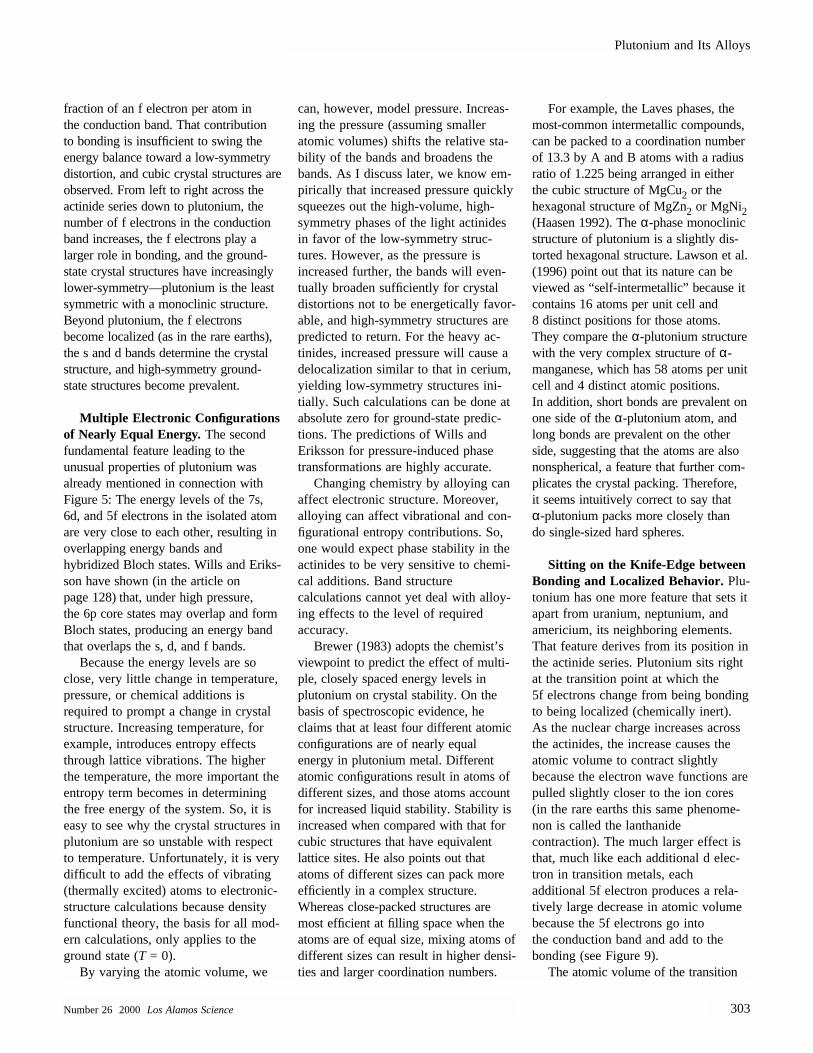
The transition from bonding (itiner-ant) 5f electrons in uranium to localized5f electrons in americium is graphicallyillustrated by the plots of total energy vsrelative lattice constant in Figure 11.Perhaps even more intriguing, the transi-tion appears to occur right at plutonium,not between plutonium and americium.Eriksson et al. have tried to match theatomic volume of the fcc δ-phase in plu-tonium. They find that they have to letfour of the 5f electrons localize but keepone of them bonding. (I will return tothe puzzle of the δ-phase later). On thebasis of discussions with Wills, I show a notional sketch of how local-ization may proceed in the plutoniumallotropes (Figure 12). The value for theliquid is only a guess guided by com-ments made by Hill and Kmetko (1976)that the liquid accommodates 5f bondingbetter than the cubic solid phases. Basedon the extensive work on liquid plutoniumby Wittenberg et al. (1970) that showedthat the molar volume of the liquid is thesame as that of the β-phase, Hill andKmetko called the β-phase the “solid-state” analogue of the liquid. Hence, Iestimated the degree of 5f electron local-ization to be the same for the liquid asfor the β-phase.
Plutonium and Its Alloys
304 Los Alamos ScienceNumber 26 2000
500
400
300
200
100
0
−1000.6 1.0 0.6
Localized
Localized
LocalizedItinerant Itinerant
Itinerant
U Pu Am
1.0 0.4 0.8 1.2Radius (Å)
Ene
rgy
(mR
y)
Figure 11. Bonding of 5f Electrons in Plutonium vs Adjacent Elements These plots of total energy vs normalized lattice based on Eriksson et al. (1999)
demonstrate the effects of shifting the 5f electrons from bonding states (solid line)
to localized states (dotted line). At uranium, there is little question that 5f bonding
produces the lowest energy state, and at americium, 5f localization produces the low-
est energy state. At plutonium, the balance clearly shifts from bonding to localization.
Experimental error in the estimated energy gain on localization—about 50 mRy—pre-
cludes a clear prediction of the nature of the plutonium ground state from these
calculations. (This figure was adapted with permission from Elsevier Science.)
100
80
60
40
20
0 100 200 300 400
Temperature (°C)
500 600
Liquid
700 800
Fra
ctio
n of
bon
ding
5f e
lect
rons
(%
)
α
β γ
δ ε
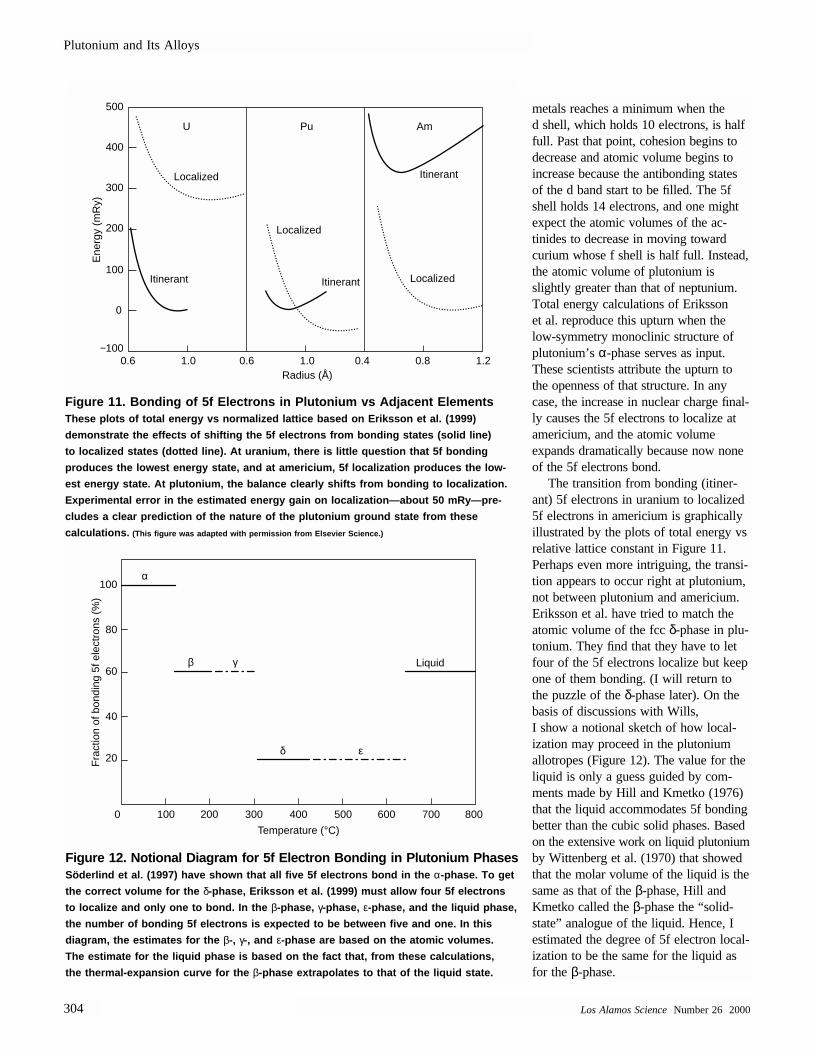
Figure 12. Notional Diagram for 5f Electron Bonding in Plutonium PhasesSöderlind et al. (1997) have shown that all five 5f electrons bond in the α-phase. To get
the correct volume for the δ-phase, Eriksson et al. (1999) must allow four 5f electrons
to localize and only one to bond. In the β-phase, γ-phase, ε-phase, and the liquid phase,
the number of bonding 5f electrons is expected to be between five and one. In this
diagram, the estimates for the β-, γ-, and ε-phase are based on the atomic volumes.
The estimate for the liquid phase is based on the fact that, from these calculations,
the thermal-expansion curve for the β-phase extrapolates to that of the liquid state.
Having to describe different allotropes of the same element at roomtemperature and above by such differentelectronic states (mixtures of Blochstates and localized states) is unprece-dented. Plutonium is truly unique amongthe elements in the periodic table. Andmore important for the metallurgists whomust work with this material, the transi-tion from Bloch states to localized statescauses both the atomic volume and thecrystal structure to change dramatically.
What Basic Properties ReallyMatter to Metallurgists?
The electronic structure at absolutezero is a starting point for understandingplutonium, but it is far removed fromtypical interests in the practical world ofmetallurgy. Metallurgists must relate thebasic properties of metals and alloys totheir microstructures and then tailorthose microstructures to produce desired engineering properties for specific appli-cations. As Peter Haasen pointed out(1992), microstructure begins wherecondensed matter physics typicallyleaves off. Crystal structure—the perfectperiodic array of atoms in a single crys-tal—forms the foundation of condensedmatter physics. Metallurgy is directlyaffected by those perfect crystalline arrays (see the box “Atomic Packingand Slip Systems in Metals” on page 308), but it also takes into accountthat they are mostly confined to verysmall, microscopic regions. In otherwords, between the macroscopic scale of continuum mechanics and theatomic scale of perfect crystal lattices,there is another scale, that of microstructure, which is governed bythe properties of individual grains, their crystalline defects, and the interac-tions among them all. Examples ofmicrostructures and their defect sub-structures are shown in Figure 13.
For most technologically importantmaterials, especially structural materi-als, microstructure determinesengineering properties. Therefore, thebasic properties that really matter to the
Plutonium and Its Alloys
Number 26 2000 Los Alamos Science 305
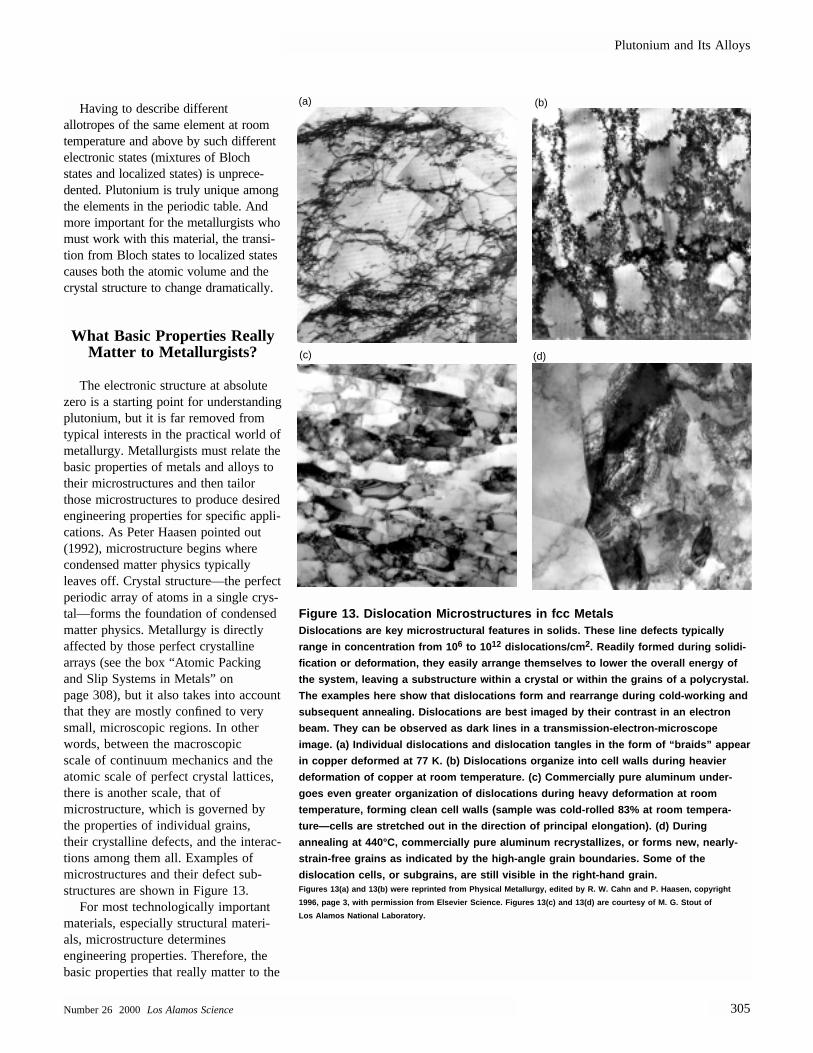
Figure 13. Dislocation Microstructures in fcc Metals Dislocations are key microstructural features in solids. These line defects typically
range in concentration from 10 6 to 1012 dislocations/cm 2. Readily formed during solidi-
fication or deformation, they easily arrange themselves to lower the overall energy of
the system, leaving a substructure within a crystal or within the grains of a polycrystal.
The examples here show that dislocations form and rearrange during cold-working and
subsequent annealing. Dislocations are best imaged by their contrast in an electron
beam. They can be observed as dark lines in a transmission-electron-microscope
image. (a) Individual dislocations and dislocation tangles in the form of “braids” appear
in copper deformed at 77 K. (b) Dislocations organize into cell walls during heavier
deformation of copper at room temperature. (c) Commercially pure aluminum under-
goes even greater organization of dislocations during heavy deformation at room
temperature, forming clean cell walls (sample was cold-rolled 83% at room tempera-
ture—cells are stretched out in the direction of principal elongation). (d) During
annealing at 440°C, commercially pure aluminum recrystallizes, or forms new, nearly-
strain-free grains as indicated by the high-angle grain boundaries. Some of the
dislocation cells, or subgrains, are still visible in the right-hand grain. Figures 13(a) and 13(b) were reprinted from Physical Metallurgy , edited by R. W. Cahn and P. Haasen, copyright
1996, page 3, with permission from Elsevier Science. Figures 13(c) and 13(d) are courtesy of M. G. Stout of
Los Alamos National Laboratory.
(c)
(a) (b)
(d)
plutonium metallurgists are those thathave the greatest influence on micro-structure: crystal structure, meltingpoint, and phase stability.
Crystal Structure. The internal energy of metals depends primarily ontheir atomic volumes. Energy differ-ences resulting from different structuralarrangements are typically very small.For example, in sodium the heat oftransformation from a body-centered-cubic (bcc) to hexagonal close-packed(hcp) structure at 36 kelvins is onlyone-thousandths of the total binding energy. Yet, crystal structure has adominant effect on metallic properties.
Metallic bonding exhibits little direc-tionality because the conductionelectrons that hold the atoms togetherare shared throughout the crystal lattice.Therefore, atoms in metals tend to pack
uniformly, leaving the minimum amountof void space. Indeed, metals solidifypreferentially into close-packed fcc and hcp structures and into the nearlyclose-packed bcc structure (see the box“Atomic Packing and Slip Systems inMetals” on page 308). In fact, in theirground states, 53 of the elements up toplutonium (element 94) have fcc or hcpstructures and 23 have bcc structures. Ifthe tetragonal structure is also consid-ered nearly close-packed, all but four ofthe metals in the periodic table exist inone of these four simple crystal struc-tures.
The host crystal structure determinesmacroscopic structural properties ofmetals in many ways. For example, as shown on pages 308 and 309, crystalstructure determines the operative slipplanes, as well as the nature of crys-talline defects, and those defects control
the strength of the material and mostother structural properties. For example,plastic deformation by slip does notoccur homogeneously when entire lat-tice planes are slipped over each other.Instead, it is made significantly easierby the motion of line defects known asdislocations (see Figure 4 in “Mechani-cal Behavior of Plutonium and ItsAlloys” on page 341).
The formation and motion of pointdefects such as lattice vacancies arealso influenced by crystal structure. We will show later that migration ofvacancies is the primary mechanism forbulk diffusion in metals. Interestingly,because relaxation of atoms surround-ing a vacancy is controlled by atomiccoordination and the strength of thebonding, vacancy migration is easier inthe bcc structure than in close-packedstructures, and therefore diffusion is significantly faster in the bcc struc-ture. On the other hand, vacancies areformed more easily in the close-packedstructures.
Crystal structure also has a direct effect on the nature of thermal latticevibrations and, therefore, on the vibra-tional entropy of crystals. At hightemperatures, the entropy contributionto the free energy can become verylarge and therefore have a dominatinginfluence on phase stability. For exam-ple, because it has fewer nearestneighbors than close-packed metals, the bcc lattice exhibits lower vibrationalfrequencies and therefore higher vibra-tional entropy (or a high uncertainty ofposition in the lattice) than other crystalstructures. Indeed, the bcc lattice is thestructure with the lowest free energy athigh temperatures. Consequently, most metals melt from the bcc structure.
It should now be apparent that thephase changes in plutonium are morethan an annoyance because the accom-panying changes in crystal structurehave a dramatic influence on structuralproperties. In particular, at low andslightly elevated temperatures, the low-symmetry α-, β-, and γ-phase becomestable as opposed to the high-symmetry,ductile structures found in most metals.
Plutonium and Its Alloys
306 Los Alamos ScienceNumber 26 2000
(a) Vacancy formation
(b) Vacancy migration
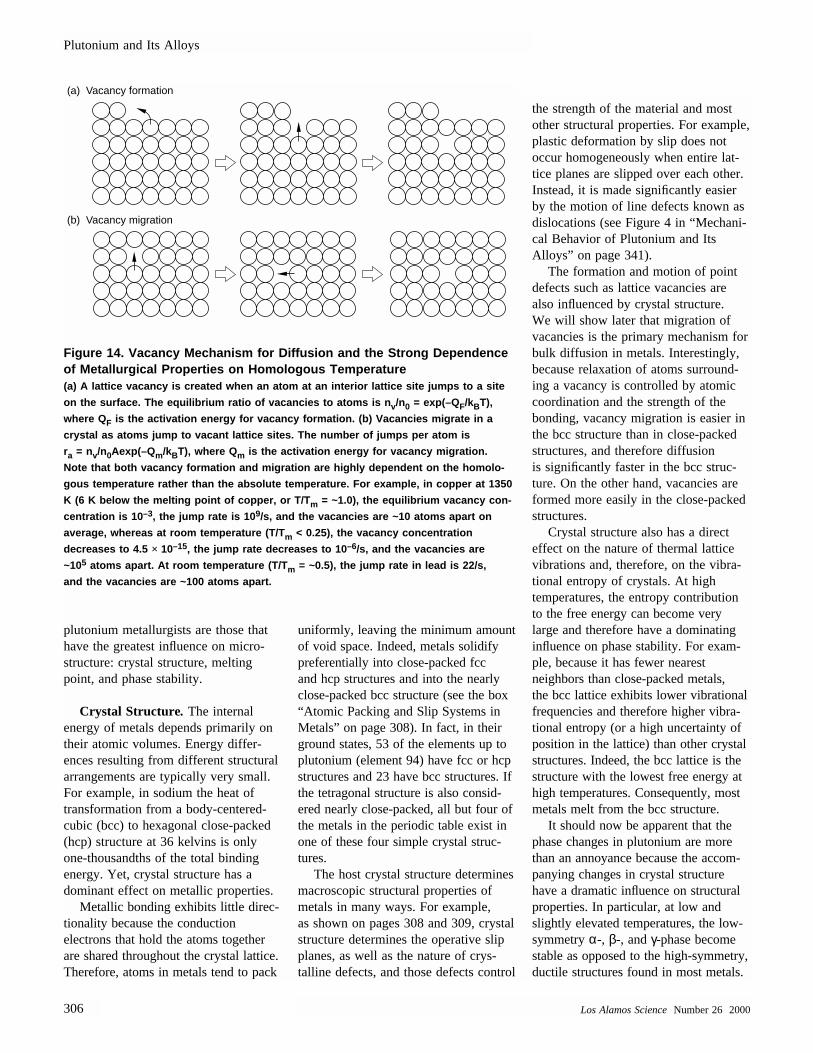
Figure 14. Vacancy Mechanism for Diffusion and the Strong Dependenceof Metallurgical Properties on Homologous Temperature (a) A lattice vacancy is created when an atom at an interior lattice site jumps to a site
on the surface. The equilibrium ratio of vacancies to atoms is nv/n0 = exp(–QF/kBT),
where QF is the activation energy for vacancy formation. (b) Vacancies migrate in a
crystal as atoms jump to vacant lattice sites. The number of jumps per atom is
ra = nv/n0Aexp(– Qm/kBT), where Qm is the activation energy for vacancy migration.
Note that both vacancy formation and migration are highly dependent on the homolo-
gous temperature rather than the absolute temperature. For example, in copper at 1350
K (6 K below the melting point of copper, or T/Tm = ~1.0), the equilibrium vacancy con-
centration is 10 –3, the jump rate is 10 9/s, and the vacancies are ~10 atoms apart on
average, whereas at room temperature ( T/Tm < 0.25), the vacancy concentration
decreases to 4.5 × 10⁻¹⁵, the jump rate decreases to 10 –6/s, and the vacancies are
~105 atoms apart. At room temperature ( T/Tm = ~0.5), the jump rate in lead is 22/s,
and the vacancies are ~100 atoms apart.
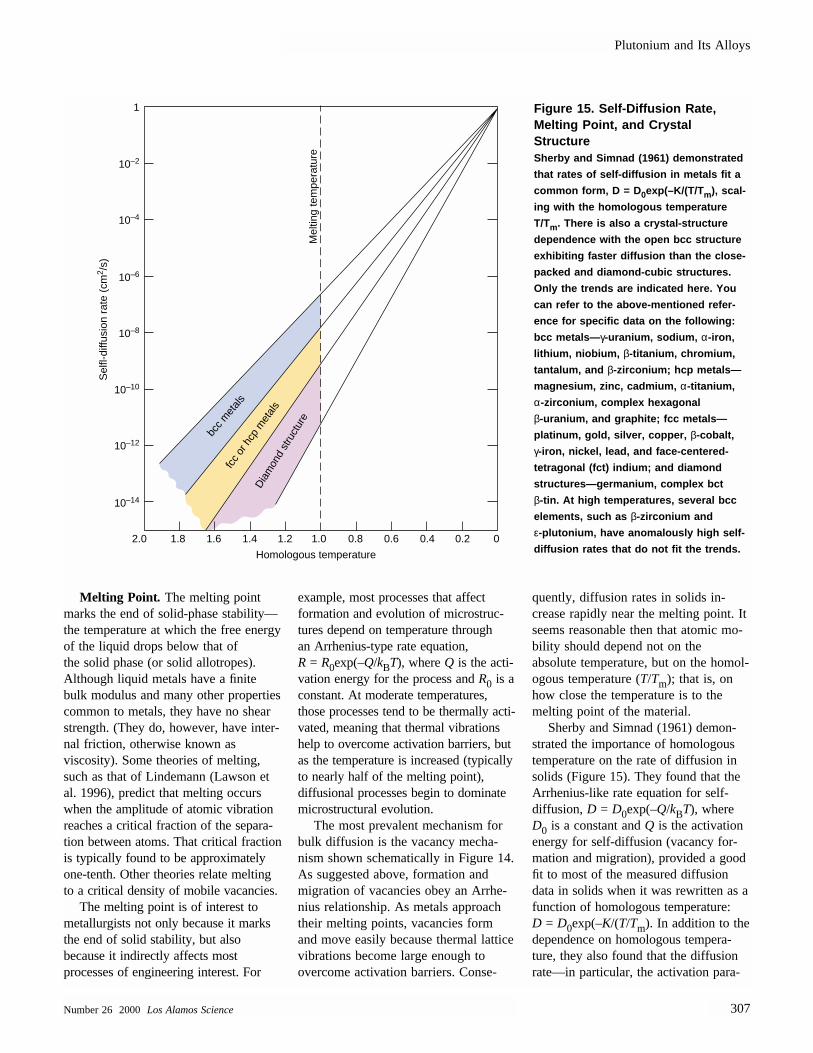
Melting Point. The melting pointmarks the end of solid-phase stability—the temperature at which the free energyof the liquid drops below that of the solid phase (or solid allotropes). Although liquid metals have a finitebulk modulus and many other propertiescommon to metals, they have no shearstrength. (They do, however, have inter-nal friction, otherwise known asviscosity). Some theories of melting,such as that of Lindemann (Lawson etal. 1996), predict that melting occurswhen the amplitude of atomic vibration reaches a critical fraction of the separa-tion between atoms. That critical fractionis typically found to be approximatelyone-tenth. Other theories relate meltingto a critical density of mobile vacancies.
The melting point is of interest tometallurgists not only because it marksthe end of solid stability, but also because it indirectly affects mostprocesses of engineering interest. For
example, most processes that affect formation and evolution of microstruc-tures depend on temperature through an Arrhenius-type rate equation, R = R0exp(–Q/kBT), where Q is the acti-vation energy for the process and R0 is aconstant. At moderate temperatures,those processes tend to be thermally acti-vated, meaning that thermal vibrationshelp to overcome activation barriers, butas the temperature is increased (typicallyto nearly half of the melting point), diffusional processes begin to dominatemicrostructural evolution.
The most prevalent mechanism forbulk diffusion is the vacancy mecha-nism shown schematically in Figure 14.As suggested above, formation and migration of vacancies obey an Arrhe-nius relationship. As metals approachtheir melting points, vacancies formand move easily because thermal lattice vibrations become large enough toovercome activation barriers. Conse-
quently, diffusion rates in solids in-crease rapidly near the melting point. Itseems reasonable then that atomic mo-bility should depend not on the absolute temperature, but on the homol-ogous temperature (T/Tm); that is, onhow close the temperature is to themelting point of the material.
Sherby and Simnad (1961) demon-strated the importance of homologoustemperature on the rate of diffusion insolids (Figure 15). They found that theArrhenius-like rate equation for self-diffusion, D = D0exp(–Q/kBT), whereD0 is a constant and Q is the activationenergy for self-diffusion (vacancy for-mation and migration), provided a goodfit to most of the measured diffusiondata in solids when it was rewritten as afunction of homologous temperature: D = D0exp(–K/(T/Tm). In addition to thedependence on homologous tempera-ture, they also found that the diffusionrate—in particular, the activation para-
Plutonium and Its Alloys
Number 26 2000 Los Alamos Science 307
1
10–2
10–4
10–6
10–8
10–10
10–12
10–14
2.0 1.8 1.6 1.4 1.2 1.0 0.8 0.6 0.4 0.2 0
Homologous temperature
bcc
met
als
fcc
or h
cp m
etal
s
Dia
mon
d st
ruct
ure
Mel
ting
tem
pera
ture
Sel
fl-di
ffusi
on r
ate
(cm
2 /s)
Figure 15. Self-Diffusion Rate,Melting Point, and Crystal Structure Sherby and Simnad (1961) demonstrated
that rates of self-diffusion in metals fit a
common form, D = D0exp(–K/(T/Tm), scal-
ing with the homologous temperature
T/Tm. There is also a crystal-structure
dependence with the open bcc structure
exhibiting faster diffusion than the close-
packed and diamond-cubic structures.
Only the trends are indicated here. You
can refer to the above-mentioned refer-
ence for specific data on the following:
bcc metals— γ-uranium, sodium, α-iron,
lithium, niobium, β-titanium, chromium,
tantalum, and β-zirconium; hcp metals—
magnesium, zinc, cadmium, α-titanium,
α-zirconium, complex hexagonal
β-uranium, and graphite; fcc metals—
platinum, gold, silver, copper, β-cobalt,
γ-iron, nickel, lead, and face-centered-
tetragonal (fct) indium; and diamond
structures—germanium, complex bct
β-tin. At high temperatures, several bcc
elements, such as β-zirconium and
ε-plutonium, have anomalously high self-
diffusion rates that do not fit the trends.
Plutonium and Its Alloys
308 Los Alamos ScienceNumber 26 2000
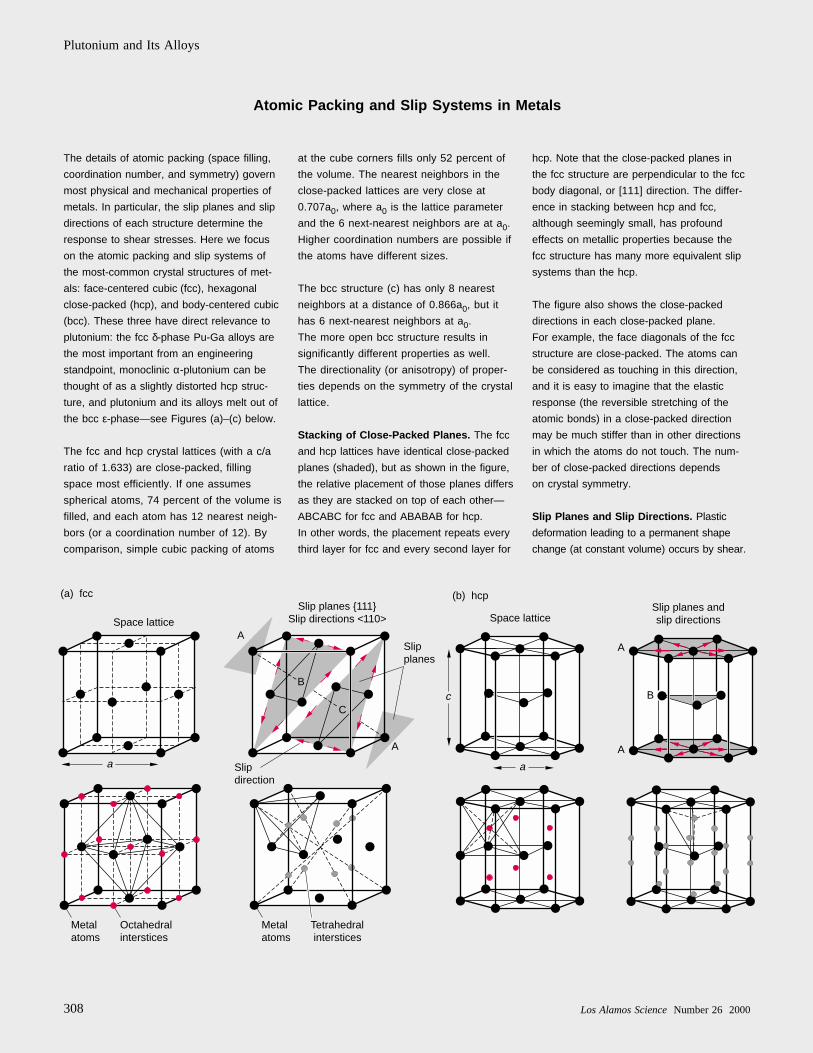
The details of atomic packing (space filling,
coordination number, and symmetry) govern
most physical and mechanical properties of
metals. In particular, the slip planes and slip
directions of each structure determine the
response to shear stresses. Here we focus
on the atomic packing and slip systems of
the most-common crystal structures of met-
als: face-centered cubic (fcc), hexagonal
close-packed (hcp), and body-centered cubic
(bcc). These three have direct relevance to
plutonium: the fcc δ-phase Pu-Ga alloys are
the most important from an engineering
standpoint, monoclinic α-plutonium can be
thought of as a slightly distorted hcp struc-
ture, and plutonium and its alloys melt out of
the bcc ε-phase—see Figures (a)–(c) below.
The fcc and hcp crystal lattices (with a c/a
ratio of 1.633) are close-packed, filling
space most efficiently. If one assumes
spherical atoms, 74 percent of the volume is
filled, and each atom has 12 nearest neigh-
bors (or a coordination number of 12). By
comparison, simple cubic packing of atoms
at the cube corners fills only 52 percent of
the volume. The nearest neighbors in the
close-packed lattices are very close at
0.707a0, where a0 is the lattice parameter
and the 6 next-nearest neighbors are at a0.
Higher coordination numbers are possible if
the atoms have different sizes.
The bcc structure (c) has only 8 nearest
neighbors at a distance of 0.866a0, but it
has 6 next-nearest neighbors at a0.
The more open bcc structure results in
significantly different properties as well.
The directionality (or anisotropy) of proper-
ties depends on the symmetry of the crystal
lattice.
Stacking of Close-Packed Planes. The fcc
and hcp lattices have identical close-packed
planes (shaded), but as shown in the figure,
the relative placement of those planes differs
as they are stacked on top of each other—
ABCABC for fcc and ABABAB for hcp.
In other words, the placement repeats every
third layer for fcc and every second layer for
hcp. Note that the close-packed planes in
the fcc structure are perpendicular to the fcc
body diagonal, or [111] direction. The differ-
ence in stacking between hcp and fcc,
although seemingly small, has profound
effects on metallic properties because the
fcc structure has many more equivalent slip
systems than the hcp.
The figure also shows the close-packed
directions in each close-packed plane.
For example, the face diagonals of the fcc
structure are close-packed. The atoms can
be considered as touching in this direction,
and it is easy to imagine that the elastic
response (the reversible stretching of the
atomic bonds) in a close-packed direction
may be much stiffer than in other directions
in which the atoms do not touch. The num-
ber of close-packed directions depends
on crystal symmetry.
Slip Planes and Slip Directions. Plastic
deformation leading to a permanent shape
change (at constant volume) occurs by shear.
Slip planes 111Slip directions <110>
(a) fcc (b) hcp
a
Space lattice
Metalatoms
Space lattice
Slipdirection
Slipplanes
a
AA
B
A
cC
B
A
Octahedralinterstices
Metalatoms
Tetrahedral interstices
Slip planes andslip directions
Atomic Packing and Slip Systems in Metals
From a simple hard-sphere model, it is appar-
ent that it is easiest to shear (or slip) rows of
atoms over close-packed planes and along
close-packed directions because close-packed
planes have the largest separation and sliding
them along close-packed directions offers the
least geometrical resistance to shear.
Slip occurs when the critical resolved shear
stress (shear stress in a slip plane at which
dislocations begin to move, and plastic flow is
initiated) is reached on one of the close-
packed slip systems (combination of slip
plane and slip direction). The greater the
number of crystallographically equivalent slip
systems that exist, the easier it will be to
reach the critical resolved shear stress on one
of the slip systems. The fcc structure has 4
equivalent close-packed planes—the octahe-
dral or 111 Miller indices planes—and each
of these planes has 3 equivalent close-packed
directions (the face-diagonals or <110> direc-
tions) for a total of 12 equivalent slip systems.
This redundancy of slip systems makes fcc
metals typically very malleable (or ductile).
In the hcp structure, on the other hand, the
basal plane is the only close-packed plane.
It has three equivalent close-packed
directions (same as the fcc lattice) and,
hence, only three equivalent slip systems.
However, some properly oriented hcp single
crystals (for example, of magnesium) can still
exhibit large amounts of slip. In addition, at
higher stresses or elevated temperatures,
other slip systems can be activated. Also, an
entirely different deformation mode, twinning,
is readily activated in hcp metals in which
slip does not occur readily. An additional
serious complication in hcp metals is that the
structure is close packed only if the c/a ratio
is 1.633, the ideal ratio for spherical atoms.
Most hcp metals deviate from this ratio, indi-
cating that the atoms are not ideally
spherical. The ductility of most polycrystalline
hcp metals is limited because of their inability
to operate a sufficient number of multiple slip
systems simultaneously.
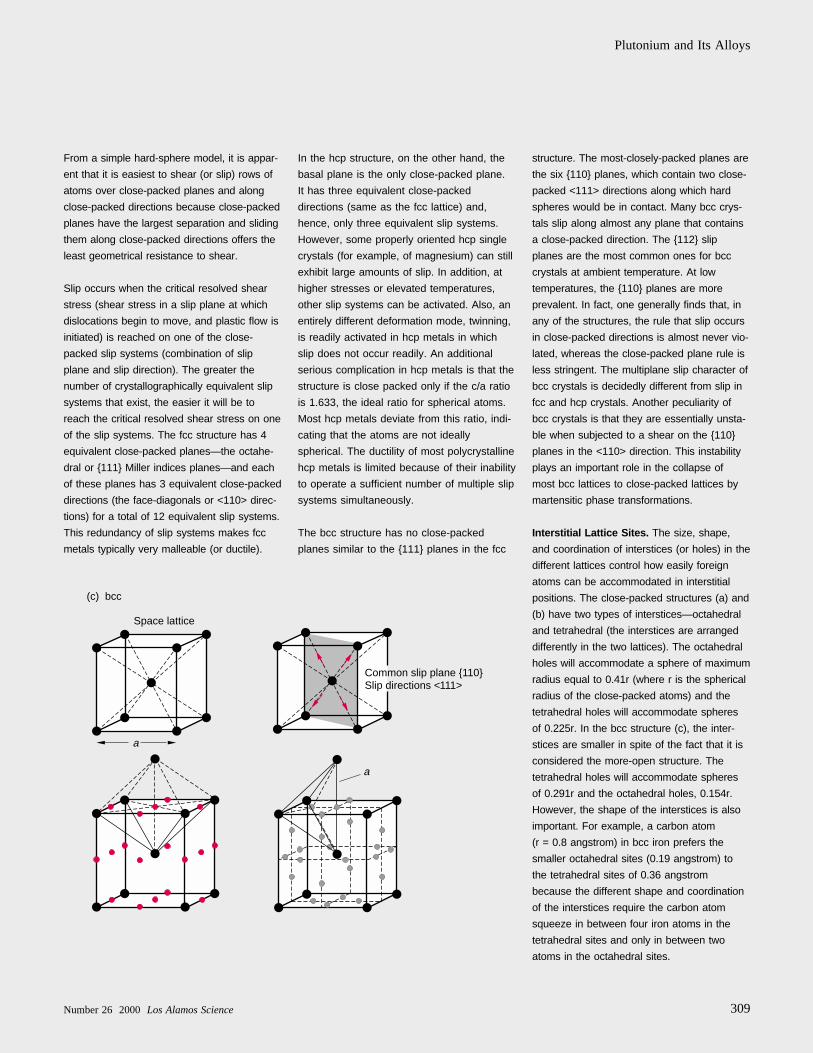
The bcc structure has no close-packed
planes similar to the 111 planes in the fcc
structure. The most-closely-packed planes are
the six 110 planes, which contain two close-
packed <111> directions along which hard
spheres would be in contact. Many bcc crys-
tals slip along almost any plane that contains
a close-packed direction. The 112 slip
planes are the most common ones for bcc
crystals at ambient temperature. At low
temperatures, the 110 planes are more
prevalent. In fact, one generally finds that, in
any of the structures, the rule that slip occurs
in close-packed directions is almost never vio-
lated, whereas the close-packed plane rule is
less stringent. The multiplane slip character of
bcc crystals is decidedly different from slip in
fcc and hcp crystals. Another peculiarity of
bcc crystals is that they are essentially unsta-
ble when subjected to a shear on the 110
planes in the <110> direction. This instability
plays an important role in the collapse of
most bcc lattices to close-packed lattices by
martensitic phase transformations.
Interstitial Lattice Sites. The size, shape,
and coordination of interstices (or holes) in the
different lattices control how easily foreign
atoms can be accommodated in interstitial
positions. The close-packed structures (a) and
(b) have two types of interstices—octahedral
and tetrahedral (the interstices are arranged
differently in the two lattices). The octahedral
holes will accommodate a sphere of maximum
radius equal to 0.41r (where r is the spherical
radius of the close-packed atoms) and the
tetrahedral holes will accommodate spheres
of 0.225r. In the bcc structure (c), the inter-
stices are smaller in spite of the fact that it is
considered the more-open structure. The
tetrahedral holes will accommodate spheres
of 0.291r and the octahedral holes, 0.154r.
However, the shape of the interstices is also
important. For example, a carbon atom
(r = 0.8 angstrom) in bcc iron prefers the
smaller octahedral sites (0.19 angstrom) to
the tetrahedral sites of 0.36 angstrom
because the different shape and coordination
of the interstices require the carbon atom
squeeze in between four iron atoms in the
tetrahedral sites and only in between two
atoms in the octahedral sites.
Plutonium and Its Alloys
Number 26 2000 Los Alamos Science 309
(c) bcc
Common slip plane 110Slip directions <111>
Space lattice
a
a
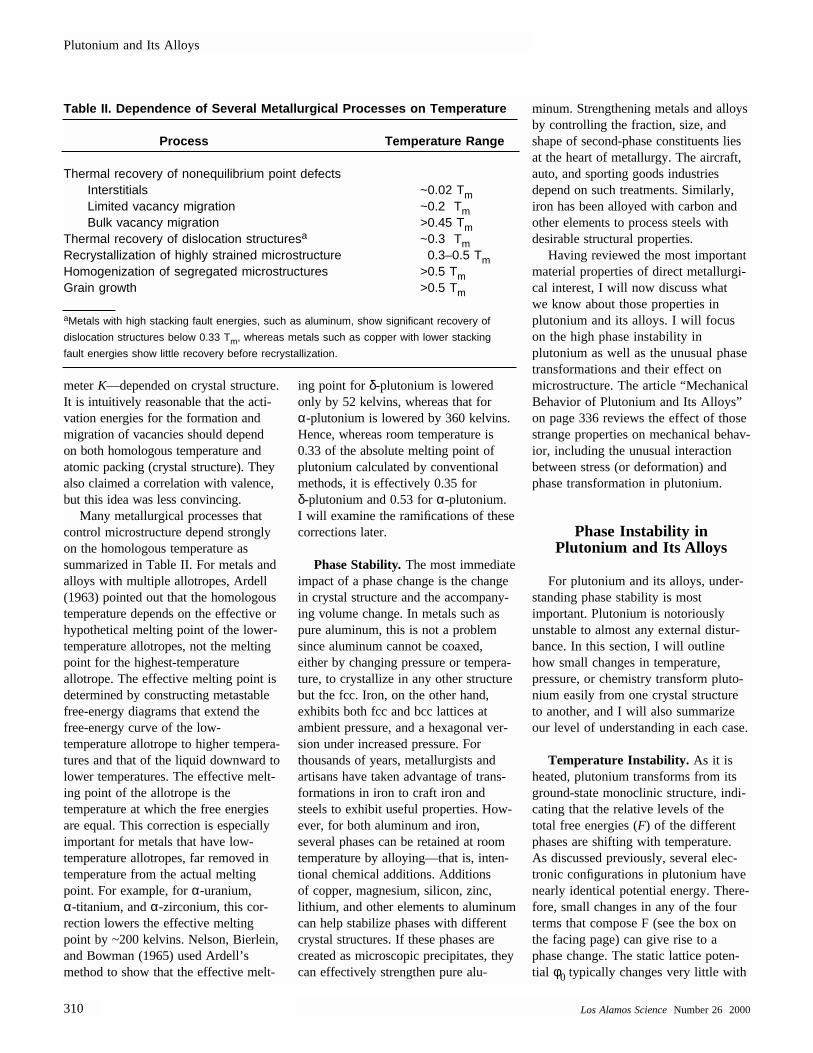
meter K—depended on crystal structure.It is intuitively reasonable that the acti-vation energies for the formation andmigration of vacancies should depend on both homologous temperature andatomic packing (crystal structure). Theyalso claimed a correlation with valence,but this idea was less convincing.
Many metallurgical processes thatcontrol microstructure depend stronglyon the homologous temperature as summarized in Table II. For metals andalloys with multiple allotropes, Ardell(1963) pointed out that the homologoustemperature depends on the effective orhypothetical melting point of the lower-temperature allotropes, not the meltingpoint for the highest-temperature allotrope. The effective melting point isdetermined by constructing metastablefree-energy diagrams that extend thefree-energy curve of the low-temperature allotrope to higher tempera-tures and that of the liquid downward tolower temperatures. The effective melt-ing point of the allotrope is thetemperature at which the free energiesare equal. This correction is especiallyimportant for metals that have low-temperature allotropes, far removed intemperature from the actual meltingpoint. For example, for α-uranium, α-titanium, and α-zirconium, this cor-rection lowers the effective meltingpoint by ~200 kelvins. Nelson, Bierlein,and Bowman (1965) used Ardell’smethod to show that the effective melt-
ing point for δ-plutonium is loweredonly by 52 kelvins, whereas that for α-plutonium is lowered by 360 kelvins.Hence, whereas room temperature is0.33 of the absolute melting point ofplutonium calculated by conventionalmethods, it is effectively 0.35 for δ-plutonium and 0.53 for α-plutonium. I will examine the ramifications of thesecorrections later.
Phase Stability. The most immediateimpact of a phase change is the changein crystal structure and the accompany-ing volume change. In metals such aspure aluminum, this is not a problemsince aluminum cannot be coaxed, either by changing pressure or tempera-ture, to crystallize in any other structurebut the fcc. Iron, on the other hand, exhibits both fcc and bcc lattices at ambient pressure, and a hexagonal ver-sion under increased pressure. Forthousands of years, metallurgists and artisans have taken advantage of trans-formations in iron to craft iron andsteels to exhibit useful properties. How-ever, for both aluminum and iron, several phases can be retained at roomtemperature by alloying—that is, inten-tional chemical additions. Additions of copper, magnesium, silicon, zinc,lithium, and other elements to aluminumcan help stabilize phases with differentcrystal structures. If these phases arecreated as microscopic precipitates, theycan effectively strengthen pure alu-
minum. Strengthening metals and alloysby controlling the fraction, size, andshape of second-phase constituents liesat the heart of metallurgy. The aircraft,auto, and sporting goods industries depend on such treatments. Similarly,iron has been alloyed with carbon andother elements to process steels with desirable structural properties.
Having reviewed the most importantmaterial properties of direct metallurgi-cal interest, I will now discuss what we know about those properties in plutonium and its alloys. I will focuson the high phase instability in plutonium as well as the unusual phasetransformations and their effect on microstructure. The article “MechanicalBehavior of Plutonium and Its Alloys”on page 336 reviews the effect of thosestrange properties on mechanical behav-ior, including the unusual interactionbetween stress (or deformation) andphase transformation in plutonium.
Phase Instability in Plutonium and Its Alloys
For plutonium and its alloys, under-standing phase stability is mostimportant. Plutonium is notoriously unstable to almost any external distur-bance. In this section, I will outlinehow small changes in temperature,pressure, or chemistry transform pluto-nium easily from one crystal structureto another, and I will also summarizeour level of understanding in each case.
Temperature Instability. As it isheated, plutonium transforms from itsground-state monoclinic structure, indi-cating that the relative levels of thetotal free energies (F) of the differentphases are shifting with temperature.As discussed previously, several elec-tronic configurations in plutonium havenearly identical potential energy. There-fore, small changes in any of the fourterms that compose F (see the box onthe facing page) can give rise to aphase change. The static lattice poten-tial φ0 typically changes very little with
Plutonium and Its Alloys
310 Los Alamos ScienceNumber 26 2000
Table II. Dependence of Several Metallurgical Processes on Temperature
Process Temperature Range
Thermal recovery of nonequilibrium point defectsInterstitials ~0.02 TmLimited vacancy migration ~0.2 TmBulk vacancy migration >0.45 Tm
Thermal recovery of dislocation structuresa ~0.3 TmRecrystallization of highly strained microstructure 0.3–0.5 TmHomogenization of segregated microstructures >0.5 TmGrain growth >0.5 Tm
aMetals with high stacking fault energies, such as aluminum, show significant recovery of
dislocation structures below 0.33 Tm, whereas metals such as copper with lower stacking
fault energies show little recovery before recrystallization.
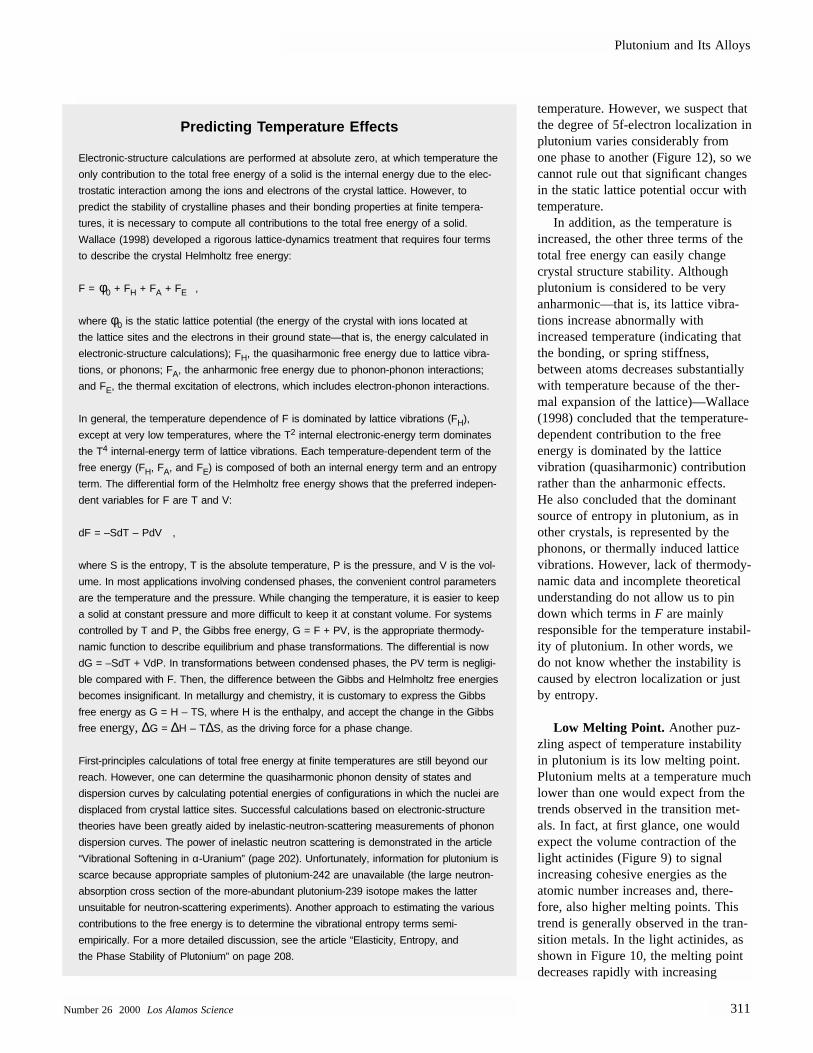
temperature. However, we suspect thatthe degree of 5f-electron localization inplutonium varies considerably fromone phase to another (Figure 12), so wecannot rule out that significant changesin the static lattice potential occur withtemperature.
In addition, as the temperature is increased, the other three terms of thetotal free energy can easily changecrystal structure stability. Althoughplutonium is considered to be very anharmonic—that is, its lattice vibra-tions increase abnormally withincreased temperature (indicating thatthe bonding, or spring stiffness, between atoms decreases substantiallywith temperature because of the ther-mal expansion of the lattice)—Wallace(1998) concluded that the temperature-dependent contribution to the freeenergy is dominated by the lattice vibration (quasiharmonic) contributionrather than the anharmonic effects. He also concluded that the dominantsource of entropy in plutonium, as inother crystals, is represented by thephonons, or thermally induced latticevibrations. However, lack of thermody-namic data and incomplete theoreticalunderstanding do not allow us to pindown which terms in F are mainly responsible for the temperature instabil-ity of plutonium. In other words, we do not know whether the instability iscaused by electron localization or justby entropy.
Low Melting Point. Another puz-zling aspect of temperature instabilityin plutonium is its low melting point.Plutonium melts at a temperature muchlower than one would expect from thetrends observed in the transition met-als. In fact, at first glance, one wouldexpect the volume contraction of thelight actinides (Figure 9) to signal increasing cohesive energies as theatomic number increases and, there-fore, also higher melting points. Thistrend is generally observed in the tran-sition metals. In the light actinides, asshown in Figure 10, the melting pointdecreases rapidly with increasing
Plutonium and Its Alloys
Number 26 2000 Los Alamos Science 311
Predicting Temperature Effects
Electronic-structure calculations are performed at absolute zero, at which temperature the
only contribution to the total free energy of a solid is the internal energy due to the elec-
trostatic interaction among the ions and electrons of the crystal lattice. However, to
predict the stability of crystalline phases and their bonding properties at finite tempera-
tures, it is necessary to compute all contributions to the total free energy of a solid.
Wallace (1998) developed a rigorous lattice-dynamics treatment that requires four terms
to describe the crystal Helmholtz free energy:
F = φ0 + FH + FA + FE ,
where φ0 is the static lattice potential (the energy of the crystal with ions located at
the lattice sites and the electrons in their ground state—that is, the energy calculated in
electronic-structure calculations); FH, the quasiharmonic free energy due to lattice vibra-
tions, or phonons; FA, the anharmonic free energy due to phonon-phonon interactions;
and FE, the thermal excitation of electrons, which includes electron-phonon interactions.
In general, the temperature dependence of F is dominated by lattice vibrations (FH),
except at very low temperatures, where the T2 internal electronic-energy term dominates
the T4 internal-energy term of lattice vibrations. Each temperature-dependent term of the
free energy (FH, FA, and FE) is composed of both an internal energy term and an entropy
term. The differential form of the Helmholtz free energy shows that the preferred indepen-
dent variables for F are T and V:
dF = –SdT – PdV ,
where S is the entropy, T is the absolute temperature, P is the pressure, and V is the vol-
ume. In most applications involving condensed phases, the convenient control parameters
are the temperature and the pressure. While changing the temperature, it is easier to keep
a solid at constant pressure and more difficult to keep it at constant volume. For systems
controlled by T and P, the Gibbs free energy, G = F + PV, is the appropriate thermody-
namic function to describe equilibrium and phase transformations. The differential is now
dG = –SdT + VdP. In transformations between condensed phases, the PV term is negligi-
ble compared with F. Then, the difference between the Gibbs and Helmholtz free energies
becomes insignificant. In metallurgy and chemistry, it is customary to express the Gibbs
free energy as G = H – TS, where H is the enthalpy, and accept the change in the Gibbs
free energy, ∆G = ∆H – T∆S, as the driving force for a phase change.
First-principles calculations of total free energy at finite temperatures are still beyond our
reach. However, one can determine the quasiharmonic phonon density of states and
dispersion curves by calculating potential energies of configurations in which the nuclei are
displaced from crystal lattice sites. Successful calculations based on electronic-structure
theories have been greatly aided by inelastic-neutron-scattering measurements of phonon
dispersion curves. The power of inelastic neutron scattering is demonstrated in the article
“Vibrational Softening in α-Uranium” (page 202). Unfortunately, information for plutonium is
scarce because appropriate samples of plutonium-242 are unavailable (the large neutron-
absorption cross section of the more-abundant plutonium-239 isotope makes the latter
unsuitable for neutron-scattering experiments). Another approach to estimating the various
contributions to the free energy is to determine the vibrational entropy terms semi-
empirically. For a more detailed discussion, see the article “Elasticity, Entropy, and
the Phase Stability of Plutonium” on page 208.
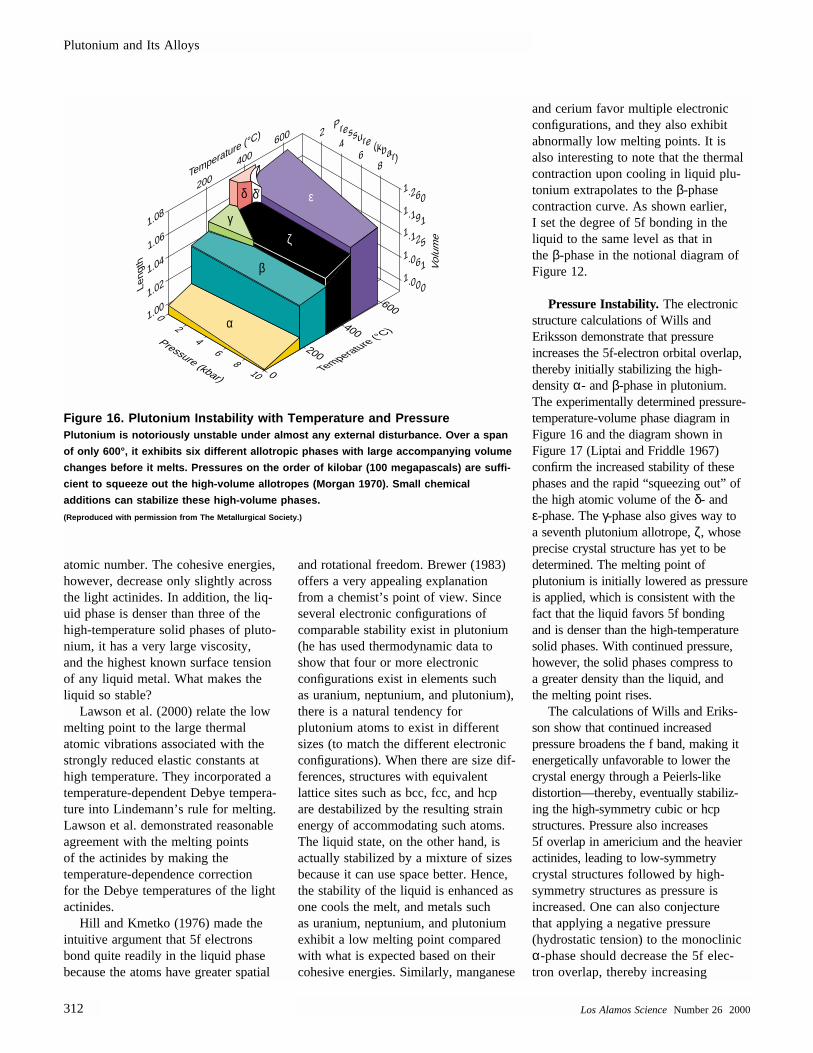
atomic number. The cohesive energies,however, decrease only slightly acrossthe light actinides. In addition, the liq-uid phase is denser than three of thehigh-temperature solid phases of pluto-nium, it has a very large viscosity, and the highest known surface tensionof any liquid metal. What makes theliquid so stable?
Lawson et al. (2000) relate the lowmelting point to the large thermal atomic vibrations associated with thestrongly reduced elastic constants athigh temperature. They incorporated atemperature-dependent Debye tempera-ture into Lindemann’s rule for melting.Lawson et al. demonstrated reasonableagreement with the melting points of the actinides by making the temperature-dependence correction for the Debye temperatures of the lightactinides.
Hill and Kmetko (1976) made the intuitive argument that 5f electronsbond quite readily in the liquid phasebecause the atoms have greater spatial
and rotational freedom. Brewer (1983)offers a very appealing explanationfrom a chemist’s point of view. Sinceseveral electronic configurations ofcomparable stability exist in plutonium(he has used thermodynamic data toshow that four or more electronic configurations exist in elements such as uranium, neptunium, and plutonium),there is a natural tendency for plutonium atoms to exist in differentsizes (to match the different electronicconfigurations). When there are size dif-ferences, structures with equivalentlattice sites such as bcc, fcc, and hcpare destabilized by the resulting strainenergy of accommodating such atoms.The liquid state, on the other hand, isactually stabilized by a mixture of sizesbecause it can use space better. Hence,the stability of the liquid is enhanced asone cools the melt, and metals such as uranium, neptunium, and plutoniumexhibit a low melting point comparedwith what is expected based on theircohesive energies. Similarly, manganese
and cerium favor multiple electronicconfigurations, and they also exhibit abnormally low melting points. It isalso interesting to note that the thermalcontraction upon cooling in liquid plu-tonium extrapolates to the β-phasecontraction curve. As shown earlier, I set the degree of 5f bonding in the liquid to the same level as that in the β-phase in the notional diagram ofFigure 12.
Pressure Instability. The electronicstructure calculations of Wills and Eriksson demonstrate that pressure increases the 5f-electron orbital overlap,thereby initially stabilizing the high-density α- and β-phase in plutonium.The experimentally determined pressure-temperature-volume phase diagram inFigure 16 and the diagram shown in Figure 17 (Liptai and Friddle 1967) confirm the increased stability of thesephases and the rapid “squeezing out” ofthe high atomic volume of the δ- and ε-phase. The γ-phase also gives way to a seventh plutonium allotrope, ζ, whoseprecise crystal structure has yet to be determined. The melting point of plutonium is initially lowered as pressureis applied, which is consistent with thefact that the liquid favors 5f bonding and is denser than the high-temperaturesolid phases. With continued pressure,however, the solid phases compress to a greater density than the liquid, and the melting point rises.
The calculations of Wills and Eriks-son show that continued increasedpressure broadens the f band, making itenergetically unfavorable to lower thecrystal energy through a Peierls-like distortion—thereby, eventually stabiliz-ing the high-symmetry cubic or hcpstructures. Pressure also increases 5f overlap in americium and the heavieractinides, leading to low-symmetry crystal structures followed by high-symmetry structures as pressure isincreased. One can also conjecture that applying a negative pressure (hydrostatic tension) to the monoclinicα-phase should decrease the 5f elec-tron overlap, thereby increasing
Plutonium and Its Alloys
312 Los Alamos ScienceNumber 26 2000
1.000
1.061
1.125
1.191
1.260
24
Pressure (kbar)68
1.001.02
1.04
1.06
1.08
200
400
Temperature (°C) 600
20
46
810
Pressure (kbar)
200
0
400
600
Temperature (°C)
Vol
ume
Leng
th
α
β
γ
δ δ′ ε
ζ
Figure 16. Plutonium Instability with Temperature and PressurePlutonium is notoriously unstable under almost any external disturbance. Over a span
of only 600°, it exhibits six different allotropic phases with large accompanying volume
changes before it melts. Pressures on the order of kilobar (100 megapascals) are suffi-
cient to squeeze out the high-volume allotropes (Morgan 1970). Small chemical
additions can stabilize these high-volume phases.
(Reproduced with permission from The Metallurgical Society.)
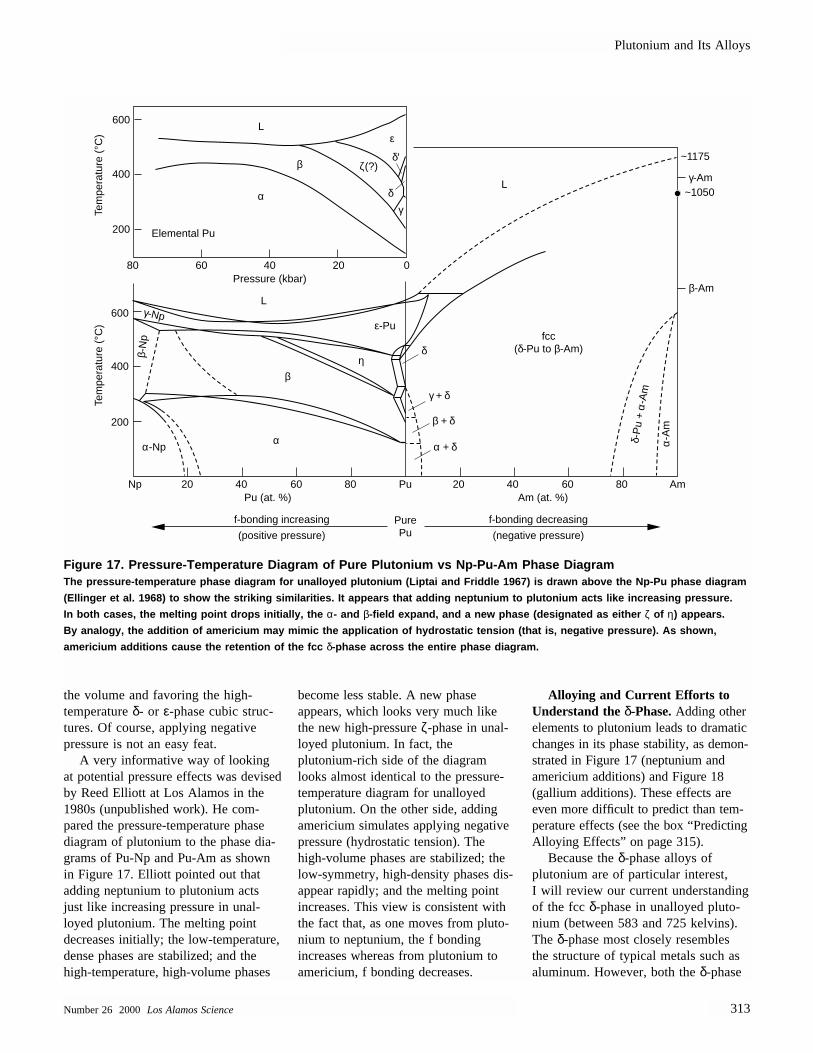
the volume and favoring the high-temperature δ- or ε-phase cubic struc-tures. Of course, applying negativepressure is not an easy feat.
A very informative way of lookingat potential pressure effects was devisedby Reed Elliott at Los Alamos in the1980s (unpublished work). He com-pared the pressure-temperature phasediagram of plutonium to the phase dia-grams of Pu-Np and Pu-Am as shownin Figure 17. Elliott pointed out thatadding neptunium to plutonium actsjust like increasing pressure in unal-loyed plutonium. The melting pointdecreases initially; the low-temperature,dense phases are stabilized; and thehigh-temperature, high-volume phases
become less stable. A new phase appears, which looks very much likethe new high-pressure ζ-phase in unal-loyed plutonium. In fact, theplutonium-rich side of the diagramlooks almost identical to the pressure-temperature diagram for unalloyedplutonium. On the other side, addingamericium simulates applying negativepressure (hydrostatic tension). Thehigh-volume phases are stabilized; thelow-symmetry, high-density phases dis-appear rapidly; and the melting pointincreases. This view is consistent withthe fact that, as one moves from pluto-nium to neptunium, the f bondingincreases whereas from plutonium toamericium, f bonding decreases.
Alloying and Current Efforts toUnderstand the δ-Phase.Adding otherelements to plutonium leads to dramaticchanges in its phase stability, as demon-strated in Figure 17 (neptunium andamericium additions) and Figure 18(gallium additions). These effects areeven more difficult to predict than tem-perature effects (see the box “PredictingAlloying Effects” on page 315).
Because the δ-phase alloys of plutonium are of particular interest, I will review our current understandingof the fcc δ-phase in unalloyed pluto-nium (between 583 and 725 kelvins).The δ-phase most closely resembles the structure of typical metals such asaluminum. However, both the δ-phase
Plutonium and Its Alloys
Number 26 2000 Los Alamos Science 313
020406080Pressure (kbar)
L
L
200
400
600L
δ′ζ(?)
δ
ε
γ
β
α
Elemental Pu
Tem
pera
ture
(°C
)Te
mpe
ratu
re (
°C)
200
Np 20 40 60 80 20 40 60 80Pu
PurePu
Pu (at. %)
f-bonding increasing
(positive pressure)
f-bonding decreasing
(negative pressure)
Am (at. %)Am
400
600ε-Pu
β-N
p
α-Npα
β
γ + δ
β + δ
α + δ
γ-Np
fcc(δ-Pu to β-Am)
β-Am
γ-Am~1050
~1175
α-A
m
η
δ-P
u+
α-A
m
δ
Figure 17. Pressure-Temperature Diagram of Pure Plutonium vs Np-Pu-Am Phase DiagramThe pressure-temperature phase diagram for unalloyed plutonium (Liptai and Friddle 1967) is drawn above the Np-Pu phase diagram
(Ellinger et al. 1968) to show the striking similarities. It appears that adding neptunium to plutonium acts like increasing pr essure.
In both cases, the melting point drops initially, the α- and β-field expand, and a new phase (designated as either ζ of η) appears.
By analogy, the addition of americium may mimic the application of hydrostatic tension (that is, negative pressure). As shown,
americium additions cause the retention of the fcc δ-phase across the entire phase diagram.
and the δ′-phase appear to be aberra-tions in the lineup of plutonium phases(the ε-phase thermal expansion line extrapolates almost exactly to that of the γ-phase in Figure 1). Of all plu-tonium phases, the δ-phase has thelargest atomic volume in spite of itsclose-packed structure. Its volume fallsbetween that of α-plutonium andamericium (Figure 9). These propertiesare yet to be explained, and δ-phasestability and electronic structure remainthe topics of hot debates.
Although the electronic-band-structure calculations of Wills andEriksson based on local-density approx-imation (LDA) do a very impressivejob of predicting pressure effects in the actinides, they cannot predict theexistence of the high-temperature phases. They do, however, predict thecorrect atomic volume of the δ-phase(calculated at 0 kelvins) by constrainingfour of the five 5f electrons to localize(collapse into the ionic core). Theseconstrained calculations capture the essential features of the electronicstructure of the δ-phase as measured forthe first time on gallium-stabilized δ-phase polycrystals. However, theirunconstrained band calculations (all five5f electrons are bonding) do not agreewith either the α- or δ-plutonium pho-toelectron spectroscopy (PES) results ofArko and his colleagues. (See the arti-cle “Photoelectron Spectroscopy of
α- and δ-Plutonium” on page 168.)Boring and Smith (see page 90) pointout that there is no obvious mechanismthat allows for partial localization ofthe 5f electrons. They also show, however, that if only one of five 5f electrons bonds in the δ-phase, the repulsive sp band contributions willexpand the lattice and the symmetry ofthe crystal structure will be determinedby the three spd electrons—that is,cubic structures will be favored.
Instead of partially localizing 5f electrons, Arko and Albers of Los Alamos (unpublished work) nowsuggest that all 5f electrons participatein bonding, but at reduced bondstrengths. They link reduced bondstrengths to strong electron-electroncorrelations. Such correlations effec-tively narrow the 5f band and enhancethe density of states at the Fermi energy. Arko and Albers argue that reducing the bandwidth weakens thebonding because the average bondstrength is directly proportional to the bandwidth. They also suggest thatcorrelation effects may be at work evenin α-plutonium, causing the 5f electronsto be more localized than LDA calcula-tions predict. According to them,understanding α- and δ-plutonium requires that calculations use a pertur-bation theory extension to thefirst-principles LDA band-structure calculations.
In the article “A Possible Model forδ-Plutonium” (page 154), Cooper alsogoes beyond the LDA band-structuremodels to a two-electron, impurity-likemodel to explain the δ-phase. He pro-poses that the δ-phase is the result of aself-induced Anderson localization ofthe 5f electrons. According to Cooper,in Anderson localization, the electronsare driven from coherent-wave bondingin the α-phase to localized behavior bystrong impurity scattering. To create an“impurity” in unalloyed plutonium,Cooper envisions two types of plutoni-um atoms—one in which the 5felectrons are localized and the other in which they oscillate between beinglocalized and bonding. The fcc δ-phasebecomes the lowest free-energy phaseover a certain temperature interval because of the gain in configurationalentropy (an additional contribution toentropy when more than one type ofatom is incorporated into a crystallinearray) of a solid solution of the twotypes of plutonium atoms occupyingcrystallographically equivalent sites in adisordered array. Unfortunately, the cal-culations necessary to deal withtwo-electron models for such complexsystems are several years from fruition.
The bottom line is that we do nothave a satisfactory explanation of the δ-phase in unalloyed plutonium today. It remains as one of the unsolved chal-lenges in condensed-matter physics.
Plutonium and Its Alloys
314 Los Alamos ScienceNumber 26 2000
1200
800
400
0Pu
20 40 60 80 100Ga
Tem
pera
ture
(°C
)
Gallium (at. %)
L
Pu 3G
a
Pu 5G
a 3
PuG
a 2
PuG
a 3P
uGa 3.
7
PuG
a 4P
uGa 6
Pu 2G
a 15
Pu 2G
a 3
Pu 2G
a 7
PuG
aP
uGa
ε
ε + δη
δδ+Pu3Ga
δ+Pu3Ga
δ′
No. of compoundsSize difference (%)
11−14.2
γβα
Figure 18. Alloying Effects on Plutonium Stability Small chemical additions can stabilize
the high-volume phases of plutonium.
The Pu-Ga phase diagram shows how
gallium additions of a few atomic percent
form a solid solution (gallium atoms are
incorporated into the plutonium fcc δ-
phase) that is retained to room temperature.
The rest of the diagram shows the enor-
mous complexity and richness of alloying
behavior. The Pu-Ga system exhibits 11 dif-
ferent intermetallic compounds and several
new phases that are different from those of
elemental plutonium or gallium (Peterson
and Kassner 1988).
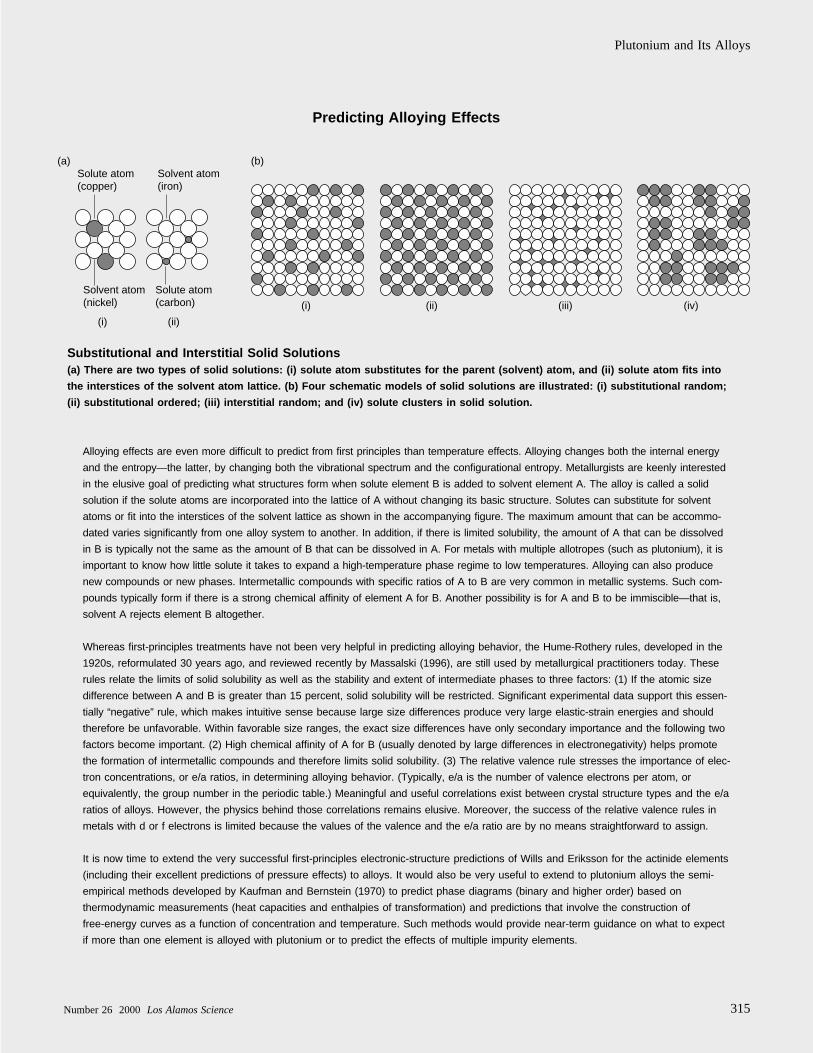
Plutonium and Its Alloys
Number 26 2000 Los Alamos Science 315
Alloying effects are even more difficult to predict from first principles than temperature effects. Alloying changes both the internal energy
and the entropy—the latter, by changing both the vibrational spectrum and the configurational entropy. Metallurgists are keenly interested
in the elusive goal of predicting what structures form when solute element B is added to solvent element A. The alloy is called a solid
solution if the solute atoms are incorporated into the lattice of A without changing its basic structure. Solutes can substitute for solvent
atoms or fit into the interstices of the solvent lattice as shown in the accompanying figure. The maximum amount that can be accommo-
dated varies significantly from one alloy system to another. In addition, if there is limited solubility, the amount of A that can be dissolved
in B is typically not the same as the amount of B that can be dissolved in A. For metals with multiple allotropes (such as plutonium), it is
important to know how little solute it takes to expand a high-temperature phase regime to low temperatures. Alloying can also produce
new compounds or new phases. Intermetallic compounds with specific ratios of A to B are very common in metallic systems. Such com-
pounds typically form if there is a strong chemical affinity of element A for B. Another possibility is for A and B to be immiscible—that is,
solvent A rejects element B altogether.
Whereas first-principles treatments have not been very helpful in predicting alloying behavior, the Hume-Rothery rules, developed in the
1920s, reformulated 30 years ago, and reviewed recently by Massalski (1996), are still used by metallurgical practitioners today. These
rules relate the limits of solid solubility as well as the stability and extent of intermediate phases to three factors: (1) If the atomic size
difference between A and B is greater than 15 percent, solid solubility will be restricted. Significant experimental data support this essen-
tially “negative” rule, which makes intuitive sense because large size differences produce very large elastic-strain energies and should
therefore be unfavorable. Within favorable size ranges, the exact size differences have only secondary importance and the following two
factors become important. (2) High chemical affinity of A for B (usually denoted by large differences in electronegativity) helps promote
the formation of intermetallic compounds and therefore limits solid solubility. (3) The relative valence rule stresses the importance of elec-
tron concentrations, or e/a ratios, in determining alloying behavior. (Typically, e/a is the number of valence electrons per atom, or
equivalently, the group number in the periodic table.) Meaningful and useful correlations exist between crystal structure types and the e/a
ratios of alloys. However, the physics behind those correlations remains elusive. Moreover, the success of the relative valence rules in
metals with d or f electrons is limited because the values of the valence and the e/a ratio are by no means straightforward to assign.
It is now time to extend the very successful first-principles electronic-structure predictions of Wills and Eriksson for the actinide elements
(including their excellent predictions of pressure effects) to alloys. It would also be very useful to extend to plutonium alloys the semi-
empirical methods developed by Kaufman and Bernstein (1970) to predict phase diagrams (binary and higher order) based on
thermodynamic measurements (heat capacities and enthalpies of transformation) and predictions that involve the construction of
free-energy curves as a function of concentration and temperature. Such methods would provide near-term guidance on what to expect
if more than one element is alloyed with plutonium or to predict the effects of multiple impurity elements.
Substitutional and Interstitial Solid Solutions(a) There are two types of solid solutions: (i) solute atom substitutes for the parent (solvent) atom, and (ii) solute atom fits into
the interstices of the solvent atom lattice. (b) Four schematic models of solid solutions are illustrated: (i) substitutional r andom;
(ii) substitutional ordered; (iii) interstitial random; and (iv) solute clusters in solid solution .
Solute atom(copper)
(a) (b)Solvent atom(iron)
Solvent atom(nickel)
(i) (ii)
(i) (ii) (iii) (iv)
Solute atom(carbon)
Predicting Alloying Effects
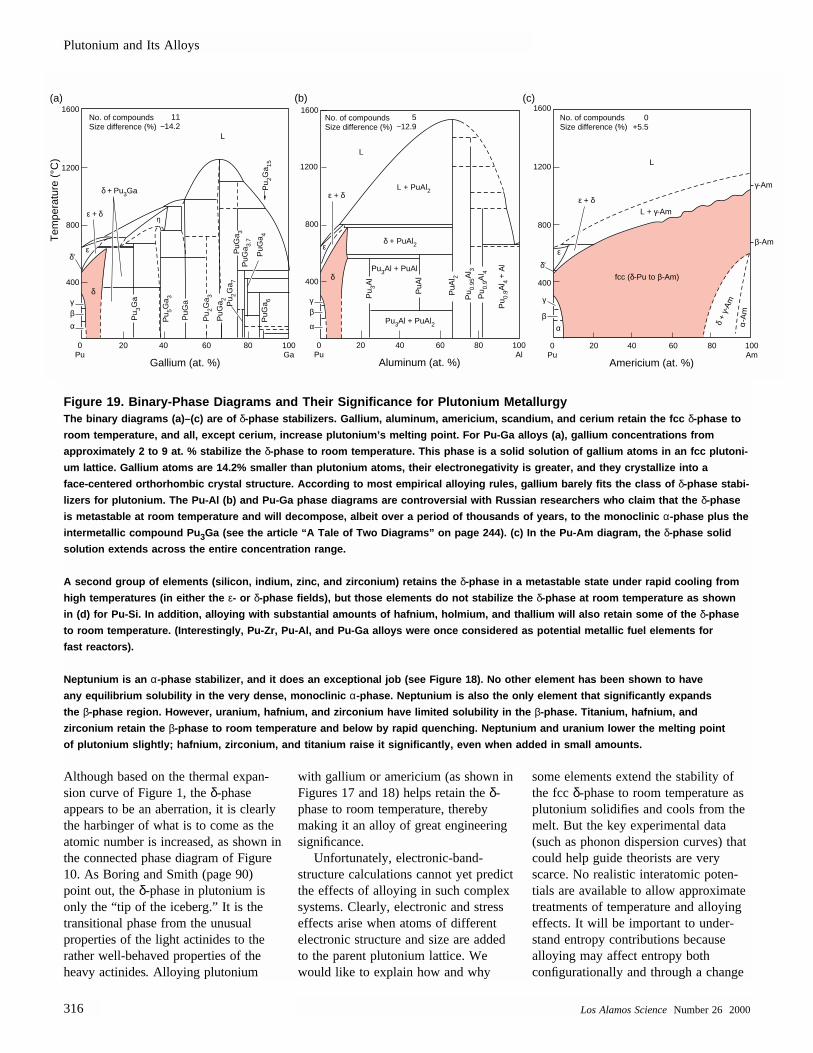
Although based on the thermal expan-sion curve of Figure 1, the δ-phaseappears to be an aberration, it is clearlythe harbinger of what is to come as theatomic number is increased, as shown inthe connected phase diagram of Figure10. As Boring and Smith (page 90)point out, the δ-phase in plutonium isonly the “tip of the iceberg.” It is thetransitional phase from the unusualproperties of the light actinides to therather well-behaved properties of theheavy actinides. Alloying plutonium
with gallium or americium (as shown inFigures 17 and 18) helps retain the δ-phase to room temperature, therebymaking it an alloy of great engineeringsignificance.
Unfortunately, electronic-band-structure calculations cannot yet predictthe effects of alloying in such complexsystems. Clearly, electronic and stresseffects arise when atoms of differentelectronic structure and size are addedto the parent plutonium lattice. Wewould like to explain how and why
some elements extend the stability ofthe fcc δ-phase to room temperature asplutonium solidifies and cools from themelt. But the key experimental data(such as phonon dispersion curves) thatcould help guide theorists are veryscarce. No realistic interatomic poten-tials are available to allow approximatetreatments of temperature and alloyingeffects. It will be important to under-stand entropy contributions becausealloying may affect entropy both configurationally and through a change
Plutonium and Its Alloys
316 Los Alamos ScienceNumber 26 2000
1600(a) (b) (c)
1200
800
400
1600
1200
800
400
0Pu
20 40 60 80 100Al
Aluminum (at. %)
L
L + PuAl2
δ + PuAl2
Pu 3A
l
PuA
l 2
Pu 0.
95A
l 3
Pu 0.
9Al 4
PuA
l
No. of compoundsSize difference (%)
5−12.9
0Pu
20 40 60 80 100Am
Americium (at. %)
1200
1600
800
400
0Pu
20 40 60 80 100Ga
Tem
pera
ture
(°C
)
Gallium (at. %)
LP
u 3Ga
Pu 5G
a 3
PuG
a 2
PuG
a 3P
uGa 3.
7
PuG
a 4P
uGa 6
Pu 2G
a 15
Pu 2G
a 3
Pu 2G
a 7
PuG
a
ε ε
ε + δ
η
δ
δ
δ + Pu3Ga
δ′
No. of compoundsSize difference (%)
11−14.2
γβα
γβ
α
L
L + γ-Am
δ +
γ-A
m
ε
γ
βα
ε + δ
fcc (δ-Pu to β-Am)
α-A
m
No. of compoundsSize difference (%)
0+5.5
β-Am
γ-Am
Pu3Al + PuAl2
Pu3Al + PuAl
ε + δ
δ′
Pu 0.
9Al 4
+ A
l
Figure 19. Binary-Phase Diagrams and Their Significance for Plutonium Metallurgy The binary diagrams (a)–(c) are of δ-phase stabilizers. Gallium, aluminum, americium, scandium, and cerium retain the fcc δ-phase to
room temperature, and all, except cerium, increase plutonium’s melting point. For Pu-Ga alloys (a), gallium concentrations from
approximately 2 to 9 at. % stabilize the δ-phase to room temperature. This phase is a solid solution of gallium atoms in an fcc plutoni-
um lattice. Gallium atoms are 14.2% smaller than plutonium atoms, their electronegativity is greater, and they crystallize into a
face-centered orthorhombic crystal structure. According to most empirical alloying rules, gallium barely fits the class of δ-phase stabi-
lizers for plutonium. The Pu-Al (b) and Pu-Ga phase diagrams are controversial with Russian researchers who claim that the δ-phase
is metastable at room temperature and will decompose, albeit over a period of thousands of years, to the monoclinic α-phase plus the
intermetallic compound Pu 3Ga (see the article “A Tale of Two Diagrams” on page 244). (c) In the Pu-Am diagram, the δ-phase solid
solution extends across the entire concentration range.
A second group of elements (silicon, indium, zinc, and zirconium) retains the δ-phase in a metastable state under rapid cooling from
high temperatures (in either the ε- or δ-phase fields), but those elements do not stabilize the δ-phase at room temperature as shown
in (d) for Pu-Si. In addition, alloying with substantial amounts of hafnium, holmium, and thallium will also retain some of the δ-phase
to room temperature. (Interestingly, Pu-Zr, Pu-Al, and Pu-Ga alloys were once considered as potential metallic fuel elements fo r
fast reactors).
Neptunium is an α-phase stabilizer, and it does an exceptional job (see Figure 18). No other element has been shown to have
any equilibrium solubility in the very dense, monoclinic α-phase. Neptunium is also the only element that significantly expands
the β-phase region. However, uranium, hafnium, and zirconium have limited solubility in the β-phase. Titanium, hafnium, and
zirconium retain the β-phase to room temperature and below by rapid quenching. Neptunium and uranium lower the melting point
of plutonium slightly; hafnium, zirconium, and titanium raise it significantly, even when added in small amounts.
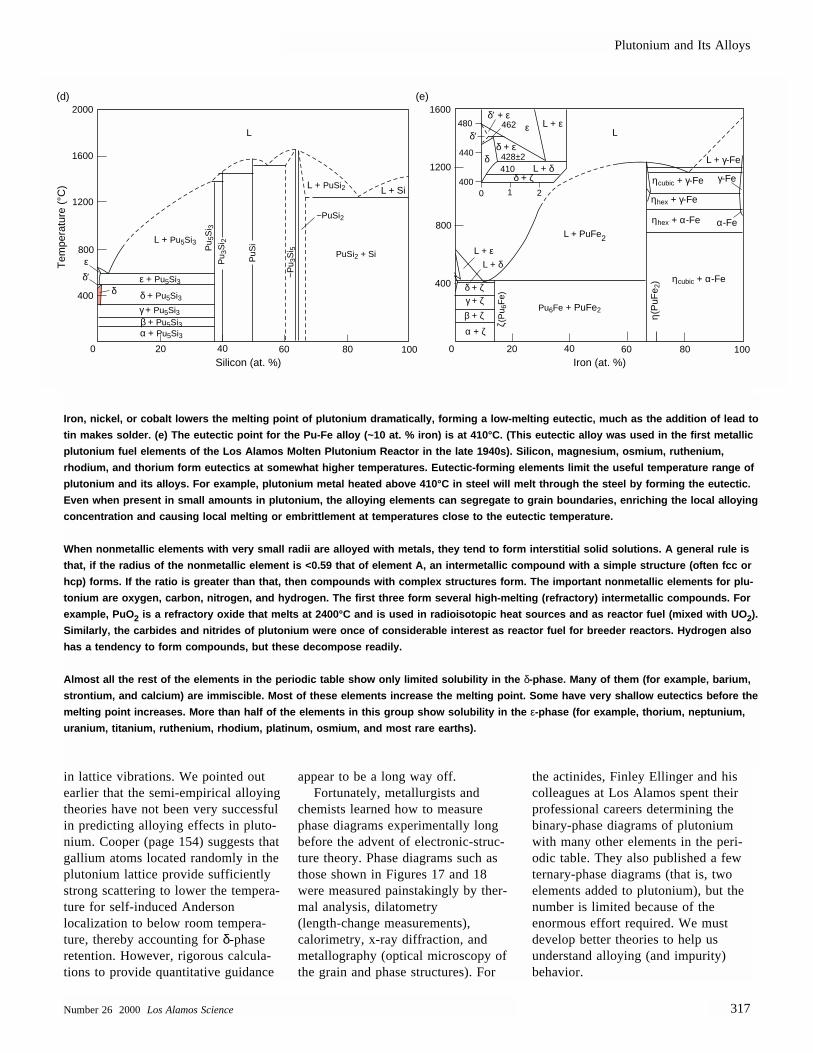
in lattice vibrations. We pointed outearlier that the semi-empirical alloyingtheories have not been very successfulin predicting alloying effects in pluto-nium. Cooper (page 154) suggests thatgallium atoms located randomly in theplutonium lattice provide sufficientlystrong scattering to lower the tempera-ture for self-induced Andersonlocalization to below room tempera-ture, thereby accounting for δ-phaseretention. However, rigorous calcula-tions to provide quantitative guidance
appear to be a long way off. Fortunately, metallurgists and
chemists learned how to measurephase diagrams experimentally longbefore the advent of electronic-struc-ture theory. Phase diagrams such asthose shown in Figures 17 and 18were measured painstakingly by ther-mal analysis, dilatometry(length-change measurements),calorimetry, x-ray diffraction, andmetallography (optical microscopy ofthe grain and phase structures). For
the actinides, Finley Ellinger and hiscolleagues at Los Alamos spent theirprofessional careers determining the binary-phase diagrams of plutoniumwith many other elements in the peri-odic table. They also published a fewternary-phase diagrams (that is, twoelements added to plutonium), but thenumber is limited because of the enormous effort required. We must develop better theories to help us understand alloying (and impurity) behavior.
Plutonium and Its Alloys
Number 26 2000 Los Alamos Science 317
1600
1200
800
400
2000
1600
1200
800
400
40200 60 80 100Iron (at. %)
40200 60 80 100Silicon (at. %)
L480
440
4000 2
410428±2
462
1
δ′ + ε
δ′δ + ε
L + ε
δ
ε
L + δδ + ζ
L + PuFe2
ηcubic + γ-Fe
ηhex + γ-Fe
ηhex + α-Fe α-Fe
γ-Fe
L + γ-Fe
ηcubic + α-Fe
η(P
uFe 2
)
Pu6Fe + PuFe2
L + Pu5Si3
L
L + SiL + PuSi2
ζ(P
u 6F
e)
Pu 5
Si 3
Pu 3
Si 2
~P
u 3S
i 5
PuS
iL + ε
δ + ζδ + Pu5Si3
δδ′ ε + Pu5Si3
ε
γ + ζγ + Pu5Si3 β + ζβ + Pu5Si3
α + ζα + Pu5Si3
L + δ
(d) (e)
PuSi2 + Si
Tem
pera
ture
(°C
)
~PuSi2
Iron, nickel, or cobalt lowers the melting point of plutonium dramatically, forming a low-melting eutectic, much as the additio n of lead to
tin makes solder. (e) The eutectic point for the Pu-Fe alloy (~10 at. % iron) is at 410°C. (This eutectic alloy was used in the first metallic
plutonium fuel elements of the Los Alamos Molten Plutonium Reactor in the late 1940s). Silicon, magnesium, osmium, ruthenium,
rhodium, and thorium form eutectics at somewhat higher temperatures. Eutectic-forming elements limit the useful temperature ran ge of
plutonium and its alloys. For example, plutonium metal heated above 410°C in steel will melt through the steel by forming the e utectic.
Even when present in small amounts in plutonium, the alloying elements can segregate to grain boundaries, enriching the local a lloying
concentration and causing local melting or embrittlement at temperatures close to the eutectic temperature.
When nonmetallic elements with very small radii are alloyed with metals, they tend to form interstitial solid solutions. A gene ral rule is
that, if the radius of the nonmetallic element is <0.59 that of element A, an intermetallic compound with a simple structure (o ften fcc or
hcp) forms. If the ratio is greater than that, then compounds with complex structures form. The important nonmetallic elements for plu-
tonium are oxygen, carbon, nitrogen, and hydrogen. The first three form several high-melting (refractory) intermetallic compound s. For
example, PuO 2 is a refractory oxide that melts at 2400°C and is used in radioisotopic heat sources and as reactor fuel (mixed with UO 2).
Similarly, the carbides and nitrides of plutonium were once of considerable interest as reactor fuel for breeder reactors. Hydr ogen also
has a tendency to form compounds, but these decompose readily.
Almost all the rest of the elements in the periodic table show only limited solubility in the δ-phase. Many of them (for example, barium,
strontium, and calcium) are immiscible. Most of these elements increase the melting point. Some have very shallow eutectics bef ore the
melting point increases. More than half of the elements in this group show solubility in the ε-phase (for example, thorium, neptunium,
uranium, titanium, ruthenium, rhodium, platinum, osmium, and most rare earths).
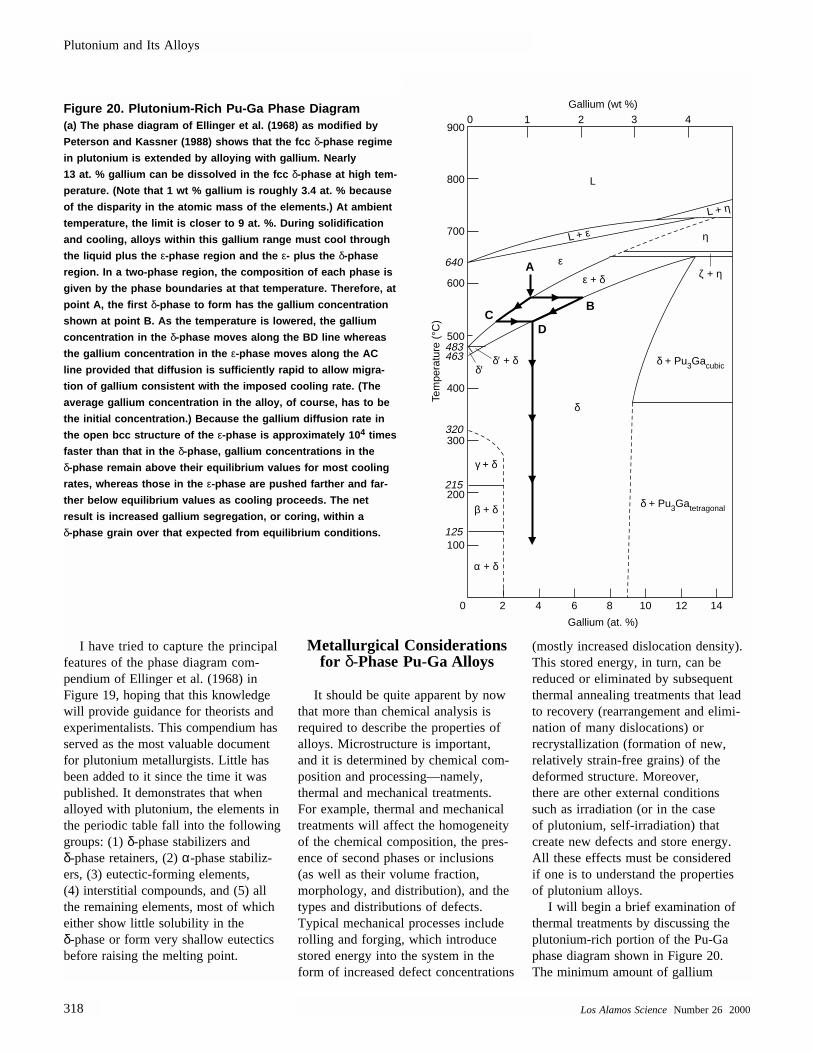
I have tried to capture the principalfeatures of the phase diagram com-pendium of Ellinger et al. (1968) inFigure 19, hoping that this knowledgewill provide guidance for theorists andexperimentalists. This compendium hasserved as the most valuable documentfor plutonium metallurgists. Little hasbeen added to it since the time it waspublished. It demonstrates that when alloyed with plutonium, the elements inthe periodic table fall into the followinggroups: (1) δ-phase stabilizers and δ-phase retainers, (2) α-phase stabiliz-ers, (3) eutectic-forming elements, (4) interstitial compounds, and (5) allthe remaining elements, most of whicheither show little solubility in the δ-phase or form very shallow eutecticsbefore raising the melting point.
Metallurgical Considerations for δ-Phase Pu-Ga Alloys
It should be quite apparent by nowthat more than chemical analysis is required to describe the properties ofalloys. Microstructure is important, and it is determined by chemical com-position and processing—namely,thermal and mechanical treatments. For example, thermal and mechanicaltreatments will affect the homogeneityof the chemical composition, the pres-ence of second phases or inclusions (as well as their volume fraction, morphology, and distribution), and thetypes and distributions of defects. Typical mechanical processes includerolling and forging, which introducestored energy into the system in theform of increased defect concentrations
(mostly increased dislocation density).This stored energy, in turn, can be reduced or eliminated by subsequentthermal annealing treatments that leadto recovery (rearrangement and elimi-nation of many dislocations) orrecrystallization (formation of new, relatively strain-free grains) of the deformed structure. Moreover, there are other external conditions such as irradiation (or in the case of plutonium, self-irradiation) that create new defects and store energy.All these effects must be considered if one is to understand the properties of plutonium alloys.
I will begin a brief examination ofthermal treatments by discussing theplutonium-rich portion of the Pu-Gaphase diagram shown in Figure 20. The minimum amount of gallium
Plutonium and Its Alloys
318 Los Alamos ScienceNumber 26 2000
Gallium (wt %)
Gallium (at. %)
Tem
pera
ture
(°C
)
0900
800
700
600
640
500483463
320
400
300
215
125
200
100
0 2 4 6 8 10 12 14
1 2 3 4
A
B
L
CD
L + ε
ε
ε + δ
γ + δ
β + δ
α + δ
δ
δ + Pu3Gacubic
δ + Pu3Gatetragonal
δ′δ′ + δ
ζ + η
L + η
η
Figure 20. Plutonium-Rich Pu-Ga Phase Diagram (a) The phase diagram of Ellinger et al. (1968) as modified by
Peterson and Kassner (1988) shows that the fcc δ-phase regime
in plutonium is extended by alloying with gallium. Nearly
13 at. % gallium can be dissolved in the fcc δ-phase at high tem-
perature. (Note that 1 wt % gallium is roughly 3.4 at. % because
of the disparity in the atomic mass of the elements.) At ambient
temperature, the limit is closer to 9 at. %. During solidification
and cooling, alloys within this gallium range must cool through
the liquid plus the ε-phase region and the ε- plus the δ-phase
region. In a two-phase region, the composition of each phase is
given by the phase boundaries at that temperature. Therefore, at
point A, the first δ-phase to form has the gallium concentration
shown at point B. As the temperature is lowered, the gallium
concentration in the δ-phase moves along the BD line whereas
the gallium concentration in the ε-phase moves along the AC
line provided that diffusion is sufficiently rapid to allow migra-
tion of gallium consistent with the imposed cooling rate. (The
average gallium concentration in the alloy, of course, has to be
the initial concentration.) Because the gallium diffusion rate in
the open bcc structure of the ε-phase is approximately 10 4 times
faster than that in the δ-phase, gallium concentrations in the
δ-phase remain above their equilibrium values for most cooling
rates, whereas those in the ε-phase are pushed farther and far-
ther below equilibrium values as cooling proceeds. The net
result is increased gallium segregation, or coring, within a
δ-phase grain over that expected from equilibrium conditions.
required to stabilize the δ-phase at ambient temperature is 2 at. % accord-ing to Ellinger et al. (1968). In reality,this phase boundary is very uncertain(shown by a dashed line) because it isdifficult to achieve equilibrium. Over 30 years ago, Elliott and othersreported that as little as 1 at. % galliumor aluminum effectively retains the δ-phase to room temperature if samplesare cooled rapidly enough from elevated temperature. It is quite remarkable that only one gallium atomin one hundred plutonium atoms causessuch a dramatic change in crystal structure. On the other hand, as dis-cussed by Hecker and Timofeeva (page 244), carefully performed Russ-ian work showed that all δ-phase Pu-Ga alloys are metastable at room temperature.
One of the principal differences between δ-phase alloys and unalloyedplutonium is the solidification behaviorimportant in casting. As shown in Figure 2, unalloyed plutonium exhibits a large expansion upon solidification, fol-lowed by very large contractions in thesolid state. Cracking and distortion arethe rule. Consequently, it is very difficultto make a full-density (19.86 g/cm3),sound α-phase casting. The Pu-Ga alloys, on the other hand, show a smallerexpansion upon solidification followedby a small, quite uniform contraction.However, for reasons demonstrated inFigure 20, it is quite common for alloycastings to exhibit two phases—the gallium-rich δ-phase and the gallium-lean monoclinic α-phase. The exactamount of each phase depends primarilyon the average gallium concentration and
on the cooling rate. To minimize galliummicrosegregation and “homogenize” thegallium distribution, it is necessary to anneal at the highest possible tempera-ture in the δ-phase region. The timerequired for homogenization decreaseswith decreasing grain size and increasingtemperature (as long as the temperatureremains in the δ-phase region).
Density and x-ray diffraction mea-surements have demonstratedconclusively that the crystal structure of the δ-phase alloy is the same as thehigh-temperature δ-phase of unalloyedplutonium except that gallium soluteatoms substitute for plutonium atoms inthe fcc lattice. Results of x-ray diffrac-tion typically show well-defined Braggpeaks of the single fcc phase. The lat-tice parameters of the alloys shrinkwith the addition of gallium. The con-
Plutonium and Its Alloys
Number 26 2000 Los Alamos Science 319
(b)The microstructure of a typical as-cast δ-phase alloy
exhibits a range of gallium concentrations between points B
and C in (a). The interior of the δ-phase grains reflects the gal-
lium concentration at point B, and the grain boundaries may
have very little gallium, reflecting the last ε-phase to transform
with gallium at or below point C. As shown, the resulting
microstructure appears heavily “cored” or segregated. It con-
sists of a gallium-rich δ-phase in the center, a gallium-lean
δ-phase shell (dark areas) at the core boundaries, and an
intercore region very lean in gallium that transformed to
the α-phase during cooling because of insufficient gallium
content. The measured and calculated gallium-concentration
profiles from the center to the edge of a grain (Mitchell et al.
2000) are also shown. This type of microsegregation typically
occurs during cooling through the liquid plus solid region
of most alloys because diffusion in the liquid is typically
so much faster. The anomalously high diffusion rate in
ε-plutonium avoids the problem in the liquid- plus ε-phase
region, only to have it appear in the ε- plus δ-phase region.
To equilibrate the gallium concentration, it is necessary
to return to very high temperatures in the δ-phase region and
hold those temperatures for long times. The progression
of gallium homogenization and consequent change in
microstructure are also shown for a temperature of 460°C.
0
0.4
0.8
1.2
1.6
5 10Distance (µm)
Profile-Model Results Metallography
Ga
(wt %
)
15 20 25
0
0.4
0.8
1.2
1.6
5 10Distance (µm)
Ga
(wt %
)
15 20 25
0
0.4
0.8
1.2
1.6
5 10Distance (µm)
Ga
(wt %
)
15 20 25
0
0.4
0.8
1.2
1.6
5 10Distance (µm)
Ga
(wt %
)
15 20 25
As-cast
Experimental
Equili-brium
460°C, 2 h
460°C, 20 h
460°C, 720 h
traction is greater than expected from arule of mixtures (called Vegard’s law)as shown in Figure 21. The only two elements that increase the lattice para-meter of the δ-phase are cerium andamericium.
We do not know if gallium atoms arepresent at random in the fcc plutoniumlattice or in an ordered array. In the pastfew years, Steve Conradson of LosAlamos and researchers in France haveused x-ray absorption fine structure(XAFS) spectroscopy techniques at syn-chrotrons to probe the local environmentaround both plutonium and galliumatoms in the alloys. They confirmed thesubstitutional nature of the galliumatoms. The Pu-Pu atom spacing is con-siderably larger than the Pu-Ga spacing.
For gallium-lean alloys, Conradson’sdata suggest a short-range, local order inaddition to the long-range structurecharacterized by the usual fcc lattice parameters. We do not fully understandthese finer details at this time. However,these features may be very important to the aging of plutonium alloys.
The role of impurities, or uninten-tional chemical additions, on phasestability in δ-phase fcc alloys is also notwell understood. Impurities typically re-sult from solidification or otherprocessing operations, and the levels inplutonium metal are typically 1000 to2000 parts per million (ppm) total byweight. Purification by electrorefiningdrops this level easily to <500 ppm, andlevels of tens of parts per million have
been achieved with great care (see thearticle “Preparing Single Crystals ofGallium-Stabilized Plutonium” on page226). At the higher levels, impuritiescan influence phase stability, transfor-mation behavior, mechanical properties,and a whole array of other physicalproperties. In recent work, Dan Thomaand coworkers at Los Alamos have con-vincingly demonstrated these effects foruranium. No theory or modeling is cur-rently available to help us understandthe role of impurities in plutonium.
From a practical standpoint, the effectof impurities on phase stability is bestassessed if impurities are classified according to the scheme used for alloy-ing elements in Figure 19. Hence,common impurities such as aluminum,silicon, and americium that retain the δ-phase are simply added to the galliumconcentration (on an atomic percentagebasis) to give an equivalent content forPu-Ga alloys. Since these impurity ele-ments are present on the plutoniumlattice sites, they are not distinguishableby typical metallographic or x-ray dif-fraction techniques. XAFS offers somehope for distinguishing the impurityatoms if they are present in sufficientlylarge concentrations. However, evensmall amounts of impurities can causeserious degradation of properties becauseimpurities typically concentrate in themelt during casting. Solute atoms areusually rejected during the early stagesof solidification because atoms of differ-ent size are more easily accommodatedin the liquid. This tendency to segregateimpurity elements leads to inclusions(second-phase particles) in the microstructure of plutonium or its alloys.Typical eutectic-forming impurities andrefractory-compound forming inclusionsare shown in Figure 22. There is also thetendency for impurities to form complexcompounds such as oxycarbides andcarbo-nitrides, or for them to scavengesome of the intentional alloying elementsor other impurities. We understand verylittle about these effects in plutonium.
To conclude this section, let me reiterate the importance of metallurgicalprocessing in understanding the behavior
Plutonium and Its Alloys
320 Los Alamos ScienceNumber 26 2000
4.75
4.70
4.65
4.60
4.55
4.500 10 20
Atomic solute (%)30 40
Am
Ce
Vegard's law for Ga
Latti
ce c
onst
ant (
Å)
Pu3Ga
AlG
a
Figure 21. Lattice Parameters and Vegard’s Law for fcc Plutonium AlloysWhen gallium, aluminum, scandium, cerium, and americium are added to plutonium,
they substitute for plutonium in the fcc δ-lattice, causing the retention of the δ-phase
to room temperature. Additions of gallium, aluminum, and scandium contract the lat-
tice, whereas those of cerium and americium expand it. The contractions for gallium
and aluminum are greater than the contraction predicted by a rule of mixtures based
on atomic radii (known as Vegard’s law). The figure compares Vegard’s law and
experimental results for gallium additions.
of plutonium alloys. An accurate chemi-cal analysis is necessary, but notsufficient. Knowing the processing para-meters is crucial to ascertain the level ofsegregation of the alloying element andthe state of the impurity atoms. In addi-tion, mechanical treatments will changethe microstructure. These effects are discussed by Hecker and Stevens (page 336). So, even if a plutonium alloyis retained in the fcc δ-phase at roomtemperature, it is at best metastable andvery sensitive to external conditions,such as temperature, pressure, or otherapplied stresses. The phase diagrams pro-vide us with an overall guide to phasestability, but they do not tell us muchabout just how stable these alloys will beto all possible external changes.
We know from experience, for exam-ple, that plutonium alloys with <2 at. %gallium transform readily to the mono-clinic α-phase just below roomtemperature. And I mentioned above thatthe δ-phase is squeezed out easily by theapplication of pressure at room tempera-ture. In addition, under the stressesinduced during cutting, machining, or
polishing, the lean alloys readily trans-form to the α-phase on the surface(sometimes in combination with the γ-phase). As the gallium concentration isincreased, stability with respect to theseexternal forces increases steadily. Predic-tions of phase stability as a function ofsolute concentration and external stressesmay be helped significantly by electron-ic-structure calculations, especially ifthese calculations were to include tem-perature effects. It would also be veryhelpful if theorists could develop otherphysics-based models that incorporaterealistic interatomic potentials capable ofcalculating the influence of defects andmicrostructure on phase stability.
Phase Transformation in Plutonium and Its Alloy
The Ellinger compendium of plutoni-um alloy phase diagrams providesstructural maps of possible phases andcrystal structures at thermodynamic equi-librium (or, at least, the best one can doin a practical sense given kinetic limita-
tions). Phase transformations provide thevehicle to get from one phase region toanother. And, more important, the natureof the phase transformations governs resulting microstructures, which controlthe properties. In plutonium, phase trans-formations are triggered easily bychanges in temperature, pressure, stress,or chemistry. Plutonium and its alloysexhibit virtually every phase transforma-tion found in all other elementscombined. To understand phase transfor-mations, we must first understand thethermodynamic driving forces, the crys-tallographic mechanisms at the atomiclevel, and the kinetics of the transforma-tion processes. (see the box “PhaseTransformation Basics” on page 322).Direct observations of transformations inplutonium—either in situ or after theyhave occurred—are very difficult because of the metal’s reactive and radioactive nature. Moreover, the largenumber of allotropes and large surfacedistortions also make such observationsdifficult. Consequently, most informationabout transformation mechanisms in plu-tonium and its alloys is based on
Plutonium and Its Alloys
Number 26 2000 Los Alamos Science 321
Figure 22. Iron and Nitrogen Impurities in PlutoniumImpurities typically segregate in the melt and form microscopic inclusions in the δ-phase structure. Even reasonably small concen-
trations of impurities, on the order of a few hundred parts per million by weight, can give rise to micrometer-size inclusions as
shown in (a) and (b), which are representative of Pu-Ga alloys with 300 to 500 ppm iron concentrations. In (a), the processing condi-
tions favored inclusions of the low-melting eutectic compound Pu 6Fe strung out along the grain boundaries, whereas in (b)
processing conditions favored the conglomeration of Pu 6Fe at the grain-boundary triple points in particular. The reasons for the dif-
ferent morphology of inclusions for different processing conditions are not understood. In (c), an isolated plutonium nitride i nclusion
is shown in Pu-Ga alloy containing several hundred parts per million by weight nitrogen in the bulk alloy.
(a) (b) (c)
25 µm 10 µm
Continued on page 328
25 µm
Plutonium and Its Alloys
322 Los Alamos ScienceNumber 26 2000
All phase transformations are driven by a reduction in the Gibbs free energyfrom the original to the final structure. Although the driving force for a phasechange may exist, thermal activation is typically necessary to overcome the existing activation barriers. As a result of the random thermal motion of atoms, the energy of any particular atom or small collection of atoms will be just suffi-cient to initiate the phase change. Kinetics will determine how fast thetransformation proceeds, and the transformation mechanism will help shape the resulting microstructure.
Diffusional Transformations. Phase transformations can be divided into twopredominant types—diffusional and diffusionless. Most transformations occur by diffusional processes—that is, they occur at sufficiently high homologous tem-peratures to allow diffusion to play a role in the nucleation and growth processesof the transformation itself. In single-component systems (such as the high-temperature allotropes of plutonium), the only atomic process that occurs is therandom, short-range (on the order of an atomic spacing) thermally activated atom-by-atom jumps across the interface from the parent to the product crystalstructure. In transformations in which the product and parent phases have differentcompositions, two successive processes occur: (1) long-range transport by diffu-sion of, say, the solute atoms over distances of many atomic spacings and (2) short-range atomic transport across the parent-product interface. The atomsmake thermally activated random jumps across the interface to create a productnucleus, or a new small region that has a completely different composition and/orstructure from the parent phase. The product nucleus is separated from the parentmatrix by an interface with an interfacial energy. Most of the matrix remains untransformed until the product nucleus grows to consume it. Figure A shows anexample of a diffusional transformation in steel, in which both structure and com-position are changed.
Diffusional transformations can proceed isothermally to completion, being lim-ited only by adequate diffusion rates. They may or may not display specificcrystallographic orientation relationships, and the product-parent interface may be coherent, semicoherent, or incoherent (Figure B), involving the nucleation and growth of the product phase from the parent phase. In all of them, an activa-tion barrier must be overcome to reach a critical nucleus size. Because of thediffusional nature of the atomic movements required, the activation energy and the critical embryo size vary exponentially with temperature and scale with themelting point. The kinetics is described by an Arrhenius rate equation. The rate isproportional to exp(–∆G/kBT), where G is the Gibbs free energy.
The principal barriers that must be overcome to nucleate the product phase arethe interfacial free energy of the product-parent phase and the misfit strain energy.For homogeneous (uniform) nucleation, the interfacial energy represents an almostinsurmountable obstacle. So, most diffusional transformations in solids are nucle-ated heterogeneously at defects such as excess vacancies, dislocations, grainboundaries, stacking faults, inclusions, and free surfaces. Defects can greatly reduce the size of the activation barrier required to nucleate the new phase in response to the thermodynamic driving force to lower the Gibbs free energy. The optimal shape of the new product phase typically minimizes the total interfa-
Phase Transformation Basics
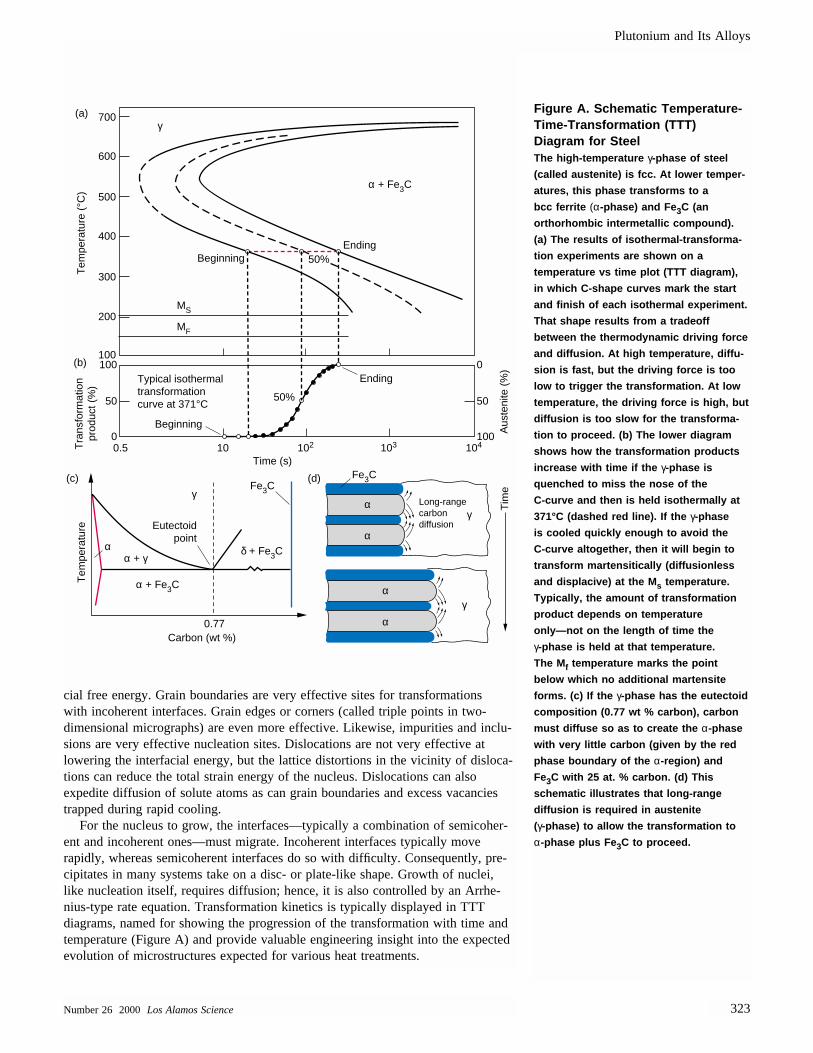
Plutonium and Its Alloys
Number 26 2000 Los Alamos Science 323
cial free energy. Grain boundaries are very effective sites for transformations with incoherent interfaces. Grain edges or corners (called triple points in two-dimensional micrographs) are even more effective. Likewise, impurities and inclu-sions are very effective nucleation sites. Dislocations are not very effective atlowering the interfacial energy, but the lattice distortions in the vicinity of disloca-tions can reduce the total strain energy of the nucleus. Dislocations can alsoexpedite diffusion of solute atoms as can grain boundaries and excess vacanciestrapped during rapid cooling.
For the nucleus to grow, the interfaces—typically a combination of semicoher-ent and incoherent ones—must migrate. Incoherent interfaces typically moverapidly, whereas semicoherent interfaces do so with difficulty. Consequently, pre-cipitates in many systems take on a disc- or plate-like shape. Growth of nuclei,like nucleation itself, requires diffusion; hence, it is also controlled by an Arrhe-nius-type rate equation. Transformation kinetics is typically displayed in TTTdiagrams, named for showing the progression of the transformation with time andtemperature (Figure A) and provide valuable engineering insight into the expectedevolution of microstructures expected for various heat treatments.
Beginning
Eutectoidpoint
Ending50%
100
200
300
400
500
600
700(a)
(b)
(c) (d)
0.5 10Time (s)
Tim
e
Tem
pera
ture
(°C
)
102 103 104
100Typical isothermaltransformationcurve at 371°C
Beginning
Ending
50%50
0
0
50
100
Tra
nsfo
rmat
ion
prod
uct (
%)
Aus
teni
te (
%)
α + Fe3C
α + Fe3C
Carbon (wt %)
Tem
pera
ture
0.77
Fe3C
γ
MS
MF
Fe3C
Long-rangecarbondiffusion
α
αα
γ
α + γδ + Fe3C
γ
α
αγ
Figure A. Schematic Temperature-Time-Transformation (TTT)Diagram for Steel The high-temperature γ-phase of steel
(called austenite) is fcc. At lower temper-
atures, this phase transforms to a
bcc ferrite (α-phase) and Fe 3C (an
orthorhombic intermetallic compound).
(a) The results of isothermal-transforma-
tion experiments are shown on a
temperature vs time plot (TTT diagram),
in which C-shape curves mark the start
and finish of each isothermal experiment.
That shape results from a tradeoff
between the thermodynamic driving force
and diffusion. At high temperature, diffu-
sion is fast, but the driving force is too
low to trigger the transformation. At low
temperature, the driving force is high, but
diffusion is too slow for the transforma-
tion to proceed. (b) The lower diagram
shows how the transformation products
increase with time if the γ-phase is
quenched to miss the nose of the
C-curve and then is held isothermally at
371°C (dashed red line). If the γ-phase
is cooled quickly enough to avoid the
C-curve altogether, then it will begin to
transform martensitically (diffusionless
and displacive) at the Ms temperature.
Typically, the amount of transformation
product depends on temperature
only—not on the length of time the
γ-phase is held at that temperature.
The Mf temperature marks the point
below which no additional martensite
forms. (c) If the γ-phase has the eutectoid
composition (0.77 wt % carbon), carbon
must diffuse so as to create the α-phase
with very little carbon (given by the red
phase boundary of the α-region) and
Fe3C with 25 at. % carbon. (d) This
schematic illustrates that long-range
diffusion is required in austenite
(γ-phase) to allow the transformation to
α-phase plus Fe 3C to proceed.
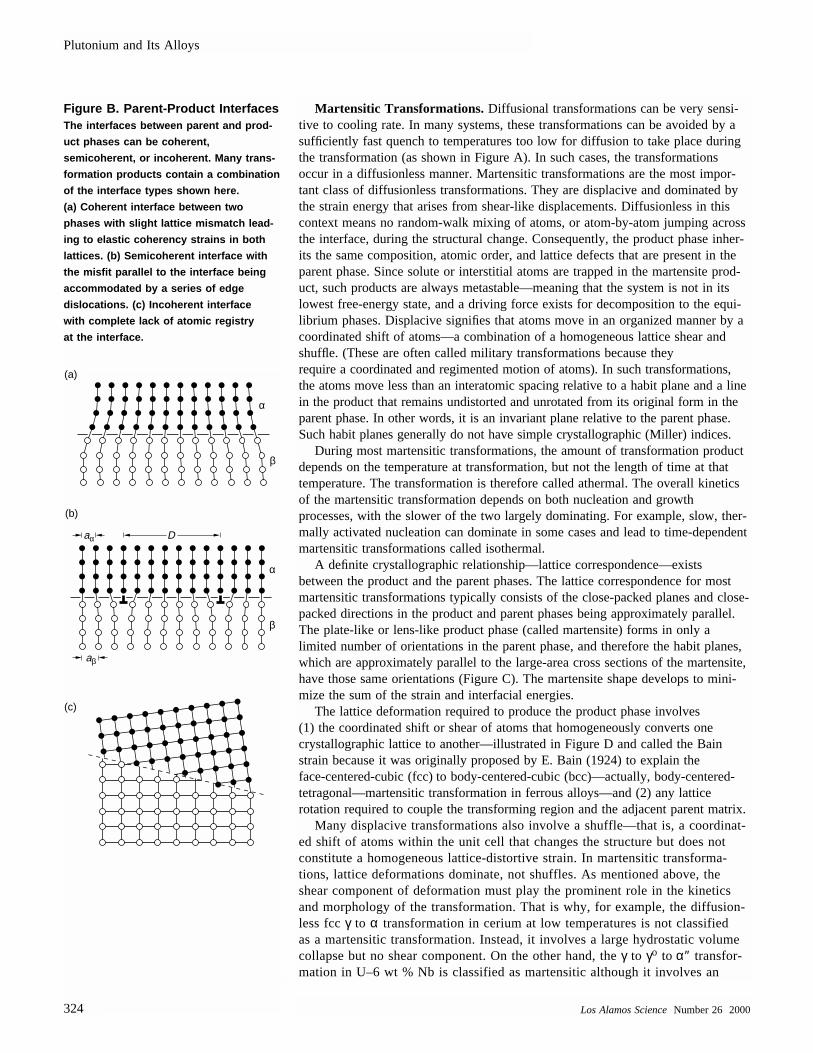
Daα
aβ
β
α
β
α
Plutonium and Its Alloys
324 Los Alamos ScienceNumber 26 2000
Martensitic Transformations. Diffusional transformations can be very sensi-tive to cooling rate. In many systems, these transformations can be avoided by asufficiently fast quench to temperatures too low for diffusion to take place duringthe transformation (as shown in Figure A). In such cases, the transformationsoccur in a diffusionless manner. Martensitic transformations are the most impor-tant class of diffusionless transformations. They are displacive and dominated bythe strain energy that arises from shear-like displacements. Diffusionless in thiscontext means no random-walk mixing of atoms, or atom-by-atom jumping acrossthe interface, during the structural change. Consequently, the product phase inher-its the same composition, atomic order, and lattice defects that are present in theparent phase. Since solute or interstitial atoms are trapped in the martensite prod-uct, such products are always metastable—meaning that the system is not in itslowest free-energy state, and a driving force exists for decomposition to the equi-librium phases. Displacive signifies that atoms move in an organized manner by acoordinated shift of atoms—a combination of a homogeneous lattice shear andshuffle. (These are often called military transformations because they require a coordinated and regimented motion of atoms). In such transformations,the atoms move less than an interatomic spacing relative to a habit plane and a linein the product that remains undistorted and unrotated from its original form in theparent phase. In other words, it is an invariant plane relative to the parent phase.Such habit planes generally do not have simple crystallographic (Miller) indices.
During most martensitic transformations, the amount of transformation productdepends on the temperature at transformation, but not the length of time at thattemperature. The transformation is therefore called athermal. The overall kineticsof the martensitic transformation depends on both nucleation and growth processes, with the slower of the two largely dominating. For example, slow, ther-mally activated nucleation can dominate in some cases and lead to time-dependentmartensitic transformations called isothermal.
A definite crystallographic relationship—lattice correspondence—exists between the product and the parent phases. The lattice correspondence for mostmartensitic transformations typically consists of the close-packed planes and close-packed directions in the product and parent phases being approximately parallel.The plate-like or lens-like product phase (called martensite) forms in only a limited number of orientations in the parent phase, and therefore the habit planes,which are approximately parallel to the large-area cross sections of the martensite,have those same orientations (Figure C). The martensite shape develops to mini-mize the sum of the strain and interfacial energies.
The lattice deformation required to produce the product phase involves (1) the coordinated shift or shear of atoms that homogeneously converts one crystallographic lattice to another—illustrated in Figure D and called the Bainstrain because it was originally proposed by E. Bain (1924) to explain the face-centered-cubic (fcc) to body-centered-cubic (bcc)—actually, body-centered-tetragonal—martensitic transformation in ferrous alloys—and (2) any latticerotation required to couple the transforming region and the adjacent parent matrix.
Many displacive transformations also involve a shuffle—that is, a coordinat-ed shift of atoms within the unit cell that changes the structure but does notconstitute a homogeneous lattice-distortive strain. In martensitic transforma-tions, lattice deformations dominate, not shuffles. As mentioned above, theshear component of deformation must play the prominent role in the kineticsand morphology of the transformation. That is why, for example, the diffusion-less fcc γ to α transformation in cerium at low temperatures is not classified as a martensitic transformation. Instead, it involves a large hydrostatic volumecollapse but no shear component. On the other hand, the γ to γo to α″ transfor-mation in U–6 wt % Nb is classified as martensitic although it involves an
Figure B. Parent-Product Interfaces The interfaces between parent and prod-
uct phases can be coherent,
semicoherent, or incoherent. Many trans-
formation products contain a combination
of the interface types shown here.
(a) Coherent interface between two
phases with slight lattice mismatch lead-
ing to elastic coherency strains in both
lattices. (b) Semicoherent interface with
the misfit parallel to the interface being
accommodated by a series of edge
dislocations. (c) Incoherent interface
with complete lack of atomic registry
at the interface.
(a)
(b)
(c)
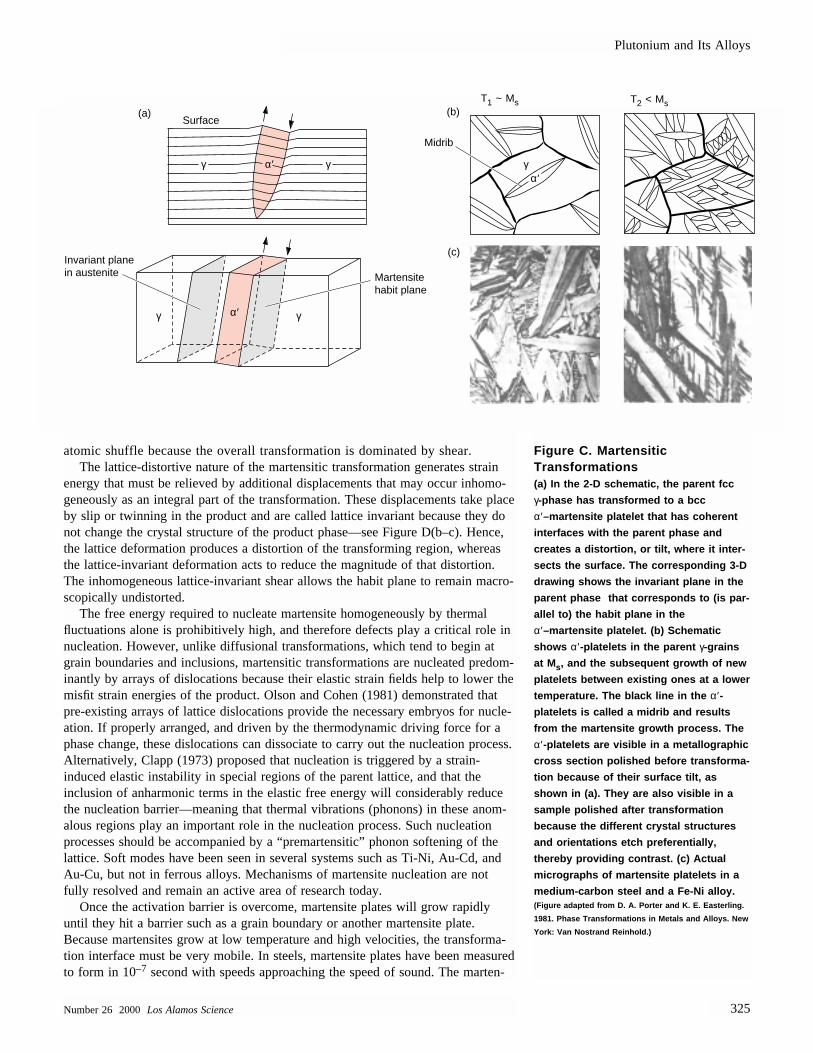
atomic shuffle because the overall transformation is dominated by shear. The lattice-distortive nature of the martensitic transformation generates strain
energy that must be relieved by additional displacements that may occur inhomo-geneously as an integral part of the transformation. These displacements take placeby slip or twinning in the product and are called lattice invariant because they donot change the crystal structure of the product phase—see Figure D(b–c). Hence,the lattice deformation produces a distortion of the transforming region, whereasthe lattice-invariant deformation acts to reduce the magnitude of that distortion.The inhomogeneous lattice-invariant shear allows the habit plane to remain macro-scopically undistorted.
The free energy required to nucleate martensite homogeneously by thermalfluctuations alone is prohibitively high, and therefore defects play a critical role innucleation. However, unlike diffusional transformations, which tend to begin atgrain boundaries and inclusions, martensitic transformations are nucleated predom-inantly by arrays of dislocations because their elastic strain fields help to lower themisfit strain energies of the product. Olson and Cohen (1981) demonstrated thatpre-existing arrays of lattice dislocations provide the necessary embryos for nucle-ation. If properly arranged, and driven by the thermodynamic driving force for aphase change, these dislocations can dissociate to carry out the nucleation process.Alternatively, Clapp (1973) proposed that nucleation is triggered by a strain-induced elastic instability in special regions of the parent lattice, and that the inclusion of anharmonic terms in the elastic free energy will considerably reducethe nucleation barrier—meaning that thermal vibrations (phonons) in these anom-alous regions play an important role in the nucleation process. Such nucleationprocesses should be accompanied by a “premartensitic” phonon softening of thelattice. Soft modes have been seen in several systems such as Ti-Ni, Au-Cd, andAu-Cu, but not in ferrous alloys. Mechanisms of martensite nucleation are notfully resolved and remain an active area of research today.
Once the activation barrier is overcome, martensite plates will grow rapidlyuntil they hit a barrier such as a grain boundary or another martensite plate. Because martensites grow at low temperature and high velocities, the transforma-tion interface must be very mobile. In steels, martensite plates have been measuredto form in 10–7 second with speeds approaching the speed of sound. The marten-
Plutonium and Its Alloys
Number 26 2000 Los Alamos Science 325
Surface
α′
α′
α′γγ
γγ
γ
Martensitehabit plane
Midrib
Invariant planein austenite
Figure C. Martensitic Transformations (a) In the 2-D schematic, the parent fcc
γ-phase has transformed to a bcc
α′–martensite platelet that has coherent
interfaces with the parent phase and
creates a distortion, or tilt, where it inter-
sects the surface. The corresponding 3-D
drawing shows the invariant plane in the
parent phase that corresponds to (is par-
allel to) the habit plane in the
α′–martensite platelet. (b) Schematic
shows α′ -platelets in the parent γ-grains
at Ms, and the subsequent growth of new
platelets between existing ones at a lower
temperature. The black line in the α′ -platelets is called a midrib and results
from the martensite growth process. The
α′ -platelets are visible in a metallographic
cross section polished before transforma-
tion because of their surface tilt, as
shown in (a). They are also visible in a
sample polished after transformation
because the different crystal structures
and orientations etch preferentially,
thereby providing contrast. (c) Actual
micrographs of martensite platelets in a
medium-carbon steel and a Fe-Ni alloy. (Figure adapted from D. A. Porter and K. E. Easterling.
1981. Phase Transformations in Metals and Alloys . New
York: Van Nostrand Reinhold.)
(a) (b)
(c)
T1 ~ Ms T2 < Ms
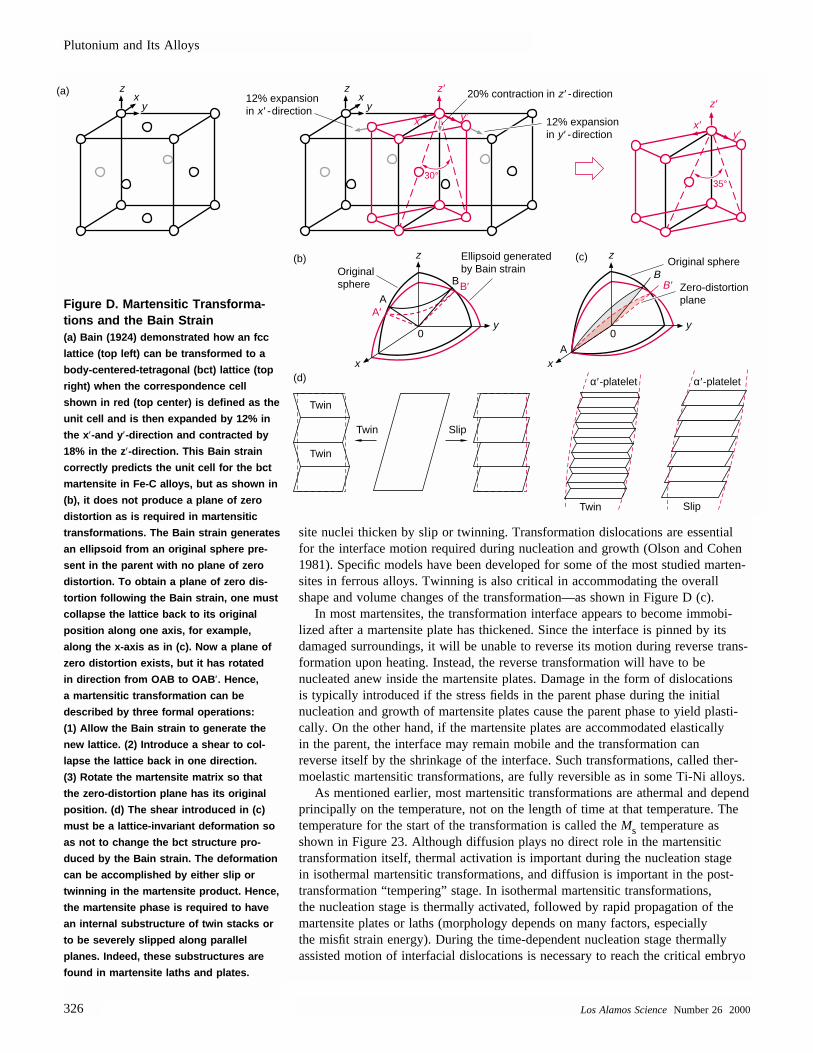
Plutonium and Its Alloys
326 Los Alamos ScienceNumber 26 2000
site nuclei thicken by slip or twinning. Transformation dislocations are essentialfor the interface motion required during nucleation and growth (Olson and Cohen1981). Specific models have been developed for some of the most studied marten-sites in ferrous alloys. Twinning is also critical in accommodating the overallshape and volume changes of the transformation—as shown in Figure D (c).
In most martensites, the transformation interface appears to become immobi-lized after a martensite plate has thickened. Since the interface is pinned by itsdamaged surroundings, it will be unable to reverse its motion during reverse trans-formation upon heating. Instead, the reverse transformation will have to benucleated anew inside the martensite plates. Damage in the form of dislocations is typically introduced if the stress fields in the parent phase during the initial nucleation and growth of martensite plates cause the parent phase to yield plasti-cally. On the other hand, if the martensite plates are accommodated elastically in the parent, the interface may remain mobile and the transformation can reverse itself by the shrinkage of the interface. Such transformations, called ther-moelastic martensitic transformations, are fully reversible as in some Ti-Ni alloys.
As mentioned earlier, most martensitic transformations are athermal and dependprincipally on the temperature, not on the length of time at that temperature. Thetemperature for the start of the transformation is called the Ms temperature asshown in Figure 23. Although diffusion plays no direct role in the martensitictransformation itself, thermal activation is important during the nucleation stage in isothermal martensitic transformations, and diffusion is important in the post-transformation “tempering” stage. In isothermal martensitic transformations, the nucleation stage is thermally activated, followed by rapid propagation of themartensite plates or laths (morphology depends on many factors, especially the misfit strain energy). During the time-dependent nucleation stage thermally assisted motion of interfacial dislocations is necessary to reach the critical embryo
(a)
(d)
(b) (c)
A
A
0 0
Originalsphere B
A′
B′ B ′B
Slip
α′ -platelet α′ -platelet
Twin
Twin
Twin Slip
Twin
z ′z ′
x ′ y ′y
y
z
z
x
x
y
z
x
20% contraction in z ′ -direction12% expansionin x ′ -direction
12% expansionin y ′ -direction
Ellipsoid generatedby Bain strain
Original sphere
Zero-distortionplane
30°35°
y ′x ′
y
zx
Figure D. Martensitic Transforma-tions and the Bain Strain (a) Bain (1924) demonstrated how an fcc
lattice (top left) can be transformed to a
body-centered-tetragonal (bct) lattice (top
right) when the correspondence cell
shown in red (top center) is defined as the
unit cell and is then expanded by 12% in
the x ′-and y ′-direction and contracted by
18% in the z ′-direction. This Bain strain
correctly predicts the unit cell for the bct
martensite in Fe-C alloys, but as shown in
(b), it does not produce a plane of zero
distortion as is required in martensitic
transformations. The Bain strain generates
an ellipsoid from an original sphere pre-
sent in the parent with no plane of zero
distortion. To obtain a plane of zero dis-
tortion following the Bain strain, one must
collapse the lattice back to its original
position along one axis, for example,
along the x-axis as in (c). Now a plane of
zero distortion exists, but it has rotated
in direction from OAB to OAB ′. Hence,
a martensitic transformation can be
described by three formal operations:
(1) Allow the Bain strain to generate the
new lattice. (2) Introduce a shear to col-
lapse the lattice back in one direction.
(3) Rotate the martensite matrix so that
the zero-distortion plane has its original
position. (d) The shear introduced in (c)
must be a lattice-invariant deformation so
as not to change the bct structure pro-
duced by the Bain strain. The deformation
can be accomplished by either slip or
twinning in the martensite product. Hence,
the martensite phase is required to have
an internal substructure of twin stacks or
to be severely slipped along parallel
planes. Indeed, these substructures are
found in martensite laths and plates.
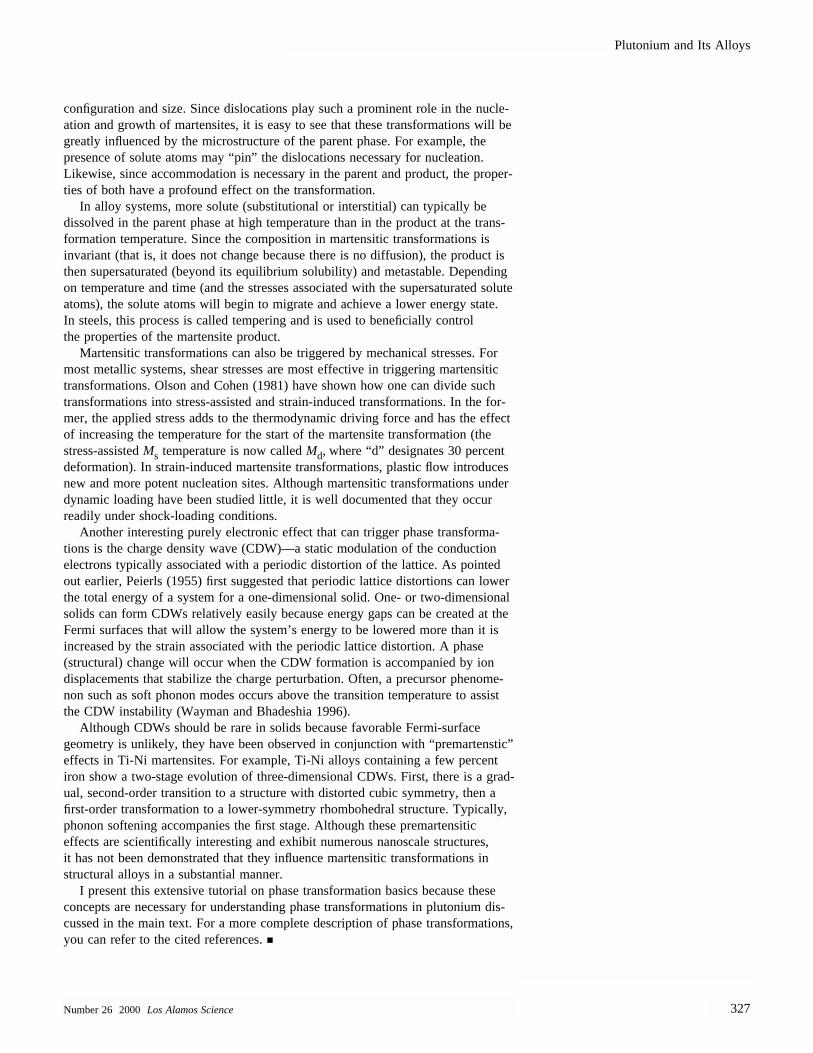
Plutonium and Its Alloys
Number 26 2000 Los Alamos Science 327
configuration and size. Since dislocations play such a prominent role in the nucle-ation and growth of martensites, it is easy to see that these transformations will begreatly influenced by the microstructure of the parent phase. For example, thepresence of solute atoms may “pin” the dislocations necessary for nucleation.Likewise, since accommodation is necessary in the parent and product, the proper-ties of both have a profound effect on the transformation.
In alloy systems, more solute (substitutional or interstitial) can typically be dissolved in the parent phase at high temperature than in the product at the trans-formation temperature. Since the composition in martensitic transformations isinvariant (that is, it does not change because there is no diffusion), the product isthen supersaturated (beyond its equilibrium solubility) and metastable. Dependingon temperature and time (and the stresses associated with the supersaturated soluteatoms), the solute atoms will begin to migrate and achieve a lower energy state. In steels, this process is called tempering and is used to beneficially control the properties of the martensite product.
Martensitic transformations can also be triggered by mechanical stresses. Formost metallic systems, shear stresses are most effective in triggering martensitictransformations. Olson and Cohen (1981) have shown how one can divide suchtransformations into stress-assisted and strain-induced transformations. In the for-mer, the applied stress adds to the thermodynamic driving force and has the effectof increasing the temperature for the start of the martensite transformation (thestress-assisted Ms temperature is now called Md, where “d” designates 30 percentdeformation). In strain-induced martensite transformations, plastic flow introducesnew and more potent nucleation sites. Although martensitic transformations underdynamic loading have been studied little, it is well documented that they occurreadily under shock-loading conditions.
Another interesting purely electronic effect that can trigger phase transforma-tions is the charge density wave (CDW)—a static modulation of the conductionelectrons typically associated with a periodic distortion of the lattice. As pointedout earlier, Peierls (1955) first suggested that periodic lattice distortions can lowerthe total energy of a system for a one-dimensional solid. One- or two-dimensionalsolids can form CDWs relatively easily because energy gaps can be created at theFermi surfaces that will allow the system’s energy to be lowered more than it isincreased by the strain associated with the periodic lattice distortion. A phase(structural) change will occur when the CDW formation is accompanied by iondisplacements that stabilize the charge perturbation. Often, a precursor phenome-non such as soft phonon modes occurs above the transition temperature to assistthe CDW instability (Wayman and Bhadeshia 1996).
Although CDWs should be rare in solids because favorable Fermi-surfacegeometry is unlikely, they have been observed in conjunction with “premartenstic”effects in Ti-Ni martensites. For example, Ti-Ni alloys containing a few percentiron show a two-stage evolution of three-dimensional CDWs. First, there is a grad-ual, second-order transition to a structure with distorted cubic symmetry, then afirst-order transformation to a lower-symmetry rhombohedral structure. Typically,phonon softening accompanies the first stage. Although these premartensitic effects are scientifically interesting and exhibit numerous nanoscale structures, it has not been demonstrated that they influence martensitic transformations instructural alloys in a substantial manner.
I present this extensive tutorial on phase transformation basics because theseconcepts are necessary for understanding phase transformations in plutonium dis-cussed in the main text. For a more complete description of phase transformations,you can refer to the cited references.
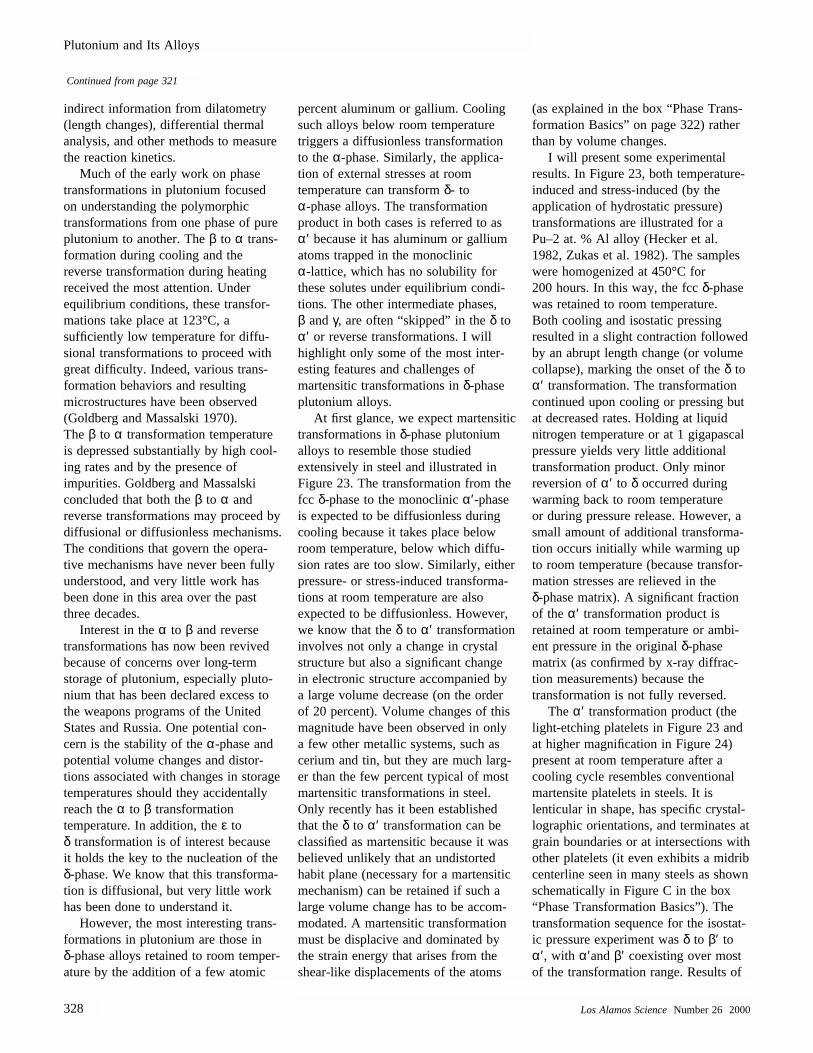
indirect information from dilatometry(length changes), differential thermalanalysis, and other methods to measurethe reaction kinetics.
Much of the early work on phasetransformations in plutonium focusedon understanding the polymorphictransformations from one phase of pureplutonium to another. The β to α trans-formation during cooling and thereverse transformation during heatingreceived the most attention. Underequilibrium conditions, these transfor-mations take place at 123°C, asufficiently low temperature for diffu-sional transformations to proceed withgreat difficulty. Indeed, various trans-formation behaviors and resultingmicrostructures have been observed(Goldberg and Massalski 1970). The β to α transformation temperatureis depressed substantially by high cool-ing rates and by the presence ofimpurities. Goldberg and Massalskiconcluded that both the β to α and reverse transformations may proceed bydiffusional or diffusionless mechanisms.The conditions that govern the opera-tive mechanisms have never been fullyunderstood, and very little work hasbeen done in this area over the pastthree decades.
Interest in the α to β and reversetransformations has now been revivedbecause of concerns over long-termstorage of plutonium, especially pluto-nium that has been declared excess tothe weapons programs of the UnitedStates and Russia. One potential con-cern is the stability of the α-phase andpotential volume changes and distor-tions associated with changes in storagetemperatures should they accidentallyreach the α to β transformation temperature. In addition, the ε to δ transformation is of interest becauseit holds the key to the nucleation of theδ-phase. We know that this transforma-tion is diffusional, but very little workhas been done to understand it.
However, the most interesting trans-formations in plutonium are those inδ-phase alloys retained to room temper-ature by the addition of a few atomic
percent aluminum or gallium. Coolingsuch alloys below room temperaturetriggers a diffusionless transformationto the α-phase. Similarly, the applica-tion of external stresses at roomtemperature can transform δ- to α-phase alloys. The transformationproduct in both cases is referred to asα′ because it has aluminum or galliumatoms trapped in the monoclinic α-lattice, which has no solubility forthese solutes under equilibrium condi-tions. The other intermediate phases, β and γ, are often “skipped” in the δ toα′ or reverse transformations. I willhighlight only some of the most inter-esting features and challenges ofmartensitic transformations in δ-phaseplutonium alloys.
At first glance, we expect martensitictransformations in δ-phase plutoniumalloys to resemble those studied extensively in steel and illustrated inFigure 23. The transformation from thefcc δ-phase to the monoclinic α′ -phaseis expected to be diffusionless duringcooling because it takes place belowroom temperature, below which diffu-sion rates are too slow. Similarly, eitherpressure- or stress-induced transforma-tions at room temperature are alsoexpected to be diffusionless. However,we know that the δ to α′ transformationinvolves not only a change in crystalstructure but also a significant changein electronic structure accompanied bya large volume decrease (on the orderof 20 percent). Volume changes of thismagnitude have been observed in onlya few other metallic systems, such ascerium and tin, but they are much larg-er than the few percent typical of mostmartensitic transformations in steel.Only recently has it been establishedthat the δ to α′ transformation can beclassified as martensitic because it wasbelieved unlikely that an undistortedhabit plane (necessary for a martensiticmechanism) can be retained if such alarge volume change has to be accom-modated. A martensitic transformationmust be displacive and dominated bythe strain energy that arises from theshear-like displacements of the atoms
(as explained in the box “Phase Trans-formation Basics” on page 322) ratherthan by volume changes.
I will present some experimental results. In Figure 23, both temperature-induced and stress-induced (by theapplication of hydrostatic pressure)transformations are illustrated for a Pu–2 at. % Al alloy (Hecker et al.1982, Zukas et al. 1982). The sampleswere homogenized at 450°C for 200 hours. In this way, the fcc δ-phasewas retained to room temperature. Both cooling and isostatic pressing resulted in a slight contraction followedby an abrupt length change (or volumecollapse), marking the onset of the δ toα′ transformation. The transformationcontinued upon cooling or pressing butat decreased rates. Holding at liquid nitrogen temperature or at 1 gigapascalpressure yields very little additionaltransformation product. Only minor reversion of α′ to δ occurred duringwarming back to room temperature or during pressure release. However, asmall amount of additional transforma-tion occurs initially while warming upto room temperature (because transfor-mation stresses are relieved in theδ-phase matrix). A significant fractionof the α′ transformation product is retained at room temperature or ambi-ent pressure in the original δ-phasematrix (as confirmed by x-ray diffrac-tion measurements) because thetransformation is not fully reversed.
The α′ transformation product (thelight-etching platelets in Figure 23 andat higher magnification in Figure 24)present at room temperature after acooling cycle resembles conventionalmartensite platelets in steels. It islenticular in shape, has specific crystal-lographic orientations, and terminates atgrain boundaries or at intersections withother platelets (it even exhibits a midribcenterline seen in many steels as shownschematically in Figure C in the box“Phase Transformation Basics”). Thetransformation sequence for the isostat-ic pressure experiment was δ to β′ toα′ , with α′and β′ coexisting over most of the transformation range. Results of
Plutonium and Its Alloys
328 Los Alamos ScienceNumber 26 2000
Continued from page 321
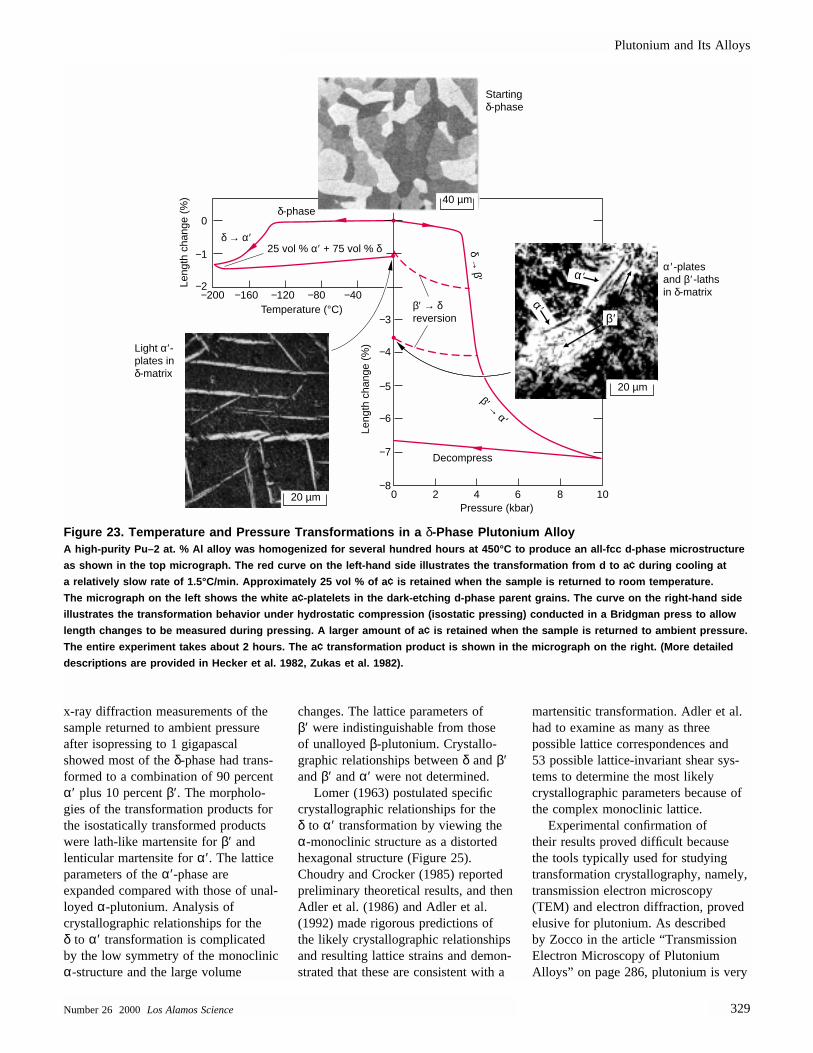
x-ray diffraction measurements of thesample returned to ambient pressureafter isopressing to 1 gigapascalshowed most of the δ-phase had trans-formed to a combination of 90 percentα′ plus 10 percent β′. The morpholo-gies of the transformation products forthe isostatically transformed productswere lath-like martensite for β′ andlenticular martensite for α′ . The latticeparameters of the α′ -phase are expanded compared with those of unal-loyed α-plutonium. Analysis ofcrystallographic relationships for the δ to α′ transformation is complicatedby the low symmetry of the monoclinicα-structure and the large volume
changes. The lattice parameters of β′ were indistinguishable from those of unalloyed β-plutonium. Crystallo-graphic relationships between δ and β′and β′ and α′ were not determined.
Lomer (1963) postulated specificcrystallographic relationships for the δ to α′ transformation by viewing theα-monoclinic structure as a distortedhexagonal structure (Figure 25).Choudry and Crocker (1985) reportedpreliminary theoretical results, and thenAdler et al. (1986) and Adler et al.(1992) made rigorous predictions of the likely crystallographic relationshipsand resulting lattice strains and demon-strated that these are consistent with a
martensitic transformation. Adler et al.had to examine as many as three possible lattice correspondences and 53 possible lattice-invariant shear sys-tems to determine the most likelycrystallographic parameters because ofthe complex monoclinic lattice.
Experimental confirmation of their results proved difficult because the tools typically used for studyingtransformation crystallography, namely,transmission electron microscopy(TEM) and electron diffraction, provedelusive for plutonium. As described by Zocco in the article “TransmissionElectron Microscopy of Plutonium Alloys” on page 286, plutonium is very
Plutonium and Its Alloys
Number 26 2000 Los Alamos Science 329
Temperature (°C)
Leng
th c
hang
e (%
)
Leng
th c
hang
e (%
)
Pressure (kbar)
δ → β′
β′ → α′
Startingδ-phase
Light α′ -plates inδ-matrix
δ-phase
25 vol % α′ + 75 vol % δ
α′ -platesand β′-lathsin δ-matrix
0
−1
−2
−3
−4
−5
−6
−7
−80 2 4 6 8 10
−200 −160 −120 −80 −40β′ → δreversion
Decompress
δ → α′
α ′α′
20 µm
40 µm
20 µm
β′
Figure 23. Temperature and Pressure Transformations in a δ-Phase Plutonium AlloyA high-purity Pu–2 at. % Al alloy was homogenized for several hundred hours at 450°C to produce an all-fcc d-phase microstructu re
as shown in the top micrograph. The red curve on the left-hand side illustrates the transformation from d to a¢ during cooling at
a relatively slow rate of 1.5°C/min. Approximately 25 vol % of a¢ is retained when the sample is returned to room temperature.
The micrograph on the left shows the white a¢-platelets in the dark-etching d-phase parent grains. The curve on the right-hand side
illustrates the transformation behavior under hydrostatic compression (isostatic pressing) conducted in a Bridgman press to all ow
length changes to be measured during pressing. A larger amount of a¢ is retained when the sample is returned to ambient pressur e.
The entire experiment takes about 2 hours. The a¢ transformation product is shown in the micrograph on the right. (More detaile d
descriptions are provided in Hecker et al. 1982, Zukas et al. 1982).
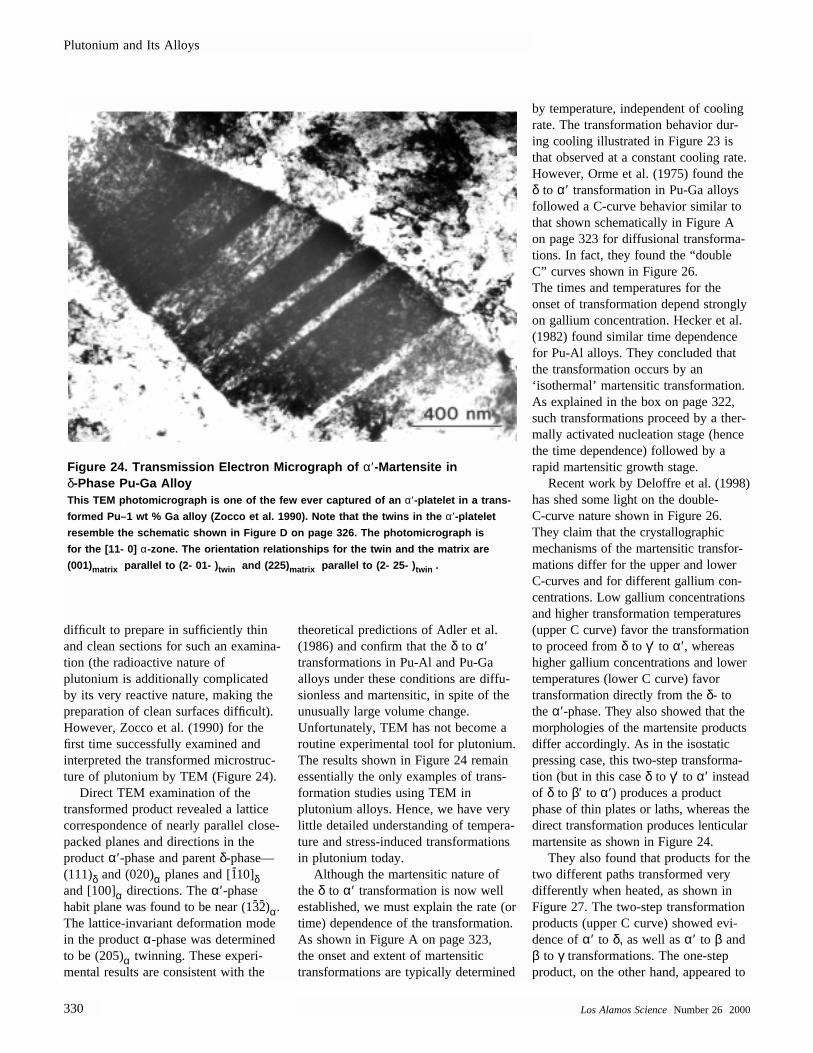
difficult to prepare in sufficiently thinand clean sections for such an examina-tion (the radioactive nature ofplutonium is additionally complicatedby its very reactive nature, making thepreparation of clean surfaces difficult).However, Zocco et al. (1990) for thefirst time successfully examined and interpreted the transformed microstruc-ture of plutonium by TEM (Figure 24).
Direct TEM examination of thetransformed product revealed a latticecorrespondence of nearly parallel close-packed planes and directions in theproduct α′ -phase and parent δ-phase—(111)δ and (020)α planes and [1-10]δand [100]α directions. The α′ -phasehabit plane was found to be near (13-2-)α.The lattice-invariant deformation modein the product α-phase was determinedto be (205)α twinning. These experi-mental results are consistent with the
theoretical predictions of Adler et al.(1986) and confirm that the δ to α′transformations in Pu-Al and Pu-Ga alloys under these conditions are diffu-sionless and martensitic, in spite of theunusually large volume change. Unfortunately, TEM has not become aroutine experimental tool for plutonium.The results shown in Figure 24 remainessentially the only examples of trans-formation studies using TEM inplutonium alloys. Hence, we have verylittle detailed understanding of tempera-ture and stress-induced transformationsin plutonium today.
Although the martensitic nature ofthe δ to α′ transformation is now wellestablished, we must explain the rate (ortime) dependence of the transformation.As shown in Figure A on page 323, the onset and extent of martensitictransformations are typically determined
by temperature, independent of coolingrate. The transformation behavior dur-ing cooling illustrated in Figure 23 isthat observed at a constant cooling rate.However, Orme et al. (1975) found theδ to α′ transformation in Pu-Ga alloysfollowed a C-curve behavior similar tothat shown schematically in Figure Aon page 323 for diffusional transforma-tions. In fact, they found the “doubleC” curves shown in Figure 26. The times and temperatures for theonset of transformation depend stronglyon gallium concentration. Hecker et al.(1982) found similar time dependencefor Pu-Al alloys. They concluded thatthe transformation occurs by an‘isothermal’ martensitic transformation.As explained in the box on page 322,such transformations proceed by a ther-mally activated nucleation stage (hencethe time dependence) followed by arapid martensitic growth stage.
Recent work by Deloffre et al. (1998)has shed some light on the double-C-curve nature shown in Figure 26.They claim that the crystallographicmechanisms of the martensitic transfor-mations differ for the upper and lowerC-curves and for different gallium con-centrations. Low gallium concentrationsand higher transformation temperatures(upper C curve) favor the transformationto proceed from δ to γ′ to α′ , whereashigher gallium concentrations and lowertemperatures (lower C curve) favortransformation directly from the δ- tothe α′ -phase. They also showed that themorphologies of the martensite productsdiffer accordingly. As in the isostaticpressing case, this two-step transforma-tion (but in this case δ to γ′ to α′ insteadof δ to β′ to α′ ) produces a productphase of thin plates or laths, whereas thedirect transformation produces lenticularmartensite as shown in Figure 24.
They also found that products for thetwo different paths transformed verydifferently when heated, as shown inFigure 27. The two-step transformationproducts (upper C curve) showed evi-dence of α′ to δ, as well as α′ to β andβ to γ transformations. The one-stepproduct, on the other hand, appeared to
Plutonium and Its Alloys
330 Los Alamos ScienceNumber 26 2000
Figure 24. Transmission Electron Micrograph of α′ -Martensite in δ-Phase Pu-Ga AlloyThis TEM photomicrograph is one of the few ever captured of an α′ -platelet in a trans-
formed Pu–1 wt % Ga alloy (Zocco et al. 1990). Note that the twins in the α′ -platelet
resemble the schematic shown in Figure D on page 326. The photomicrograph is
for the [11- 0] α-zone. The orientation relationships for the twin and the matrix are
(001)matrix parallel to (2- 01- ) twin and (225)matrix parallel to (2- 25- ) twin .
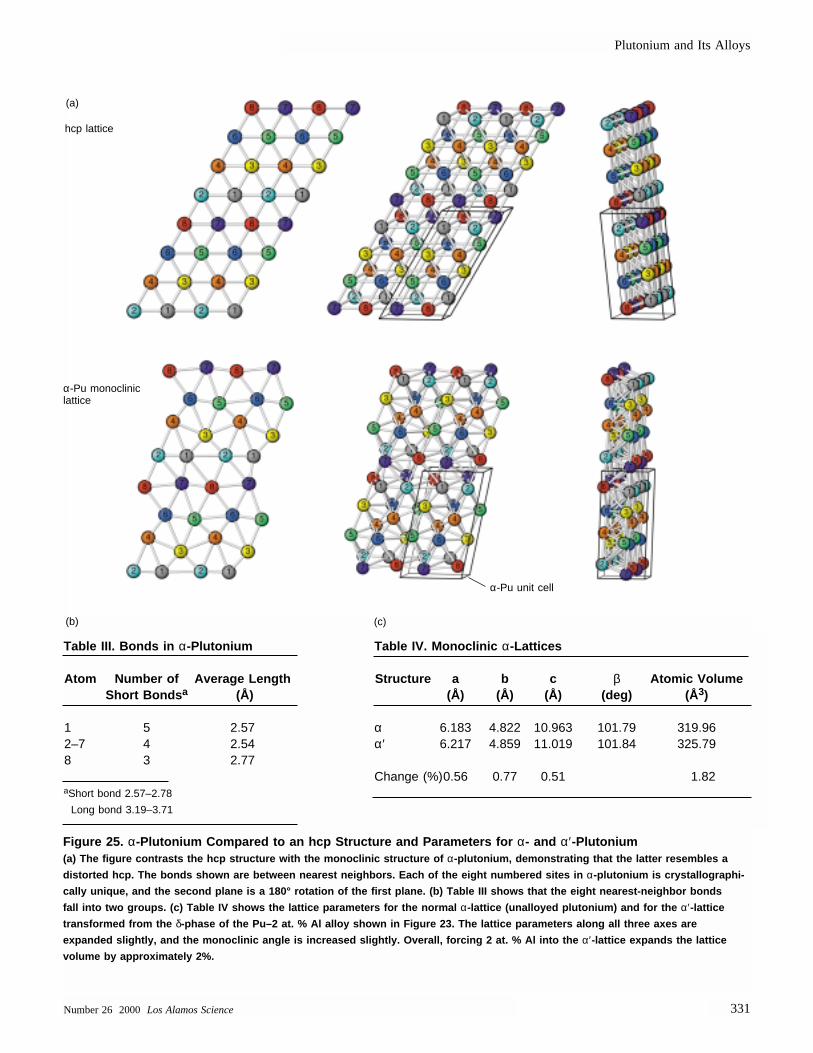
Plutonium and Its Alloys
Number 26 2000 Los Alamos Science 331
Figure 25. α-Plutonium Compared to an hcp Structure and Parameters for α- and α′ -Plutonium(a) The figure contrasts the hcp structure with the monoclinic structure of α-plutonium, demonstrating that the latter resembles a
distorted hcp. The bonds shown are between nearest neighbors. Each of the eight numbered sites in α-plutonium is crystallographi-
cally unique, and the second plane is a 180° rotation of the first plane. (b) Table III shows that the eight nearest-neighbor bon ds
fall into two groups. (c) Table IV shows the lattice parameters for the normal α-lattice (unalloyed plutonium) and for the α′ -lattice
transformed from the δ-phase of the Pu–2 at. % Al alloy shown in Figure 23. The lattice parameters along all three axes are
expanded slightly, and the monoclinic angle is increased slightly. Overall, forcing 2 at. % Al into the α′ -lattice expands the lattice
volume by approximately 2%.
Table III. Bonds in α-Plutonium
Atom Number of Average LengthShort Bonds a (Å)
1 5 2.572–7 4 2.548 3 2.77
aShort bond 2.57–2.78
Long bond 3.19–3.71
Table IV. Monoclinic α-Lattices
Structure a b c β Atomic Volume(Å) (Å) (Å) (deg) (Å 3)
α 6.183 4.822 10.963 101.79 319.96α′ 6.217 4.859 11.019 101.84 325.79
Change (%)0.56 0.77 0.51 1.82
(a)
(b) (c)
hcp lattice
α-Pu monoclinic lattice
α-Pu unit cell
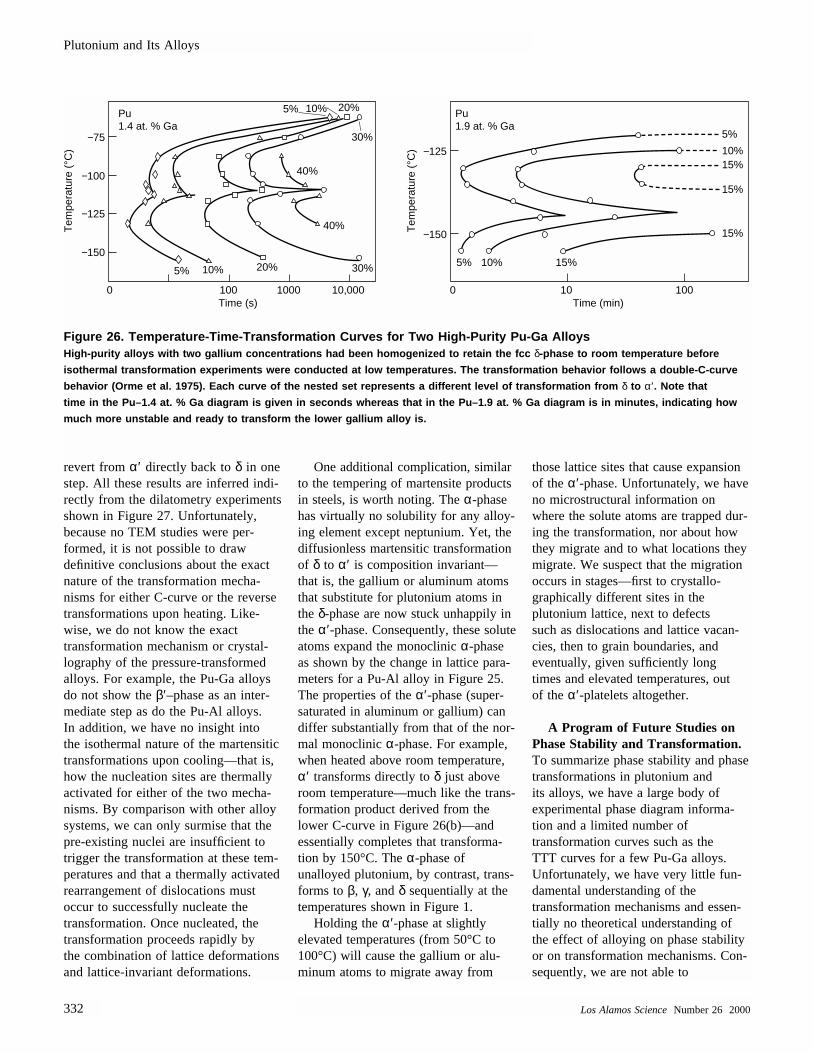
revert from α′ directly back to δ in onestep. All these results are inferred indi-rectly from the dilatometry experimentsshown in Figure 27. Unfortunately, because no TEM studies were per-formed, it is not possible to drawdefinitive conclusions about the exactnature of the transformation mecha-nisms for either C-curve or the reversetransformations upon heating. Like-wise, we do not know the exacttransformation mechanism or crystal-lography of the pressure-transformedalloys. For example, the Pu-Ga alloysdo not show the β′–phase as an inter-mediate step as do the Pu-Al alloys. In addition, we have no insight into the isothermal nature of the martensitictransformations upon cooling—that is,how the nucleation sites are thermallyactivated for either of the two mecha-nisms. By comparison with other alloysystems, we can only surmise that thepre-existing nuclei are insufficient totrigger the transformation at these tem-peratures and that a thermally activatedrearrangement of dislocations mustoccur to successfully nucleate thetransformation. Once nucleated, thetransformation proceeds rapidly by the combination of lattice deformationsand lattice-invariant deformations.
One additional complication, similarto the tempering of martensite productsin steels, is worth noting. The α-phasehas virtually no solubility for any alloy-ing element except neptunium. Yet, thediffusionless martensitic transformationof δ to α′ is composition invariant—that is, the gallium or aluminum atomsthat substitute for plutonium atoms inthe δ-phase are now stuck unhappily inthe α′ -phase. Consequently, these soluteatoms expand the monoclinic α-phaseas shown by the change in lattice para-meters for a Pu-Al alloy in Figure 25.The properties of the α′ -phase (super-saturated in aluminum or gallium) candiffer substantially from that of the nor-mal monoclinic α-phase. For example,when heated above room temperature,α′ transforms directly to δ just aboveroom temperature—much like the trans-formation product derived from thelower C-curve in Figure 26(b)—and essentially completes that transforma-tion by 150°C. The α-phase ofunalloyed plutonium, by contrast, trans-forms to β, γ, and δ sequentially at thetemperatures shown in Figure 1.
Holding the α′ -phase at slightly elevated temperatures (from 50°C to100°C) will cause the gallium or alu-minum atoms to migrate away from
those lattice sites that cause expansionof the α′ -phase. Unfortunately, we haveno microstructural information onwhere the solute atoms are trapped dur-ing the transformation, nor about howthey migrate and to what locations theymigrate. We suspect that the migrationoccurs in stages—first to crystallo-graphically different sites in theplutonium lattice, next to defects such as dislocations and lattice vacan-cies, then to grain boundaries, andeventually, given sufficiently long times and elevated temperatures, out of the α′ -platelets altogether.
A Program of Future Studies onPhase Stability and Transformation.To summarize phase stability and phasetransformations in plutonium and its alloys, we have a large body of experimental phase diagram informa-tion and a limited number oftransformation curves such as the TTT curves for a few Pu-Ga alloys.Unfortunately, we have very little fun-damental understanding of thetransformation mechanisms and essen-tially no theoretical understanding ofthe effect of alloying on phase stabilityor on transformation mechanisms. Con-sequently, we are not able to
Plutonium and Its Alloys
332 Los Alamos ScienceNumber 26 2000
Figure 26. Temperature-Time-Transformation Curves for Two High-Purity Pu-Ga Alloys High-purity alloys with two gallium concentrations had been homogenized to retain the fcc δ-phase to room temperature before
isothermal transformation experiments were conducted at low temperatures. The transformation behavior follows a double-C-curve
behavior (Orme et al. 1975). Each curve of the nested set represents a different level of transformation from δ to α′ . Note that
time in the Pu–1.4 at. % Ga diagram is given in seconds whereas that in the Pu–1.9 at. % Ga diagram is in minutes, indicating h ow
much more unstable and ready to transform the lower gallium alloy is.
5%
5%
10%15%
15%
15%
15%5% 10%
−75
−100
−125
−150
−150
−125
0 100Time (s)
Pu1.4 at. % Ga
Pu1.9 at. % Ga
Time (min)1000 10,000 100 100
10% 20%
30%
40%
40%
30%20%10%5%
Tem
pera
ture
(°C
)
Tem
pera
ture
(°C
)
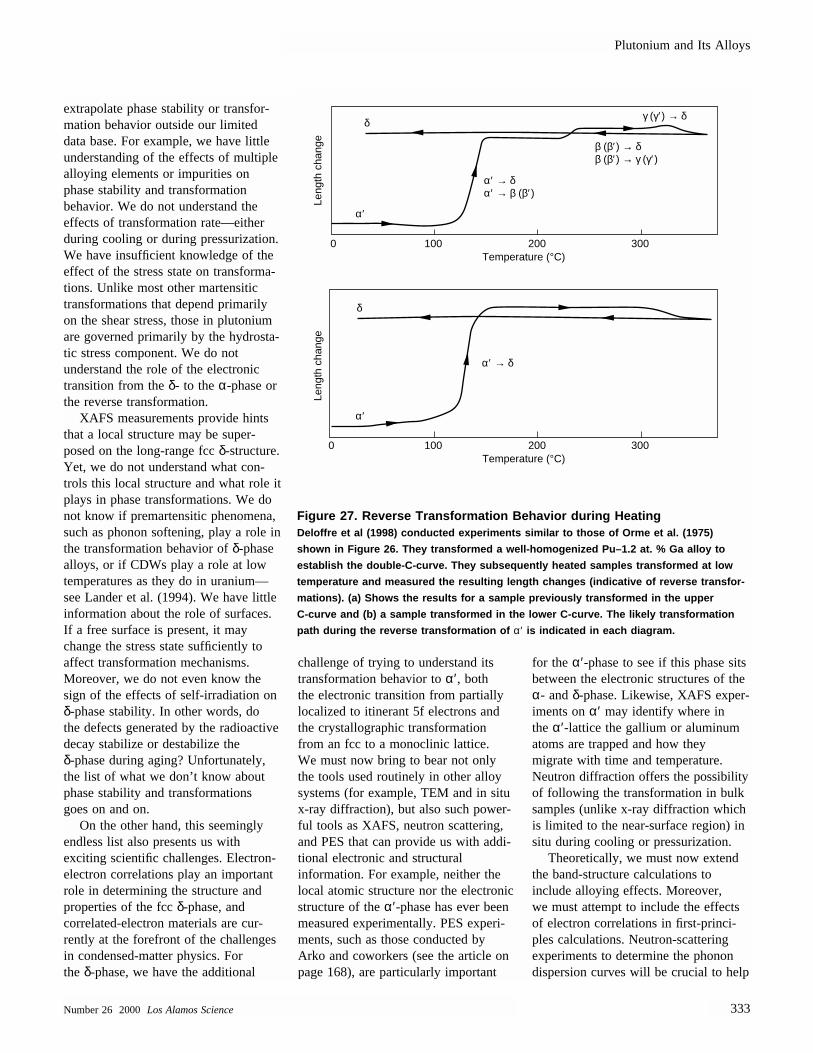
extrapolate phase stability or transfor-mation behavior outside our limiteddata base. For example, we have littleunderstanding of the effects of multiplealloying elements or impurities onphase stability and transformation behavior. We do not understand the effects of transformation rate—eitherduring cooling or during pressurization.We have insufficient knowledge of theeffect of the stress state on transforma-tions. Unlike most other martensitictransformations that depend primarilyon the shear stress, those in plutoniumare governed primarily by the hydrosta-tic stress component. We do notunderstand the role of the electronictransition from the δ- to the α-phase orthe reverse transformation.
XAFS measurements provide hintsthat a local structure may be super-posed on the long-range fcc δ-structure.Yet, we do not understand what con-trols this local structure and what role itplays in phase transformations. We donot know if premartensitic phenomena,such as phonon softening, play a role inthe transformation behavior of δ-phasealloys, or if CDWs play a role at lowtemperatures as they do in uranium—see Lander et al. (1994). We have littleinformation about the role of surfaces.If a free surface is present, it maychange the stress state sufficiently to affect transformation mechanisms.Moreover, we do not even know thesign of the effects of self-irradiation onδ-phase stability. In other words, do the defects generated by the radioactivedecay stabilize or destabilize the δ-phase during aging? Unfortunately,the list of what we don’t know aboutphase stability and transformations goes on and on.
On the other hand, this seeminglyendless list also presents us with exciting scientific challenges. Electron-electron correlations play an importantrole in determining the structure andproperties of the fcc δ-phase, and correlated-electron materials are cur-rently at the forefront of the challengesin condensed-matter physics. For the δ-phase, we have the additional
challenge of trying to understand itstransformation behavior to α′ , both the electronic transition from partiallylocalized to itinerant 5f electrons andthe crystallographic transformationfrom an fcc to a monoclinic lattice. We must now bring to bear not onlythe tools used routinely in other alloysystems (for example, TEM and in situx-ray diffraction), but also such power-ful tools as XAFS, neutron scattering,and PES that can provide us with addi-tional electronic and structuralinformation. For example, neither thelocal atomic structure nor the electronicstructure of the α′ -phase has ever beenmeasured experimentally. PES experi-ments, such as those conducted byArko and coworkers (see the article onpage 168), are particularly important
for the α′ -phase to see if this phase sitsbetween the electronic structures of theα- and δ-phase. Likewise, XAFS exper-iments on α′ may identify where in the α′ -lattice the gallium or aluminumatoms are trapped and how they migrate with time and temperature.Neutron diffraction offers the possibilityof following the transformation in bulksamples (unlike x-ray diffraction whichis limited to the near-surface region) insitu during cooling or pressurization.
Theoretically, we must now extendthe band-structure calculations to include alloying effects. Moreover, we must attempt to include the effectsof electron correlations in first-princi-ples calculations. Neutron-scatteringexperiments to determine the phonondispersion curves will be crucial to help
Plutonium and Its Alloys
Number 26 2000 Los Alamos Science 333
Figure 27. Reverse Transformation Behavior during HeatingDeloffre et al (1998) conducted experiments similar to those of Orme et al. (1975)
shown in Figure 26. They transformed a well-homogenized Pu–1.2 at. % Ga alloy to
establish the double-C-curve. They subsequently heated samples transformed at low
temperature and measured the resulting length changes (indicative of reverse transfor-
mations). (a) Shows the results for a sample previously transformed in the upper
C-curve and (b) a sample transformed in the lower C-curve. The likely transformation
path during the reverse transformation of α′ is indicated in each diagram.
1000 200
α′ → δα′ → β (β′)
α′
δ
δ
α′
α′ → δ
β (β′) → δβ (β′) → γ (γ′)
300
1000 200
Temperature (°C)
Leng
th c
hang
eLe
ngth
cha
nge
Temperature (°C)300
γ (γ′) → δ
guide theoretical prediction of tempera-ture effects. Likewise, carefulultrasonic measurements of elasticmoduli will be important to understandtemperature effects and phonons. To understand the role of defects andmicrostructure, we must develop an accurate interatomic potential thatwould allow modeling such effects.
Experimentally, we need high-purity,high-quality single crystals and poly-crystals of α- and δ-phase plutoniumalloys to study fundamental properties.As we have pointed out, knowing theprecise nature of the metallurgical pro-cessing is paramount to ensuring thatwe understand the starting material.Moreover, surface preparation is crucialbecause most processing steps alter thesurface crystal structure. In addition, weabsolutely need plutonium-242 to con-duct neutron scattering experiments.
Summary of Challenges in Plutonium Metallurgy
The properties of plutonium dependon its crystal structure, which dependscritically on temperature, pressure,chemistry, and microstructure. Finally,the microstructure depends on all of theprevious variables plus the details ofthermal and mechanical processing. Wedemonstrated that plutonium is trulyunique because of its position in the periodic table and that its unusual prop-erties are derived from the nature of the5f electrons. Specifically, it is the nar-row band and the high density-of-statesof the 5f electrons at the Fermi energythat make plutonium unique. Althoughthese features favor an unusual low-symmetry monoclinic structure at roomtemperature, it takes only a slightchange in temperature or the additionof a few atomic percent of elementssuch as aluminum or gallium to approach a structure that is closer to that of americium, with a much larger atomic volume than the mono-clinic α-phase and a high-symmetrycrystal structure. The uniqueness ofplutonium can only be appreciated and
understood by studying its neighbors in the actinide series, and I am convinced that it will be understoodonly through the close collaboration between the condensed-matter physicsand metallurgical communities.
All the peculiarities of plutoniumhave a profound effect on its physicaland mechanical properties. Many physi-cal properties such as electricalresistivity and magnetic susceptibilityare expected to reflect directly the peculiarities of the 5f electrons in plutonium (see the article by Boringand Smith on page 90). The low-temperature behavior of plutonium ishighly anomalous—for example, the electrical resistivity for α-plutonium(which is already very high at roomtemperature) climbs as the temperatureis lowered to approximately 100 kelvinsbefore it falls as it is cooled toward absolute zero. Some of the other trans-port properties such as diffusion dependprimarily on the bonding properties ofthe electrons, hence they scale with thehomologous melting point as mentionedearlier. The mechanical properties ofplutonium depend to first order on thecrystal and defect structure—varyingdramatically from those of the soft,ductile δ-phase to that of the strong,brittle α-phase. Other peculiarities ofthe mechanical behavior of plutoniumand its alloys are discussed by Heckerand Stevens (page 336).
Finally, the complexities of plutoniumare further exacerbated by the continuouslattice damage inflicted during its self-irradiation as discussed by Wolfer (page 274) and Hecker and Martz (page238). From a practical point of view, we know that plutonium does not destroy itself over a period of a fewdecades. All indications are that signifi-cant self-annealing heals much of thedamage of self-irradiation. Yet, by com-parison with other metals and alloys thatsuffer similar irradiation from externalsources, the conditions in plutonium areripe for substantial property changes tohappen as plutonium ages.
Further Reading
Adler, P. H., G. B. Olson, and D. S. Margolies. 1986. Acta Metall. 34: 2053.
Adler, P. H., G. B.Olson, M. F. Stevens, and G. F. Gallegos. 1992. Acta Metall. Mater. 40: 1073.
Ardell, A. J. 1963. Acta Metall.11: 591.
Bain, E. C. 1924. Trans. AIME.70: 25.
Brewer, L. 1983. Systematics and the Properties of the Lanthanides.Edited by S.P. Sinha, 17.Dordrecht: D. Reidel Publishing Company.
Choudry, M.A. and A. G. Crocker, 1985. J. Nucl. Mater.127: 119.
Clapp, P. C. 1973. Phys. Stat. Sol. 57: 561.
Deloffre, P., J. L. Truffier, and A. Falanga. 1998. J. Alloys Compounds 271-273: 370.
Ellinger, F. H., W. N. Miner, D. R O’Boyle, and F. W. Schonfeld. 1968. “Constitution of Plutonium Alloys” (Dec.). Los Alamos National Laboratory report LA-3870-MS.
Eriksson, E., J. D. Becker, A. V. Balatsky, and J. M. Wills. 1999. J. Alloys and Compounds287: 1.
Goldberg, A., and T. B. Massalski. 1970. In Proc. of 4th Int. Conf. on Plutonium and Other Actinides 1970. Edited by W. N. Miner,875. New York: The Metallurgical Society of AIME.
Haasen, P. 1992. Physical Metallurgy. Cambridge: Cambridge University Press. Cambridge.
Hammel, E. F. 1998. Plutonium Metallurgy at Los Alamos, 1943-1945. Los Alamos, NM: Los Alamos Historical Society.
Hecker, S. S. 2000 (to be published). Plutonium Aging: From Mystery to Enigma. In Proceedings of the International Conference on Aging Studies and Lifetime Extension of Materials. Edited by L. G. Mallinson, 191. Dordrecht: Kluwer Academic Publisher.
Hecker, S. S., J. R. Morgan, and R. A Pereyra. 1982. In Proc. Int. Conf. Solid-Solid Phase Tranf. Edited by H. I. Aaronson, 1339. New York: Am. Inst. Min. Engrs.
Heine, V. 1969. The Physics of Metals: 1. Electrons. Edited by J. M. Ziman, 1.Cambridge: Cambridge University Press.
Hill, H. H., and E. A. Kmetko. 1976. J. Phys. F 6: 1025.
Johansson, B. 1974. Phil. Mag. 30: 469.
Plutonium and Its Alloys
334 Los Alamos ScienceNumber 26 2000
Kaufman, L., and H. Bernstein. 1970. Computer Calculation of Phase Diagrams. New York: Academic Press.
Lander, G. H., E. S. Fisher, and S. D. Bader. 1994. Adv. Phys. 43: 1.
Lawson, A. C., J. A. Goldstone, B. Cort, R. J. Martinez, F. A. Vigil, T. G. Zocco, J. W. Richardson, and M. H. Mueller. 1996. Acta Crystall.B52: 32.
Lawson, A. C., B. Martinez, J. A. Roberts, and B. I. Bennett. 2000. Phil Mag. 80: 53.
Liptai, R. G., and R. J. Friddle. 1967. J. Nucl. Mater. 21: 114.
Lomer, W. M. 1963. Solid State Commun.1: 63.
Massalski, T. B. 1996. Physical Metallurgy.Edited by R. W. Cahn and P. Haasen, 136.
Mitchell, J. N., F. E. Gibbs, T. G. Zocco, and R. A. Pereyra. 2000 (to be published). Met. Trans.
Morgan, J. R. 1970. In Proc. of 4th Int. Conf. on Plutonium and other Actinides 1970. Edited by W. N. Miner, 669. New York: The Metallurgical Society of AIME.
Nelson, R. D., T. K. Bierlein, and F. E. Bowman.1965. Battelle, Pacific Northwest National Laboratory report BNWL-32.
Olson, G. B. and M. Cohen. 1981. Ann. Rev. Mater. Sci. 11: 1.
Orme, J. T., M. E. Faiers, and B. J. Ward. 1976. In Proc. of 5th Int. Conf. on Plutonium and Other Actinides. Edited by H. Blank and R. Lindner, 761. New York: North Holland Publishing Co.
Peierls, R. E. 1955. Quantum Theory of Solids. Oxford: Oxford University Press.
Peterson, D. E., and M. E. Kassner. 1988. Bull. Alloy Phase Diagr. 9: 261.
Porter, D. A., and K. E. Easterling. 1981. Phase Transformations in Metals and Alloys.New York: Van Nostrand Reinhold Company.
Sherby, O. D., and M. T. Simnad. 1961. Trans. ASM 54: 227.
Smith, J. L., and E. A. Kmetko. 1983. J. Less Common Met. 90: 83.
Söderlind, P., O. Eriksson, B. Johansson, J. M. Wills, A. M. Boring. 1995. Nature April 6 issue: 6522.
Söderlind, P., J. M. Wills, B. Johansson, O. Eriksson. 1997. Phys. Rev. B.: 55: 1997.
Wallace, D. C. 1998. Phys. Rev. B 58: 15433.
Wayman, C. M. and H. K. Bhadeshia. 1996. In Physical Metallurgy. Edited by R. W. Cahn and P. Haasen, 1507. North-Holland: Elsevier.
Wittenberg, L. J., G. A. Vaughn, and R. DeWitt. 1970. In Proc. of 4th Int. Conf. on Plutonium and other Actinides 1970. Edited by W. N. Miner, 659. New York: The Metallurgical Society of AIME.
Zocco, T. G., M. F. Stevens, P. H. Adler, R. I. Sheldon, and G. B. Olson. 1990. Acta Metall. Mater. 38: 2275.
Zukas, E. G., S. S. Hecker, J. R. Morgan, and R. A. Pereyra. 1982. In Proc. Int. Conf. Solid-Solid Phase Tranf. Edited by H. I. Aaronson, 1333. New York: Am. Inst. Min. Engrs.
Acknowledgments
I acknowledge all those who helpedwith this article: for technical discus-sions on electronic structure, MikeBoring, Nikki Cooper, Jim Smith, and John Wills; on metallurgy, FrankGibbs, Del Harbur, Mike Stevens, and Tom Zocco; on crystallography,Steve Conradson, Angus Lawson, and Luis Morales; on thermodynamics,Marius Stan and Duane Wallace. I thank Jeremy Mitchell and RamiroPereyra for allowing me to use theirplutonium segregation data and micro-graphs. The critical reading of themanuscript by Mike Baskes, Bob Field,and Dan Thoma is appreciated. I alsothank my scientific collaborators in plutonium metallurgy over the years:Dave Eash, Reed Elliott, Del Harbur,Jim Morgan, and Gene Zukas. The motivation for writing a metallurgi-cal article directed at a broaderaudience came from many discussionswith Mike Boring, Nikki Cooper, and Jim Smith. I also thank the entireLos Alamos Sciencestaff for their won-derful and very professional support.
Plutonium and Its Alloys
Number 26 2000 Los Alamos Science 335
Siegfried S. Heckerreceived his B.S., M.S., and Ph.D. in metallurgy from Case Western Reserve University. After two years as a post-doctoral appointee at Los Alamos, he became asenior research met-allurgist with theGeneral Motors Research Laborato-ries. He joined theLaboratory as atechnical staffmember in thePhysical MetallurgyGroup, and servedas Chairman of theCenter for MaterialsScience and Leaderof the MaterialsScience and Technology Division before becom-ing Director. Sig was Director of Los AlamosNational Laboratory from 1986 to 1997. He iscurrently a Senior Fellow at Los Alamos. Sig is amember of the National Academy of Engineer-ing, Fellow of the TMS (Minerals, Metallurgyand Materials Society), Fellow of the AmericanSociety for Metals, and Honorary Member of theAmerican Ceramics Society. In recognition of hisachievements, Sig was named Laboratory Direc-tor of the Year by the Federal LaboratoryConsortium, (1998). In 1998, he also receivedthe honorary Doctor of Science degree (HonorisCausa) from Case Western University. Sig received the Department of Energy’s Distin-guished Associate Award, (1997), the Universityof California’s President’s Medal, (1997), the ASM Distinguished Life Membership Award,(1997), an Honorary Degree of Scientiae Doctoris, Ripon College (1997), the NavyLeague New York Council Roosevelt GoldMedal for Science (1996), the Aviation WeekGroup Laurels Award for National Security(1995), the James O. Douglas Gold MedalAward (1990), the ASM International’s Distin-guished Lectureship in Materials Society (1989),the Kent Van Horn Distinguished AlumnusAward, Case Western Reserve University (1989),an Honorary Degree of Scientiae Doctoris,College of Santa Fe (1988), the Year’s Top
100 Innovations Award from Science Digest(1985), and the Department of Energy’s E. O. Lawrence Award (1984). In addition to his current research activities, Sig is a member of the Council on Foreign Relations and the Pa-cific Council on International Policy. He alsoserves on the National Academy of EngineeringCommittee on Membership (chairman), Nominat-ing Committee, and Draper Prize Committee, and on the Fellows Awards Committee of The Metallurgical Society.