pmo-feasibility studiesqueja.yolasite.com/resources/dpwh - road feasibility study.pdf ·...
TRANSCRIPT

PMO-Feasibility Studies
Department of Public Works and Highways
ENGINEERING STUDIES
Road Feasibility StudyPresented By: Engr. Giles J. Miranda

Engineering Activities
Project Cost
Data Collection
Field Surveys
Evaluation/processing of Data
Preliminary Design
Improvement Alternatives
Cost EstimateUnit Price Analysis
Construction Pay Items
Maintenance Unit Rates
Maintenance Cost
Quantity
Calculation
Implementation
Schedule
Report
Economic
Evaluation
Standard
Drawings
Overview
Engineering studies mainly focus on:
preliminary engineering design
alternative design schemes
construction cost estimates of ± 20%
maintenance strategies and cost
cost comparison of each alternatives

Basic Components
Methodology
Existing Situation
Preliminary Engineering Design
Improvement Alternatives
Cost Estimate
Project Cost
Maintenance Cost
Implementation Schedule

Data Collection
Review of existing documents
Topographic maps
Aerial photographs
Climatological and Rainfall Data
Material Sources Map
Construction Materials Price List
Labor Wage
Equipment Rates (ACEL Ed. 24)

Engineering Surveys
Road
Bridge
Side Drains
Slope / Embankment
Terrain
Environment

Road
• Stationing
• Terrain
• Carriageway & shoulder/widths
• Pavement & shoulder types/condition
• Gradient & curvatures
• Roadside friction
• Drainage structures
• Flood/disaster prone areas
• River crossings
• New alignment/re-alignments (bypasses)
Inventory of Existing Condition

Bridge structure
• Stationing
• Bridge and/or stream name
• Carriageway & sidewalk/widths
• Number of spans and span length
• Overall length
• Type of Structure (super & sub)
• Posted load or load limit
• Condition of structure (sub & super)
• Others (e.g. protection works/geometry
of approaches
Inventory of Existing Condition
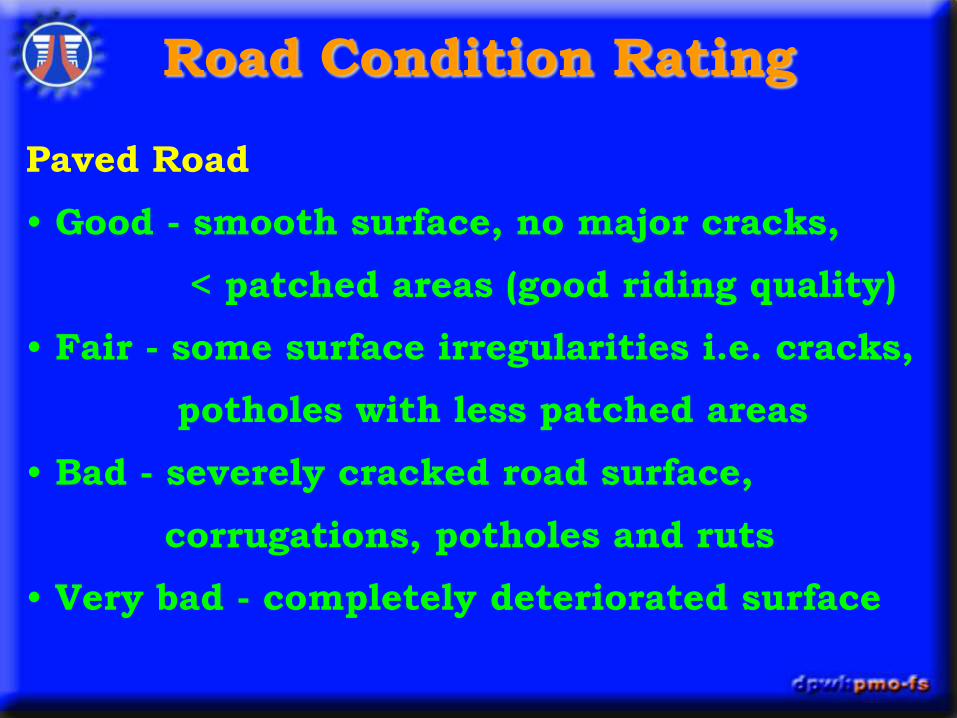
Paved Road
• Good - smooth surface, no major cracks,
< patched areas (good riding quality)
• Fair - some surface irregularities i.e. cracks,
potholes with less patched areas
• Bad - severely cracked road surface,
corrugations, potholes and ruts
• Very bad - completely deteriorated surface
Road Condition Rating

Unpaved Road
• Good - well-graded gravel, well defined cross
falls & adequate side drains
• Fair - presence of loose gravel & minor
depressions on the surface
• Bad - aggregates accumulate along the
roadside, depression on the traveled
way, presence of sizeable potholes
• Very bad - aggregates are scarce exposing
subgrade, severe depressions
Road Condition Rating
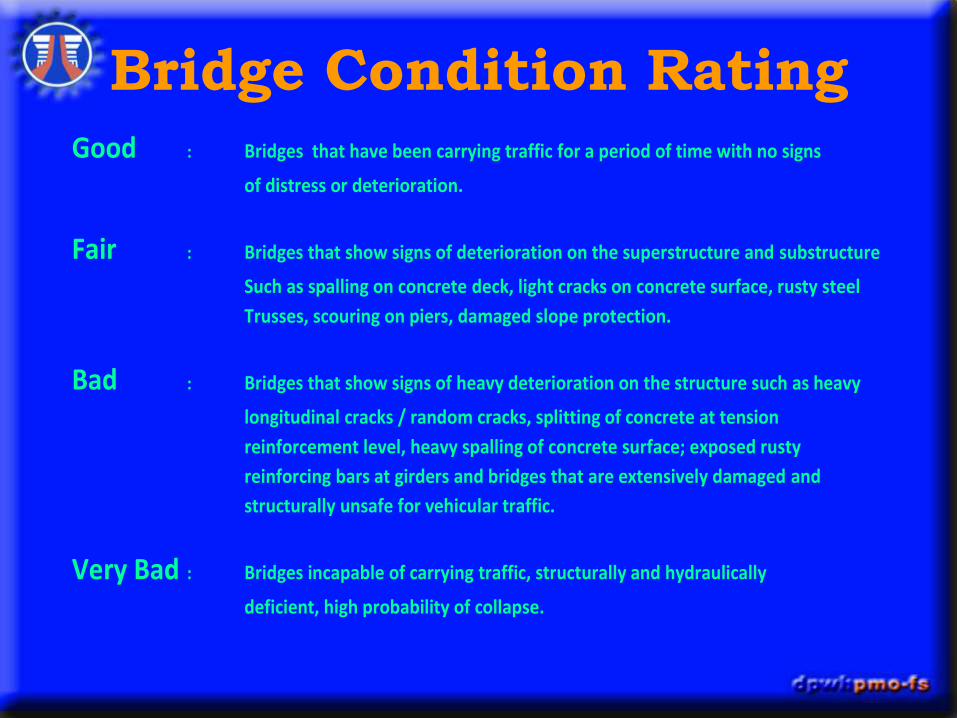
Bridge Condition RatingGood : Bridges that have been carrying traffic for a period of time with no signs
of distress or deterioration.
Fair : Bridges that show signs of deterioration on the superstructure and substructure
Such as spalling on concrete deck, light cracks on concrete surface, rusty steel
Trusses, scouring on piers, damaged slope protection.
Bad : Bridges that show signs of heavy deterioration on the structure such as heavy
longitudinal cracks / random cracks, splitting of concrete at tension
reinforcement level, heavy spalling of concrete surface; exposed rusty
reinforcing bars at girders and bridges that are extensively damaged and
structurally unsafe for vehicular traffic.
Very Bad : Bridges incapable of carrying traffic, structurally and hydraulically
deficient, high probability of collapse.

Road Distress SurveyPavement Distresses
Bituminous Concrete Gravel
Cracking
Rutting
Raveling
Potholing
Edge break
Surface texture
Skid resistance
Roughness
Cracking
Joint spalling
Faulting
Failures
Roughness
Gravel loss
Roughness

Alligator Cracking
Asphalt Pavement Distresses

Asphalt Pavement Distresses
Bad fatigue crackingFatigue cracking due to edge failure

Asphalt Pavement Distresses
Joint reflection cracking

Asphalt Pavement Distresses
Longitudinal cracking from the
poor join construction
Longitudinal cracking as the
onset of fatigue cracking

Asphalt Pavement Distresses
Large patched thermal crack Smaller patched thermal crack

Asphalt Pavement Distresses
HMA bleeding on wheelpaths BST bleeding on wheelpaths

Rutting
Asphalt Pavement Distresses

Raveling
Asphalt Pavement Distresses

Potholes
Asphalt Pavement Distresses

Corrugation and shoving
Asphalt Pavement Distresses

Cracking
Cement Concrete Pavement Distresses

Cement Concrete Pavement Distresses
Shrinkage cracks on brand new slabs Severe shrinkage cracking

Spalling on set Spalling from a bad construction joint
Cement Concrete Pavement Distresses

Cement Concrete Pavement Distresses
Exposed failure with rusted dowel bars Patched failure
Joint Load Transfer System Deterioration

Faulting
Cement Concrete Pavement Distresses

Cement Concrete Pavement Distresses
Corner break on a residential street Corner break on a highway
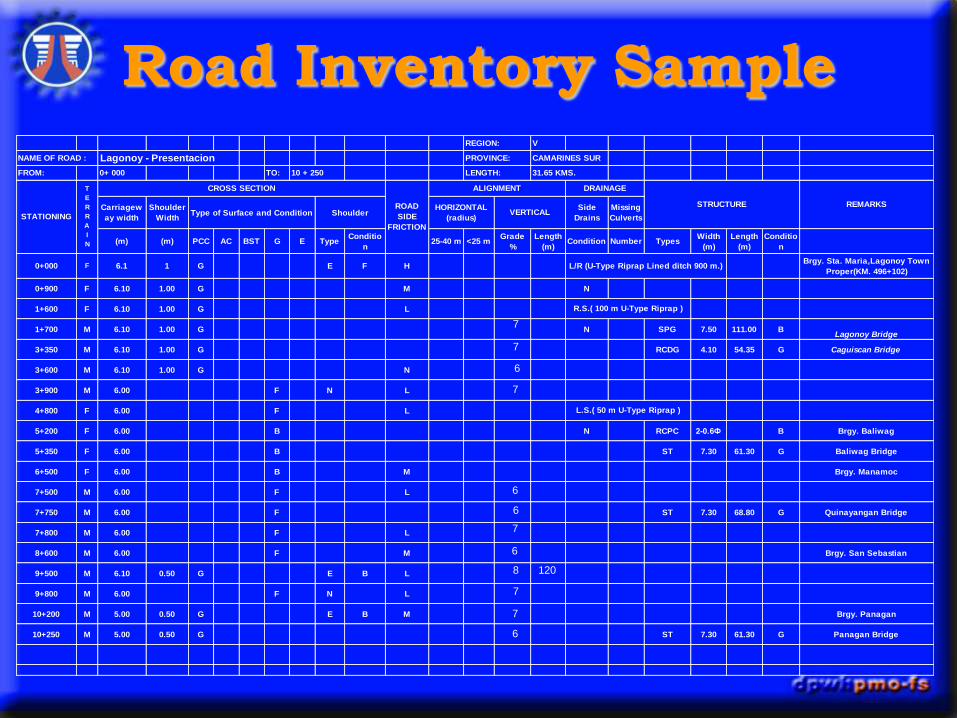
Road Inventory SampleREGION: V
NAME OF ROAD : Lagonoy - Presentacion PROVINCE: CAMARINES SUR
FROM: 0+ 000 TO: 10 + 250 LENGTH: 31.65 KMS.
CROSS SECTION
Carriagew
ay width
Shoulder
WidthType of Surface and Condition Shoulder
Side
Drains
Missing
Culverts
(m) (m) PCC AC BST G E TypeConditio
n25-40 m <25 m
Grade
%
Length
(m)Condition Number Types
Width
(m)
Length
(m)
Conditio
n
0+000 F 6.1 1 G E F HBrgy. Sta. Maria,Lagonoy Town
Proper(KM. 496+102)
0+900 F 6.10 1.00 G M N
1+600 F 6.10 1.00 G L
1+700 M 6.10 1.00 G N SPG 7.50 111.00 BLagonoy Bridge
3+350 M 6.10 1.00 G RCDG 4.10 54.35 G Caguiscan Bridge
3+600 M 6.10 1.00 G N
3+900 M 6.00 F N L
4+800 F 6.00 F L
5+200 F 6.00 B N RCPC 2-0.6Ф B Brgy. Baliwag
5+350 F 6.00 B ST 7.30 61.30 G Baliwag Bridge
6+500 F 6.00 B M Brgy. Manamoc
7+500 M 6.00 F L
7+750 M 6.00 F ST 7.30 68.80 G Quinayangan Bridge
7+800 M 6.00 F L
8+600 M 6.00 F M Brgy. San Sebastian
9+500 M 6.10 0.50 G E B L
9+800 M 6.00 F N L
10+200 M 5.00 0.50 G E B M Brgy. Panagan
10+250 M 5.00 0.50 G ST 7.30 61.30 G Panagan Bridge
REMARKS
STATIONING
T
E
R
R
A
I
N
ROAD
SIDE
FRICTION
ALIGNMENT
HORIZONTAL
(radius)VERTICAL
DRAINAGE
STRUCTURE
L/R (U-Type Riprap Lined ditch 900 m.)
R.S.( 100 m U-Type Riprap )
L.S.( 50 m U-Type Riprap )
7
7
7
6
6
6
7
6
8
7
7
6
120

• Bridge Inventory Format

• Vertical measurement of road’s surface express
in quantitative terms.
• IRI = 0.7 + 0.0215(RP)
• where: IRI = International Roughness Index,
in/km
• RP = Philippine roughness, in/km
• Average initial IRI for pavements:
• PCC - IRI =< 4.22 m/km
• AC - IRI >= 3.46 m/km
Road Roughness Survey

Average Roughness (IRI)
Highway Road Condition
Planning Manual Rating
Good = 3 Good
Fair = 5 Fair
Poor = 7 Bad
Failed = 12 Very Bad
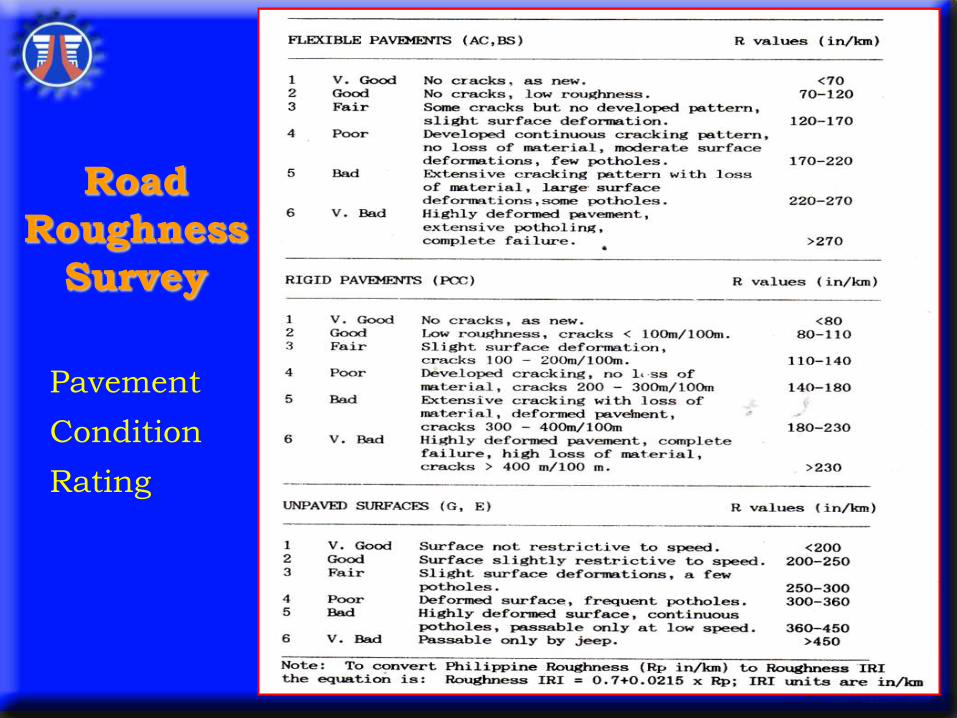
Road
Roughness
Survey
Pavement
Condition
Rating

Surface Condition, Speed and
Roughness
PAVEMENT SPEED
TYPE km/hr. in/km m/km
Paved Good 1 70-80 80 2.03 4.4 - 5.0
Paved Good/Fair 2 65-70 100 2.54 3.7 - 4.3
Paved Fair 3 55-65 150 3.81 3.0 - 3.6
Paved Fair/Bad 4 45-55 205 5.21 2.3 - 2.9
Paved Bad 5 35-40 265 6.73 1.6 - 2.2
Paved Bad/V. Bad 6 25-35 330 8.38 0.9 - 1.5
Paved Very Bad 7 20-25 465 11.81 0.2 - 0.8
Gravel Good 8 65-70 205 5.21 4.4 - 5.0
Gravel Good/Fair 9 60-65 255 6.48 3.7 - 4.3
Gravel Fair 10 50-60 340 8.64 3.0 - 3.6
Gravel Fair/Bad 11 40-50 390 9.91 2.3 - 2.9
Gravel Bad 12 30-40 455 11.56 1.6 - 2.2
Gravel Bad/V. Bad 13 25-30 515 13.08 0.9 - 1.5
Gravel Very Bad 14 20-25 600 15.24 0.2 - 0.8
Stone Very Bad 15 10-15 830 21.08 0.2 - 0.8
Earth Bad 16 20-25 600 15.24 1.6 - 2.2
Earth Very Bad 17 10-15 755 19.18 0.2 - 0.1
18 - - - 0.0 - 0.1
1 SCON NO. - is DPWH surface condition rating.
SURFACE ROUGHNESS
Impassable
ROUGHNESS RATINGSCON NO.1CONDITION

Road Distress Survey
A vehicle outfitted with sensor-based pavement
distress data collection technology.

Road Distress Survey
Image-based technology collects pavement
distress data using photography, videotape,
and digital imaging.

Project Design
Existing Situation
Preliminary Engineering Design
• Highway Engineering
• Bridge/Structural Engineering
• Hydrology/Drainage Design
Improvement Alternatives
• Route Alignment
• Pavement Types
• Bridge Type
• Other necessary improvements

TRRL Design Method
Basic Design Requirements
1. Design Life
2. Traffic Loading (CESAL)
3. Subgrade Strength (CBR)
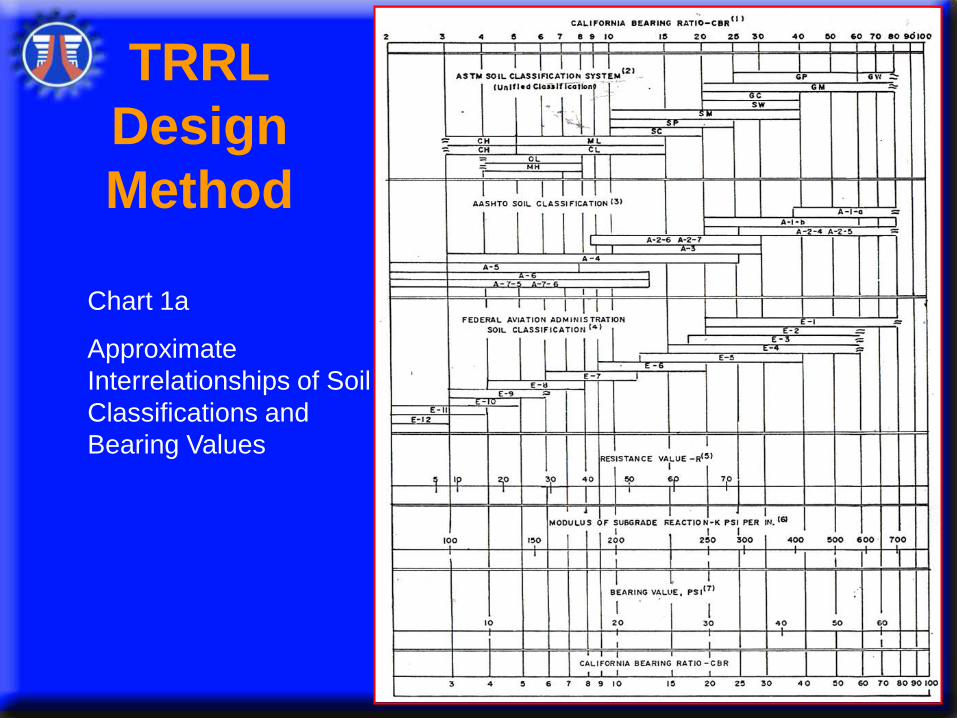
TRRL
Design
Method
Chart 1a
Approximate
Interrelationships of Soil
Classifications and
Bearing Values

TRRL
Design
Method
Design of
Flexible
Pavement
Determining
subbase & AC
thicknesses

TRRL Design Method
Design of Flexible PavementDetermining subbase thickness

TRRL Design Method
Design of Flexible Pavement
Determining Base & AC thickness

TRRL Design Method
Design of Rigid PavementDetermining PCC thickness
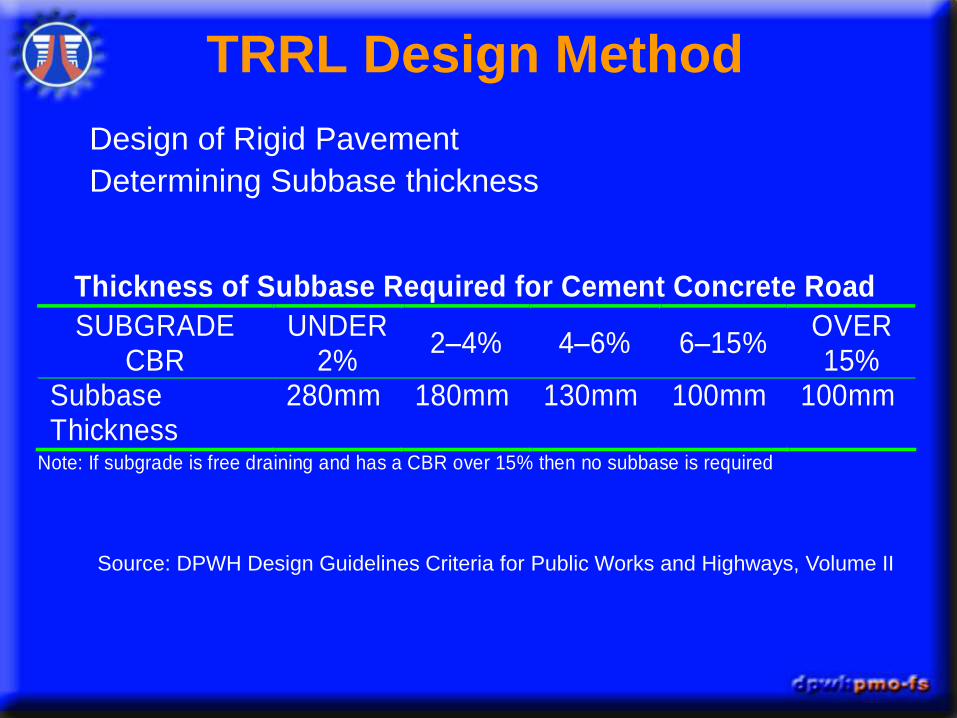
TRRL Design Method
Design of Rigid Pavement
Determining Subbase thickness page 32
Thickness of Subbase Required for Cement Concrete Road
SUBGRADE CBR
UNDER 2%
2–4% 4–6% 6–15% OVER 15%
Subbase Thickness
280mm 180mm 130mm 100mm 100mm
Note: If subgrade is free draining and has a CBR over 15% then no subbase is required
Source: DPWH Design Guidelines Criteria for Public Works and Highways, Volume II

TRRL Design MethodDesign of Rigid Pavement
Classification of Subgrade for Concrete Roads and Minimum Thickness of Subbase Required
Type of Subgrade
Definition
Minimum Thickness of Subbase Required
Weak All subgrade of CBR value 2 percent or less as defined in the Table for estimated CBR values for soils compacted at the natural moisture content……………………………… 150 mm
Normal Subgrades other than those defined by the other categories…………………
80 mm
Very Stable All subgrades of CBR value 15 percent or more as defined in the Table for estimated laboratory CBR values for soils compacted at the natural moisture content……………………………… 0

TRRL Design MethodDesign of Rigid Pavement
Estimated Laboratory CBR Values for Compacted at the Natural Moisture Content
Type of Soil
Plastic Index (percent) CBR (percent)
Depth of water-table below formation level
More than 600mm 600mm or less
Heavy clay 70 60 50 40
2 2
2.5 3
1 1.5 2 2
Silty clay 30 5 3
Sandy clay 20 10
6 7
4 5
Silt - 2 1
Sand (poorly graded) Non plastic 20 10
Sand (well graded) Non plastic 40 15
Well graded Sandy gravel Non plastic 60 20
British Soil

Design of Unpaved Roads
RECOMMENDED THICKNESS OF GRAVEL LAYERS TO BE PLACED ON THE SUBGRADE OF A GRAVEL ROAD
TRAFFIC ADT
(in both directions)
Subgrade Soil Recommended Total
Minimum Thickness of Gravel+
A1, A2, A3 soils or if CBR > 7
150mm < 200
A4, A5, A6, A7 soils or if CBR is between 3 and 7
200mm
A1, A2, A3 soils or if CBR > 7
200mm > 200
A4, A5, A6, A7 soils or if CBR is between 3 and 7
250mm
+ if drainage is bad (water-table less than 600mm below subgrade formation) use additional 50mm gravel.
= if CBR of soil is less than 3%, add 50mm of gravel to recommended minimum thickness.
Source: DPWH Design Guidelines Criteria for Public Works and Highways, Volume II

Construction/Project Cost
Unit Price Analysis Labor
basic wage fringe benefits bonuses social security & other social charges
Equipment bare hourly & rental operating cost fuels & lubricants repairs & maintenance labor
Materials labor equipment
Production Rate

PROJECT : DATE :
100 (1) Clearing and Grubbing
Foreign Local
Component Component
A. Equipment:
1 Bulldozer , 140 hp. P/hr 2,619.01 1,484.33 680.88 453.81 2,165.20 2,619.01
1 Wheel Loader, 1.53 cu.m. P/hr 1,656.58 934.21 450.08 272.29 1,384.29 1,656.58
1 Dump Trucks , 9 - 11.46 cu.m. P/hr 2,201.63 1,280.92 599.41 321.29 1,880.34 2,201.63
Minor Tools
( 10 % of Unskilled Laborers ) P/hr 26.02 3.22 26.02 29.23
B. Labor :
1 Capataz P/hr 62.90 55.98 6.92 55.98 62.90
2 Skilled Laborer P/hr 44.33 78.91 9.75 78.91 88.66
4 Unskilled Laborer P/hr 35.19 125.28 15.48 125.28 140.77
Total A + B 3,699.45 2,016.57 1,082.77 5,716.02 6,798.79
C. Output :
0.12 Ha/hr.
P/Ha. 30,828.78 16,804.71 9,023.09 47,633.49 56,656.58
D. Materials :
NONE
Total Direct Cost ( C + D ) P/Ha. 30,828.78 16,804.71 9,023.09 47,633.49 56,656.58
E. VAT ( 10% of Total Direct Cost ) P/Ha. 3,082.88 1,680.47 902.31 4,763.35 5,665.66
F. Bond and Insurance ( 1% of TDC )P/Ha. 308.29 168.05 90.23 476.33 566.57
G. Overhead and Profit ( 16% ) P/Ha. 4,932.60 2,688.75 1,443.70 7,621.36 9,065.05
Total Indirect Cost ( E + F + G ) P/Ha. 8,323.77 4,537.27 2,436.24 12,861.04 15,297.28
TOTAL COST P/Ha. 39,152.55 21,341.98 11,459.33 60,494.53 71,953.86
% 54 30 16 84 100
Cost of ( Equipment + Labor )
( A + B ) / C
Total D
Cost Component
Total B 260.17 32.16 260.17 292.33
Total A 3,699.45 1,756.39 1,050.62 5,455.85 6,506.46
UNIT PRICE ANALYSIS
Pay Item No.
Description P/unit Unit Cost Taxes Economic Financial

Quantity Estimates
Construction/Project Cost
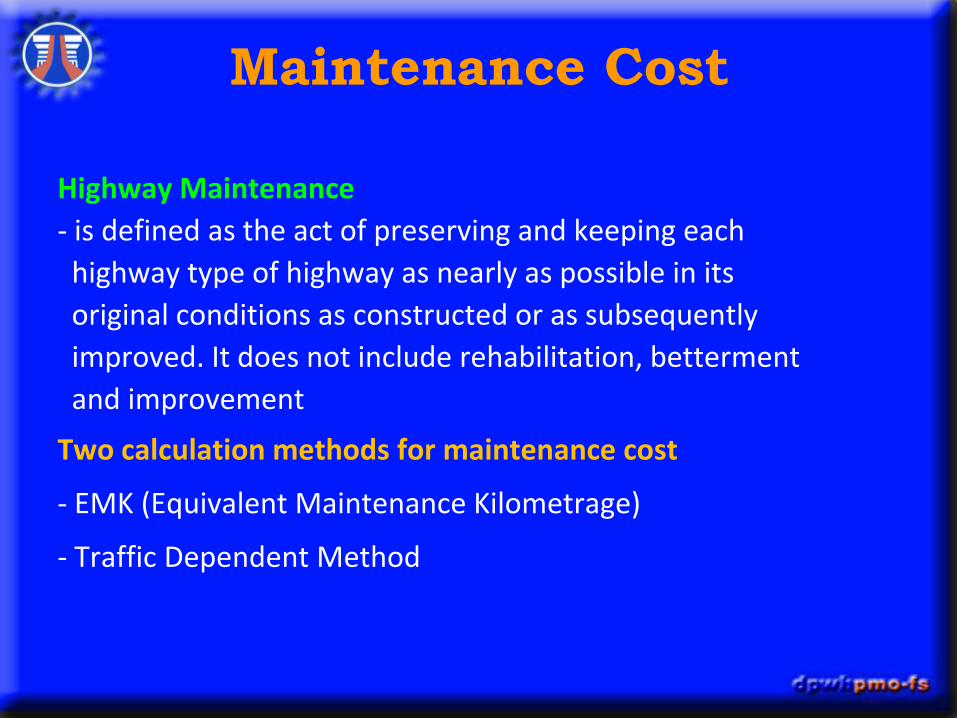
Highway Maintenance
- is defined as the act of preserving and keeping each
highway type of highway as nearly as possible in its
original conditions as constructed or as subsequently
improved. It does not include rehabilitation, betterment
and improvement
Two calculation methods for maintenance cost
- EMK (Equivalent Maintenance Kilometrage)
- Traffic Dependent Method
Maintenance Cost
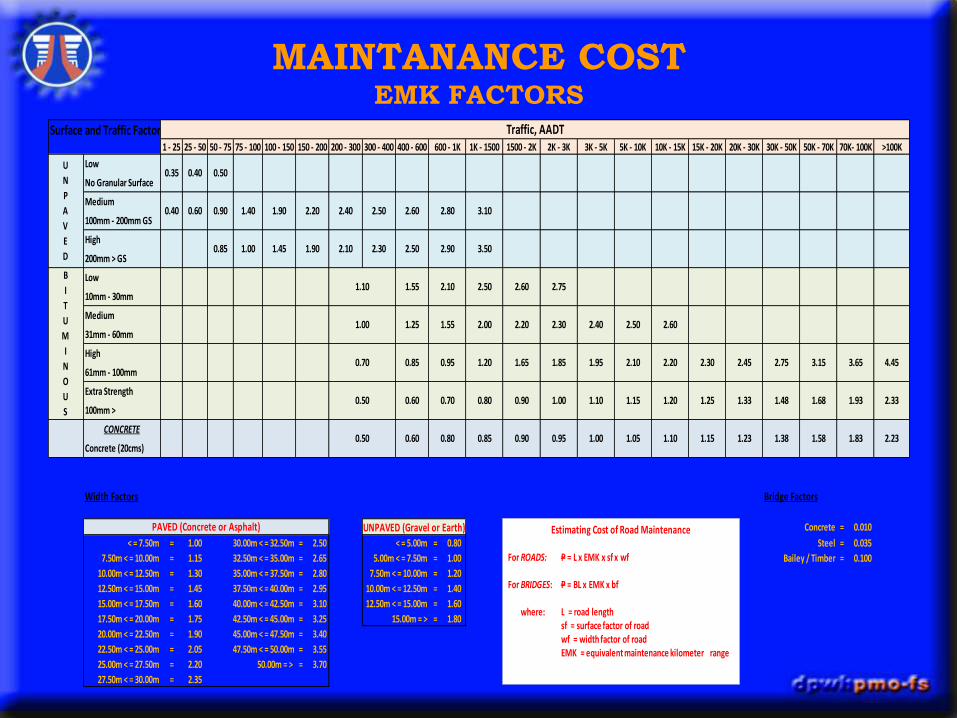
MAINTANANCE COSTEMK FACTORS
Surface and Traffic Factors1 - 25 25 - 50 50 - 75 75 - 100 100 - 150 150 - 200 200 - 300 300 - 400 400 - 600 600 - 1K 1K - 1500 1500 - 2K 2K - 3K 3K - 5K 5K - 10K 10K - 15K 15K - 20K 20K - 30K 30K - 50K 50K - 70K 70K- 100K >100K
Low
No Granular Surface
Medium
100mm - 200mm GS
High
200mm > GS
Low
10mm - 30mm
Medium
31mm - 60mm
High
61mm - 100mm
Extra Strength
100mm >
CONCRETE
Concrete (20cms)
Width Factors Bridge Factors
UNPAVED (Gravel or Earth) Concrete = 0.010
< = 7.50m = 1.00 30.00m < = 32.50m = 2.50 < = 5.00m = 0.80 Steel = 0.035
7.50m < = 10.00m = 1.15 32.50m < = 35.00m = 2.65 5.00m < = 7.50m = 1.00 Bailey / Timber = 0.100
10.00m < = 12.50m = 1.30 35.00m < = 37.50m = 2.80 7.50m < = 10.00m = 1.20
12.50m < = 15.00m = 1.45 37.50m < = 40.00m = 2.95 10.00m < = 12.50m = 1.40
15.00m < = 17.50m = 1.60 40.00m < = 42.50m = 3.10 12.50m < = 15.00m = 1.60
17.50m < = 20.00m = 1.75 42.50m < = 45.00m = 3.25 15.00m = > = 1.80
20.00m < = 22.50m = 1.90 45.00m < = 47.50m = 3.40
22.50m < = 25.00m = 2.05 47.50m < = 50.00m = 3.55
25.00m < = 27.50m = 2.20 50.00m = > = 3.70
27.50m < = 30.00m = 2.35
U
N
P
A
V
E
D
B
I
T
U
M
I
N
O
U
S
0.35 0.40 0.50
0.40 0.60 0.90 1.40 1.90 2.20 2.40 2.50 2.60 2.80 3.10
0.85 1.00 1.45 1.90 2.10 2.30 2.50 2.90 3.50
1.10 1.55 2.10 2.50 2.60 2.75
1.25 1.55 2.00 2.20 2.301.00 2.40 2.50 2.60
0.70 2.20 2.30 2.45 2.750.85 0.95 1.20 1.65 1.85 3.15 3.65
0.60
1.95 2.10
1.48 1.68 1.930.70 0.80 0.90 1.00 1.10 1.15
4.45
2.33
Traffic, AADT
0.50 1.20 1.25 1.33
1.380.60 0.80 0.85 0.90 0.95 1.58 1.83 2.230.50
PAVED (Concrete or Asphalt)
1.00 1.05 1.10 1.15 1.23
Estimating Cost of Road Maintenance
For ROADS: P = L x EMK x sf x wf
For BRIDGES: P = BL x EMK x bf
where: L = road lengthsf = surface factor of roadwf = width factor of roadEMK = equivalent maintenance kilometer range

Consists of:
project appraisal,
pledging
exchange of notes
loan negotiation/signing
selection/procurement of consultants
detailed engineering design
pre-construction activities
RROW acquisition
construction period
Implementation Schedule
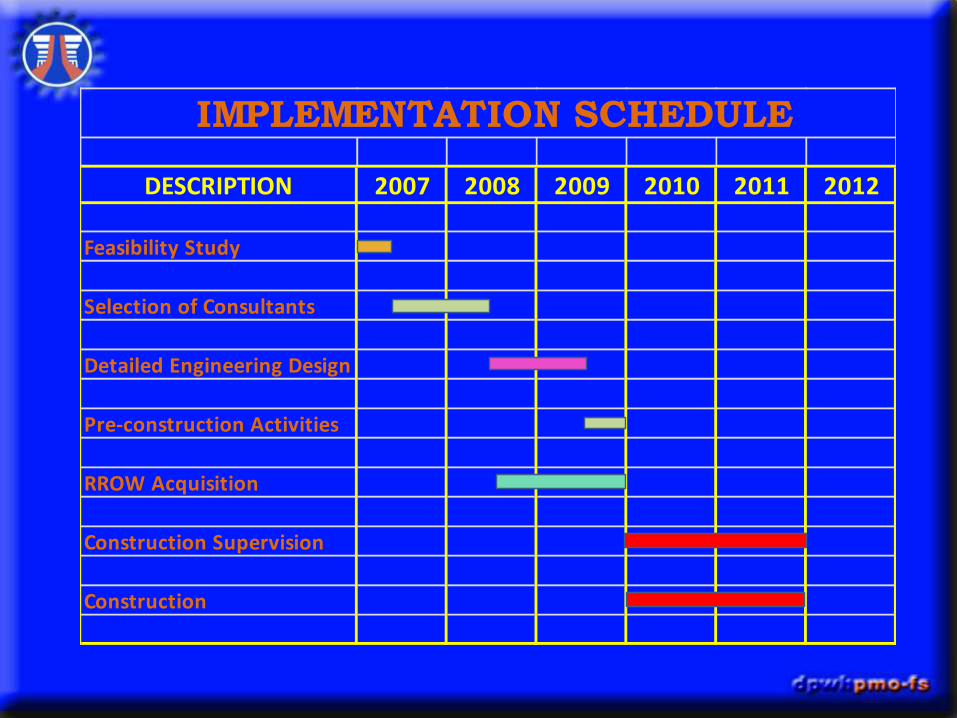
DESCRIPTION 2007 2008 2009 2010 2011 2012
Feasibility Study
Selection of Consultants
Detailed Engineering Design
Pre-construction Activities
RROW Acquisition
Construction Supervision
Construction
IMPLEMENTATION SCHEDULE

Investment Schedule and Cash Flow
DESCRIPTION 2007 2008 2009 2010 2011 2012
Detailed Engineering Design
RROW Acquisition
Construction Supervision
Construction
DESCRIPTION 2007 2008 2009 2010 2011 TOTAL
Detailed Engineering Design 6.00 4.00 10.00
RROW Acquisition 9.00 12.00 21.00
Construction Supervision 10.00 10.00 20.00
Construction 125.00 125.00 250.00
Grand Total 15.00 16.00 135.00 135.00 301.00
CASH FLOW (in Million Pesos)
INVESTMENT SCHEDULE

Sample Drawings
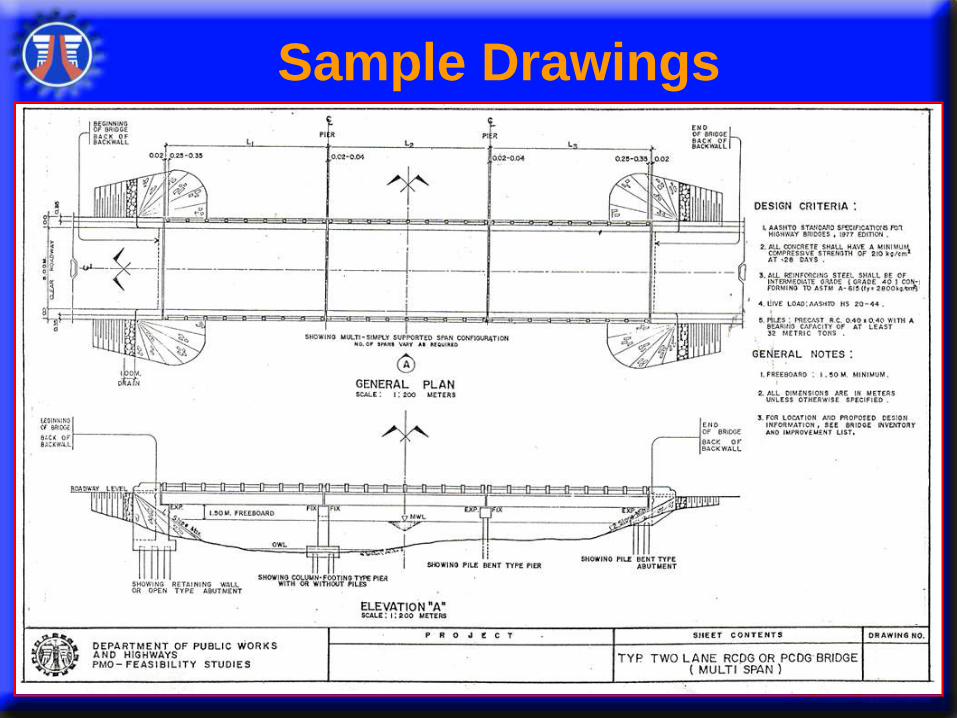
Sample Drawings

Sample Drawings

Sample Drawings
