pmt - physics & maths tutorpmt.physicsandmathstutor.com/download/maths/a-level... · section b...
TRANSCRIPT

PMT

PMT

PMT

PMT

PMT

PMT

PMT

PMT

PMT

PMT

PMT

PMT

PMT

OXFORD CAMBRIDGE AND RSA EXAMINATIONS
Advanced Subsidiary General Certificate of EducationAdvanced General Certificate of Education
MEI STRUCTURED MATHEMATICS 4766Statistics 1
Advanced Subsidiary General Certificate of Education
MEI STATISTICS G241Statistics 1 (Z1)
Thursday 12 JANUARY 2006 Afternoon 1 hour 30 minutes
Additional materials:8 page answer bookletGraph paperMEI Examination Formulae and Tables (MF2)
TIME 1 hour 30 minutes
INSTRUCTIONS TO CANDIDATES
• Write your name, centre number and candidate number in the spaces provided on the answerbooklet.
• Answer all the questions.
• You are permitted to use a graphical calculator in this paper.
• Final answers should be given to a degree of accuracy appropriate to the context.
INFORMATION FOR CANDIDATES
• The number of marks is given in brackets [ ] at the end of each question or part question.
• You are advised that an answer may receive no marks unless you show sufficient detail of theworking to indicate that a correct method is being used.
• The total number of marks for this paper is 72.
HN/2© OCR 2006 [H/102/2650] Registered Charity 1066969 [Turn over
This question paper consists of 6 printed pages and 2 blank pages.
PMT

Section A (36 marks)
1 The times taken, in minutes, by 80 people to complete a crossword puzzle are summarised by thebox and whisker plot below.
(i) Write down the range and the interquartile range of the times. [2]
(ii) Determine whether any of the times can be regarded as outliers. [3]
(iii) Describe the shape of the distribution of the times. [1]
2 Four letters are taken out of their envelopes for signing. Unfortunately they are replaced randomly,one in each envelope.
The probability distribution for the number of letters, X, which are now in the correct envelope isgiven in the following table.
(i) Explain why the case is impossible. [1]
(ii) Explain why [2]
(iii) Calculate and [5]
3 Over a long period of time, 20% of all bowls made by a particular manufacturer are imperfect andcannot be sold.
(i) Find the probability that fewer than 4 bowls from a random sample of 10 made by themanufacturer are imperfect. [2]
The manufacturer introduces a new process for producing bowls. To test whether there has beenan improvement, each of a random sample of 20 bowls made by the new process is examined.From this sample, 2 bowls are found to be imperfect.
(ii) Show that this does not provide evidence, at the 5% level of significance, of a reduction in theproportion of imperfect bowls. You should show your hypotheses and calculations clearly.
[6]
Var (X).E(X)
P(X � 4) � 124 .
X � 3
r 0 1 2 3 4
P(X = r) 038
13
14
124
15 26 29 35 55
2
4766/G241 January 2006
PMT

4 A company sells sugar in bags which are labelled as containing 450 grams.
Although the mean weight of sugar in a bag is more than 450 grams, there is concern that too manybags are underweight. The company can adjust the mean or the standard deviation of the weight ofsugar in a bag.
(i) State two adjustments the company could make. [2]
The weights, x grams, of a random sample of 25 bags are now recorded.
(ii) Given that and , calculate the sample mean and samplestandard deviation of these weights. [3]
5 A school athletics team has 10 members. The table shows which competitions each of the memberscan take part in.
An athlete is selected at random. Events A, B, C, D are defined as follows.
A: the athlete can take part in exactly 2 competitions.B: the athlete can take part in the 200 m.C: the athlete can take part in the 110 m hurdles.D: the athlete can take part in the long jump.
(i) Write down the value of [1]
(ii) Write down the value of [1]
(iii) Which two of the four events A, B, C, D are mutually exclusive? [1]
(iv) Show that events B and D are not independent. [2]
P(C � D).
P(A � B).
Competiton
100 m 200 m 110m 400 m Longhurdles jump
Abel ✓ ✓ ✓
Bernoulli ✓ ✓
Cauchy ✓ ✓ ✓
Descartes ✓ ✓
Einstein ✓ ✓
Fermat ✓ ✓
Galois ✓ ✓
Hardy ✓ ✓ ✓
Iwasawa ✓ ✓
Jacobi ✓
Ath
lete
S x 2 � 5206937S x � 11 409
3
4766/G241 January 2006 [Turn over
PMT

6 A band has a repertoire of 12 songs suitable for a live performance. From these songs, a selectionof 7 has to be made.
(i) Calculate the number of different selections that can be made. [2]
(ii) Once the 7 songs have been selected, they have to be arranged in playing order. In how manyways can this be done? [2]
4
4766/G241 January 2006
PMT

Section B (36 marks)
7 At East Cornwall College, the mean GCSE score of each student is calculated. This is done byallocating a number of points to each GCSE grade in the following way.
(i) Calculate the mean GCSE score, X, of a student who has the following GCSE grades:
A*, A*, A, A, A, B, B, B, B, C, D. [2]
60 students study AS Mathematics at the college. The mean GCSE scores of these students aresummarised in the table below.
(ii) Draw a histogram to illustrate this information. [3]
(iii) Calculate estimates of the sample mean and the sample standard deviation. [5]
The scoring system for AS grades is shown in the table below.
The Mathematics department at the college predicts each student’s AS score, Y, using the formulawhere X is the student's average GCSE score.
(iv) What AS grade would the department predict for a student with an average GCSE score of 7.4? [2]
(v) What do you think the prediction should be for a student with an average GCSE score of 5.5?Give a reason for your answer. [3]
(vi) Using your answers to part (iii), estimate the sample mean and sample standard deviation ofthe predicted AS scores of the 60 students in the department. [3]
Y � 13X � 46,
AS Grade A B C D E U
Score 60 50 40 30 20 0
Mean GCSE score Number of students
4.5 � X � 5.5 8
5.5 � X � 6.0 14
6.0 � X � 6.5 19
6.5 � X � 7.0 13
7.0 � X � 8.0 6
Grade A* A B C D E F G U
Points 8 7 6 5 4 3 2 1 0
5
4766/G241 January 2006 [Turn over
PMT
6
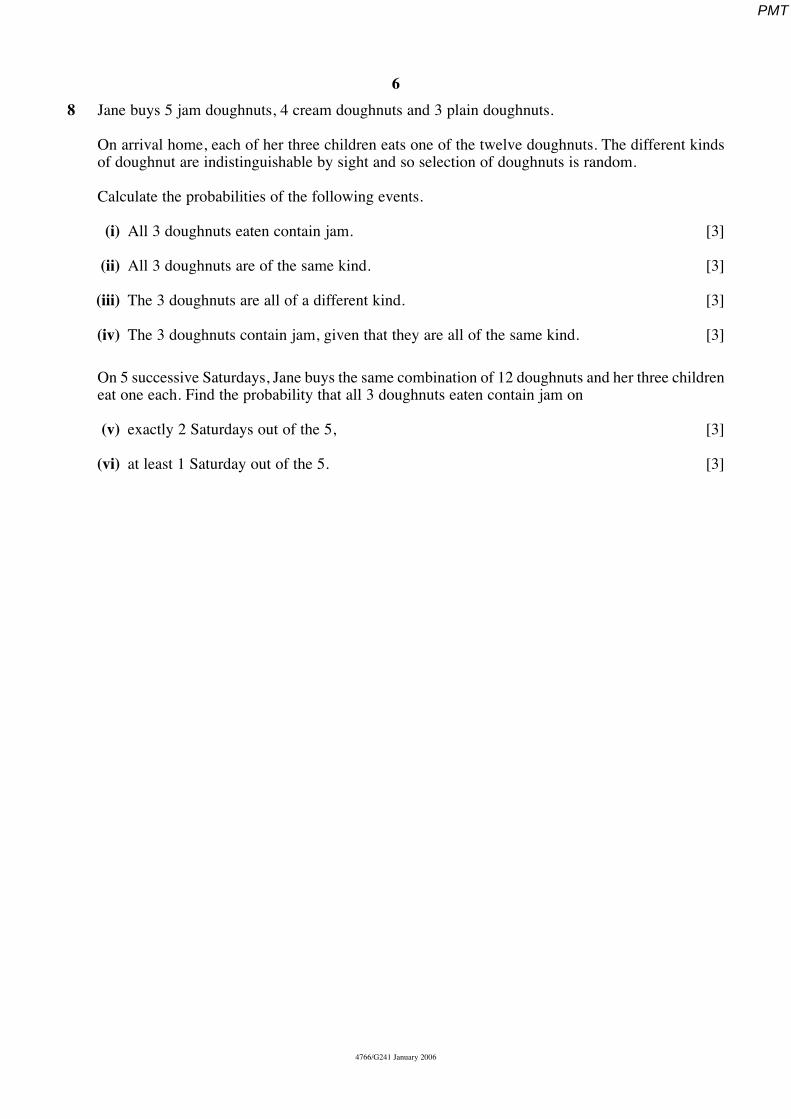
8 Jane buys 5 jam doughnuts, 4 cream doughnuts and 3 plain doughnuts.
On arrival home, each of her three children eats one of the twelve doughnuts. The different kindsof doughnut are indistinguishable by sight and so selection of doughnuts is random.
Calculate the probabilities of the following events.
(i) All 3 doughnuts eaten contain jam. [3]
(ii) All 3 doughnuts are of the same kind. [3]
(iii) The 3 doughnuts are all of a different kind. [3]
(iv) The 3 doughnuts contain jam, given that they are all of the same kind. [3]
On 5 successive Saturdays, Jane buys the same combination of 12 doughnuts and her three childreneat one each. Find the probability that all 3 doughnuts eaten contain jam on
(v) exactly 2 Saturdays out of the 5, [3]
(vi) at least 1 Saturday out of the 5. [3]
4766/G241 January 2006
PMT

OXFORD CAMBRIDGE AND RSA EXAMINATIONS
Advanced Subsidiary General Certificate of EducationAdvanced General Certificate of Education
MEI STRUCTURED MATHEMATICS 4766Statistics 1
Advanced Subsidiary General Certificate of Education
MEI STATISTICS G241Statistics 1 (Z1)
Wednesday 24 MAY 2006 Afternoon 1 hour 30 minutes
Additional materials:8 page answer bookletGraph paperMEI Examination Formulae and Tables (MF2)
TIME 1 hour 30 minutes
INSTRUCTIONS TO CANDIDATES
• Write your name, centre number and candidate number in the spaces provided on the answerbooklet.
• Answer all the questions.
• You are permitted to use a graphical calculator in this paper.
• Final answers should be given to a degree of accuracy appropriate to the context.
INFORMATION FOR CANDIDATES
• The number of marks is given in brackets [ ] at the end of each question or part question.
• You are advised that an answer may receive no marks unless you show sufficient detail of theworking to indicate that a correct method is being used.
• The total number of marks for this paper is 72.
HN/4© OCR 2006 [H/102/2650] Registered Charity 1066969 [Turn over
This question paper consists of 5 printed pages and 3 blank pages.
PMT

Section A (36 marks)
1 Every day, George attempts the quiz in a national newspaper. The quiz always consists of 7questions. In the first 25 days of January, the numbers of questions George answers correctly eachday are summarised in the table below.
(i) Draw a vertical line chart to illustrate the data. [2]
(ii) State the type of skewness shown by your diagram. [1]
(iii) Calculate the mean and the mean squared deviation of the data. [3]
(iv) How many correct answers would George need to average over the next 6 days if he is toachieve an average of 5 correct answers for all 31 days of January? [2]
2 Isobel plays football for a local team. Sometimes her parents attend matches to watch her play.
• A is the event that Isobel’s parents watch a match.
• B is the event that Isobel scores in a match.
You are given that and
(i) Calculate [2]
The probability that Isobel does not score and her parents do not attend is 0.1.
(ii) Draw a Venn diagram showing the events A and B, and mark in the probability correspondingto each of the regions of your diagram. [2]
(iii) Are events A and B independent? Give a reason for your answer. [2]
(iv) By comparing with explain why Isobel should ask her parents not to attend.[2]
3 The score, X, obtained on a given throw of a biased, four-faced die is given by the probabilitydistribution
for r = 1, 2, 3, 4.
(i) Show that [2]
(ii) Calculate and [5]Var (X).E (X)
k = 150 .
P(X � r) � kr(8 � r)
P(B),P( | )B A
P(A � B).
P( ) .A = 710P( | )B A = 3
7
Number correct 1 2 3 4 5 6 7
Frequency 1 2 3 3 4 7 5
2
4766/G241 June 2006
PMT

4 Peter and Esther visit a restaurant for a three-course meal. On the menu there are 4 starters, 5 maincourses and 3 sweets. Peter and Esther each order a starter, a main course and a sweet.
(i) Calculate the number of ways in which Peter may choose his three-course meal. [2]
(ii) Suppose that Peter and Esther choose different dishes from each other.
(A) Show that the number of possible combinations of starters is 6. [1]
(B) Calculate the number of possible combinations of 6 dishes for both meals. [1]
(iii) Suppose instead that Peter and Esther choose their dishes independently.
(A) Write down the probability that they choose the same main course. [1]
(B) Find the probability that they choose different dishes from each other for every course.[2]
5 Douglas plays darts, and the probability that he hits the number he is aiming at is 0.87 for anyparticular dart.
Douglas aims a set of three darts at the number 20; the number of times he is successful can bemodelled by .
(i) Calculate the probability that Douglas hits 20 twice. [3]
(ii) Douglas aims fifty sets of 3 darts at the number 20. Find the expected number of sets forwhich Douglas hits 20 twice. [1]
(iii) Douglas aims four sets of 3 darts at the number 20. Calculate the probability that he hits 20twice for two sets out of the four. [2]
B(3, 0.87)
3
4766/G241 June 2006 [Turn over
PMT

Section B (36 marks)
6 It has been estimated that 90% of paintings offered for sale at a particular auction house aregenuine, and that the other 10% are fakes. The auction house has a test to determine whether ornot a given painting is genuine. If this test gives a positive result, it suggests that the painting isgenuine. A negative result suggests that the painting is a fake.
If a painting is genuine, the probability that the test result is positive is 0.95.
If a painting is a fake, the probability that the test result is positive is 0.2.
(i) Copy and complete the probability tree diagram below, to illustrate the information above.[2]
Calculate the probabilities of the following events.
(ii) The test gives a positive result. [2]
(iii) The test gives a correct result. [2]
(iv) The painting is genuine, given a positive result. [3]
(v) The painting is a fake, given a negative result. [3]
A second test is more accurate, but very expensive. The auction house has a policy of only usingthis second test on those paintings with a negative result on the original test.
(vi) Using your answers to parts (iv) and (v), explain why the auction house has this policy. [2]
The probability that the second test gives a correct result is 0.96 whether the painting is genuineor a fake.
(vii) Three paintings are independently offered for sale at the auction house. Calculate theprobability that all three paintings are genuine, are judged to be fakes in the first test, but arejudged to be genuine in the second test. [4]
genuine
fake
negative
4
4766/G241 June 2006
PMT

7 A geologist splits rocks to look for fossils. On average 10% of the rocks selected from a particulararea do in fact contain fossils.
The geologist selects a random sample of 20 rocks from this area.
(i) Find the probability that
(A) exactly one of the rocks contains fossils, [3]
(B) at least one of the rocks contains fossils. [3]
(ii) A random sample of n rocks is selected from this area. The geologist wants to have aprobability of 0.8 or greater of finding fossils in at least one of the n rocks. Find the leastpossible value of n. [3]
(iii) The geologist explores a new area in which it is claimed that less than 10% of rocks containfossils. In order to investigate the claim, a random sample of 30 rocks from this area isselected, and the number which contain fossils is recorded. A hypothesis test is carried out atthe 5% level.
(A) Write down suitable hypotheses for the test. [3]
(B) Show that the critical region consists only of the value 0. [4]
(C) In fact, 2 of the 30 rocks in the sample contain fossils. Complete the test, stating yourconclusions clearly. [2]
5
4766/G241 June 2006
PMT

ADVANCED SUBSIDIARY GCE UNIT 4766/01MATHEMATICS (MEI)
Statistics 1
FRIDAY 12 JANUARY 2007 Morning
Time: 1 hour 30 minutesAdditional Materials:
Answer booklet (8 pages)Graph paperMEI Examination Formulae and Tables (MF2)
INSTRUCTIONS TO CANDIDATES
• Write your name, centre number and candidate number in the spaces provided on the answer booklet.
• Answer all the questions.
• You are permitted to use a graphical calculator in this paper.
• Final answers should be given to a degree of accuracy appropriate to the context.
INFORMATION FOR CANDIDATES
• The number of marks is given in brackets [ ] at the end of each question or part question.
• The total number of marks for this paper is 72.
ADVICE TO CANDIDATES
• Read each question carefully and make sure you know what you have to do before starting your answer.
• You are advised that an answer may receive no marks unless you show sufficient detail of the working toindicate that a correct method is being used.
This document consists of 6 printed pages and 2 blank pages.
© OCR 2007 [H/102/2650] OCR is an exempt Charity [Turn over
PMT

2
Section A (36 marks)
1 The total annual emissions of carbon dioxide, x tonnes per person, for 13 European countries are givenbelow.
6.2 6.7 6.8 8.1 8.1 8.5 8.6 9.0 9.9 10.1 11.0 11.8 22.8
(i) Find the mean, median and midrange of these data. [4]
(ii) Comment on how useful each of these is as a measure of central tendency for these data, givinga brief reason for each of your answers. [3]
2 The numbers of absentees per day from Mrs Smith’s reception class over a period of 50 days aresummarised below.
Number of absentees 0 1 2 3 4 5 6 >6
Frequency 8 15 11 8 3 4 1 0
(i) Illustrate these data by means of a vertical line chart. [2]
(ii) Calculate the mean and root mean square deviation of these data. [3]
(iii) There are 30 children in Mrs Smith’s class altogether. Find the mean and root mean squaredeviation of the number of children who are present during the 50 days. [2]
3 The times taken for 480 university students to travel from their accommodation to lectures aresummarised below.
Time (t minutes) 0 ≤ t < 5 5 ≤ t < 10 10 ≤ t < 20 20 ≤ t < 30 30 ≤ t < 40 40 ≤ t < 60
Frequency 34 153 188 73 27 5
(i) Illustrate these data by means of a histogram. [5]
(ii) Identify the type of skewness of the distribution. [1]
© OCR 2007 4766/01 Jan07
PMT

3
4 A fair six-sided die is rolled twice. The random variable X represents the higher of the two scores.The probability distribution of X is given by the formula
P(X = r) = k(2r − 1) for r = 1, 2, 3, 4, 5, 6.
(i) Copy and complete the following probability table and hence find the exact value of k, givingyour answer as a fraction in its simplest form. [3]
r 1 2 3 4 5 6
P(X = r) k 11k
(ii) Find the mean of X. [2]
A fair six-sided die is rolled three times.
(iii) Find the probability that the total score is 16. [3]
5 Each day the probability that Ashwin wears a tie is 0.2. The probability that he wears a jacket is 0.4.If he wears a jacket, the probability that he wears a tie is 0.3.
(i) Find the probability that, on a randomly selected day, Ashwin wears a jacket and a tie. [2]
(ii) Draw a Venn diagram, using one circle for the event ‘wears a jacket’ and one circle for the event‘wears a tie’. Your diagram should include the probability for each region. [3]
(iii) Using your Venn diagram, or otherwise, find the probability that, on a randomly selected day,Ashwin
(A) wears either a jacket or a tie (or both),
(B) wears no tie or no jacket (or wears neither). [3]
© OCR 2007 4766/01 Jan07 [Turn over
PMT

4
Section B (36 marks)
6 The birth weights in grams of a random sample of 1000 babies are displayed in the cumulativefrequency diagram below.
(i) Use the diagram to estimate the median and interquartile range of the data. [3]
(ii) Use your answers to part (i) to estimate the number of outliers in the sample. [4]
(iii) Should these outliers be excluded from any further analysis? Briefly explain your answer. [2]
(iv) Any baby whose weight is below the 10th percentile is selected for careful monitoring. Use thediagram to determine the range of weights of the babies who are selected. [2]
12% of new-born babies require some form of special care. A maternity unit has 17 new-born babies.You may assume that these 17 babies form an independent random sample.
(v) Find the probability that
(A) exactly 2 of these 17 babies require special care, [3]
(B) more than 2 of the 17 babies require special care. [3]
(vi) On 100 independent occasions the unit has 17 babies. Find the expected number of occasions onwhich there would be more than 2 babies who require special care. [1]
© OCR 2007 4766/01 Jan07
PMT

5
7 When onion seeds are sown outdoors, on average two-thirds of them germinate. A gardener sowsseeds in pairs, in the hope that at least one will germinate.
(i) Assuming that germination of one of the seeds in a pair is independent of germination of theother seed, find the probability that, if a pair of seeds is selected at random,
(A) both seeds germinate,
(B) just one seed germinates,
(C) neither seed germinates. [3]
(ii) Explain why the assumption of independence is necessary in order to calculate the aboveprobabilities. Comment on whether the assumption is likely to be valid. [2]
(iii) A pair of seeds is sown. Find the expectation and variance of the number of seeds in the pairwhich germinate. [3]
(iv) The gardener plants 200 pairs of seeds. If both seeds in a pair germinate, the gardener destroysone of the two plants so that only one is left to grow. Of the plants that remain after this, only85% successfully grow to form an onion. Find the expected number of onions grown from the200 pairs of seeds. [3]
If the seeds are sown in a greenhouse, the germination rate is higher. The seed manufacturing companyclaims that the germination rate is 90%. The gardener suspects that the rate will not be as high as this,and carries out a trial to investigate. 18 randomly selected seeds are sown in the greenhouse and it isfound that 14 germinate.
(v) Write down suitable hypotheses and carry out a test at the 5% level to determine whether thereis any evidence to support the gardener’s suspicions. [7]
© OCR 2007 4766/01 Jan07
PMT

ADVANCED SUBSIDIARY GCE UNIT G241/01MEI STATISTICS
Statistics 1 (Z1)
TUESDAY 5 JUNE 2007 Afternoon
Time: 1 hour 30 minutesAdditional Materials:
Answer booklet (8 pages)Graph paperMEI Examination Formulae and Tables (MF2)
INSTRUCTIONS TO CANDIDATES
• Write your name, centre number and candidate number in the spaces provided on the answer booklet.
• Answer all the questions.
• You are permitted to use a graphical calculator in this paper.
• Final answers should be given to a degree of accuracy appropriate to the context.
INFORMATION FOR CANDIDATES
• The number of marks is given in brackets [ ] at the end of each question or part question.
• The total number of marks for this paper is 72.
ADVICE TO CANDIDATES
• Read each question carefully and make sure you know what you have to do before starting your answer.
• You are advised that an answer may receive no marks unless you show sufficient detail of the working toindicate that a correct method is being used.
This document consists of 7 printed pages and 1 blank page.
© OCR 2007 [A/100/3618] OCR is an exempt Charity [Turn over
PMT

2
Section A (36 marks)
1 A girl is choosing tracks from an album to play at her birthday party. The album has 8 tracks and sheselects 4 of them.
(i) In how many ways can she select the 4 tracks? [2]
(ii) In how many different orders can she arrange the 4 tracks once she has chosen them? [1]
2 The histogram shows the amount of money, in pounds, spent by the customers at a supermarket on aparticular day.
(i) Express the data in the form of a grouped frequency table. [2]
(ii) Use your table to estimate the total amount of money spent by customers on that day. [2]
3 The marks x scored by a sample of 56 students in an examination are summarised by
n = 56, Σ x = 3026, Σ x2 = 178 890.
(i) Calculate the mean and standard deviation of the marks. [3]
(ii) The highest mark scored by any of the 56 students in the examination was 93. Show that thisresult may be considered to be an outlier. [2]
(iii) The formula y = 1.2x − 10 is used to scale the marks. Find the mean and standard deviation ofthe scaled marks. [3]
© OCR 2007 G241/01 Jun07
PMT

3
4 A local council has introduced a recycling scheme for aluminium, paper and kitchen waste. 50 residentsare asked which of these materials they recycle. The numbers of people who recycle each type ofmaterial are shown in the Venn diagram.
One of the residents is selected at random.
(i) Find the probability that this resident recycles
(A) at least one of the materials, [1]
(B) exactly one of the materials. [2]
(ii) Given that the resident recycles aluminium, find the probability that this resident does not recyclepaper. [2]
Two residents are selected at random.
(iii) Find the probability that exactly one of them recycles kitchen waste. [3]
© OCR 2007 G241/01 Jun07 [Turn over
PMT

4
5 A GCSE geography student is investigating a claim that global warming is causing summers in Britainto have more rainfall. He collects rainfall data from a local weather station for 2001 and 2006. Thevertical line chart shows the number of days per week on which some rainfall was recorded during the22 weeks of summer 2001.
(i) Show that the median of the data is 4, and find the interquartile range. [3]
(ii) For summer 2006 the median is 3 and the interquartile range is also 3. The student concludesthat the data demonstrate that global warming is causing summer rainfall to decrease rather thanincrease. Is this a valid conclusion from the data? Give two brief reasons to justify your answer.
[3]
6 In a phone-in competition run by a local radio station, listeners are given the names of 7 localpersonalities and are told that 4 of them are in the studio. Competitors phone in and guess which 4are in the studio.
(i) Show that the probability that a randomly selected competitor guesses all 4 correctly is 135
. [2]
Let X represent the number of correct guesses made by a randomly selected competitor. The probabilitydistribution of X is shown in the table.
r 0 1 2 3 4
P(X = r) 0 435
1835
1235
135
(ii) Find the expectation and variance of X. [5]
© OCR 2007 G241/01 Jun07
PMT

5
Section B (36 marks)
7 A screening test for a particular disease is applied to everyone in a large population. The test classifiespeople into three groups: ‘positive’, ‘doubtful’ and ‘negative’. Of the population, 3% is classified aspositive, 6% as doubtful and the rest negative.
In fact, of the people who test positive, only 95% have the disease. Of the people who test doubtful,10% have the disease. Of the people who test negative, 1% actually have the disease.
People who do not have the disease are described as ‘clear’.
(i) Copy and complete the tree diagram to show this information. [4]
(ii) Find the probability that a randomly selected person tests negative and is clear. [2]
(iii) Find the probability that a randomly selected person has the disease. [3]
(iv) Find the probability that a randomly selected person tests negative given that the person has thedisease. [3]
(v) Comment briefly on what your answer to part (iv) indicates about the effectiveness of the screeningtest. [2]
Once the test has been carried out, those people who test doubtful are given a detailed medicalexamination. If a person has the disease the examination will correctly identify this in 98% of cases.If a person is clear, the examination will always correctly identify this.
(vi) A person is selected at random. Find the probability that this person either tests negative originallyor tests doubtful and is then cleared in the detailed medical examination. [4]
© OCR 2007 G241/01 Jun07 [Turn over
PMT

6
8 A multinational accountancy firm receives a large number of job applications from graduates eachyear. On average 20% of applicants are successful.
A researcher in the human resources department of the firm selects a random sample of 17 graduateapplicants.
(i) Find the probability that at least 4 of the 17 applicants are successful. [3]
(ii) Find the expected number of successful applicants in the sample. [2]
(iii) Find the most likely number of successful applicants in the sample, justifying your answer. [3]
It is suggested that mathematics graduates are more likely to be successful than those from other fields.In order to test this suggestion, the researcher decides to select a new random sample of 17 mathematicsgraduate applicants. The researcher then carries out a hypothesis test at the 5% significance level.
(iv) (A) Write down suitable null and alternative hypotheses for the test.
(B) Give a reason for your choice of the alternative hypothesis. [4]
(v) Find the critical region for the test at the 5% level, showing all of your calculations. [4]
(vi) Explain why the critical region found in part (v) would be unaltered if a 10% significance levelwere used. [2]
© OCR 2007 G241/01 Jun07
PMT
ADVANCED SUBSIDIARY GCE 4766/01MATHEMATICS (MEI)
Statistics 1
TUESDAY 15 JANUARY 2008 Morning
Time: 1 hour 30 minutesAdditional materials: Answer Booklet (8 pages)
Graph paperMEI Examination Formulae and Tables (MF2)
INSTRUCTIONS TO CANDIDATES
• Write your name in capital letters, your Centre Number and Candidate Number in the spacesprovided on the Answer Booklet.
• Read each question carefully and make sure you know what you have to do before startingyour answer.
• Answer all the questions.
• You are permitted to use a graphical calculator in this paper.
• Final answers should be given to a degree of accuracy appropriate to the context.
INFORMATION FOR CANDIDATES
• The number of marks is given in brackets [ ] at the end of each question or part question.
• The total number of marks for this paper is 72.
• You are advised that an answer may receive no marks unless you show sufficient detail of theworking to indicate that a correct method is being used.
This document consists of 4 printed pages.
© OCR 2008 [H/102/2650] OCR is an exempt Charity [Turn over
PMT

2
Section A (36 marks)
1 Alice carries out a survey of the 28 students in her class to find how many text messages each sent onthe previous day. Her results are shown in the stem and leaf diagram.
0 0 0 1 1 3 5 7 7 7 8 81 0 1 2 3 3 4 4 6 92 0 1 3 3 73 5 745 8
Key: 2 3 represents 23
(i) Find the mode and median of the number of text messages. [2]
(ii) Identify the type of skewness of the distribution. [1]
(iii) Alice is considering whether to use the mean or the median as a measure of central tendency forthese data.
(A) In view of the skewness of the distribution, state whether Alice should choose the mean orthe median. [1]
(B) What other feature of the distribution confirms Alice’s choice? [1]
(iv) The mean number of text messages is 14.75. If each message costs 10 pence, find the total costof all of these messages. [2]
2 Codes of three letters are made up using only the letters A, C, T, G. Find how many different codesare possible
(i) if all three letters used must be different, [3]
(ii) if letters may be repeated. [2]
3 Steve is going on holiday. The probability that he is delayed on his outward flight is 0.3. Theprobability that he is delayed on his return flight is 0.2, independently of whether or not he is delayedon the outward flight.
(i) Find the probability that Steve is delayed on his outward flight but not on his return flight. [2]
(ii) Find the probability that he is delayed on at least one of the two flights. [3]
(iii) Given that he is delayed on at least one flight, find the probability that he is delayed on bothflights. [3]
© OCR 2008 4766/01 Jan08
PMT

3
4 A company is searching for oil reserves. The company has purchased the rights to make test drillingsat four sites. It investigates these sites one at a time but, if oil is found, it does not proceed to anyfurther sites. At each site, there is probability 0.2 of finding oil, independently of all other sites.
The random variable X represents the number of sites investigated. The probability distribution of Xis shown below.
r 1 2 3 4
P(X = r) 0.2 0.16 0.128 0.512
(i) Find the expectation and variance of X. [5]
(ii) It costs £45 000 to investigate each site. Find the expected total cost of the investigation. [1]
(iii) Draw a suitable diagram to illustrate the distribution of X. [2]
5 Sophie and James are having a tennis competition. The winner of the competition is the first to win2 matches in a row. If the competition has not been decided after 5 matches, then the player who haswon more matches is declared the winner of the competition.
For example, the following sequences are two ways in which Sophie could win the competition.(S represents a match won by Sophie; J represents a match won by James.)
SJSS SJSJS
(i) Explain why the sequence SSJ is not possible. [1]
(ii) Write down the other three possible sequences in which Sophie wins the competition. [3]
(iii) The probability that Sophie wins a match is 0.7. Find the probability that she wins the competitionin no more than 4 matches. [4]
© OCR 2008 4766/01 Jan08 [Turn over
PMT

4
Section B (36 marks)
6 The maximum temperatures x degrees Celsius recorded during each month of 2005 in Cambridge aregiven in the table below.
Jan Feb Mar Apr May Jun Jul Aug Sep Oct Nov Dec
9.2 7.1 10.7 14.2 16.6 21.8 22.0 22.6 21.1 17.4 10.1 7.8
These data are summarised by n = 12, Σ x = 180.6, Σ x2 = 3107.56.
(i) Calculate the mean and standard deviation of the data. [3]
(ii) Determine whether there are any outliers. [3]
(iii) The formula y = 1.8x + 32 is used to convert degrees Celsius to degrees Fahrenheit. Find themean and standard deviation of the 2005 maximum temperatures in degrees Fahrenheit. [3]
(iv) In New York, the monthly maximum temperatures are recorded in degrees Fahrenheit. In 2005the mean was 63.7 and the standard deviation was 16.0. Briefly compare the maximum monthlytemperatures in Cambridge and New York in 2005. [2]
The total numbers of hours of sunshine recorded in Cambridge during the month of January for eachof the last 48 years are summarised below.
Hours h 70 ≤ h < 100 100 ≤ h < 110 110 ≤ h < 120 120 ≤ h < 150 150 ≤ h < 170 170 ≤ h < 190
Number of years 6 8 10 11 10 3
(v) Draw a cumulative frequency graph for these data. [5]
(vi) Use your graph to estimate the 90th percentile. [2]
7 A particular product is made from human blood given by donors. The product is stored in bags. Theproduction process is such that, on average, 5% of bags are faulty. Each bag is carefully tested beforeuse.
(i) 12 bags are selected at random.
(A) Find the probability that exactly one bag is faulty. [3]
(B) Find the probability that at least two bags are faulty. [2]
(C) Find the expected number of faulty bags in the sample. [2]
(ii) A random sample of n bags is selected. The production manager wishes there to be a probabilityof one third or less of finding any faulty bags in the sample. Find the maximum possible valueof n, showing your working clearly. [3]
(iii) A scientist believes that a new production process will reduce the proportion of faulty bags.A random sample of 60 bags made using the new process is checked and one bag is found tobe faulty. Write down suitable hypotheses and carry out a hypothesis test at the 10% level todetermine whether there is evidence to suggest that the scientist is correct. [8]
Permission to reproduce items where third-party owned material protected by copyright is included has been sought and cleared where possible. Every reasonableeffort has been made by the publisher (OCR) to trace copyright holders, but if any items requiring clearance have unwittingly been included, the publisher will bepleased to make amends at the earliest possible opportunity.
OCR is part of the Cambridge Assessment Group. Cambridge Assessment is the brand name of University of Cambridge Local Examinations Syndicate (UCLES),which is itself a department of the University of Cambridge.
© OCR 2008 4766/01 Jan08
PMT
ADVANCED SUBSIDIARY GCE 4766/01MATHEMATICS (MEI)
Statistics 1
FRIDAY 6 JUNE 2008 Afternoon
Time: 1 hour 30 minutes
Additional materials (enclosed): None
Additional materials (required):Answer Booklet (8 pages)Graph paperMEI Examination Formulae and Tables (MF2)
INSTRUCTIONS TO CANDIDATES
• Write your name in capital letters, your Centre Number and Candidate Number in the spacesprovided on the Answer Booklet.
• Read each question carefully and make sure you know what you have to do before startingyour answer.
• Answer all the questions.
• You are permitted to use a graphical calculator in this paper.
• Final answers should be given to a degree of accuracy appropriate to the context.
INFORMATION FOR CANDIDATES
• The number of marks is given in brackets [ ] at the end of each question or part question.
• The total number of marks for this paper is 72.
• You are advised that an answer may receive no marks unless you show sufficient detail of theworking to indicate that a correct method is being used.
This document consists of 6 printed pages and 2 blank pages.
© OCR 2008 [H/102/2650] OCR is an exempt Charity [Turn over
PMT
2
Section A (36 marks)
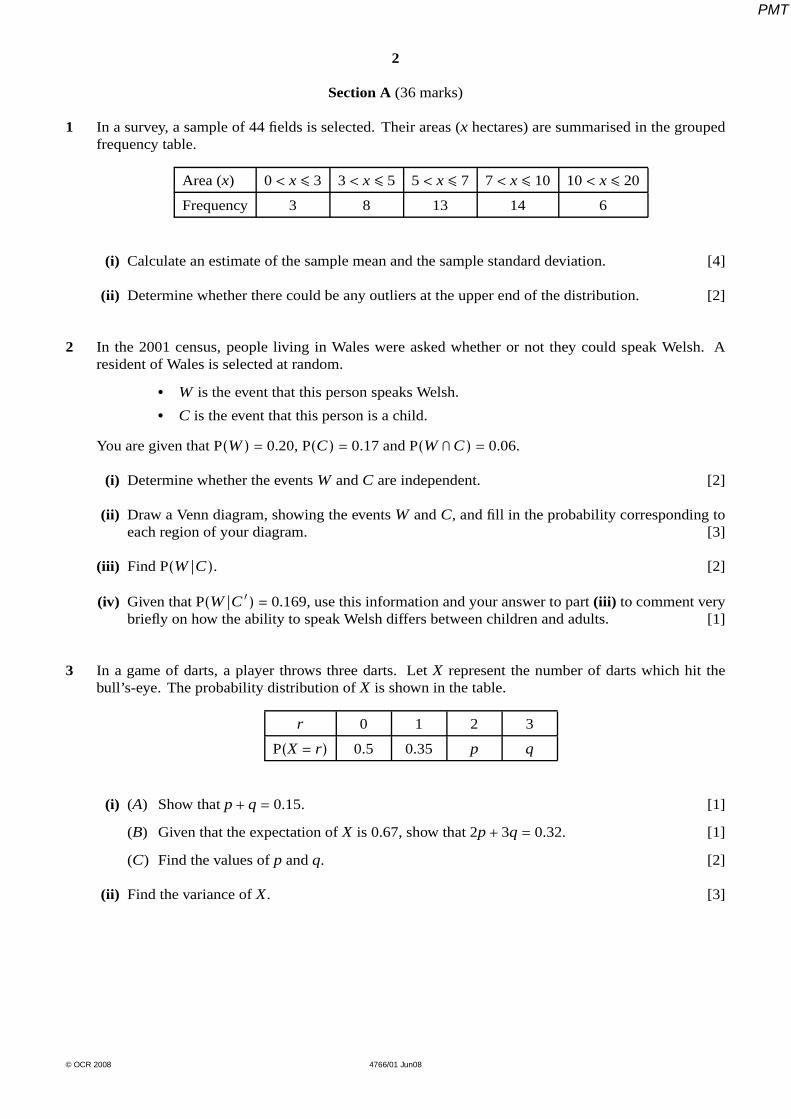
1 In a survey, a sample of 44 fields is selected. Their areas (x hectares) are summarised in the groupedfrequency table.
Area (x) 0 < x ≤ 3 3 < x ≤ 5 5 < x ≤ 7 7 < x ≤ 10 10 < x ≤ 20
Frequency 3 8 13 14 6
(i) Calculate an estimate of the sample mean and the sample standard deviation. [4]
(ii) Determine whether there could be any outliers at the upper end of the distribution. [2]
2 In the 2001 census, people living in Wales were asked whether or not they could speak Welsh. Aresident of Wales is selected at random.
• W is the event that this person speaks Welsh.
• C is the event that this person is a child.
You are given that P(W ) = 0.20, P(C) = 0.17 and P(W ∩ C) = 0.06.
(i) Determine whether the events W and C are independent. [2]
(ii) Draw a Venn diagram, showing the events W and C, and fill in the probability corresponding toeach region of your diagram. [3]
(iii) Find P(W |C). [2]
(iv) Given that P(W |C ′ ) = 0.169, use this information and your answer to part (iii) to comment verybriefly on how the ability to speak Welsh differs between children and adults. [1]
3 In a game of darts, a player throws three darts. Let X represent the number of darts which hit thebull’s-eye. The probability distribution of X is shown in the table.
r 0 1 2 3
P(X = r) 0.5 0.35 p q
(i) (A) Show that p + q = 0.15. [1]
(B) Given that the expectation of X is 0.67, show that 2p + 3q = 0.32. [1]
(C) Find the values of p and q. [2]
(ii) Find the variance of X. [3]
© OCR 2008 4766/01 Jun08
PMT

3
4 A small business has 8 workers. On a given day, the probability that any particular worker is off sickis 0.05, independently of the other workers.
(i) A day is selected at random. Find the probability that
(A) no workers are off sick, [2]
(B) more than one worker is off sick. [3]
(ii) There are 250 working days in a year. Find the expected number of days in the year on whichmore than one worker is off sick. [2]
5 A psychology student is investigating memory. In an experiment, volunteers are given 30 seconds totry to memorise a number of items. The items are then removed and the volunteers have to try toname all of them. It has been found that the probability that a volunteer names all of the items is 0.35.The student believes that this probability may be increased if the volunteers listen to the same pieceof music while memorising the items and while trying to name them.
The student selects 15 volunteers at random to do the experiment while listening to music. Of thesevolunteers, 8 name all of the items.
(i) Write down suitable hypotheses for a test to determine whether there is any evidence to supportthe student’s belief, giving a reason for your choice of alternative hypothesis. [4]
(ii) Carry out the test at the 5% significance level. [4]
© OCR 2008 4766/01 Jun08 [Turn over
PMT

4
Section B (36 marks)
6 In a large town, 79% of the population were born in England, 20% in the rest of the UK and theremaining 1% overseas. Two people are selected at random.
You may use the tree diagram below in answering this question.
England
England
England
England
Rest of UK Rest of UK
Rest of UK
Rest of UKOverseas
Overseas
Overseas
Overseas
0.79
0.79
0.79
0.79
0.20 0.20
0.20
0.20
0.01
0.01
0.01
0.01
First person Second person
(i) Find the probability that
(A) both of these people were born in the rest of the UK, [2]
(B) at least one of these people was born in England, [3]
(C) neither of these people was born overseas. [2]
(ii) Find the probability that both of these people were born in the rest of the UK given that neitherwas born overseas. [3]
(iii) (A) Five people are selected at random. Find the probability that at least one of them was notborn in England. [3]
(B) An interviewer selects n people at random. The interviewer wishes to ensure that theprobability that at least one of them was not born in England is more than 90%. Find theleast possible value of n. You must show working to justify your answer. [3]
© OCR 2008 4766/01 Jun08
PMT

5
7 The histogram shows the age distribution of people living in Inner London in 2001.
60
50
40
30
20
10
00 10 20 30 40 50 60 70 80 90 100
Age
Frequencydensity(thousands)
Data sourced from the 2001 Census,www.statistics.gov.uk
(i) State the type of skewness shown by the distribution. [1]
(ii) Use the histogram to estimate the number of people aged under 25. [3]
(iii) The table below shows the cumulative frequency distribution.
Age 20 30 40 50 65 100
Cumulative frequency (thousands) 660 1240 1810 a 2490 2770
(A) Use the histogram to find the value of a. [2]
(B) Use the table to calculate an estimate of the median age of these people. [3]
The ages of people living in Outer London in 2001 are summarised below.
Age (x years) 0 ≤ x < 20 20 ≤ x < 30 30 ≤ x < 40 40 ≤ x < 50 50 ≤ x < 65 65 ≤ x < 100
Frequency (thousands) 1120 650 770 590 680 610
(iv) Illustrate these data by means of a histogram. [5]
(v) Make two brief comments on the differences between the age distributions of the populations ofInner London and Outer London. [2]
(vi) The data given in the table for Outer London are used to calculate the following estimates.
Mean 38.5, median 35.7, midrange 50, standard deviation 23.7, interquartile range 34.4.
The final group in the table assumes that the maximum age of any resident is 100 years. Theseestimates are to be recalculated, based on a maximum age of 105, rather than 100. For each ofthe five estimates, state whether it would increase, decrease or be unchanged. [4]
© OCR 2008 4766/01 Jun08
PMT

ADVANCED SUBSIDIARY GCE
MATHEMATICS (MEI) 4766Statistics 1
Candidates answer on the Answer Booklet
OCR Supplied Materials:
• 8 page Answer Booklet
• Graph paper• MEI Examination Formulae and Tables (MF2)
Other Materials Required:
None
Monday 19 January 2009
Afternoon
Duration: 1 hour 30 minutes
**
44
77
66
66
**
INSTRUCTIONS TO CANDIDATES
• Write your name clearly in capital letters, your Centre Number and Candidate Number in the spaces providedon the Answer Booklet.
• Use black ink. Pencil may be used for graphs and diagrams only.
• Read each question carefully and make sure that you know what you have to do before starting your answer.• Answer all the questions.• Do not write in the bar codes.• You are permitted to use a graphical calculator in this paper.
• Final answers should be given to a degree of accuracy appropriate to the context.
INFORMATION FOR CANDIDATES
• The number of marks is given in brackets [ ] at the end of each question or part question.• You are advised that an answer may receive no marks unless you show sufficient detail of the working to
indicate that a correct method is being used.
• The total number of marks for this paper is 72.• This document consists of 8 pages. Any blank pages are indicated.
© OCR 2009 [H/102/2650] OCR is an exempt Charity
4R–8F10 Turn over
PMT

2
Section A (36 marks)
1 A supermarket chain buys a batch of 10 000 scratchcard draw tickets for sale in its stores. 50 of these
tickets have a £10 prize, 20 of them have a £100 prize, one of them has a £5000 prize and all of the
rest have no prize. This information is summarised in the frequency table below.
Prize money £0 £10 £100 £5000
Frequency 9929 50 20 1
(i) Find the mean and standard deviation of the prize money per ticket. [4]
(ii) I buy two of these tickets at random. Find the probability that I win either two £10 prizes or two
£100 prizes. [3]
2 Thomas has six tiles, each with a different letter of his name on it.
(i) Thomas arranges these letters in a random order. Find the probability that he arranges them in
the correct order to spell his name. [2]
(ii) On another occasion, Thomas picks three of the six letters at random. Find the probability that
he picks the letters T, O and M (in any order). [3]
3 A zoologist is studying the feeding behaviour of a group of 4 gorillas. The random variable X
represents the number of gorillas that are feeding at a randomly chosen moment. The probability
distribution of X is shown in the table below.
r 0 1 2 3 4
P(X = r) p 0.1 0.05 0.05 0.25
(i) Find the value of p. [1]
(ii) Find the expectation and variance of X. [5]
(iii) The zoologist observes the gorillas on two further occasions. Find the probability that there are
at least two gorillas feeding on both occasions. [2]
4 A pottery manufacturer makes teapots in batches of 50. On average 3% of teapots are faulty.
(i) Find the probability that in a batch of 50 there is
(A) exactly one faulty teapot, [3]
(B) more than one faulty teapot. [3]
(ii) The manufacturer produces 240 batches of 50 teapots during one month. Find the expected
number of batches which contain exactly one faulty teapot. [2]
© OCR 2009 4766 Jan09
PMT

3
5 Each day Anna drives to work.
• R is the event that it is raining.
• L is the event that Anna arrives at work late.
You are given that P(R) = 0.36, P(L) = 0.25 and P(R ∩ L) = 0.2.
(i) Determine whether the events R and L are independent. [2]
(ii) Draw a Venn diagram showing the events R and L. Fill in the probability corresponding to each
of the four regions of your diagram. [3]
(iii) Find P(L |R). State what this probability represents. [3]
[Question 6 is printed overleaf.]
© OCR 2009 4766 Jan09
PMT

4
Section B (36 marks)
6 The temperature of a supermarket fridge is regularly checked to ensure that it is working correctly.
Over a period of three months the temperature (measured in degrees Celsius) is checked 600 times.
These temperatures are displayed in the cumulative frequency diagram below.
3.0 3.2 3.4 3.6 3.8 4.0 4.2 4.4 4.6 4.8 5.00
100
200
300
400
500
600
Temperature (degrees Celsius)
Cum
ula
tive
freq
uen
cy
(i) Use the diagram to estimate the median and interquartile range of the data. [3]
(ii) Use your answers to part (i) to show that there are very few, if any, outliers in the sample. [4]
(iii) Suppose that an outlier is identified in these data. Discuss whether it should be excluded from
any further analysis. [2]
(iv) Copy and complete the frequency table below for these data. [3]
Temperature
(t degrees Celsius) 3.0 ≤ t ≤ 3.4 3.4 < t ≤ 3.8 3.8 < t ≤ 4.2 4.2 < t ≤ 4.6 4.6 < t ≤ 5.0
Frequency 243 157
(v) Use your table to calculate an estimate of the mean. [2]
(vi) The standard deviation of the temperatures in degrees Celsius is 0.379. The temperatures are
converted from degrees Celsius into degrees Fahrenheit using the formula F = 1.8C + 32. Hence
estimate the mean and find the standard deviation of the temperatures in degrees Fahrenheit. [3]
© OCR 2009 4766 Jan09
PMT

5
7 An online shopping company takes orders through its website. On average 80% of orders from the
website are delivered within 24 hours. The quality controller selects 10 orders at random to check
when they are delivered.
(i) Find the probability that
(A) exactly 8 of these orders are delivered within 24 hours, [3]
(B) at least 8 of these orders are delivered within 24 hours. [2]
The company changes its delivery method. The quality controller suspects that the changes will mean
that fewer than 80% of orders will be delivered within 24 hours. A random sample of 18 orders is
checked and it is found that 12 of them arrive within 24 hours.
(ii) Write down suitable hypotheses and carry out a test at the 5% significance level to determine
whether there is any evidence to support the quality controller’s suspicion. [7]
(iii) A statistician argues that it is possible that the new method could result in either better or worse
delivery times. Therefore it would be better to carry out a 2-tail test at the 5% significance level.
State the alternative hypothesis for this test. Assuming that the sample size is still 18, find the
critical region for this test, showing all of your calculations. [7]
© OCR 2009 4766 Jan09
PMT

ADVANCED SUBSIDIARY GCE
MATHEMATICS (MEI) 4766Statistics 1
Candidates answer on the Answer Booklet
OCR Supplied Materials:
• 8 page Answer Booklet• Graph paper
• MEI Examination Formulae and Tables (MF2)
Other Materials Required:
None
Monday 15 June 2009
Afternoon
Duration: 1 hour 30 minutes
**
44
77
66
66
**
INSTRUCTIONS TO CANDIDATES
• Write your name clearly in capital letters, your Centre Number and Candidate Number in the spaces providedon the Answer Booklet.
• Use black ink. Pencil may be used for graphs and diagrams only.
• Read each question carefully and make sure that you know what you have to do before starting your answer.• Answer all the questions.• Do not write in the bar codes.• You are permitted to use a graphical calculator in this paper.
• Final answers should be given to a degree of accuracy appropriate to the context.
INFORMATION FOR CANDIDATES
• The number of marks is given in brackets [ ] at the end of each question or part question.• You are advised that an answer may receive no marks unless you show sufficient detail of the working to
indicate that a correct method is being used.
• The total number of marks for this paper is 72.• This document consists of 8 pages. Any blank pages are indicated.
© OCR 2009 [H/102/2650] OCR is an exempt Charity
5R–8K22 Turn over
PMT

2
Section A (36 marks)
1 In a traffic survey, the number of people in each car passing the survey point is recorded. The results
are given in the following frequency table.
Number of people 1 2 3 4
Frequency 50 31 16 5
(i) Write down the median and mode of these data. [2]
(ii) Draw a vertical line diagram for these data. [2]
(iii) State the type of skewness of the distribution. [1]
2 There are 14 girls and 11 boys in a class. A quiz team of 5 students is to be chosen from the class.
(i) How many different teams are possible? [2]
(ii) If the team must include 3 girls and 2 boys, find how many different teams are possible. [3]
3 Dwayne is a car salesman. The numbers of cars, x, sold by Dwayne each month during the year 2008
are summarised by
n = 12, Σ x = 126, Σ x2 = 1582.
(i) Calculate the mean and standard deviation of the monthly numbers of cars sold. [3]
(ii) Dwayne earns £500 each month plus £100 commission for each car sold. Show that the mean
of Dwayne’s monthly earnings is £1550. Find the standard deviation of Dwayne’s monthly
earnings. [3]
(iii) Marlene is a car saleswoman and is paid in the same way as Dwayne. During 2008 her monthly
earnings have mean £1625 and standard deviation £280. Briefly compare the monthly numbers
of cars sold by Marlene and Dwayne during 2008. [2]
4 The table shows the probability distribution of the random variable X.
r 10 20 30 40
P(X = r) 0.2 0.3 0.3 0.2
(i) Explain why E(X) = 25. [1]
(ii) Calculate Var(X). [3]
© OCR 2009 4766 Jun09
PMT

3
5 The frequency table below shows the distance travelled by 1200 visitors to a particular UK tourist
destination in August 2008.
Distance (d miles) 0 ≤ d < 50 50 ≤ d < 100 100 ≤ d < 200 200 ≤ d < 400
Frequency 360 400 307 133
(i) Draw a histogram on graph paper to illustrate these data. [5]
(ii) Calculate an estimate of the median distance. [3]
6 Whitefly, blight and mosaic virus are three problems which can affect tomato plants. 100 tomato
plants are examined for these problems. The numbers of plants with each type of problem are shown
in the Venn diagram. 47 of the plants have none of the problems.
Whitefly Blight
Mosaic virus
28 10 3
4
2 1
547
(i) One of the 100 plants is selected at random. Find the probability that this plant has
(A) at most one of the problems, [1]
(B) exactly two of the problems. [2]
(ii) Three of the 100 plants are selected at random. Find the probability that all of them have at least
one of the problems. [3]
© OCR 2009 4766 Jun09 Turn over
PMT

4
Section B (36 marks)
7 Laura frequently flies to business meetings and often finds that her flights are delayed. A flight may
be delayed due to technical problems, weather problems or congestion problems, with probabilities
0.2, 0.15 and 0.1 respectively. The tree diagram shows this information.
0.1
c
Congestion Problem
No Congestion Problem
0.1
c
Congestion Problem
No Congestion Problem
0.1
c
Congestion Problem
No Congestion Problem
0.1
c
Congestion Problem
No Congestion Problem
Weather Problem
No Weather Problem
0.15
b
Weather Problem
No Weather Problem
0.15
b
Technical Problem
No Technical Problem
0.2
a
(i) Write down the values of the probabilities a, b and c shown in the tree diagram. [2]
One of Laura’s flights is selected at random.
(ii) Find the probability that Laura’s flight is not delayed and hence write down the probability that
it is delayed. [4]
(iii) Find the probability that Laura’s flight is delayed due to just one of the three problems. [4]
(iv) Given that Laura’s flight is delayed, find the probability that the delay is due to just one of the
three problems. [3]
(v) Given that Laura’s flight has no technical problems, find the probability that it is delayed. [3]
(vi) In a particular year, Laura has 110 flights. Find the expected number of flights that are delayed.
[2]
© OCR 2009 4766 Jun09
PMT

5
8 The Department of Health ‘eat five a day’ advice recommends that people should eat at least five
portions of fruit and vegetables per day. In a particular school, 20% of pupils eat at least five a day.
(i) 15 children are selected at random.
(A) Find the probability that exactly 3 of them eat at least five a day. [3]
(B) Find the probability that at least 3 of them eat at least five a day. [3]
(C) Find the expected number who eat at least five a day. [2]
A programme is introduced to encourage children to eat more portions of fruit and vegetables per day.
At the end of this programme, the diets of a random sample of 15 children are analysed. A hypothesis
test is carried out to examine whether the proportion of children in the school who eat at least five a
day has increased.
(ii) (A) Write down suitable null and alternative hypotheses for the test.
(B) Give a reason for your choice of the alternative hypothesis. [4]
(iii) Find the critical region for the test at the 10% significance level, showing all of your calculations.
Hence complete the test, given that 7 of the 15 children eat at least five a day. [6]
© OCR 2009 4766 Jun09
PMT

ADVANCED SUBSIDIARY GCE
MATHEMATICS (MEI) 4766Statistics 1
Candidates answer on the Answer Booklet
OCR Supplied Materials:
• 8 page Answer Booklet• Graph paper• MEI Examination Formulae and Tables (MF2)
Other Materials Required:None
Monday 25 January 2010
Morning
Duration: 1 hour 30 minutes
**
44
77
66
66
**
INSTRUCTIONS TO CANDIDATES
• Write your name clearly in capital letters, your Centre Number and Candidate Number in the spaces provided
on the Answer Booklet.• Use black ink. Pencil may be used for graphs and diagrams only.• Read each question carefully and make sure that you know what you have to do before starting your answer.• Answer all the questions.
• Do not write in the bar codes.• You are permitted to use a graphical calculator in this paper.• Final answers should be given to a degree of accuracy appropriate to the context.
INFORMATION FOR CANDIDATES
• The number of marks is given in brackets [ ] at the end of each question or part question.
• You are advised that an answer may receive no marks unless you show sufficient detail of the working toindicate that a correct method is being used.
• The total number of marks for this paper is 72.• This document consists of 8 pages. Any blank pages are indicated.
© OCR 2010 [H/102/2650] OCR is an exempt Charity
RP–9E16 Turn over
PMT

2
Section A (36 marks)
1 A camera records the speeds in miles per hour of 15 vehicles on a motorway. The speeds are given
below.
73 67 75 64 52 63 75 81 77 72 68 74 79 72 71
(i) Construct a sorted stem and leaf diagram to represent these data, taking stem values of 50, 60, … .
[4]
(ii) Write down the median and midrange of the data. [2]
(iii) Which of the median and midrange would you recommend to measure the central tendency of
the data? Briefly explain your answer. [2]
2 In her purse, Katharine has two £5 notes, two £10 notes and one £20 note. She decides to select two
of these notes at random to donate to a charity. The total value of these two notes is denoted by the
random variable £X.
(i) (A) Show that P(X = 10) = 0.1. [1]
(B) Show that P(X = 30) = 0.2. [2]
The table shows the probability distribution of X.
r 10 15 20 25 30
P(X = r) 0.1 0.4 0.1 0.2 0.2
(ii) Find E(X) and Var(X). [5]
3 In a survey, a large number of young people are asked about their exercise habits. One of these people
is selected at random.
• G is the event that this person goes to the gym.
• R is the event that this person goes running.
You are given that P(G) = 0.24, P(R) = 0.13 and P(G ∩ R) = 0.06.
(i) Draw a Venn diagram, showing the events G and R, and fill in the probability corresponding to
each of the four regions of your diagram. [3]
(ii) Determine whether the events G and R are independent. [2]
(iii) Find P(R | G). [3]
© OCR 2010 4766 Jan10
PMT

3
4 In a multiple-choice test there are 30 questions. For each question, there is a 60% chance that a
randomly selected student answers correctly, independently of all other questions.
(i) Find the probability that a randomly selected student gets a total of exactly 20 questions correct.
[3]
(ii) If 100 randomly selected students take the test, find the expected number of students who get
exactly 20 questions correct. [2]
5 My credit card has a 4-digit code called a PIN. You should assume that any 4-digit number from 0000
to 9999 can be a PIN.
(i) If I cannot remember any digits and guess my number, find the probability that I guess it correctly.
[1]
In fact my PIN consists of four different digits. I can remember all four digits, but cannot remember
the correct order.
(ii) If I now guess my number, find the probability that I guess it correctly. [2]
6 Three prizes, one for English, one for French and one for Spanish, are to be awarded in a class of
20 students.
Find the number of different ways in which the three prizes can be awarded if
(i) no student may win more than 1 prize, [2]
(ii) no student may win all 3 prizes. [2]
© OCR 2010 4766 Jan10 Turn over
PMT

4
Section B (36 marks)
7 A pear grower collects a random sample of 120 pears from his orchard. The histogram below shows
the lengths, in mm, of these pears.
0 60 70 80 90 1000
1
2
3
4
5
6
Length(mm)
Frequencydensity
(i) Calculate the number of pears which are between 90 and 100 mm long. [2]
(ii) Calculate an estimate of the mean length of the pears. Explain why your answer is only an
estimate. [4]
(iii) Calculate an estimate of the standard deviation. [3]
(iv) Use your answers to parts (ii) and (iii) to investigate whether there are any outliers. [4]
(v) Name the type of skewness of the distribution. [1]
(vi) Illustrate the data using a cumulative frequency diagram. [5]
© OCR 2010 4766 Jan10
PMT
5
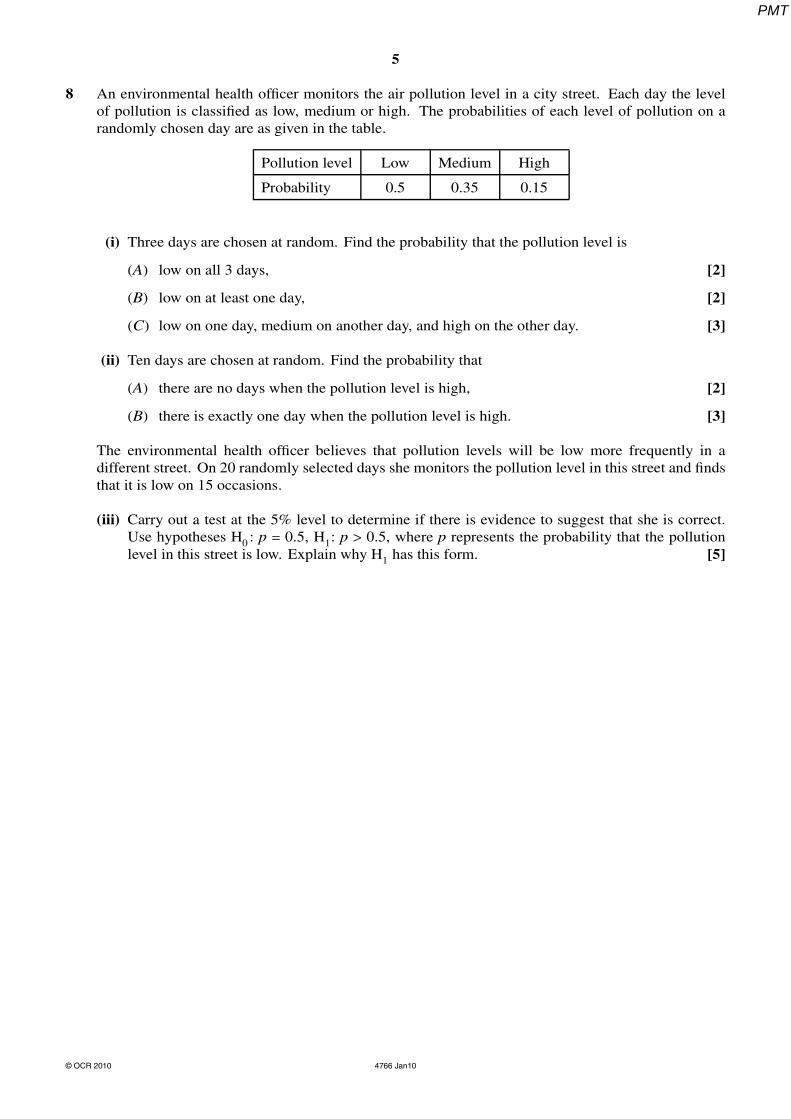
8 An environmental health officer monitors the air pollution level in a city street. Each day the level
of pollution is classified as low, medium or high. The probabilities of each level of pollution on a
randomly chosen day are as given in the table.
Pollution level Low Medium High
Probability 0.5 0.35 0.15
(i) Three days are chosen at random. Find the probability that the pollution level is
(A) low on all 3 days, [2]
(B) low on at least one day, [2]
(C) low on one day, medium on another day, and high on the other day. [3]
(ii) Ten days are chosen at random. Find the probability that
(A) there are no days when the pollution level is high, [2]
(B) there is exactly one day when the pollution level is high. [3]
The environmental health officer believes that pollution levels will be low more frequently in a
different street. On 20 randomly selected days she monitors the pollution level in this street and finds
that it is low on 15 occasions.
(iii) Carry out a test at the 5% level to determine if there is evidence to suggest that she is correct.
Use hypotheses H0: p = 0.5, H
1: p > 0.5, where p represents the probability that the pollution
level in this street is low. Explain why H1
has this form. [5]
© OCR 2010 4766 Jan10
PMT

ADVANCED SUBSIDIARY GCE
MATHEMATICS (MEI) 4766Statistics 1
QUESTION PAPER
Candidates answer on the Printed Answer Book
OCR Supplied Materials:• Printed Answer Book 4766• MEI Examination Formulae and Tables (MF2)
Other Materials Required:• Scientific or graphical calculator
Friday 18 June 2010
Afternoon
Duration: 1 hour 30 minutes
INSTRUCTIONS TO CANDIDATES
These instructions are the same on the Printed Answer Book and the Question Paper.
• Write your name clearly in capital letters, your Centre Number and Candidate Number in the spaces provided
on the Printed Answer Book.• The questions are on the inserted Question Paper.• Write your answer to each question in the space provided in the Printed Answer Book. Additional paper
may be used if necessary but you must clearly show your Candidate Number, Centre Number and question
number(s).• Use black ink. Pencil may be used for graphs and diagrams only.• Read each question carefully and make sure that you know what you have to do before starting your answer.• Answer all the questions.
• Do not write in the bar codes.• You are permitted to use a graphical calculator in this paper.• Final answers should be given to a degree of accuracy appropriate to the context.
INFORMATION FOR CANDIDATES
This information is the same on the Printed Answer Book and the Question Paper.
• The number of marks is given in brackets [ ] at the end of each question or part question on the Question
Paper.• You are advised that an answer may receive no marks unless you show sufficient detail of the working to
indicate that a correct method is being used.• The total number of marks for this paper is 72.
• The Printed Answer Book consists of 12 pages. The Question Paper consists of 4 pages. Any blank pagesare indicated.
INSTRUCTION TO EXAMS OFFICER / INVIGILATOR
• Do not send this Question Paper for marking; it should be retained in the centre or destroyed.
© OCR 2010 [H/102/2650] OCR is an exempt Charity
3R–0B17 Turn over
PMT

2
Section A (36 marks)
1 A business analyst collects data about the distribution of hourly wages, in £, of shop-floor workers at
a factory. These data are illustrated in the box and whisker plot.
7 8 9 10 11 12 13 14 15 16 17 18
(i) Name the type of skewness of the distribution. [1]
(ii) Find the interquartile range and hence show that there are no outliers at the lower end of the
distribution, but there is at least one outlier at the upper end. [5]
(iii) Suggest possible reasons why this may be the case. [2]
2 The probability distribution of the random variable X is given by the formula
P(X = r) = kr(5 − r) for r = 1, 2, 3, 4.
(i) Show that k = 0.05. [2]
(ii) Find E(X) and Var(X). [5]
3 The lifetimes in hours of 90 components are summarised in the table.
Lifetime (x hours) 0 < x ≤ 20 20 < x ≤ 30 30 < x ≤ 50 50 < x ≤ 65 65 < x ≤ 100
Frequency 24 13 14 21 18
(i) Draw a histogram to illustrate these data. [5]
(ii) In which class interval does the median lie? Justify your answer. [2]
4 Each packet of Cruncho cereal contains one free fridge magnet. There are five different types of
fridge magnet to collect. They are distributed, with equal probability, randomly and independently in
the packets. Keith is about to start collecting these fridge magnets.
(i) Find the probability that the first 2 packets that Keith buys contain the same type of fridge magnet.
[2]
(ii) Find the probability that Keith collects all five types of fridge magnet by buying just 5 packets.
[3]
(iii) Hence find the probability that Keith has to buy more than 5 packets to acquire a complete set.
[1]
© OCR 2010 4766 Jun10
PMT

3
5 A retail analyst records the numbers of loaves of bread of a particular type bought by a sample of
shoppers in a supermarket.
Number of loaves 0 1 2 3 4 5
Frequency 37 23 11 3 0 1
(i) Calculate the mean and standard deviation of the numbers of loaves bought per person. [5]
(ii) Each loaf costs £1.04. Calculate the mean and standard deviation of the amount spent on loaves
per person. [3]
Section B (36 marks)
6 A manufacturer produces tiles. On average 10% of the tiles produced are faulty. Faulty tiles occur
randomly and independently.
A random sample of 18 tiles is selected.
(i) (A) Find the probability that there are exactly 2 faulty tiles in the sample. [3]
(B) Find the probability that there are more than 2 faulty tiles in the sample. [3]
(C) Find the expected number of faulty tiles in the sample. [2]
A cheaper way of producing the tiles is introduced. The manufacturer believes that this may increase
the proportion of faulty tiles. In order to check this, a random sample of 18 tiles produced using the
cheaper process is selected and a hypothesis test is carried out.
(ii) (A) Write down suitable null and alternative hypotheses for the test.
(B) Explain why the alternative hypothesis has the form that it does. [4]
(iii) Find the critical region for the test at the 5% level, showing all of your calculations. [4]
(iv) In fact there are 4 faulty tiles in the sample. Complete the test, stating your conclusion clearly.
[2]
7 One train leaves a station each hour. The train is either on time or late. If the train is on time, the
probability that the next train is on time is 0.95. If the train is late, the probability that the next train
is on time is 0.6. On a particular day, the 09 00 train is on time.
(i) Illustrate the possible outcomes for the 10 00, 11 00 and 12 00 trains on a probability tree diagram.
[4]
(ii) Find the probability that
(A) all three of these trains are on time, [2]
(B) just one of these three trains is on time, [4]
(C) the 12 00 train is on time. [4]
(iii) Given that the 12 00 train is on time, find the probability that the 10 00 train is also on time. [4]
© OCR 2010 4766 Jun10
PMT
4
3 (i) Write any calculations on page 5.
© OCR 2010
PMT

ADVANCED SUBSIDIARY GCE
MATHEMATICS (MEI) 4766Statistics 1
QUESTION PAPER
Candidates answer on the printed answer book.
OCR supplied materials:
• Printed answer book 4766• MEI Examination Formulae and Tables (MF2)
Other materials required:
• Scientific or graphical calculator
Monday 24 January 2011
Morning
Duration: 1 hour 30 minutes
INSTRUCTIONS TO CANDIDATES
These instructions are the same on the printed answer book and the question paper.
• The question paper will be found in the centre of the printed answer book.
• Write your name, centre number and candidate number in the spaces provided on the printedanswer book. Please write clearly and in capital letters.
• Write your answer to each question in the space provided in the printed answer book.Additional paper may be used if necessary but you must clearly show your candidate number,
centre number and question number(s).
• Use black ink. Pencil may be used for graphs and diagrams only.• Read each question carefully. Make sure you know what you have to do before starting your
answer.
• Answer all the questions.• Do not write in the bar codes.
• You are permitted to use a scientific or graphical calculator in this paper.• Final answers should be given to a degree of accuracy appropriate to the context.
INFORMATION FOR CANDIDATES
This information is the same on the printed answer book and the question paper.
• The number of marks is given in brackets [ ] at the end of each question or part question on the
question paper.• You are advised that an answer may receive no marks unless you show sufficient detail of the
working to indicate that a correct method is being used.
• The total number of marks for this paper is 72.• The printed answer book consists of 12 pages. The question paper consists of 8 pages. Any blank
pages are indicated.
INSTRUCTION TO EXAMS OFFICER / INVIGILATOR
• Do not send this question paper for marking; it should be retained in the centre or destroyed.
© OCR 2011 [H/102/2650] OCR is an exempt Charity
2R–0H28 Turn over
PMT

2
Section A (36 marks)
1 The stem and leaf diagram shows the weights, rounded to the nearest 10 grams, of 25 female iguanas.
8 3 9
9 3 5 6 6 6 8 9 9
10 0 2 2 3 4 6 9
11 2 4 7 8
12 3 4 5
13 2
Key: 11 2 represents 1120 grams
(i) Find the mode and the median of the data. [2]
(ii) Identify the type of skewness of the distribution. [1]
2 The table shows all the possible products of the scores on two fair four-sided dice.
Score on second die
1 2 3 4
1 1 2 3 4
2 2 4 6 8
3 3 6 9 12
Sco
reo
nfi
rst
die
4 4 8 12 16
(i) Find the probability that the product of the two scores is less than 10. [1]
(ii) Show that the events ‘the score on the first die is even’ and ‘the product of the scores on the two
dice is less than 10’ are not independent. [3]
3 There are 13 men and 10 women in a running club. A committee of 3 men and 3 women is to be
selected.
(i) In how many different ways can the three men be selected? [2]
(ii) In how many different ways can the whole committee be selected? [2]
(iii) A random sample of 6 people is selected from the running club. Find the probability that this
sample consists of 3 men and 3 women. [2]
© OCR 2011 4766 Jan11
PMT

3
4 The probability distribution of the random variable X is given by the formula
P(X = r) = kr(r + 1) for r = 1, 2, 3, 4, 5.
(i) Show that k = 170
. [2]
(ii) Find E(X) and Var(X). [5]
5 Andy can walk to work, travel by bike or travel by bus. The tree diagram shows the probabilities of
any day being dry or wet and the corresponding probabilities for each of Andy’s methods of travel.
Walk
Bike
Bus
0.5
0.4
0.1
Walk
Bike
Bus
0.20.4
0.6
0.1
0.7
Dry
Wet
A day is selected at random. Find the probability that
(i) the weather is wet and Andy travels by bus, [2]
(ii) Andy walks or travels by bike, [3]
(iii) the weather is dry given that Andy walks or travels by bike. [3]
© OCR 2011 4766 Jan11 Turn over
PMT

4
6 A survey is being carried out into the carbon footprint of individual citizens. As part of the survey,
100 citizens are asked whether they have attempted to reduce their carbon footprint by any of the
following methods.
• Reducing car use
• Insulating their homes
• Avoiding air travel
The numbers of citizens who have used each of these methods are shown in the Venn diagram.
Reducedcar use
Insulatedtheir homes
Avoidedair travel
1411
4
26
2 1
042
One of the citizens is selected at random.
(i) Find the probability that this citizen
(A) has avoided air travel, [1]
(B) has used at least two of the three methods. [2]
(ii) Given that the citizen has avoided air travel, find the probability that this citizen has reduced car
use. [2]
Three of the citizens are selected at random.
(iii) Find the probability that none of them have avoided air travel. [3]
© OCR 2011 4766 Jan11
PMT

5
Section B (36 marks)
7 The incomes of a sample of 918 households on an island are given in the table below.
Income0 ≤ x ≤ 20 20 < x ≤ 40 40 < x ≤ 60 60 < x ≤ 100 100 < x ≤ 200
(x thousand pounds)
Frequency 238 365 142 128 45
(i) Draw a histogram to illustrate the data. [5]
(ii) Calculate an estimate of the mean income. [3]
(iii) Calculate an estimate of the standard deviation of the incomes. [4]
(iv) Use your answers to parts (ii) and (iii) to show there are almost certainly some outliers in
the sample. Explain whether or not it would be appropriate to exclude the outliers from the
calculation of the mean and the standard deviation. [4]
(v) The incomes were converted into another currency using the formula y = 1.15x. Calculate
estimates of the mean and variance of the incomes in the new currency. [3]
8 Mark is playing solitaire on his computer. The probability that he wins a game is 0.2, independently
of all other games that he plays.
(i) Find the expected number of wins in 12 games. [2]
(ii) Find the probability that
(A) he wins exactly 2 out of the next 12 games that he plays, [3]
(B) he wins at least 2 out of the next 12 games that he plays. [3]
(iii) Mark’s friend Ali also plays solitaire. Ali claims that he is better at winning games than Mark. In
a random sample of 20 games played by Ali, he wins 7 of them. Write down suitable hypotheses
for a test at the 5% level to investigate whether Ali is correct. Give a reason for your choice of
alternative hypothesis. Carry out the test. [9]
© OCR 2011 4766 Jan11
PMT

ADVANCED SUBSIDIARY GCE
MATHEMATICS (MEI) 4766Statistics 1
QUESTION PAPER
Candidates answer on the printed answer book.
OCR supplied materials:
• Printed answer book 4766• MEI Examination Formulae and Tables (MF2)
Other materials required:
• Scientific or graphical calculator
Thursday 26 May 2011
Morning
Duration: 1 hour 30 minutes
INSTRUCTIONS TO CANDIDATES
These instructions are the same on the printed answer book and the question paper.
• The question paper will be found in the centre of the printed answer book.
• Write your name, centre number and candidate number in the spaces provided on the printedanswer book. Please write clearly and in capital letters.
• Write your answer to each question in the space provided in the printed answer book.Additional paper may be used if necessary but you must clearly show your candidate number,
centre number and question number(s).
• Use black ink. Pencil may be used for graphs and diagrams only.• Read each question carefully. Make sure you know what you have to do before starting your
answer.
• Answer all the questions.• Do not write in the bar codes.
• You are permitted to use a scientific or graphical calculator in this paper.• Final answers should be given to a degree of accuracy appropriate to the context.
INFORMATION FOR CANDIDATES
This information is the same on the printed answer book and the question paper.
• The number of marks is given in brackets [ ] at the end of each question or part question on the
question paper.• You are advised that an answer may receive no marks unless you show sufficient detail of the
working to indicate that a correct method is being used.
• The total number of marks for this paper is 72.• The printed answer book consists of 12 pages. The question paper consists of 4 pages. Any blank
pages are indicated.
INSTRUCTION TO EXAMS OFFICER / INVIGILATOR
• Do not send this question paper for marking; it should be retained in the centre or destroyed.
© OCR 2011 [H/102/2650] OCR is an exempt Charity
RP–0I24 Turn over
PMT

2
Section A (36 marks)
1 In the Paris-Roubaix cycling race, there are a number of sections of cobbled road. The lengths of
these sections, measured in metres, are illustrated in the histogram.
frequencydensity
length (m)0
0.002
0.004
0.006
0.008
0.010
0.012
0.014
0 1000 2000 3000 4000
(i) Find the number of sections which are between 1000 and 2000 metres in length. [2]
(ii) Name the type of skewness suggested by the histogram. [1]
(iii) State the minimum and maximum possible values of the midrange. [2]
2 I have 5 books, each by a different author. The authors are Austen, Bronte, Clarke, Dickens and Eliot.
(i) If I arrange the books in a random order on my bookshelf, find the probability that the authors
are in alphabetical order with Austen on the left. [2]
(ii) If I choose two of the books at random, find the probability that I choose the books written by
Austen and Bronte. [3]
3 25% of the plants of a particular species have red flowers. A random sample of 6 plants is selected.
(i) Find the probability that there are no plants with red flowers in the sample. [2]
(ii) If 50 random samples of 6 plants are selected, find the expected number of samples in which
there are no plants with red flowers. [2]
© OCR 2011 4766 Jun11
PMT

3
4 Two fair six-sided dice are thrown. The random variable X denotes the difference between the scores
on the two dice. The table shows the probability distribution of X.
r 0 1 2 3 4 5
P(X = r) 16
518
29
16
19
118
(i) Draw a vertical line chart to illustrate the probability distribution. [2]
(ii) Use a probability argument to show that
(A) P(X = 1) = 518
, [2]
(B) P(X = 0) = 16. [1]
(iii) Find the mean value of X. [2]
5 In a recent survey, a large number of working people were asked whether they worked full-time or
part-time, with part-time being defined as less than 25 hours per week. One of the respondents is
selected at random.
• W is the event that this person works part-time.
• F is the event that this person is female.
You are given that P(W) = 0.14, P(F) = 0.41 and P(W ∩ F) = 0.11.
(i) Draw a Venn diagram showing the events W and F, and fill in the probability corresponding to
each of the four regions of your diagram. [3]
(ii) Determine whether the events W and F are independent. [2]
(iii) Find P(W | F) and explain what this probability represents. [3]
6 The numbers of eggs laid by a sample of 70 female herring gulls are shown in the table.
Number of eggs 1 2 3 4
Frequency 10 40 15 5
(i) Find the mean and standard deviation of the number of eggs laid per gull. [5]
(ii) The sample did not include female herring gulls that laid no eggs. How would the mean and
standard deviation change if these gulls were included? [2]
© OCR 2011 4766 Jun11 Turn over
PMT

4
Section B (36 marks)
7 Any patient who fails to turn up for an outpatient appointment at a hospital is described as a ‘no-show’.
At a particular hospital, on average 15% of patients are no-shows. A random sample of 20 patients
who have outpatient appointments is selected.
(i) Find the probability that
(A) there is exactly 1 no-show in the sample, [3]
(B) there are at least 2 no-shows in the sample. [2]
The hospital management introduces a policy of telephoning patients before appointments. It is hoped
that this will reduce the proportion of no-shows. In order to check this, a random sample of n patients
is selected. The number of no-shows in the sample is recorded and a hypothesis test is carried out at
the 5% level.
(ii) Write down suitable null and alternative hypotheses for the test. Give a reason for your choice
of alternative hypothesis. [4]
(iii) In the case that n = 20 and the number of no-shows in the sample is 1, carry out the test. [4]
(iv) In another case, where n is large, the number of no-shows in the sample is 6 and the critical value
for the test is 8. Complete the test. [3]
(v) In the case that n ≤ 18, explain why there is no point in carrying out the test at the 5% level. [2]
8 The heating quality of the coal in a sample of 50 sacks is measured in suitable units. The data are
summarised below.
Heating quality (x) 9.1 ≤ x ≤ 9.3 9.3 < x ≤ 9.5 9.5 < x ≤ 9.7 9.7 < x ≤ 9.9 9.9 < x ≤ 10.1
Frequency 5 7 15 16 7
(i) Draw a cumulative frequency diagram to illustrate these data. [5]
(ii) Use the diagram to estimate the median and interquartile range of the data. [3]
(iii) Show that there are no outliers in the sample. [3]
(iv) Three of these 50 sacks are selected at random. Find the probability that
(A) in all three, the heating quality x is more than 9.5, [3]
(B) in at least two, the heating quality x is more than 9.5. [4]
Copyright Information
OCR is committed to seeking permission to reproduce all third-party content that it uses in its assessment materials. OCR has attempted to identify and contact all copyright holders
whose work is used in this paper. To avoid the issue of disclosure of answer-related information to candidates, all copyright acknowledgements are reproduced in the OCR Copyright
Acknowledgements Booklet. This is produced for each series of examinations and is freely available to download from our public website (www.ocr.org.uk) after the live examination series.
If OCR has unwittingly failed to correctly acknowledge or clear any third-party content in this assessment material, OCR will be happy to correct its mistake at the earliest possible opportunity.
For queries or further information please contact the Copyright Team, First Floor, 9 Hills Road, Cambridge CB2 1GE.
OCR is part of the Cambridge Assessment Group; Cambridge Assessment is the brand name of University of Cambridge Local Examinations Syndicate (UCLES), which is itself a department
of the University of Cambridge.
© OCR 2011 4766 Jun11
PMT

Monday 23 January 2012 – MorningAS GCE MATHEMATICS (MEI)
4766 Statistics 1
QUESTION PAPER
*4732150112*
INSTRUCTIONS TO CANDIDATES
These instructions are the same on the Printed Answer Book and the Question Paper.
• The Question Paper will be found in the centre of the Printed Answer Book.• Write your name, centre number and candidate number in the spaces provided on the
Printed Answer Book. Please write clearly and in capital letters.• Write your answer to each question in the space provided in the Printed Answer
Book. Additional paper may be used if necessary but you must clearly show your candidate number, centre number and question number(s).
• Use black ink. HB pencil may be used for graphs and diagrams only.• Read each question carefully. Make sure you know what you have to do before starting
your answer.• Answer all the questions.• Do not write in the bar codes.• You are permitted to use a scientific or graphical calculator in this paper.• Final answers should be given to a degree of accuracy appropriate to the context.
INFORMATION FOR CANDIDATES
This information is the same on the Printed Answer Book and the Question Paper.
• The number of marks is given in brackets [ ] at the end of each question or part question on the Question Paper.
• You are advised that an answer may receive no marks unless you show sufficient detail of the working to indicate that a correct method is being used.
• The total number of marks for this paper is 72.• The Printed Answer Book consists of 12 pages. The Question Paper consists of 4 pages.
Any blank pages are indicated.
INSTRUCTION TO EXAMS OFFICER / INVIGILATOR
• Do not send this Question Paper for marking; it should be retained in the centre or recycled. Please contact OCR Copyright should you wish to re-use this document.
OCR is an exempt CharityTurn over
© OCR 2012 [H/102/2650]DC (CW/CGW) 43573/4
Candidates answer on the Printed Answer Book.
OCR supplied materials:• Printed Answer Book 4766• MEI Examination Formulae and Tables (MF2)
Other materials required:• Scientific or graphical calculator
Duration: 1 hour 30 minutes
PMT

2
4766 Jan12© OCR 2012
Section A (36 marks)
1 The mean daily maximum temperatures at a research station over a 12-month period, measured to the nearest degree Celsius, are given below.
Jan Feb Mar Apr May Jun Jul Aug Sep Oct Nov Dec
8 15 25 29 31 31 34 36 34 26 15 8
(i) Construct a sorted stem and leaf diagram to represent these data, taking stem values of 0, 10, ... . [4]
(ii) Write down the median of these data. [1]
(iii) The mean of these data is 24.3. Would the mean or the median be a better measure of central tendency of the data? Briefly explain your answer. [2]
2 The hourly wages, £x, of a random sample of 60 employees working for a company are summarised as follows.
n = 60 ∑ x = 759.00 ∑ x2 = 11 736.59
(i) Calculate the mean and standard deviation of x. [3]
(ii) The workers are offered a wage increase of 2%. Use your answers to part (i) to deduce the new mean and standard deviation of the hourly wages after this increase. [2]
(iii) As an alternative the workers are offered a wage increase of 25p per hour. Write down the new mean and standard deviation of the hourly wages after this 25p increase. [2]
3 Jimmy and Alan are playing a tennis match against each other. The winner of the match is the first player to win three sets. Jimmy won the first set and Alan won the second set. For each of the remaining sets, the probability that Jimmy wins a set is
• 0.7 if he won the previous set,• 0.4 if Alan won the previous set.
It is not possible to draw a set.
(i) Draw a probability tree diagram to illustrate the possible outcomes for each of the remaining sets. [3]
(ii) Find the probability that Alan wins the match. [3]
(iii) Find the probability that the match ends after exactly four sets have been played. [2]
Copyright Information
OCR is committed to seeking permission to reproduce all third-party content that it uses in its assessment materials. OCR has attempted to identify and contact all copyright holders whose work is used in this paper. To avoid the issue of disclosure of answer-related information to candidates, all copyright acknowledgements are reproduced in the OCR Copyright Acknowledgements Booklet. This is produced for each series of examinations and is freely available to download from our public website (www.ocr.org.uk) after the live examination series.
If OCR has unwittingly failed to correctly acknowledge or clear any third-party content in this assessment material, OCR will be happy to correct its mistake at the earliest possible opportunity.
For queries or further information please contact the Copyright Team, First Floor, 9 Hills Road, Cambridge CB2 1GE.
OCR is part of the Cambridge Assessment Group; Cambridge Assessment is the brand name of University of Cambridge Local Examinations Syndicate (UCLES), which is itself a department of the University of Cambridge.
PMT

3
4766 Jan12 Turn over© OCR 2012
4 In a food survey, a large number of people are asked whether they like tomato soup, mushroom soup, both or neither. One of these people is selected at random.
• T is the event that this person likes tomato soup.• M is the event that this person likes mushroom soup.
You are given that P(T ) = 0.55, P(M ) = 0.33 and P(T � M) = 0.80.
(i) Use this information to show that the events T and M are not independent. [1]
(ii) Find P(T ∩ M). [2]
(iii) Draw a Venn diagram showing the events T and M, and fill in the probability corresponding to each of the four regions of your diagram. [3]
5 A couple plan to have at least one child of each sex, after which they will have no more children. However, if they have four children of one sex, they will have no more children. You should assume that each child is equally likely to be of either sex, and that the sexes of the children are independent. The random variable X represents the total number of girls the couple have.
(i) Show that P(X = 1) = 1116. [3]
The table shows the probability distribution of X.
r 0 1 2 3 4
P(X = r) 116
1116
18
116
116
(ii) Find E(X ) and Var(X ). [5]
Section B (36 marks)
6 It is known that 25% of students in a particular city are smokers. A random sample of 20 of the students is selected.
(i) (A ) Find the probability that there are exactly 4 smokers in the sample. [3]
(B) Find the probability that there are at least 3 but no more than 6 smokers in the sample. [3]
(C ) Write down the expected number of smokers in the sample. [1]
A new health education programme is introduced. This programme aims to reduce the percentage of students in this city who are smokers. After the programme has been running for a year, it is decided to carry out a hypothesis test to assess the effectiveness of the programme. A random sample of 20 students is selected.
(ii) (A ) Write down suitable null and alternative hypotheses for the test. [3]
(B) Explain why the alternative hypothesis has the form that it does. [1]
(iii) Find the critical region for the test at the 5% level, showing all of your calculations. [4]
(iv) In fact there are 3 smokers in the sample. Complete the test, stating your conclusion clearly. [2]
PMT

4
4766 Jan12© OCR 2012
7 The birth weights of 200 lambs from crossbred sheep are illustrated by the cumulative frequency diagram below.
(i) Estimate the percentage of lambs with birth weight over 6 kg. [2]
(ii) Estimate the median and interquartile range of the data. [3]
(iii) Use your answers to part (ii) to show that there are very few, if any, outliers. Comment briefly on whether any outliers should be disregarded in analysing these data. [4]
The box and whisker plot shows the birth weights of 100 lambs from Welsh Mountain sheep.
(iv) Use appropriate measures to compare briefly the central tendencies and variations of the weights of the two types of lamb. [4]
(v) The weight of the largest Welsh Mountain lamb was originally recorded as 6.5 kg, but then corrected. If this error had not been corrected, how would this have affected your answers to part (iv)? Briefly explain your answer. [2]
(vi) One lamb of each type is selected at random. Estimate the probability that the birth weight of both lambs is at least 3.9 kg. [4]
PMT

Thursday 24 May 2012 – MorningAS GCE MATHEMATICS (MEI)
4766 Statistics 1
QUESTION PAPER
INSTRUCTIONS TO CANDIDATESThese instructions are the same on the Printed Answer Book and the Question Paper.• The Question Paper will be found in the centre of the Printed Answer Book.• Write your name, centre number and candidate number in the spaces provided on the
Printed Answer Book. Please write clearly and in capital letters.• Write your answer to each question in the space provided in the Printed Answer
Book. Additional paper may be used if necessary but you must clearly show your candidate number, centre number and question number(s).
• Use black ink. HB pencil may be used for graphs and diagrams only.• Read each question carefully. Make sure you know what you have to do before starting
your answer.• Answer all the questions.• Do not write in the bar codes.• You are permitted to use a scientific or graphical calculator in this paper.• Final answers should be given to a degree of accuracy appropriate to the context.
INFORMATION FOR CANDIDATESThis information is the same on the Printed Answer Book and the Question Paper.• The number of marks is given in brackets [ ] at the end of each question or part question
on the Question Paper.• You are advised that an answer may receive no marks unless you show sufficient detail
of the working to indicate that a correct method is being used.• The total number of marks for this paper is 72.• The Printed Answer Book consists of 12 pages. The Question Paper consists of 4 pages.
Any blank pages are indicated.
INSTRUCTION TO EXAMS OFFICER / INVIGILATOR
• Do not send this Question Paper for marking; it should be retained in the centre or recycled. Please contact OCR Copyright should you wish to re-use this document.
OCR is an exempt CharityTurn over
© OCR 2012 [H/102/2650]DC (NH/CGW) 43406/5
Candidates answer on the Printed Answer Book.
OCR supplied materials:• Printed Answer Book 4766• MEI Examination Formulae and Tables (MF2)
Other materials required:• Scientific or graphical calculator
*4715830612*
Duration: 1 hour 30 minutes
PMT

2
4766 Jun12© OCR 2012
Section A (36 marks)
1 At a garden centre there is a box containing 50 hyacinth bulbs. Of these, 30 will produce a blue flower and the remaining 20 will produce a red flower. Unfortunately they have become mixed together so that it is not known which of the bulbs will produce a blue flower and which will produce a red flower.
Karen buys 3 of these bulbs.
(i) Find the probability that all 3 of these bulbs will produce blue flowers. [3]
(ii) Find the probability that Karen will have at least one flower of each colour from her 3 bulbs. [3]
2 An examination paper consists of two sections. Section A has 5 questions and Section B has 9 questions. Candidates are required to answer 6 questions.
(i) In how many different ways can a candidate choose 6 questions, if 3 are from Section A and 3 are from Section B? [3]
(ii) Another candidate randomly chooses 6 questions to answer. Find the probability that this candidate chooses 3 questions from each section. [3]
3 At a call centre, 85% of callers are put on hold before being connected to an operator. A random sample of 30 callers is selected.
(i) Find the probability that exactly 29 of these callers are put on hold. [3]
(ii) Find the probability that at least 29 of these callers are put on hold. [3]
(iii) If 10 random samples, each of 30 callers, are selected, find the expected number of samples in which at least 29 callers are put on hold. [2]
4 It is known that 8% of the population of a large city use a particular web browser. A researcher wishes to interview some people from the city who use this browser. He selects people at random, one at a time.
(i) Find the probability that the first person that he finds who uses this browser is
(A) the third person selected, [3]
(B) the second or third person selected. [2]
(ii) Find the probability that at least one of the first 20 people selected uses this browser. [3]
5 A manufacturer produces titanium bicycle frames. The bicycle frames are tested before use and on average 5% of them are found to be faulty. A cheaper manufacturing process is introduced and the manufacturer wishes to check whether the proportion of faulty bicycle frames has increased. A random sample of 18 bicycle frames is selected and it is found that 4 of them are faulty. Carry out a hypothesis test at the 5% significance level to investigate whether the proportion of faulty bicycle frames has increased. [8]
PMT

3
4766 Jun12© OCR 2012
Section B (36 marks)
6 The engine sizes x cm3 of a sample of 80 cars are summarised in the table below.
Engine size x 500 x 1000 1000 < x 1500 1500 < x 2000 2000 < x 3000 3000 < x 5000
Frequency 7 22 26 18 7
(i) Draw a histogram to illustrate the distribution. [5]
(ii) A student claims that the midrange is 2750 cm3. Discuss briefly whether he is likely to be correct. [1]
(iii) Calculate estimates of the mean and standard deviation of the engine sizes. Explain why your answers are only estimates. [5]
(iv) Hence investigate whether there are any outliers in the sample. [3]
(v) A vehicle duty of £1000 is proposed for all new cars with engine size greater than 2000 cm3. Assuming that this sample of cars is representative of all new cars in Britain and that there are 2.5 million new cars registered in Britain each year, calculate an estimate of the total amount of money that this vehicle duty would raise in one year. [3]
(vi) Why in practice might your estimate in part (v) turn out to be too high? [1]
7 Yasmin has 5 coins. One of these coins is biased with P(heads) = 0.6. The other 4 coins are fair. She tosses all 5 coins once and records the number of heads, X.
(i) Show that P(X = 0) = 0.025. [2]
(ii) Show that P(X = 1) = 0.1375. [4]
The table shows the probability distribution of X.
r 0 1 2 3 4 5
P(X=r) 0.025 0.1375 0.3 0.325 0.175 0.0375
(iii) Draw a vertical line chart to illustrate the probability distribution. [2]
(iv) Comment on the skewness of the distribution. [1]
(v) Find E(X ) and Var(X ). [5]
(vi) Yasmin tosses the 5 coins three times. Find the probability that the total number of heads is 3. [4]
PMT

4
4766 Jun12© OCR 2012
Copyright Information
OCR is committed to seeking permission to reproduce all third-party content that it uses in its assessment materials. OCR has attempted to identify and contact all copyright holders whose work is used in this paper. To avoid the issue of disclosure of answer-related information to candidates, all copyright acknowledgements are reproduced in the OCR Copyright Acknowledgements Booklet. This is produced for each series of examinations and is freely available to download from our public website (www.ocr.org.uk) after the live examination series.
If OCR has unwittingly failed to correctly acknowledge or clear any third-party content in this assessment material, OCR will be happy to correct its mistake at the earliest possible opportunity.
For queries or further information please contact the Copyright Team, First Floor, 9 Hills Road, Cambridge CB2 1GE.
OCR is part of the Cambridge Assessment Group; Cambridge Assessment is the brand name of University of Cambridge Local Examinations Syndicate (UCLES), which is itself a department of the University of Cambridge.
THERE ARE NO QUESTIONS WRITTEN ON THIS PAGE.
PMT
Friday 25 January 2013 – AfternoonAS GCE MATHEMATICS (MEI)
4766/01 Statistics 1
QUESTION PAPER
*4
73
29
80
11
3*
INSTRUCTIONS TO CANDIDATES
These instructions are the same on the Printed Answer Book and the Question Paper.
• The Question Paper will be found in the centre of the Printed Answer Book.• Write your name, centre number and candidate number in the spaces provided on the
Printed Answer Book. Please write clearly and in capital letters.• Write your answer to each question in the space provided in the Printed Answer
Book. Additional paper may be used if necessary but you must clearly show your candidate number, centre number and question number(s).
• Use black ink. HB pencil may be used for graphs and diagrams only.• Read each question carefully. Make sure you know what you have to do before starting
your answer.• Answer all the questions.• Do not write in the bar codes.• You are permitted to use a scientific or graphical calculator in this paper.• Final answers should be given to a degree of accuracy appropriate to the context.
INFORMATION FOR CANDIDATES
This information is the same on the Printed Answer Book and the Question Paper.
• The number of marks is given in brackets [ ] at the end of each question or part question on the Question Paper.
• You are advised that an answer may receive no marks unless you show sufficient detail of the working to indicate that a correct method is being used.
• The total number of marks for this paper is 72.• The Printed Answer Book consists of 12 pages. The Question Paper consists of 4 pages.
Any blank pages are indicated.
INSTRUCTION TO EXAMS OFFICER / INVIGILATOR
• Do not send this Question Paper for marking; it should be retained in the centre or recycled. Please contact OCR Copyright should you wish to re-use this document.
This paper has been pre modified for carrier language
OCR is an exempt CharityTurn over
© OCR 2013 [H/102/2650]DC (LEG/CGW) 61801/3
Candidates answer on the Printed Answer Book.
OCR supplied materials:• Printed Answer Book 4766/01• MEI Examination Formulae and Tables (MF2)
Other materials required:• Scientific or graphical calculator
Duration: 1 hour 30 minutes
PMT

2
4766/01 Jan13© OCR 2013
Section A (36 marks)
1 The stem and leaf diagram illustrates the heights in metres of 25 young oak trees.
345678
400241
62146
7235
835
948
96 8 9
Key: 4 2 represents 4.2
(i) State the type of skewness of the distribution. [1]
(ii) Use your calculator to find the mean and standard deviation of these data. [3]
(iii) Determine whether there are any outliers. [4]
2 The probability distribution of the random variable X is given by the formula
P X r k r 12= = -_ _i i for r = 2, 3, 4, 5.
(i) Show the probability distribution in a table, and find the value of k. [3]
(ii) Find E X_ i and Var X_ i. [5]
3 Each weekday Alan drives to work. On his journey, he goes over a level crossing. Sometimes he has to wait at the level crossing for a train to pass.
• W is the event that Alan has to wait at the level crossing.• L is the event that Alan is late for work.
You are given that P .L W 0 4=_ i , P 0.07W =_ i and P 0.08L Wj =_ i .
(i) Calculate P L Wk_ i. [2]
(ii) Draw a Venn diagram, showing the events L and W. Fill in the probability corresponding to each of the four regions of your diagram. [3]
(iii) Determine whether the events L and W are independent, explaining your method clearly. [3]
4 At a dog show, three out of eleven dogs are to be selected for a national competition.
(i) Find the number of possible selections. [2]
(ii) Five of the eleven dogs are terriers. Assuming that the dogs are selected at random, find the probability that at least two of the three dogs selected for the national competition are terriers. [5]
PMT

3
4766/01 Jan13 Turn over© OCR 2013
5 Malik is playing a game in which he has to throw a 6 on a fair six-sided die to start the game. Find the probability that
(i) Malik throws a 6 for the first time on his third attempt, [3]
(ii) Malik needs at most ten attempts to throw a 6. [2]
Section B (36 marks)
6 The heights x cm of 100 boys in Year 7 at a school are summarised in the table below.
Height 125 G x G 140 140 < x G 145 145 < x G 150 150 < x G 160 160 < x G 170
Frequency 25 29 24 18 4
(i) Estimate the number of boys who have heights of at least 155 cm. [2]
(ii) Calculate an estimate of the median height of the 100 boys. [3]
(iii) Draw a histogram to illustrate the data. [5]
The histogram below shows the heights of 100 girls in Year 7 at the same school.
0
1
2
0 125 130 135 140 145 150
height (cm)
155 160 165 170 175 180
3
freq
uenc
y de
nsity
4
5
6
7
(iv) How many more girls than boys had heights exceeding 160 cm? [3]
(v) Calculate an estimate of the mean height of the 100 girls. [5]
PMT

4
4766/01 Jan13© OCR 2013
Copyright Information
OCR is committed to seeking permission to reproduce all third-party content that it uses in its assessment materials. OCR has attempted to identify and contact all copyright holders whose work is used in this paper. To avoid the issue of disclosure of answer-related information to candidates, all copyright acknowledgements are reproduced in the OCR Copyright Acknowledgements Booklet. This is produced for each series of examinations and is freely available to download from our public website (www.ocr.org.uk) after the live examination series.
If OCR has unwittingly failed to correctly acknowledge or clear any third-party content in this assessment material, OCR will be happy to correct its mistake at the earliest possible opportunity.
For queries or further information please contact the Copyright Team, First Floor, 9 Hills Road, Cambridge CB2 1GE.
OCR is part of the Cambridge Assessment Group; Cambridge Assessment is the brand name of University of Cambridge Local Examinations Syndicate (UCLES), which is itself a department of the University of Cambridge.
7 A coffee shop provides free internet access for its customers. It is known that the probability that a randomly selected customer is accessing the internet is 0.35, independently of all other customers.
(i) 10 customers are selected at random.
(A ) Find the probability that exactly 5 of them are accessing the internet. [3]
(B ) Find the probability that at least 5 of them are accessing the internet. [2]
(C ) Find the expected number of these customers who are accessing the internet. [2]
Another coffee shop also provides free internet access. It is suspected that the probability that a randomly selected customer at this coffee shop is accessing the internet may be different from 0.35. A random sample of 20 customers at this coffee shop is selected. Of these, 10 are accessing the internet.
(ii) Carry out a hypothesis test at the 5% significance level to investigate whether the probability for this coffee shop is different from 0.35. Give a reason for your choice of alternative hypothesis. [9]
(iii) To get a more reliable result, a much larger random sample of 200 customers is selected over a period of time, and another hypothesis test is carried out. You are given that 90 of the 200 customers were accessing the internet. You are also given that, if X has the binomial distribution with parameters n = 200 and p = 0.35, then P 0.0022X 90H =_ i . Using the same hypotheses and significance level which you used in part (ii), complete this test. [2]
PMT

Friday 24 May 2013 – MorningAS GCE MATHEMATICS (MEI)
4766/01 Statistics 1
QUESTION PAPER
INSTRUCTIONS TO CANDIDATESThese instructions are the same on the Printed Answer Book and the Question Paper.• The Question Paper will be found in the centre of the Printed Answer Book.• Write your name, centre number and candidate number in the spaces provided on the
Printed Answer Book. Please write clearly and in capital letters.• Write your answer to each question in the space provided in the Printed Answer
Book. Additional paper may be used if necessary but you must clearly show your candidate number, centre number and question number(s).
• Use black ink. HB pencil may be used for graphs and diagrams only.• Read each question carefully. Make sure you know what you have to do before starting
your answer.• Answer all the questions.• Do not write in the bar codes.• You are permitted to use a scientific or graphical calculator in this paper.• Final answers should be given to a degree of accuracy appropriate to the context.
INFORMATION FOR CANDIDATESThis information is the same on the Printed Answer Book and the Question Paper.• The number of marks is given in brackets [ ] at the end of each question or part question
on the Question Paper.• You are advised that an answer may receive no marks unless you show sufficient detail
of the working to indicate that a correct method is being used.• The total number of marks for this paper is 72.• The Printed Answer Book consists of 12 pages. The Question Paper consists of 4 pages.
Any blank pages are indicated.
INSTRUCTION TO EXAMS OFFICER / INVIGILATOR
• Do not send this Question Paper for marking; it should be retained in the centre or recycled. Please contact OCR Copyright should you wish to re-use this document.
OCR is an exempt CharityTurn over
© OCR 2013 [H/102/2650]DC (NH/JG) 66626/3
Candidates answer on the Printed Answer Book.
OCR supplied materials:• Printed Answer Book 4766/01• MEI Examination Formulae and Tables (MF2)
Other materials required:• Scientific or graphical calculator
*4
71
58
30
61
3*
Duration: 1 hour 30 minutes
PMT

2
4766/01 Jun13© OCR 2013
Section A (36 marks)
1 The weights, x grams, of 100 potatoes are summarised as follows.
n 100= / x 24 940= / x 62407802 =
(i) Calculate the mean and standard deviation of x. [3]
(ii) The weights, y grams, of the potatoes after they have been peeled are given by the formula 0.9 15y x= - . Deduce the mean and standard deviation of the weights of the potatoes after they have
been peeled. [3]
2 Every evening, 5 men and 5 women are chosen to take part in a phone-in competition. Of these 10 people, exactly 3 will win a prize. These 3 prize-winners are chosen at random.
(i) Find the probability that, on a particular evening, 2 of the prize-winners are women and the other is a man. Give your answer as a fraction in its simplest form. [4]
(ii) Four evenings are selected at random. Find the probability that, on at least three of the four evenings, 2 of the prize-winners are women and the other is a man. [4]
3 The weights of bags of a particular brand of flour are quoted as 1.5 kg. In fact, on average 10% of bags are underweight.
(i) Find the probability that, in a random sample of 50 bags, there are exactly 5 bags which are underweight. [3]
(ii) Bags are randomly chosen and packed into boxes of 20. Find the probability that there is at least one underweight bag in a box. [2]
(iii) A crate contains 48 boxes. Find the expected number of boxes in the crate which contain at least one underweight bag. [2]
4 Martin has won a competition. For his prize he is given six sealed envelopes, of which he is allowed to open exactly three and keep their contents. Three of the envelopes each contain £5 and the other three each contain £1000. Since the envelopes are identical on the outside, he chooses three of them at random. Let £X be the total amount of money that he receives in prize money.
(i) Show that P( 15) 0.05X = = . [2]
The probability distribution of X is given in the table below.
r 15 1010 2005 3000
P( )X r= 0.05 0.45 0.45 0.05
(ii) Find E( )X and ( )Var X . [5]
PMT

3
4766/01 Jun13 Turn over© OCR 2013
5 A researcher is investigating whether people can identify whether a glass of water they are given is bottled water or tap water. She suspects that people do no better than they would by guessing. Twenty people are selected at random; thirteen make a correct identification. She carries out a hypothesis test.
(i) Explain why the null hypothesis should be p = 0.5, where p represents the probability that a randomly selected person makes a correct identification. [2]
(ii) Briefly explain why she uses an alternative hypothesis of p > 0.5. [1]
(iii) Complete the test at the 5% significance level. [5]
Section B (36 marks)
6 The birth weights in kilograms of 25 female babies are shown below, in ascending order.
1.39 2.50 2.68 2.76 2.82 2.82 2.84 3.03 3.06 3.16 3.16 3.24 3.323.36 3.40 3.54 3.56 3.56 3.70 3.72 3.72 3.84 4.02 4.24 4.34
(i) Find the median and interquartile range of these data. [3]
(ii) Draw a box and whisker plot to illustrate the data. [3]
(iii) Show that there is exactly one outlier. Discuss whether this outlier should be removed from the data. [4]
The cumulative frequency curve below illustrates the birth weights of 200 male babies.
2 2.50 3 3.5 4 4.5 50
50
100
150
200
Cum
ulat
ive
freq
uenc
y
Weight (kilograms)
(iv) Find the median and interquartile range of the birth weights of the male babies. [3]
(v) Compare the weights of the female and male babies. [2]
(vi) Two of these male babies are chosen at random. Calculate an estimate of the probability that both of these babies weigh more than any of the female babies. [3]
PMT

4
4766/01 Jun13© OCR 2013
Copyright Information
OCR is committed to seeking permission to reproduce all third-party content that it uses in its assessment materials. OCR has attempted to identify and contact all copyright holders whose work is used in this paper. To avoid the issue of disclosure of answer-related information to candidates, all copyright acknowledgements are reproduced in the OCR Copyright Acknowledgements Booklet. This is produced for each series of examinations and is freely available to download from our public website (www.ocr.org.uk) after the live examination series.
If OCR has unwittingly failed to correctly acknowledge or clear any third-party content in this assessment material, OCR will be happy to correct its mistake at the earliest possible opportunity.
For queries or further information please contact the Copyright Team, First Floor, 9 Hills Road, Cambridge CB2 1GE.
OCR is part of the Cambridge Assessment Group; Cambridge Assessment is the brand name of University of Cambridge Local Examinations Syndicate (UCLES), which is itself a department of the University of Cambridge.
7 Jenny has six darts. She throws darts, one at a time, aiming each at the bull’s-eye. The probability that she hits the bull’s-eye with her first dart is 0.1. For any subsequent throw, the probability of hitting the bull’s-eye is 0.2 if the previous dart hit the bull’s-eye and 0.05 otherwise.
(i) Illustrate the possible outcomes for her first, second and third darts on a probability tree diagram. [4]
(ii) Find the probability that
(A) she hits the bull’s-eye with at least one of her first three darts, [3]
(B) she hits the bull’s-eye with exactly one of her first three darts. [4]
(iii) Given that she hits the bull’s-eye with at least one of her first three darts, find the probability that she hits the bull’s-eye with exactly one of them. [3]
Jenny decides that, if she hits the bull’s-eye with any of her first three darts, she will stop after throwing three darts. Otherwise she will throw all six darts.
(iv) Find the probability that she hits the bull’s-eye three times in total. [4]
PMT