p.o. box 843024 aerospace industrydoav.virginia.gov/downloads/studies/workforce... · . prepared...
TRANSCRIPT
Virginia’s aerospace in dustryRevised Edition January 2011
An Economic Impact AnalysisNovember 2010
1014 West Franklin StreetP.O. Box 843024Richmond, VA 23284www.pmg.vcu.edu
Prepared for:Randall Burdette, DirectorVirginia Department of Aviation
Prepared by:
Acknowledgements
The Performance Management Group at Virginia Commonwealth University is grateful for the help of many individuals and organizations that contributed to this study. At the forefront is Randall Burdette, Director of the Virginia Department of Aviation, who sponsored this premiere report of the aerospace industry and led the vision for the consortium approach to statewide best practices for economic studies.
We would also like to thank the members of the economic impact research consor-tium (listed in Appendix 1), Billy Kinsey Jr., Senior Researcher and Economist from the Virginia Center for Urban Development at VCU, and Chmura Economics & Analytics for their technical expertise with industry economics and analytics, the aerospace industry, and assistance with the graphical design of this report.
Additional gratitude goes to our review committee consisting of Christopher D. Hall, Ph.D, Department Head Aerospace and Ocean Engineering, Virginia Polytechnic Institute and State University; Robert E, Lindberg, Eng.Sc.D., President and Execu-tive Director National Institute of Aerospace; Laurie Naismith, Director Government Relations and Public Affairs for the Virginia Commercial Space Flight Authority and Mid-Atlantic Regional Spaceport; and Mary Sandy, Director, Virginia Space Grants Consortium. Additional thanks go to Lesa Roe, Director of NASA’s Langley Research Center; Michelle Frank, Government Affairs, Orbital Sciences Corporation; and David Dickson, Executive Director and Patrick Tremblay, Communications Man-ager of Virginia National Defense Industrial Authority for their assistance obtaining estimates of the military contribution to Virginia’s aerospace industry. Special thanks go to Hunter Snellings of PMG for his persistence and dedication to the study.
Cover Photo Credits, Top to Bottom: Orbital Sciences Corporation. NASA, Orbital Sciences Corporation

Virginia’s Aerospace Industry | 1
Table of Contents1. Executive Summary ............................................................................................................... 22. Background .......................................................................................................................... 4 2.1. Economic Impact Research Consortium ......................................................................... 5 2.2. Industry Definition ......................................................................................................... 5 2.3. Region Definitions .......................................................................................................... 6 2.4. Economic Impact Methodology ...................................................................................... 73. The Aerospace Industry ......................................................................................................... 8 3.1. The Aerospace Industry in Virginia ................................................................................. 9 3.2. Overall Employment and Wages .................................................................................... 10 3.3. Employment and Wages Details ................................................................................... 114. Economic Impact of Aerospace in Virginia ......................................................................... 12 4.1. Economic Impact of Aerospace on the State .................................................................. 12 4.2. Economic Impact Breakdown by Sub-Industries ........................................................... 13 4.3. Indirect and Induced Impact from the Aerospace Industry .......................................... 13 4.4. Summary Impact of Aerospace on Virginia’s Metro Areas ............................................. 14 4.5. Fiscal Impact on Virginia ............................................................................................. 14 4.6. Aerospace Tourism ........................................................................................................ 15 4.7. Aerospace Education ..................................................................................................... 16 4.8. Intelligence-Related Aerospace ...................................................................................... 16 4.9. Military Aerospace ........................................................................................................ 17Appendix 1: Economic Impact Consortium Members ............................................................ 18Appendix 2: State Aerospace Industry Definitions .................................................................. 19Appendix 3: Detailed NAICS Definitions for Aerospace ......................................................... 26Appendix 4: Impact Study Glossary ........................................................................................ 27Appendix 5: Detailed Aerospace Impact by Metro Area .......................................................... 28
Photo Credit: NASA

2 | November 2010
Virginia is home to a diverse aerospace industry that includes interconnected industries such as aircraft manufacturing, satel-lite telecommunication, and space research and development. Over the past several years, Virginia’s aerospace economy has enjoyed an increase in the presence and investments by private firms manufacturing aerospace equipment and supplies (e.g. Rolls Royce, Orbital Sciences Corporation, and General Dy-namics). The investments in these industries come at a time when many mature industries are declining both nationally and in the state.
Virginia is well poised to respond to the growth in demand of commercial space launches for medium-heavy lift rockets and small satellites into low earth orbit. Both National Aeronau-tics and Space Administration (NASA) research centers, NASA Langley and NASA Wallops, have attracted new commercial clients for applied research and increased funding for existing and new programs from NASA headquarters.
The Virginia Commercial Space Flight Authority, established by the Virginia General Assembly in 1995, owns and operates the Mid-Atlantic Regional Spaceport (MARS) located at Wal-lops Flight Facility—one of four spaceports nationally licensed by the FAA to send rockets into orbit. Commercial operations to the International Space Station will commence from MARS in Virginia beginning in 2011 as NASA phases out its current space shuttle program.
It is hoped that these factors combined with other economic development will be favorable for Virginia’s aerospace industry. To provide a baseline for the industry and its contributions to the Commonwealth, and to gather accurate information to outreach to the aerospace companies already located in Vir-ginia, the Department of Aviation commissioned an economic impact study of the aerospace industry.
The aerospace industry is defined as nine 6-digit North American Industrial Classification System (NAICS) industries.
• Search, Detection, Navigation, Guidance, Aero-nautical, and Nautical System and Instrument Manufacturing
• Aircraft Manufacturing• Aircraft Engine and Engine Parts Manufacturing• Other Aircraft Parts and Auxiliary Equipment
Manufacturing• Guided Missile and Space Vehicle Manufacturing• Guided Missile and Space Vehicle Propulsion Units
• Other Guided Missile and Space Vehicle Parts and Auxiliary Equipment
• Satellite Telecommunications• Space Research and Technology
Virginia’s aerospace industry contributed $7.6 bil-lion per year in economic output and supported 28,110 jobs in 20091 through direct impacts and ripple effects.
Aerospace directly employed 9,029 workers and created $4.3 billion in annual economic output in 2009. The ongoing op-erations of the industry had ripple impacts throughout the state, estimated to be an additional 19,081 jobs and $3.3 bil-lion annually.
Aerospace pays much higher wages than the average in Virginia.
In 2009, the annual average wage of the aerospace industry was $99,385 compared to $48,334 for all industries in Vir-ginia. Among its top 20 occupations, the highest paying posi-tions are engineering managers ($123,600), general and opera-tions managers ($119,600), and computer software engineers ($106,300).
Virginia’s space research and technology industry holds a clear competitive advantage for the Com-monwealth compared with other states in the nation.
The space research and technology industry has four times the concentration of employment in Virginia when compared to the national average. This is not surprising in light of the notable and historical firsts for Virginia’s aerospace industry. Langley Air Force Base (AFB) was designed for air domination during WorldWar I which eventually led to its acquisition by the Aviation Section of the U.S. Army Signal Corps in Decem-ber 1916. A portion of Langley Field was set aside for use by the National Advisory Council for Aeronautics to study theproblems of flight. This site, known today as NASA Langley Research Center, is the nation’s first civilian aeronautics labora-tory and NASA’s original field center. In addition, the NASA Goddard Space Flight Center’s Wallops Flight Facility was cre-ated in 1945 as a center for aeronautics research on Virginia’s Eastern Shore. Over a quarter of the state’s aerospace industry employment is in the space research and technology subsector.
1 2009 is the latest year where full year data are available.
1. EXECUTIVE SUMMARY
Virginia’s Aerospace Industry | 3
The aerospace industry employed 9,029 workers in Virginia in 2009, ranking it 16th in the nation for aerospace employment.
California ranked first among the states in 2009, employing 119,684 people, or a quarter of the nation’s 677,393 aerospace industry workers. Unlike the nation, where aerospace employ-ment contracted 2.1%, the Virginia aerospace industry ex-panded in 2009 for a gain of 4.2% or 366 jobs.
Each job in the aerospace industry supports 2.11 ad-ditional jobs elsewhere in Virginia.
The employment multiplier2 for aerospace is higher than 0.71, the average multiplier for an industry in Virginia. Each job in aerospace can support 2.11 additional jobs elsewhere in Virginia. This means that 100 aerospace jobs can support 140 more than the typical 100 jobs on average in the Common-wealth. This multiplier is higher than average due to the indus-try’s sophistication and high wages.
Aerospace contributed 1.9% to Virginia’s gross state product while utilizing only 0.8% of total employ-ment in the state.
The percentage of this sector’s GSP relative to employment re-flects its highly skilled and highly productive workers.
Business-to-Business and Business-to-Consumer networks in Virginia benefit from the aerospace industry.
Businesses and consumers throughout the Commonwealth enjoy the economic benefits due to aerospace businesses and consumers of goods and services. The state’s more essential industries to the operations and productivity of aerospace are:
• management• wholesale trade• employment services• scientific research and development• computer system design• architecture and engineering services
Consumers benefit from the higher average wages from aero-space; higher wages contribute to the higher demand for con-sumer services such as food services, health care, and retail.
2 The employment multiplier measures the additional jobs created for each job in the aerospace industry.
Virginia encompasses a substantial military aero-space industry with roughly 26,000 uniformed, ci-vilian, and contractor employees.
Overall, the Department of Defense employs almost 153,000 Virginians, the third highest total employment by state in the country. The military aerospace employment figure of 26,000 was obtained through a survey which showed nearly half of this employment in the state to be associated with Langley Air Force Base.3
The economic impacts of the aerospace industry in Virginia are summarized in Table 1.1:
3 Included within the survey instrument’s “aerospace” definition was the re-quest for personnel figures relating to aviation operations, as well as, conven-tional aerospace functions. Therefore, the figures displayed above and within Table 4.7 incorporate personnel performing military aerospace and aviation-related duties.
Table 1.1: Economic Impact Summary of the Aerospace Industry in Virginia Direct Indirect Induced TotalSpending ($Millions) $4,314.0 $1,753.4 $1,521.0 $7,588.4
Employment 9,029 8,934 10,147 28,110Source: Chmura Economics & Analytics & IMPLAN Pro 2008
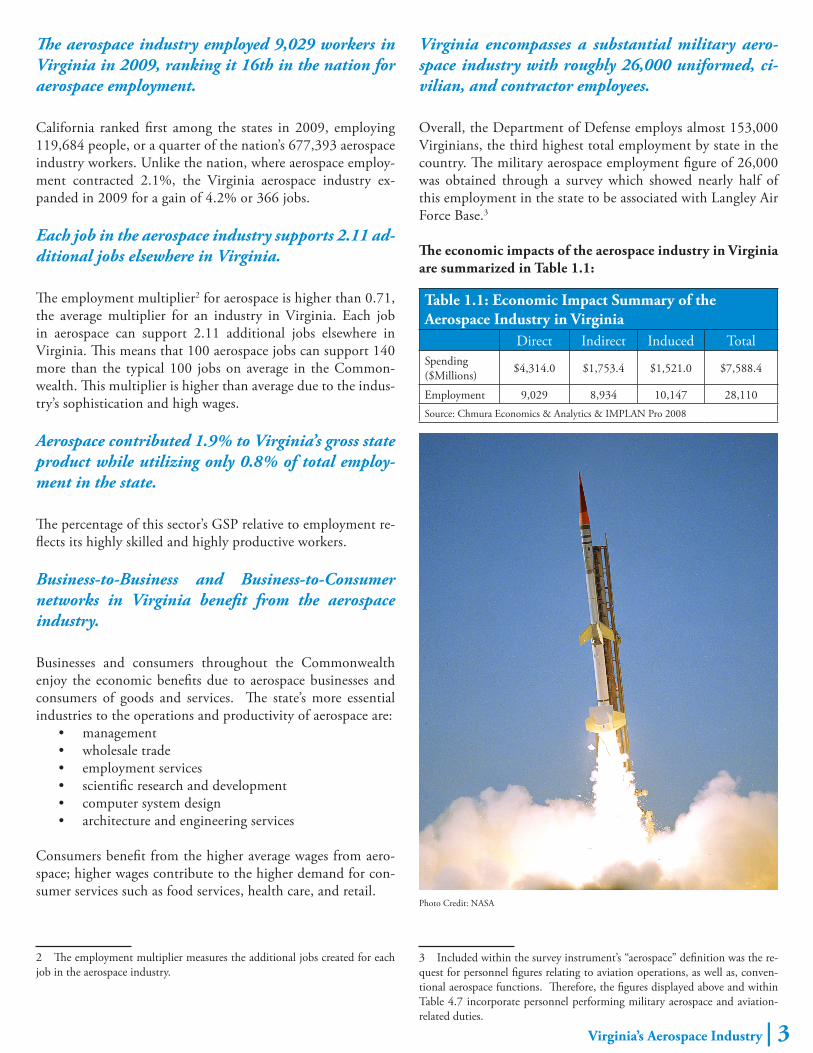
Photo Credit: NASA
4 | November 2010
Virginia has a long history of supporting and advancing the aerospace industry with strongholds in space research, educa-tion, development, and launch facilities. The Commonwealth houses centers of excellence including NASA’s Langley Research Center and the Wallops Flight Facility. These institutions date back to the early 1900’s and have been instrumental in advanc-ing the U.S. aerospace program and providing scientific and at-mospheric research. In addition, Virginia Polytechnic Institute and State University (Virginia Tech) has an aerospace engineer-ing program that is consistently ranked in the top three national-ly and the university is among the top for recruiting by aerospace companies and organizations.
Recent developments in commercial space launch for medium-heavy lift rockets and small satellites into low earth orbit, com-bined with private investments from corporate partners such as Rolls Royce, Orbital Sciences, and General Dynamics, are creat-ing growth in this economic engine. It is hoped that the forecast for Virginia’s aerospace industry will continue to grow aided by cooperative legislative and economic policies and practices, a healthy and competitive workforce, and scientific, medical and research applications in the industry.
The FAA’s 2009 report, “State Support for Commercial Space,” states:
Virginia has recently taken the lead in the area of innovative incentives to lure space transportation companies to the state. In the last two years, the state passed two bills intended to boost the presence of the industry. The first, the Virginia Space Li-ability and Immunity Act, enacted in 2007, effectively made Virginia the most progressive state in the country in addressing the challenge that existing tort law posed to emerging human spaceflight transportation companies. The second, the Zero G Zero Tax Act of 2008, will provide an exemption from state in-come taxes to any space transportation company doing business in Virginia with the intent to either launch payloads from the Mid-Atlantic Regional Spaceport (MARS) or conduct space-flight training. These two pieces of legislation, coupled with other, more traditional financial incentives, are largely credited with being the driving force behind Orbital Sciences’ decision to locate the launch operations for its new Taurus II launch vehicle in Virginia.4
To provide a baseline for the industry and its contributions to the Commonwealth, and to gather accurate information to
4 Source:http://www.faa.gov/about/office_org/headquarters_offices/ast/me-dia/State%20Support%20for%20Commercial%20Space%20Activities.pdf
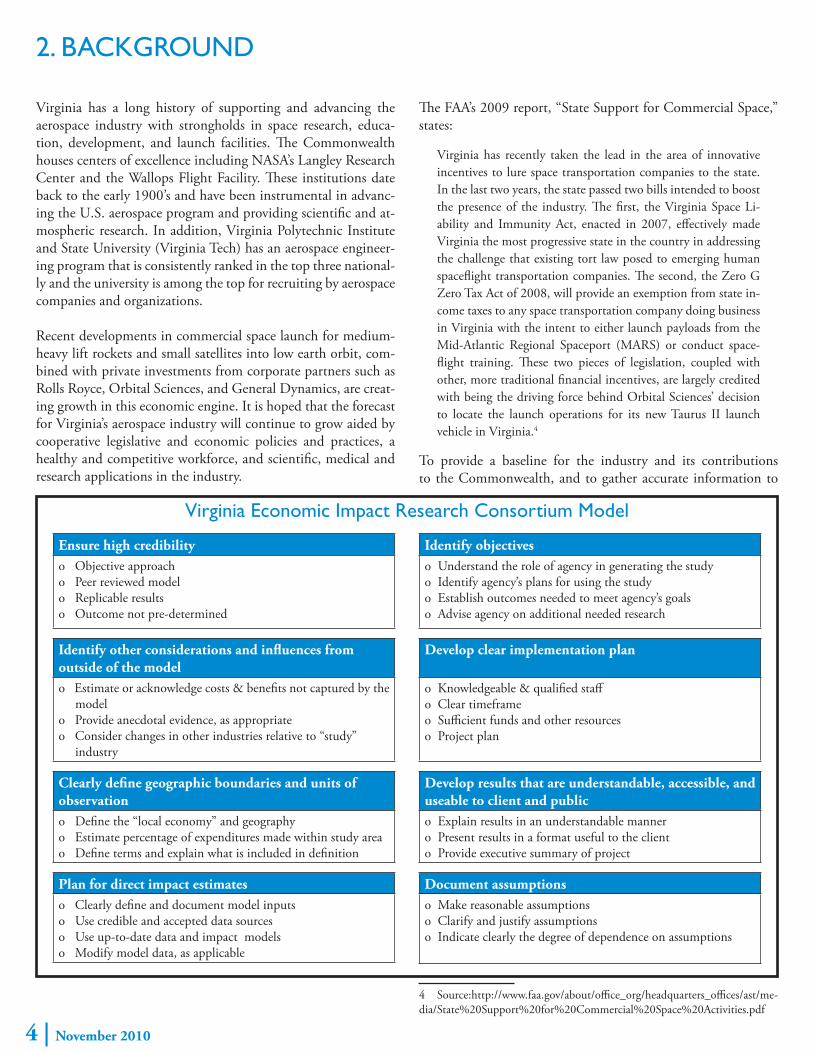
2. BACKGROUND
Ensure high credibilityo Objective approach o Peer reviewed modelo Replicable results o Outcome not pre-determined
Identify other considerations and influences from outside of the modelo Estimate or acknowledge costs & benefits not captured by the modelo Provide anecdotal evidence, as appropriateo Consider changes in other industries relative to “study” industry
Clearly define geographic boundaries and units of observationo Define the “local economy” and geographyo Estimate percentage of expenditures made within study areao Define terms and explain what is included in definition
Plan for direct impact estimateso Clearly define and document model inputs o Use credible and accepted data sources o Use up-to-date data and impact modelso Modify model data, as applicable
Identify objectiveso Understand the role of agency in generating the studyo Identify agency’s plans for using the studyo Establish outcomes needed to meet agency’s goalso Advise agency on additional needed research
Develop clear implementation plan
o Knowledgeable & qualified staff o Clear timeframe o Sufficient funds and other resources o Project plan
Document assumptionso Make reasonable assumptions o Clarify and justify assumptionso Indicate clearly the degree of dependence on assumptions
Develop results that are understandable, accessible, and useable to client and publico Explain results in an understandable mannero Present results in a format useful to the client o Provide executive summary of project
Virginia Economic Impact Research Consortium Model

Virginia’s Aerospace Industry | 5
outreach and connect space companies and communities, the Virginia Department of Aviation commissioned this economic impact analysis of the aerospace industry.
2.1. ECONOMIC IMPACT RESEARCH CONSORTIUM
This project included a concurrent effort to gather and develop standards for research methodology that could be applied to fu-ture economic impact studies. The benefits of a standard ap-proach include clear definitions for important assumptions, a higher level of data integrity, and cost savings.
The Economic Impact Research Consortium (EIRC) Model, de-veloped and refined during the spring of 2010, was led by the Performance Management Group at Virginia Commonwealth University in collaboration with economists from the following agencies and universities who took part in the con-sortium meeting: Col-lege of William & Mary, George Mason University, Old Dominion Univer-sity, University of Virgin-ia, Virginia Department of Planning & Budget, Virginia Economic De-velopment Partnership, Virginia Employment Commission, and Vir-ginia Tech (See Appendix 1 for a list of participating economists). The EIRC Model economic impact analysis procedures shown in the table on the oppo-site page were adhered to for this economic impact analysis of the Virginia aerospace industry.
2.2. INDUSTRY DEFINITION
The federal government classifies firms into indus-tries for statistical purpos-es based on the process by which the product or ser-vice is created. Under the North American Indus-try Classification System
(NAICS), for example, goods that are manufactured are in one sector while the transmission of information via satellite is in another sector. Oftentimes, there is an interest in industries that crossover more than one NAICS sector. High-technology indus-tries are one such example. Aerospace, the topic of this report, is another example. Consequently, defining the aerospace industry is required before beginning the analysis. There is no standard definition for the aerospace industry. Many states, such as Alabama, California, and Texas, have conducted economic impact studies of their aerospace industries. Appendix 2 provides a table of the NAICS codes represented in each of these studies. None of the studies, however, provide a nationally standardized or recognized definition for the aerospace industry.
The state studies basically used two approaches to identify the aerospace industry: company-based and industry-based. The first approach attempts to identify companies (or the division of
Table 2.1: NAICS Industries that Compose the Aerospace Industry
NAICS Industry
Virginia Definition (Excluding Airports)
Aerospace Industry
Association
Federal Avia-tion Adminis-tration: Com-mercial Space Transportation
U.S. Department of
Commerce: Aerospace Workforce
339113 Surgical Appliance and Supplies Manufacturing* ü
334220 Radio and Television Broadcast-ing and Wireless Communication Equipment
ü ü
334511 Search, Detection, Navigation, Guidance, Aeronautical, and Nautical System and Instrument Manufacturing
ü ü ü
336411 Aircraft Manufacturing ü ü
336412 Aircraft Engine and Engine Parts Manufacturing ü ü
336413 Other Aircraft Parts and Auxiliary Equipment Manufacturing ü ü
336414 Guided Missile and Space Vehicle Manufacturing ü ü ü ü
336415 Guided Missile and Space Vehicle Propulsion Units ü ü
336419 Other Guided Missile and Space Vehicle Parts and Auxiliary Equipment
ü ü ü
481212 Nonscheduled Chartered Freight Air Transportation ü
517410 Satellite Telecommunications ü
513220 Cable and Other Programs Distribution ü
541370 Surveying and Mapping (Except Geophysical) ü
927110 Space Research and Technology ü ü
*This sector includes the manufacturing of personal industrial safery devices, which includes space suits.

6 | November 2010
a company) that create aerospace products or services. Surveys are necessary for an accurate assessment. Within Virginia, for example, Northrop Grumman has offices in Northern Virginia that produce search detection, navigation, guidance, aeronauti-cal, and nautical system and instrument products, which can be considered part of the aerospace industry, while Northrop Grumman’s Norfolk shipyard is not directly connected to aero-space. Both Alabama and Colorado used this approach. Sur-veys are costly, time-consuming, and need to be updated over time. In addition, this approach makes regional comparisons difficult because of the survey-based nature of the definition.
The alternative approach is to identify a list of NAICS codes that define the overall aerospace industry. Under this approach, all companies incorporated with these NAICS codes are used in the economic impact analysis. Ohio and Texas, for example, used the NAICS approach. This approach allows comparisons across regions and states because of its standard definition.
Oftentimes, trade associations or federal government agencies identify an industry using the NAICS approach because of its broad view across states. For that reason, trade associations and federal agencies were contacted to obtain their definitions of aerospace which are shown in Table 2.1. (See Appendix 3 for a description of each NAICS code.) However, these institutions often have a mission that drives their definition. The mission of the Aerospace Industries Association of America (AIA), Inc. is to shape “public policy that ensures the U.S. aerospace, defense, and homeland security industry remains preeminent and that its members are successful and profitable in a changing global market.”5 The Federal Aviation Administration (FAA) study in 2006 focused on the economic impact only of commercial space transportation.6 More recently, the U.S. Department of Com-merce defined aerospace for the purpose of assessing workforce needs. Only one industry, guided missile and space vehicle man-ufacturing, is in all three definitions.
The purpose of the Virginia definition—to be used in this re-port—is to define aerospace in a broad manner while excluding airport operations.7 The economic impact of airport operations for the 66 Commonwealth airports will be calculated in a sepa-rate study. The Virginia definition most closely resembles that of the AIA. Four industries were included in the FAA or Com-merce Department definitions but were not included in the Vir-ginia definition for the reasons that follow:
• Radio and Television Broadcasting and Wireless Communication Equipment - although GPS equip-ment is included, as it is a small percentage of the total.
5 Source: http://www.aia-aerospace.org/about_aia/mission/ accessed on Au-gust 9, 2010.6 Federal Aerospace Administration, “The Economic Impact of Commercial Space Transportation on the U.S. Economy: 2004,” February 2006.7 Nonscheduled chartered freight transportation was determined to be part of airport operations.
• Nonscheduled Chartered Freight Air Transportation - includes travel by spacecraft but it is a small percentage of the total.
• Cable and Other Programs - this NAICS code no lon-ger exists in the 2007 classification system.
• Surveying and Mapping (Except Geophysical) - in-cludes mapping from the air but it is a small segment of the total.
2.3. REGION DEFINITIONS
The economic impacts of the aerospace industry in this report are measured for Virginia in aggregate, as well as for each of Virginia’s eleven metropolitan statistical areas (MSAs) defined below.8
8 The impact of the MSAs will not sum to the state total due to the impacts from the aerospace industry in the non-MSA localities in Virginia.
Table 2.2: Virginia MSA Definitions Blacksburg MSA Newport News Richmond MSA
Giles Norfolk Amelia
Montgomery Poquoson Caroline
Pulaski Portsmouth Charles City
Radford Suffolk Chesterfield
Bristol MSA Virginia Beach Cumberland
Scott Williamsburg Dinwiddie
Washington Lynchburg MSA Goochland
Bristol Amherst Hanover
Charlottesville MSA Appomattox Henrico
Albemarle Bedford County King And Queen
Fluvanna Campbell King William
Greene Bedford City Louisa
Nelson Lynchburg New Kent
Charlottesville Northern Virginia MSA Powhatan
Danville MSA Arlington Prince George
Pittsylvania Clarke Sussex
Danville Fairfax County Colonial Heights
Harrisonburg MSA Fauquier Hopewell
Rockingham Loudoun Petersburg
Harrisonburg Prince William Richmond City
Hampton Roads MSA Spotsylvania Roanoke MSA
Gloucester Stafford Botetourt
Isle Of Wight Warren Craig
James City Alexandria Franklin County
Mathews Fairfax City Roanoke County
Surry Falls Church Roanoke City
York Fredericksburg Salem
Chesapeake Manassas Winchester MSA
Hampton Manassas Park Frederick
WinchesterSource: U.S. Census

Virginia’s Aerospace Industry | 7
2.4. ECONOMIC IMPACT METHODOLOGY
Figure 2.1 illustrates the conceptual framework for the econom-ic impact analysis of the aerospace industry which includes the direct, indirect, and induced impacts in Virginia and its metro-politan statistical areas.
The total employment (number of workers) and output (sales) of all companies in the aerospace industries represent the direct impact of the industry in Virginia and its MSAs. The number of workers in the aerospace industry is based on data from the Quarterly Census of Employment and Wages (QCEW),9 while direct sales are derived from the average output for the industry from IMPLAN Pro10 software. A key assumption for the out-put is based on the number of employees.11 Furthermore, the
9 Source: Virginia Employment Commission.10 IMPLAN Professional is an economic impact assessment modeling sys-tem developed by the Minnesota IMPLAN Group that is often used by econo-mists to build economic models that estimate the impact of industries or eco-nomic changes in local economies. The IMPLAN model tracks total industry output and employment for each industry in each state. The average output per worker was used in this study to estimate total industry output.11 The IMPLAN output per worker is adjusted with average wages from QCEW to reflect the 2009 situation.
total economic impact from aerospace industries includes the ripple effects.
The economic ripple effects that are captured and categorized in this report are the indirect and induced impacts that measure the secondary benefits generated by the aerospace industry. The indirect impacts are increased sales and employment that oc-cur for the local businesses that sell supplies and services to the aerospace industries. The induced impacts are the increased sales and employment that occurs in the local communities as a re-sult of employees in the aerospace industry spending their wages and salaries. The benefactors of the induced impacts are primar-ily consumer-related businesses such as retail stores, restaurants, and hospitals. The indirect and induced effects are estimated with IMPLAN Pro software after the direct impacts are identi-fied. (See Appendix 4 for an impact study glossary.)
Figure 2.1: Economic Impact Conceptual Framework

8 | November 2010
The aerospace industry ranks among the nation’s largest manu-facturing industries in terms of employment and output. Mass production of airplanes did not begin until World War I in August 1914.12 Less than a year later, on March 3, 1915, the National Advisory Committee for Aeronautics (NACA) was founded to undertake, promote, and institutionalize aeronautics research. Under the NACA, Langley Research Center in Hamp-
12 “The History of the Aerospace Industry,” http://eh.net/encyclopedia/ar-ticle/bugos.aerospace.industry.history. Accessed on August 10, 2010.
ton, Virginia was established as the first civilian aeronautics laboratory in the nation.13 NACA was dissolved and its assets transferred to the National Aeronautics and Space Administra-tion (NASA) when it was created in 1958.
The U.S. aerospace industry employed 677,393 non-military people in 2009, but had declined by 14,459 (-2.1%) since 2008.
13 Source: http://www.nasa.gov/centers/langley/research/index.html, ac-cessed on August 10, 2010.
3. THE AEROSPACE INDUSTRY
Table 3.1: State Rankings by Employment for the Aerospace Industry*
2009 2008 2008 to 2009 ChangeEmployment Rank 2008 Rank Number Percentage
California 119,684 1 125,320 1 -5,636 -4.5
Texas 61,679 2 61,538 2 141 0.2
Kansas 38,431 3 44,380 3 -5,949 -13.4
Florida 29,749 4 31,030 4 -1,280 -4.1
Arizona 25,262 5 23,583 5 1,679 7.1
Georgia 19,763 6 19,649 7 114 0.6
Ohio 19,099 7 19,901 6 -803 -4.0
New York 17,320 8 17,712 9 -391 -2.2
Connecticut 17,173 9 18,617 8 -1,444 -7.8
Maryland 15,360 10 12,261 12 3,099 25.3
Alabama 14,121 11 13,684 10 438 3.2
Washington 11,519 12 13,041 11 -1,522 -11.7
Massachusetts 10,439 13 10,772 13 -332 -3.1
Pennsylvania 9,408 14 9,144 15 264 2.9
New Jersey 9,050 15 9,422 14 -373 -4.0
Virginia 9,029 16 8,663 17 366 4.2
Indiana 8,592 17 8,721 16 -129 -1.5
Illinois 5,620 18 5,564 19 56 1.0
Oklahoma 5,416 19 6,152 18 -735 -12.0
Michigan 5,073 20 5,469 20 -396 -7.2
North Carolina 3,970 21 4,076 21 -106 -2.6
Missouri 3,653 22 3,564 24 88 2.5
Minnesota 3,447 23 3,725 22 -278 -7.4
Colorado 3,439 24 3,629 23 -190 -5.2
Oregon 2,946 25 3,151 25 -205 -6.5
Utah 2,429 26 2,519 26 -90 -3.6
South Carolina 1,543 27 991 33 552 55.7
Arkansas 1,421 28 1,494 28 -73 -4.9
Tennessee 1,381 29 1,515 27 -134 -8.8
District of Columbia 1,314 30 1,185 30 129 10.9Sources: Chmura Economics & Analytics and U.S. Bureau of Labor Statistics
*Note: Employment by state is understated in most states because employment for 6-digit NAICS are not disclosed when there are less than 3 firms in that classification in the state or one firm accounts for 80% or more of employment in that particular NAICS code.

Virginia’s Aerospace Industry | 9
The decline is not surprising in light of the recession. Califor-nia ranked first among the states in 2009, employing 119,684 people, or a quarter of the nation’s aerospace industry. It shed 5,636 aerospace jobs or 4.5% of its employment over the last year. Texas follows California with about half the number of aerospace jobs, and Kansas follows Texas with about 40% less aerospace employment than the second-ranked state.
Virginia ranked 16th among the states in aerospace employment with 9,029 workers in 2009. New Jersey ranked 15th with 21 more aerospace jobs than Virginia. Massachusetts and Pennsyl-vania ranked in the two positions above New Jersey with only slightly higher aerospace employment.
Unlike the nation, the Virginia aerospace industry expanded in 2009 for a gain of 4.2% or 366 jobs. Massachusetts shed 332 aerospace jobs during the same period, and New Jersey decreased by 373 workers. Pennsylvania expanded its aerospace industry by 264 jobs in 2009.
3.1. THE AEROSPACE INDUSTRY IN VIRGINIA
Although Virginia’s aerospace footprint ranks it 16th in the na-tion, its space research and technology industry holds a clear competitive advantage for the Commonwealth with four times the concentration of employment as compared to the national average (as shown in its location quotient14 which is greater than 4.0). This is not surprising in light of the notable firsts for Vir-ginia’s aerospace industry: Langley Air Force Base (AFB) was de-signed for air domination during World War I which eventually led to its acquisition by the Aviation Section of the U.S. Army Signal Corps in December 1916. A portion of Langley Field was set aside for use by the National Advisory Council for Aeronautics to study the problems of flight. This site, known today as NASA Langley Research Center, is the nation’s first civilian aeronau-tics laboratory and NASA’s original field center. In addition, the NASA Goddard Space Flight Center’s Wallops Flight Facility was created in 1945 as a center for aeronautics research on Virginia’s Eastern Shore. Over a quarter of the state’s aerospace industry employment is in the space research and technology subsector.
14 The location quotient (LQ) is a measure of the relative size of an industry in a region compared to the average size in the nation. An LQ of 1.0 indicates an industry is the same size in the region as is average in the nation; an LQ of 2.0 means the industry is twice as large in the region compared to average; and an LQ of 1/2 indicates the industry is half as large regionally as average in the nation. The location quotient for an industry identifies the degree to which the industry specializes in or is concentrated in a region. With an LQ of 1.25 or higher, a region is considered to possess a competitive advantage in that indus-try. Firms in a specific industry often aggregate because of some competitive advantage found in an area such as geographic location, natural resources, and human resources. (A region can have a competitive advantage in a growing or declining industry.) Mathematically, the location quotient is the ratio of an industry’s share of total employment within the region to the same industry’s share of employment in the nation.
As previously stated, Virginia’s aerospace economy has enjoyed an increase in the presence and investments by private firms manufacturing aerospace equipment and supplies (e.g. Rolls Royce, Orbit Sciences Corporation, and General Dynamics). The investments in these industries come at a time when many mature industries are declining both nationally and in the state.
In 1995, the Virginia General Assembly created the Virginia Commercial Space Flight Authority (VCSFA). The Authority’s mission includes commercial space flight development, human space flight, aerospace research, and economic development. The Authority created the Mid-Atlantic Regional Spaceport (MARS). VCSFA is one of only four rocket launching organiza-tions licensed by the FAA to send rockets into orbit (the other three are Kennedy Space Center in Florida; Vandenberg AFB, California; and the Alaska Aerospace Corp. in Kodiak, Alaska).
MARS is a commercial spaceport, operating with a Space Act Agreement at NASA Wallops Flight Facility on Virginia’s East-ern Shore. Virginia’s General Assembly has been quite aggressive in providing incentives to the commercial sector to launch from MARS, by adopting ‘zero gravity, zero tax’ legislation; sales tax exemptions, and limiting liability for human space flights from MARS. Partially due to this, Orbital Sciences Corporation chose MARS over Florida as the launch site for the demonstration of its new Taurus II rocket, which will, among other things, resup-ply the international space station. Beginning in 2011, commer-cial operations to the International Space Station will commence from MARS under a $1.9 billion dollar NASA contract to Or-bital Sciences Corporation for eight resupply missions.
The aerospace industry is part of a growing integrated cluster of industry sectors, buyers, and suppliers that have a shared mar-ketplace and workforce. The economic benefits to the economies of the Commonwealth and its eleven MSAs are provided in the remainder of this report. The Virginia aerospace industry employed 9,029 workers on av-erage in 2009. These workers and their output make up the di-
Table 3.2: Top 10 Aerospace Employers in Virginia, 4th Quarter, 2009Raytheon Company
NASA
Orbital Sciences Corporation
Northrop Grumman Corp.
General Dynamics Armament
Tamsco
Aerojet General Corp.
Baysys Technologies, LLC
Lockheed Martin Operations Support, Inc.
Triumph Aerospace SystemsSource: Virginia Employment Commission and Chmura Economics & Analytics

10 | November 2010
rect impact from the aerospace industry. Total wages and salaries for the 9,029 Virginia aerospace workers in 2009 were $897.4 million or an average of $99,385 per worker.
The aerospace industry in Virginia reaches all parts of the state due to the dispersed locations of its firms. As shown in Figure 3.1, three MSAs stand out as having the largest aerospace work-force in Virginia. Northern Virginia (NOVA) alone accounted for more than 50% of employment (over 4,000 jobs) in the aero-space industry in 2009. Hampton Roads (HR) ranked second with over 2,000 workers while Charlottesville ranked third with over 500 employed. Together, these three regions accounted for over 85% of all aerospace jobs in Virginia. Looking beyond the top three MSAs, many fewer aerospace jobs are found in the other metro areas in the state. In fact, there is no direct aero-space employment in the Blacksburg, Roanoke, or Winchester MSAs. In addition, 13.8% or 1,244 of the total aerospace jobs are located outside the eleven metropolitan areas in rural Vir-ginia localities.
3.2. OVERALL EMPLOYMENT AND WAGES
The size of the aerospace industry in Virginia, as measured by total employment, amounted to 9,029 in 2009. The industry employment peaked at 9,822 in 2001 and fell to a low of 8,567 in 2003.15 Despite the recession, the aerospace industry in Vir-ginia added 366 jobs from 2008 to 2009 after shedding 121 jobs between 2007 and 2008 as the recession began its peak descent. From 2000 to 2009, jobs in aerospace grew at an an-nual rate of 0.4% (Figure 3.3). Meanwhile, overall employment in Virginia expanded steadily over the same period, growing an
15 From 2002 to 2003, two guided missile manufacturers ceased their op-erations in Virginia, both of them in Fairfax County, causing a sharp decline in industry employment. Taken together, these two firms employed over 1,300 workers in 2002.
8,708
9,822 9,780
8,5679,297 9,522
8,972 8,784 8,6649,029
0
2,000
4,000
6,000
8,000
10,000
12,000
2000 2001 2002 2003 2004 2005 2006 2007 2008 2009
Figure 3.2: Virginia Aerospace Employment
Source: Virginia Employment Commission
-15%
-10%
-5%
0%
5%
10%
15%
2001 2002 2003 2004 2005 2006 2007 2008 2009
Aerospace Industry
Total Industry
Figure 3.3: Annual Employment Growth, Virginia
Source: Virginia Employment Commission
Winchester: 0
Northern Virginia: 4,000-
5,000
Richmond: 10-50
HamptonRoads: 2,000-
3,000
Charlottseville: 500-1,000
Lynchburg: <10
Danville: <10
Roanoke: 0
Blacksburg: 0
Bristol: <10
Harrisonburg: 10-50
Figure 3.1: Aerospace Employment in Virginia MSAs, 2009
Source: Virginia Employment Commission

Virginia’s Aerospace Industry | 11
average 0.4% per year. In 2009, 0.3% of Virginia workers were employed in the aerospace industry.
Virginia’s aerospace industry pays much higher than the state’s average wage (Figure 3.4). In 2009, the average wage in Virginia’s aerospace industry was $99,385, double the state’s average wage of $48,334 per year. Not only was the aerospace wage higher than the state average, it has also been growing at a faster pace for the last decade. From 2000 to 2009, wages in Virginia’s aero-space industry grew an average 6.0% per year in nominal terms, much faster than the 3.6% growth in overall average wages.
The aerospace industry provides advanced and sophisticated products and services. It employs a highly skilled workforce with high education requirements. Therefore, it is not surprising that the average wage in this industry is much higher than the state average.
The relatively higher wages paid to aerospace industry em-ployees in Virginia have im-portant implications for the economic ripple effects, espe-cially the induced impacts. The higher average wages indicate that aerospace employee wag-es have a larger multiplier for induced impacts that support jobs among consumer-related establishments such as retail and restaurants.
3.3. EMPLOYMENT AND WAGES DETAILS
Among all of the 6-digit NAICS industries that make up the total aerospace footprint in Virginia, the largest in terms of em-ployment is search, detection, navigation, guidance, aeronauti-cal, and nautical system and instrument manufacturing (NAICS 334511); this sector had 3,393 employees in 2009 (Table 3.3). Other 6-digit industries with sizable employment in 2009 were space research and technology (over 2,000 jobs), guided missile and space vehicle manufacturing (over 1,500 jobs), other aircraft parts and auxiliary equipment manufacturing (over 500 jobs), aircraft manufacturing (496 jobs), and satellite telecommunica-tions (428 jobs).
There are also large variations in average wages among the nine aerospace industries in Virginia, even though all pay higher wag-es than the state average. For example, average wages for search, detection, navigation, guidance, aeronautical, and nautical system and instrument manufacturing (NAICS 334511) were $104,334 per year in 2009. Average wages were over $90,000 for NAICS 927110 space research and technology and $140,930 for NAICS 517410 satellite telecommunication. The average wages for NAICS 336413 other aircraft parts and auxiliary equipment manufacturing were at the low end of the spectrum in 2009, but were still over $50,000 per year. Among the largest occupations (by employment size) for the aerospace industry are high-wage, skilled occupations such as aerospace, mechanical, and comput-er software engineers. The aerospace industry, however, also em-ploys large numbers of lower skilled and lower wage occupations such as team assemblers and electrical and electronic equipment assemblers.
$0
$20,000
$40,000
$60,000
$80,000
$100,000
$120,000
2000 2001 2002 2003 2004 2005 2006 2007 2008 2009
All Industries
Aerospace
Figure 3.4: Average Annual Wages, Virginia
Source: Virginia Employment Commission
Table 3.3: Virginia Aerospace Industry Employment and Wages (2009) Six-Digit NAICS Aerospace Industries Employment Average Wages
Aircraft Engine and Engine Parts Manufacturing 45 $77,859
Aircraft Manufacturing 496 $74,505
Guided Missile and Space Vehicle Manufacturing >1,500 >$100,000
Guided Missile and Space Vehicle Propulsion Unit and Propulsion Unit Parts Manufacturing
>100 >$70,000
Other Aircraft Parts and Auxiliary Equipment Manufacturing >500 >$50,000
Satellite Telecommunications 428 $140,930
Search, Detection, Navigation, Guidance, Aeronautical, and Nautical System and Instrument Manufacturing
3,393 $104,334
Space Research and Technology >2,000 >$90,000
Total Aerospace Industry 9,029 $99,385
Total All Industry 3,534,840 $48,334
Note: A range of employment indicates that the exact employment number is non-disclosed. Source: Virginia Employment Commission

12 | November 2010
4.1. ECONOMIC IMPACT OF AEROSPACE ON THE STATE
The aerospace industry in Virginia contributed a total economic impact (direct, indirect, and induced) of $7.6 billion annually (in 2009 dollars) and supported 28,110 jobs in Virginia (Table 4.1).16 In terms of direct impact, this industry employed 9,029 workers in 2009 and is estimated to produce $4.3 billion in an-nual gross revenue. Indirect impacts of $1.8 billion annually and 8,934 additional jobs are generated by the aerospace industry, benefitting the Virginia-based businesses supporting aerospace in the state—examples of these industries are aircraft parts and equipment manufacturing, tire manufacturing, and computer systems design. Without the aerospace industry, these businesses would see reduced revenue and jobs. The induced impact from aerospace is derived from the purchases that aerospace employ-ees make as consumers in Virginia, with the benefactors being largely the restaurants, doctor’s offices, and retail establishments close to the aerospace facilities. The num-ber of jobs created from the induced impact amounted to 10,147 in 2009 with associ-ated sales of $1.5 billion.
Table 4.1 indicates that each job in the aero-space industry can support 2.11 additional jobs elsewhere in Virginia. The employment 16 IMPLANPro® models were used to simulate the ripple economic impacts of the aerospace industry in Virginia.
multiplier17 for this industry is higher than that for the aver-age Virginia industry which stands at 0.71. This means that 100 aerospace jobs can support 140 more jobs than can 100 jobs in the average Virginia industry.18 The reasons for higher employ-ment multipliers for the aerospace industry are twofold. First, the aerospace industry is complex and sophisticated, requiring many specialized parts and services for its operation. This en-ables Virginia’s aerospace industry to establish extensive links with other industries in Virginia, boosting the indirect impact. Second, the aerospace industry pays higher wages than the aver-age Virginia industry, allowing workers to earn more disposable income which in turn boosts the induced impacts in Virginia.
To put the economic impact of the Virginia aerospace industry in perspective, total employment in Virginia19 was 3.5 million in 2009. The aerospace industry’s direct, indirect, and induced jobs totaled 28,110, or 0.8% of total state employment. Meanwhile,
17 The employment multiplier of an industry measures the additional jobs created by one job in the aerospace industry.18 140 = (100 * 2.11) – (100 * 0.71).19 Source: Virginia Employment Commission.
4. ECONOMIC IMPACT OF AEROSPACE IN VIRGINIA
Table 4.1: Annual Economic Impact of Aerospace Industry on Virginia, 2009Spending Impact ($Millions) Employment Impact
Direct Indirect Induced Total Direct Indirect Induced TotalSearch, Detection, Navigation, Guidance, Aero-nautical, and Nautical System and Instrument Manufacturing
$1,659.8 $753.8 $631.7 $3,045.3 3,393 3,723 4,458 11,573
Aircraft Manufacturing $429.3 $103.3 $72.0 $604.6 496 669 699 1,863
Aircraft Engine and Engine Parts Manufacturing $35.4 $11.3 $7.4 $54.1 45 63 55 163
Other Aircraft Parts and Auxiliary Equipment Manufacturing
$327.5 $149.7 $92.9 $570.1 >500 938 817 >2,255
Guided Missile and Space Vehicle Manufacturing $931.7 $396.1 $320.3 $1648.2 >1,500 2,646 2,316 >6,462
Guided Missile and Space Vehicle Propulsion Unit and Propulsion Unit Parts Manufacturing
$46.1 $14.4 $16.4 $76.9 >100 79 126 >305
Other Guided Missile and Space Vehicle Parts and Auxiliary Equipment Manufacturing
$0.0 $0.0 $0.0 $0.0 0 0 0 0
Satellite Telecommunications $482.6 $277.2 $128.6 $888.4 428 676 536 1,639
Space Research and Technology $401.7 $47.5 $251.6 $700.9 >2,000 140 1,141 >3,281
Total $4,314.0 $1,753.4 $1,521.0 $7,588.4 9,029 8,934 10,147 28,110
Note: Figures may not sum due to rounding.Source: Chmura Economics & Analytics and IMPLAN 2008
Table 4.2: Aerospace Impact in Perspective (2009)
Aerospace Industry Virginia
Aerospace as a Percentage of All
Industry in VirginiaTotal Employment Impact 28,110 3,534,840 0.8%
Total Spending Impact ($Billions) $7.6 $404.3 1.9%Source: Chmura Economics & Analytics

Virginia’s Aerospace Industry | 13
the estimated gross state product (GSP) of Virginia was $405.6 billion in 2008.20 The total economic impacts of the aerospace industry, at $7.6 billion in 2009, accounted for 1.9% of the Vir-ginia GSP.21 With 0.8% of employment contributing 1.9% of the GSP, the aerospace industry is much more productive than the average industry in Virginia.
4.2. ECONOMIC IMPACT BREAKDOWN BY SUB-INDUSTRIES
Table 4.1 details the economic impact of each of the nine in-dustries that make up the aerospace industry in Virginia. The industry with the largest impact is NAICS 334511, search, de-tection, navigation, guidance, aeronautical, and nautical system and instrument manufacturing. In 2009, this industry con-tributed total economic impacts (direct, indirect, and induced) of $3.0 billion and supported 11,573 jobs in Virginia. About 40% of the total economic impacts of the aerospace industry come from this sub-industry alone. Other sub-industries mak-ing the largest economic impacts in Virginia are guided missiles and space vehicle manufacturing, satellite telecommunications, space research and technology, aircraft manufacturing, and air-craft engine and engine parts manufacturing. The remainder of the 6-digit NAICS industries had considerably smaller impacts on the Virginia economy.
4.3. INDIRECT AND INDUCED IMPACT FROM THE AEROSPACE INDUSTRY
Many industries in Virginia benefit from the aerospace industry. Table 4.3 lists the top ten benefactors of the aerospace industry in terms of jobs created through the indirect impact. Industries essential for operations and production in the aerospace industry include professional and business services such as management (1,054 jobs in Virginia are supported by the aerospace industry’s indirect impact), wholesale trade (517 jobs), and employment services (434 jobs). Engineering, computer, and research firms in Virginia also benefit from the economic impact of the aero-space industry, including scientific research and development (291 jobs), architectural and engineering services (284 jobs), and computer systems design (275 jobs).
Table 4.3 displays the top ten industries that share 40% of the total indirect benefits from the aerospace industry in Virginia; more than 400 sectors share the remaining 60% of the indirect employment impacts.
20 Source: IMPLAN Pro Model 2008.21 The 2008 GSP is inflated to a 2009 figure based on the consumer price index before calculating this percentage.
Because induced effects are caused by the spending activities of aerospace industry workers, the biggest benefactors of the induced effects are businesses that provide consumer services. These beneficiaries include hospitals, doctor’s offices, restaurants, and retail establishments. Table 4.4 lists the top ten industries that benefit from Virginia’s aerospace industry by jobs created through induced impact. These include food services (679 jobs), health care (1,004 jobs for doctor’s offices and hospitals), and various retail sectors (such as grocery stores and car dealerships). The top ten sectors account for 34% of the total induced benefit, while the other 400 plus sectors share the remaining 66% of the induced benefit.
Table 4.3: Top 10 Beneficiaries of the Aerospace Industry, 2009 (Indirect Impact)
EmploymentManagement of companies and enterprises 1,054
Wholesale trade businesses 517
Employment services 434
Scientific research and development services 291
Architectural, engineering, and related services 284
Computer systems design services 275
Business support services 211
Telecommunications 185
Food services and drinking places 176
Real estate establishments 169
Total Top 10 Industries 3,596
Total Indirect Impact 8,934
Source: IMPLAN 2008
Table 4.4: Top 10 Beneficiaries of the Aerospace Industry, 2009 (Induced Impact)
EmploymentFood services and drinking places 679
Offices of physicians, dentists, and other health practitioners
579
Private hospitals 425
Real estate establishments 376
Wholesale trade businesses 324
Retail Stores - General merchandise 257
Retail Stores - Food and beverage 232
Nursing and residential care facilities 230
Retail Stores - Motor vehicle and parts 221
Private household operations 149
Total Top 10 Industries 3,472
Total Indirect Impact 10,147
Source: IMPLAN 2008

14 | November 2010
4.4. SUMMARY IMPACT OF AEROSPACE ON VIRGINIA’S METRO AREAS
The eleven Virginia MSAs receive various degrees of the eco-nomic impact of the aerospace industry. Table 4.5 details the economic impact on Virginia’s eleven metropolitan statistical areas. The Northern Virginia MSA accounts for the dominant share of the statewide economic impact. The total economic im-pact of the aerospace industry in the Northern Virginia MSA is estimated at $5.2 billion and over 14,000 jobs in 2009. The Hampton Roads and Charlottesville MSAs follow with the next-largest economic impacts from aerospace. In the Hampton Roads MSA, the impacts of aerospace are estimated at $816.2 million and over 3,000 jobs in 2009. In the Charlottesville MSA, the impacts of the aerospace industry are estimated at $621.2 mil-lion and over 2,000 jobs in 2009. Compared with the top three metros, the impact of the aerospace industry in the other metro areas is limited.
The MSAs where the aerospace industry has a large impact have different strengths in the aerospace industry. In the Northern Virginia MSA, the largest 6-digit aerospace industries are search, detection, navigation, guidance, aeronautical, and nautical sys-tem and instrument manufacturing; and guided missile and space vehicle manufacturing. By comparison, the largest 6-digit aerospace industry in the Hampton Roads MSA is space research and technology. The largest in the Charlottesville MSA is search, detection, navigation, guidance, aeronautical, and nautical sys-
tem and instrument manufacturing.22
The aerospace industry in Virginia directly em-ployed 9,029 workers and generated $4.3 bil-lion in economic out-put in 2009. The on-going operations from this industry also had ripple impacts through-out the state. The an-nual indirect impact is estimated at 8,934 jobs and $1.8 billion while the induced impact is estimated at 10,147 jobs and $1.5 billion in 2009. The total an-nual economic impact from the aerospace in-dustry is $7.6 billion and 28,110 jobs. In addition, the aerospace industry supports 0.8%
of total employment in Virginia but accounts for 1.9% of Vir-ginia’s gross state product (GSP); as such, the aerospace industry is more productive than the average industry in the state.
4.5. FISCAL IMPACT ON VIRGINIA
The state government can collect two taxes from the aerospace industry in Virginia: individual income taxes from wages and salaries generated by the aerospace industry, and corporate in-come taxes levied on the profits made by aerospace businesses.
The following methodology was utilized to estimate corporate and personal income taxes. The IMPLAN Pro model provides profit margins and the relative weight of wages and salaries in the total output of the aerospace industry. For example, IMPLAN Pro shows that profits account for 4.9% of the total output while wages and salaries account for 29.7% of total industry output in 2008. Moreover, the state corporate income tax rate is 6.0% of the profit, and the average personal income tax rate is 5.0% of the wages and salaries.23
Table 4.6 shows that the aerospace industry paid an estimated $57.5 million in tax revenue in 2009. The majority of state tax revenue comes from personal income tax amounting to $44.9
22 Please see Appendix 5 for the aerospace industry’s detailed MSA impact.23 Virginia has a progressive income tax rate. This is the tax rate for those individual making a medium income.
Table 4.5: Virginia MSA Economic Impact Summary Direct Indirect Induced Total
Bristol Spending ($Millions) $0.1 $0.0 $0.0 $0.1
Employment <10 0 0 <10
Charlottesville Spending ($Millions) $408.5 $126.1 $86.6 $621.2
Employment 500-1,000 759 678 1,938-2,438
Danville Spending ($Millions) $5.1 $0.5 $0.4 $6.0
Employment <10 5 4 10-19
Harrisonburg Spending ($Millions) $12.0 $2.1 $1.0 $15.2
Employment 10-50 15 9 34-74
Hampton Roads Spending ($Millions) $523.6 $86.6 $206.1 $816.2
Employment 2,000-3,000 487 1,154 3,641-4,641
Lynchburg Spending ($Millions) $3.4 $0.7 $0.2 $4.3
Employment <10 5 2 7-17
Northern Virginia Spending ($Millions) $3,150.1 $1,246.2 $797.4 $5,193.8
Employment 4,000-5,000 5,252 4,892 14,144-15,144
Richmond Spending ($Millions) $12.6 $0.9 $0.6 $14.1
Employment 10-20 4 4 18-28
Virginia Spending ($Millions) $4,314.0 $1,753.4 $1,521.0 $7,588.4
Employment 9,029 8,934 10,147 28,110Note: Figures may not sum due to rounding.Source: Chmura Economics & Analytics and IMPLAN 2008

Virginia’s Aerospace Industry | 15
million per year, while the corporate income tax is estimated to total $12.7 million per year.
Among Virginia’s MSAs, Northern Virginia leads the state in its concentration of aerospace industries. In 2009, the aerospace industry generated an economic impact of $5.2 billion that sup-ported over 14,000 jobs in Northern Virginia. The Hampton Roads and Charlottesville MSAs have the next-largest presences of aerospace industry in the state.
4.6. AEROSPACE TOURISM
Aerospace tourism in Virginia is founded on the operation of museums, visitor centers, and gift shops associated with the es-tablished centers of aerospace activity around the state. These sites attract guests from within the state and abroad, bolstering the state’s economy through visitors’ purchases of merchandise and travel necessities. Virginia’s aerospace tourism assets include four major sites: the Smithsonian National Air & Space Muse-um’s Udvar-Hazy Center in Chantilly; the Virginia Air & Space Center in Hampton; the NASA Visitors Center Wallops Flight Facility on the Eastern Shore; and the Science Museum of Vir-ginia, Virginia Aviation Museum.
The Steven F. Udvar-Hazy Center opened in 2003 and currently includes the massive Boeing Aviation Hangar, the James S. Mc-Donnell Space Hangar, an observation tower, a 500-seat IMAX theater, three classrooms, and a museum shop. A second phase, including a restoration hangar, and archive and storage facilities, will be built when adequate funds are available.24
24 National Air and Space Museum. “Steven F. Udvar-Hazy Center.” Re-trieved from http://www.nasm.si.edu/udvarhazy/, September 9, 2010.
The two main exhibition han-gars total nearly 350,000 square feet, displaying over 300 large aircraft, spacecraft, and missiles. These include an SR-71 Black-bird, the Space Shuttle Enter-prise, a Concorde supersonic airliner, and the Gemini VII space capsule. The site accom-modated roughly 1,199,000 vis-itors throughout the 2009 fiscal year. Gross sales for 2009 were estimated at $8,288,000.
The Virginia Air & Space Center (VASC) is the visitor center for NASA Langley Research Cen-ter and Langley Air Force Base. It opened in 1992 and houses 110,000 square feet of exhibits
and activities, including a 3D IMAX theater, a hands-on space gallery, unique space flight artifacts, a carousel, amusement rides, and an interactive flight simulator.25
The Adventures in Flight gallery features 30 historic aircraft, in-cluding a DC-9 passenger jet, a B-24 Liberator, an F/A-18 Hor-net, and a Wright Flyer replica. As the region’s leading source of informal science education, VASC serves over 200,000 chil-dren annually with hands-on programs, demonstrations, and tours. Every summer, over 1,000 students attend VASC’s science camps. VASC attracted 412,815 visitors in 2008 and collected roughly $4,500,000 in gross sales during the fiscal year.
Established in 1945, Wallops is NASA’s primary facility for sub-orbital research programs. In addition to six rocket launch pads and a launch control center, the facility includes a research air-port and engineering facilities.
NASA’s recent decision to center suborbital launches at Wallops comes with the potential increase in touristic value. The esca-lated frequency by which NASA launches suborbital rockets is expected to attract spectators in numbers previously unseen in the past. The Wallops Flight Facility Visitor Center will be at the forefront in accommodating these visitors.
Currently, the visitor center includes several exhibits with scale models of rockets as well as full-size sounding rockets outdoors. An Educator Resource Center for teachers and group lead-ers offers supplemental educational resources for K-University curricula.26
25 Virginia Air and Space Center. “General Information.” Retrieved from http://www.vasc.org/, September 9, 2010.26 NASA Wallops Visitor Center. “Visiting NASA.” Retrieved from http://sites.wff.nasa.gov/wvc/, September 9, 2010.
Table 4.6: State Fiscal Impact ($Millions, 2009) Individual Income Tax
Corporate Income Tax Total
Search, Detection, Navigation, Guidance, Aeronautical, and Nautical System and Instrument Manufacturing
$17.7 $0.7 $18.4
Aircraft Manufacturing $1.8 $1.7 $3.6
Aircraft Engine and Engine Parts Manufacturing $0.2 $0.1 $0.3
Other Aircraft Parts and Auxiliary Equipment Manufacturing $2.2 $1.1 $3.3
Guided Missile and Space Vehicle Manufacturing $8.6 $1.1 $9.7
Guided Missile and Space Vehicle Propulsion Unit and Pro-pulsion Unit Parts Manufacturing
$0.5 $0.1 $0.7
Other Guided Missile and Space Vehicle Parts and Auxiliary Equipment Manufacturing
$0.0 $0.0 $0.0
Satellite Telecommunications $3.0 $6.9 $9.9
Space Research and Technology $10.8 $0.9 $11.7
Total $44.9 $12.7 $57.5 Source: Chmura Economics & Analytics and IMPLAN 2008

16 | November 2010
The newest asset to Virginia’s space tourism portfolio will be the launches of Orbital Sciences Corporation’s new Taurus II rocket to resupply the International Space Station (ISS). This 130-foot rocket will be launched from the Virginia Commercial Space Flight Authority’s Mid-Atlantic Regional Spaceport. The Virginia Tourism Corporation has been actively working with MARS and hospitality industry partners throughout the Del-marva region to determine how best to develop and capture the space tourism market for these launches.
Finally, the Science Museum of Virginia, Virginia Aviation Mu-seum houses thirty-seven historic aircraft, multiple flight simula-tors, and the 65-seat J.D. Benn Theater. Educational programs, tailored to students K-12, acknowledge the scientific and his-torical foundations of aviation. The museum also encompasses the Virginia Aviation Hall of Fame. Annual events include the Hall of Fame induction ceremony, various educational forums, and the Air Fair.
4.7. AEROSPACE EDUCATION
Virginia’s educational institutions are some of the aerospace in-dustry’s strongest assets. Three public universities offer under-graduate and graduate degrees in aerospace-related fields: Old Dominion University, University of Virginia, and Virginia Poly-technic Institute and State University (Virginia Tech). In recent years, Virginia Tech has ranked among the top three universities for recruiting aerospace workers as reported through an annual workforce survey conducted by the industry magazine, Aviation Week & Space Technology.
The Virginia Space Grant Consortium (VSGC) fosters a col-laborative atmosphere among the state’s colleges/universities, NASA, state agencies, and many of the state’s museum and re-search institutions. The VSGC is devoted to producing a skilled workforce to meet the demands of Virginia’s growing aerospace industry. Every year, the VSGC extends a number of scholar-ships, fellowships, and internships to science, technology, engi-neering, and mathematics students enrolled at VSGC partner universities, colleges, and community colleges. VSGC also offers student space flight programs.
The VSGC’s commitment to the future of aerospace research and engineering is further evidenced by their partnership with the NASA Langley Research Center and the Department of Education in the facilitation of the Virginia Aerospace Science and Technology Scholars program (VASTS). An educational program for high school juniors, VASTS consists of an interac-tive online program capped by a seven-day summer academy in which the scholars experience the day to day operations at NASA’s Langley Research Center in Hampton.27 The program
27 “About Virginia Aerospace Science and Technology Scholars.” Retrieved from http://www.vasts.spacegrant.org/about September 17, 2010.
has seen recent success with 347 participants in 2010, 138 of which attended the seven-day residential academy.
The National Institute of Aerospace (NIA) is a research and edu-cation institute in Hampton, Virginia. Formed by a consortium of research universities, NIA serves as a strategic partner of NASA and the Langley Research Center. NIA’s research programs span over many aerospace disciplines, including aeronautics, space ex-ploration technologies, planetary science, and space physics. The partnership between NIA and NASA allows students to pursue graduate degrees at NIA while conducting research at NASA Langley Research Center. Approximately 60 full-time and 25 part-time graduate students currently pursue master’s and doc-toral degrees at NIA, conducting their thesis and dissertation research at NASA Langley Research Center. NIA is also involved in aerospace education through undergraduate outreach, as well as public educational programs. In support of its mission, NIA employs approximately 100 engineers, scientists, postdoctoral fellows, and support staff along with approximately 15 faculty from NIA’s member universities.
In an effort to nurture young Virginians’ passion for the aero-space industry, the Virginia Space Flight Academy hosts mul-tiple installments of the Space Flight Adventure Camp through-out the summer months. Designed for children ages 11-15, the week-long, residential camps introduce students with an interest in space flight, rocketry, robotics, astronomy, and other aero-space sciences to the inner workings of the Wallops Flight Fa-cility. The Space Flight Adventure Camp has grown from one installment in 1998 to seven in the summer of 2010.28
Of the $1.124 billion in NASA grants to educational institu-tions nationwide during FY09, Virginia universities received just fewer than 2%. Old Dominion University, George Mason Uni-versity, Hampton University, Virginia Tech, and the University of Virginia received, in total, $20,489,492 in NASA grant fund-ing devoted to aerospace research and engineering.
4.8. INTELLIGENCE-RELATED AEROSPACE
In addition to a strong military presence, Virginia is home to a number of organizations within the U.S. Intelligence Commu-nity. Several have significant aerospace components, but details are, by necessity, often unavailable.
The National Reconnaissance Office (NRO) develops and oper-ates overhead intelligence systems for the Intelligence Commu-nity and policy makers. An unclassified FY10 budget justifica-tion obtained under the Freedom of Information Act included
28 Space Flight Adventure Camp. “Five-Day Residential Camps,” Virginia Space Flight Authority. Retrieved from http://www.vaspaceflightacademy.org/homepage.html October 22, 2010.
Virginia’s Aerospace Industry | 17
NRO funding for aerospace items such as launch vehicles, launch services, and launch vehicle system integration.29
According to NRO’s Human Resources of-fice, there are approximately 3,000 employ-ees at the National Reconnaissance Office’s headquarters in Chantilly. However, NRO has no employees of its own. NRO is jointly staffed by members of the armed services, Central Intelligence Agency, and DoD ci-vilian personnel. Presumably, none of these 3,000 personnel are included in the survey of military base commanders described be-low, since NRO headquarters is not a mili-tary base.
The Central Intelligence Agency’s headquar-ters are in Langley, near McLean. For securi-ty reasons, very little is published concerning the CIA’s operations, budget, and number of employees. Furthermore, the percentage of total employees which work in Virginia is also unknown.
For these reasons, it is especially difficult to draw conclusions about the CIA’s aero-space operations. Intelligence activities of-ten involve aerospace in the form of aircraft (manned and unmanned) and satellites (for both communications and imagery). Some number of CIA per-sonnel also perform aerospace work at NRO (see above). It is plausible that other CIA personnel work on aerospace-related tasks at the Langley headquarters. However, given the limita-tions on accessing information about CIA activities, these em-ployees are not included in this study.
4.9. MILITARY AEROSPACE
PMG felt it necessary to include a measure of military aerospace activities within the state. The purpose of this analysis was to de-termine total economic impact of the aerospace industry in or-der to better plan the Commonwealth’s promotion and support of the aerospace industry, including but not limited to tailoring workforce development in support of, and for, our returning veterans.
According to the Department of Defense’s Fiscal Year 2009 Atlas, the DoD employs almost 153,000 Virginians, representing the third highest total employment by state in the country.30 Since
29 National Reconnaissance Program. “FY 2010 Congressional Budget Jus-tification: Volume IV.” Retrieved from http://www.fas.org/irp/nro/fy2010cb-jb.pdf, September 9, 2010.30 Virginia National Defense Authority. “U.S. Department of Defense Eco-nomic Impact Data.” Retrieved from http://www.vndia.org/affectedbybrac.asp, September 27, 2010.
aerospace is an important and growing component of a modern military, its impact on the state economy should be included in a comprehensive view of the aerospace industry in Virginia. However, statistics are not available that identify the number of personnel related to military aerospace activities.
Consequently, PMG worked in close collaboration with VN-DIA to develop and distribute a survey of base commanders and public affairs officers at facilities with aerospace personnel. The survey offered a cohesive definition of “aerospace” and asked re-spondents to report on the number of uniformed, civilian, and contractor personnel on their base who fit the definition.
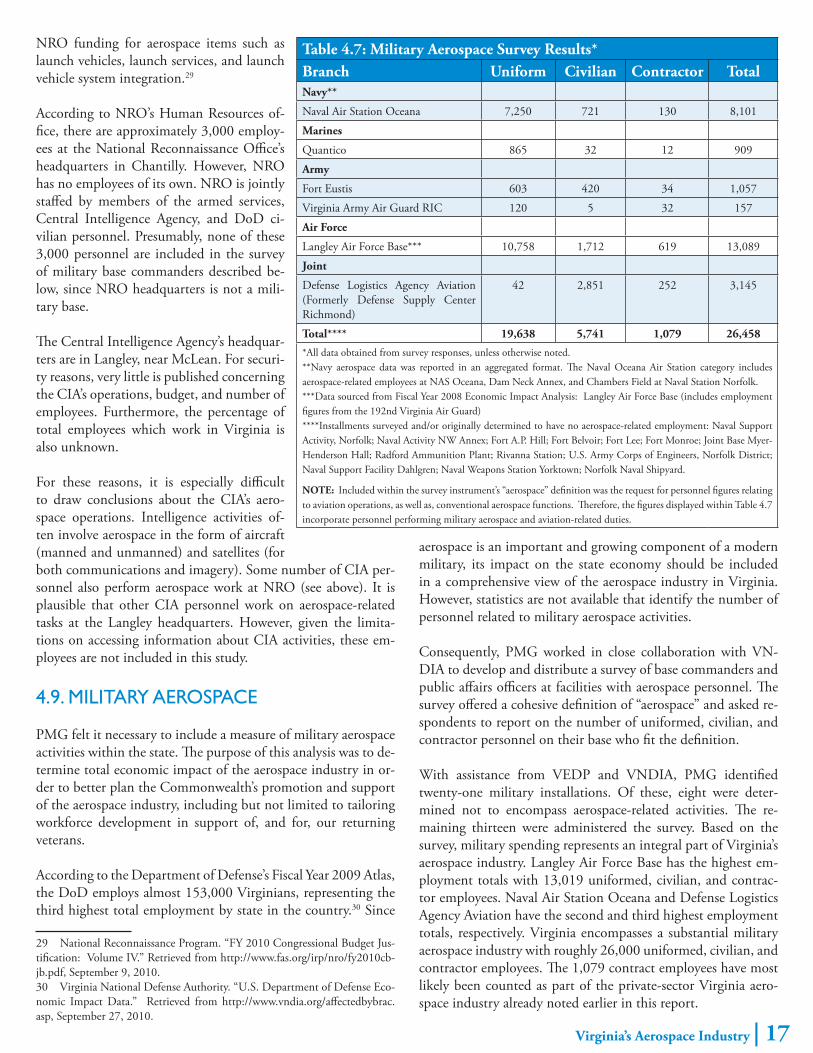
With assistance from VEDP and VNDIA, PMG identified twenty-one military installations. Of these, eight were deter-mined not to encompass aerospace-related activities. The re-maining thirteen were administered the survey. Based on the survey, military spending represents an integral part of Virginia’s aerospace industry. Langley Air Force Base has the highest em-ployment totals with 13,019 uniformed, civilian, and contrac-tor employees. Naval Air Station Oceana and Defense Logistics Agency Aviation have the second and third highest employment totals, respectively. Virginia encompasses a substantial military aerospace industry with roughly 26,000 uniformed, civilian, and contractor employees. The 1,079 contract employees have most likely been counted as part of the private-sector Virginia aero-space industry already noted earlier in this report.
Table 4.7: Military Aerospace Survey Results* Branch Uniform Civilian Contractor TotalNavy**
Naval Air Station Oceana 7,250 721 130 8,101
Marines
Quantico 865 32 12 909
Army
Fort Eustis 603 420 34 1,057
Virginia Army Air Guard RIC 120 5 32 157
Air Force
Langley Air Force Base*** 10,758 1,712 619 13,089
Joint
Defense Logistics Agency Aviation (Formerly Defense Supply Center Richmond)
42 2,851 252 3,145
Total**** 19,638 5,741 1,079 26,458
*All data obtained from survey responses, unless otherwise noted.**Navy aerospace data was reported in an aggregated format. The Naval Oceana Air Station category includes aerospace-related employees at NAS Oceana, Dam Neck Annex, and Chambers Field at Naval Station Norfolk.***Data sourced from Fiscal Year 2008 Economic Impact Analysis: Langley Air Force Base (includes employment figures from the 192nd Virginia Air Guard)****Installments surveyed and/or originally determined to have no aerospace-related employment: Naval Support Activity, Norfolk; Naval Activity NW Annex; Fort A.P. Hill; Fort Belvoir; Fort Lee; Fort Monroe; Joint Base Myer-Henderson Hall; Radford Ammunition Plant; Rivanna Station; U.S. Army Corps of Engineers, Norfolk District; Naval Support Facility Dahlgren; Naval Weapons Station Yorktown; Norfolk Naval Shipyard.
NOTE: Included within the survey instrument’s “aerospace” definition was the request for personnel figures relating to aviation operations, as well as, conventional aerospace functions. Therefore, the figures displayed within Table 4.7 incorporate personnel performing military aerospace and aviation-related duties.

18 | November 2010
APPENDIX 1: ECONOMIC IMPACT CONSORTIUM MEMBERS
Ms. Ann LangSenior Economist
Economic Information Services (EIS) divisionVirginia Employment Commission
Mr. Billy KinseyEconomist & Senior Researcher
Center for Public PolicyVirginia Commonwealth University
Dr. David FeldmanProfessor
Department of EconomicsUniversity Prof. for Teaching Excellence
College of William and Mary
Dr. Eric JensenProfessor
Department of EconomicsDirector, Thomas Jefferson Program in Public Policy
College of William and Mary
Mr. Guy KemmerlyVirginia NextGen Early Implantation Program Manager
Department of Aviation/NASA
Dr. James KirkleyProfessor of Marine Science
Virginia Institute of Marine ScienceCollege of William and Mary
Dr. Jeff AlwangProfessor
Dept of Agricultural and Applied EconomicsVirginia Tech
Dr. Bill ShobeDirector
Center for Economic and Policy Studies (CEPS)Weldon Cooper Center for Public Service
University of Virginia
Mr. Brian KrollSenior EconomistResearch Division
Virginia Economic Development Partnership
Ms. Eftila TanellariPh.D. Candidate
Dept of Agricultural and Applied EconomicsVirginia Tech
Dr. Gilbert YochumProfessor
Department of EconomicsOld Dominion University
Mr. Howard SandersonEconometrician
Center for Public PolicyVirginia Commonwealth University
Dr. James PeaseProfessor
Dept of Agricultural and Applied EconomicsVirginia Tech
Dr. John KnappSenior Economist
Center for Economic and Policy Studies (CEPS)Weldon Cooper Center for Public Service
University of Virginia

Virginia’s Aerospace Industry | 19
State Study Summary Industry DefinitionAlabama The Alabama Aerospace Industry
Economic Impact Survey for 2002. Mary S. Spann, Ph.D. Office of Eco-nomic Development. University of Alabama in Huntsville. September 2003.
Survey of a combined list of approximately 400 potential aerospace companies provid-ed by Economic Development Partnership of Alabama as well as a list of members of the Alabama Aerospace Industry Associa-tion. 203 companies retained for analysis. Federal government aerospace employment and payroll in Alabama was obtained from Public Affairs Offices at Redstone Arsenal, Maxwell/Gunter AFB and Fort Rucker.
General Manufacturing (SIC: 2823–3999; NAICS: 325211-333299)
Missile & Space Vehicle Parts Manufac-turing (SIC: 3764, 3769, 3795; NAICS: 336415,336419, 336992)
Aircraft Parts MRO & Manufacturing (SIC: 3724, 3728; NAICS: 336412, 336413)
Missile & Space Vehicle Manufacturing (SIC: 3671; NAICS: 336414)
Aircraft MRO (SIC: 3721; NAICS: 336411)
Engineering & R&D Services (SEC: 8711, 8731; NAICS: 41330, 1701)
Information Technology Services (Not provided)
Alaska The Economic Benefits of the Alas-ka Aerospace Development Corpo-ration. Northern Economics, Inc. Prepared for the Alaska Aerospace Development Corporation FY2008. 2009.
Economic Impacts of the Kodiak Launch Complex. Pershing J. Hill and Alexandra Hill. Institute of Social and Economic Research. University of Alaska Anchorage. 1996.
Economic Impact of the Alaska Aerospace. Development Corpora-tion on the Kodiak Island Borough and the State of Alaska. Brian Rog-ers, Bobby Wilken, and Jana Peirce for the Alaska Aerospace Develop-ment Corporation. 2005. (http://li-brary.state.ak.us/asp/edocs/2006/07/ocm70700200.pdf )
Annual study highlights the AADC’s con-tributions to the development of Alaska’s aerospace industry. Northern Economics, Inc., developed an Input-Output (I-O) Model via the IMPLAN program to high-light the direct and induced effects of the AADC’s regional and state spending.
Arizona Arizona Aerospace, Defense, and Avionics Industries Study. Angle Technology Group. February 2008.
The Economic Impact of Aviation in Arizona. SH&E, with Economic Development Research Group and Lee McPheters, ASU College of Busi-ness, for Arizona DOT, 2004.
A report concerned with the development of the Aerospace, Defense, and Avionics (ADA) industries within Arizona. The re-port lists specific strategies to build the in-dustries, with a focus on sustaining political consensus in the process.
The primary impacts of the various avia-tion sectors were identified through several sources: the Arizona Department of Eco-nomic Security (ADES), providing employ-ment and wages; a survey of airport manag-ers provided airport employment, operating budgets, and capital expenditures; 2002 and 2003 airport economic impact studies
Commercial Aviation and Airports:
Air Carriers (On/Off Airport), Air Cargo and Courier Agents, Airport Businesses
Ground Transportation, Government Ser-vices, Airport Administration, Airport Construction
APPENDIX 2: STATE AEROSPACE INDUSTRY DEFINITIONS

20 | November 2010
State Study Summary Industry Definitionconducted for the Flagstaff, Phoenix Sky Harbor, Deer Valley and Goodyear; avia-tion activity levels at the state’s public use airports; and the Arizona Office of Tour-ism (AOT), provided an estimate of annual spending by domestic and international airline.
The economic contribution of Arizona’s military air bases was based on the Eco-nomic Impact of Arizona’s Principal Mili-tary Operations (2002), prepared by The Maguire Company.
General Aviation:
Non-scheduled Carriers, Aircraft Sales and Service, Aerial Services, Government Services, Airport Administration, Airport Construction
Other Aviations Sectors:
Aerospace Manufacturing, Aviation Educa-tion, Air Travelers, Military Aviation
California Economic Impact of California Space Enterprise – Fact Sheet. Cali-fornia Space Authority. 2009 (http://www.californiaspaceauthority.org/images/pdfs/economic-impact-fact-sheet.pdf )
Space Industry’s Impact on the Cal-ifornia Economy – Executive Sum-mary. California Space Authority. 2009 (http://www.californiaspaceau-thority.org/images/pdfs/California-Space-Enterprise-Economic-Impact-Exec-Summary.pdf )
Cannot find report itself, compares CA to US and world in terms of share of “space market”…CA 40% of US “space market” and 21% of world “space market”. Con-cludes total economic impact of $76 bil-lion, 370,000 jobs and $19.4 billion in wages to CA.
Satellite Manufacturing, launch, satellite ser-vices, ground equipment manufacturing, and engineering services
Colorado Aerospace: Colorado Industry Clus-ter Profile. Colorado Space Coalition 2008 (http://www.spacecolorado.org/files/colorado-space/industry-over-view/Aerospace_2008_CO_031009.pdf )
The aerospace industry cluster includes companies that develop products and sys-tems for commercial, military, and space applications. Colorado’s aerospace compa-nies focus on a wide variety of areas, from research and development to the design and manufacture of guided missiles and space vehicles, satellites and other commu-nications equipment, and navigation and detection instruments. The companies in the aerospace industry cluster also produce planetary spacecraft and launch systems and provide mission support.
NAICS Code*, NAICS Description - SIC Code, SIC Description
331512 (P) Steel investment foundries - 3324-9901 Aerospace investment castings, ferrous mfg.
331524 (P) Aluminum foundries (except die-casting) - 3365-0201 Aerospace castings, aluminum mfg.
331528 (P) Other nonferrous foundries (ex-cept diecasting) - 3369-9901 Aerospace cast-ings, nonferrous: except aluminum mfg.
332111 (P) Iron & steel forging - 3462-05 Missile & ordnance forgings mfg.
332111 (P) Iron & steel forging - 3463-02 Nonferrous missile & ordnance forgings mfg.
332313 (P) Plate work mfg. - 3443-1104 Space simulation chambers, metal plate mfg.
332813 (P) Electroplating, plating, polish-ing, anodizing & coloring - 3471-0204 De-contaminating & cleaning of missile or satel-lite parts mfg.
332993 (P) Ammunition (except small arms) mfg. - 3483-0101 Arming & fusing devices for missiles mfg.
332993 (P) Ammunition (except small arms) mfg. - 3483-9910 Missile warheads mfg.

Virginia’s Aerospace Industry | 21
State Study Summary Industry Definition333314 (P) Optical instrument & lens mfg. - 3827 Optical instruments & lenses
334220 (P) Radio & television broadcasting & wireless communications equipment mfg. - 3663-9910 Space satellite communications equipment mfg.
334511 Search, detection & navigation in-strument mfg. - 3812 Search, detection, navigation, guidance
336414 Guided missile & space vehicle mfg. - 3761 Guided missiles & space vehicles
336415 Guided missile & space vehicle pro-pulsion unit & parts mfg. - 3764 Space pro-pulsion units & parts
336419 Other guided missile & space vehicle parts & aux. equipment mfg. - 3769 Space vehicle equipment NEC
339113 (P) Surgical appliance & supplies mfg. - 3842-0113 Space suits mfg.
423860 (P) Transportation equipment & supplies (except motor vehicle) merchant wholesalers - 5088-0300 Aircraft & space ve-hicle supplies & parts - wholesale trade
423860 (P) Transportation equipment & supplies (except motor vehicle) merchant wholesalers -5088-0305 Guided missiles & space vehicles - wholesale trade
423860 (P) Transportation equipment & supplies (except motor vehicle) merchant wholesalers - 5088-0307 Space propulsion units & parts – wholesale trade
517110 (P) Wired telecommunications car-riers- 4841-9905 Satellite master antenna systems services (smatv)
517410 (P) Satellite telecommunications - 4899-9902 Satellite earth stations
517919 (P) All other telecommunications - 4899-9905 Missile tracking by telemetry or photography
927110 Space research & technology - 9661 Space research & technology
927110 Space research & technology - 4789-9902 Space flight operations, except government
*(P) indicates that only part of the NAICS industry category is represented in the indus-try cluster definition.
Connecticut None at this time
Delaware None at this time
District of Columbia None at this time

22 | November 2010
State Study Summary Industry DefinitionFlorida Economic Impact of NASA In Flor-
ida FY 2008. NASA Office of the CFO at Kennedy Space Center. Flori-da (http://www.nasa.gov/centers/ken-nedy/pdf/318131main_economic-impact08.pdf )
An Evaluation of Florida’s Econom-ic Development Policy for the Space Industry: 1988 to 2000. Sue Gaines. Department of Urban and Regional Planning Florida State University, 2002. (http://www.coss.fsu.edu/durp/files/pdfs/research/MSP_02-01_Gaines.pdf )
Florida’s Aviation and Aerospace Market Brief. Enterprise Florida, Inc. 2008. Accessed from eflorida.com
Direct spending, commodity spending and visitor spending
A regionalized snapshot of Florida’s avia-tion and aerospace industries highlighting, the number of companies associated with each industry sector. Specifically highlights breakthroughs in the aerospace/aviation de-fense and research and development sectors.
Uses IMPLAN, but says methodology avail-able upon request.
APPENDIX A – Index to Comparable NA-ICS and SIC Industry Codes for Aerospace (Too large to be listed here)
Aviation (NAICS Code/Description):
481111-Scheduled Passenger Air Transporta-tion; 481112-Scheduled Freight Air Trans-portation; 481211-Nonscheduled Chartered Passenger Air Transportation; 481212-Non-scheduled Chartered Freight Air Transpor-tation; 481219-Other Nonscheduled Air Transportation; 488111-Air Traffic Con-trol; 488119-Other Airport Operations; 488190-Other Support Activities for Air Transportation; 611512-Flight Training
Aerospace (NAICS Code/Description):
334511-Search, Detection and Navigation Instrument Manufacturing; 336411-Aircraft Manufacturing; 336412- Aircraft Engine and Engine Parts Manufacturing; 336413- Other Aircraft Parts and Auxiliary Equip-ment Manufacturing; 336414- Guided Missile and Space Vehicle Manufacturing; 336415, 336419-Guided Missile and Space Vehicle Propulsion Unit and Other Parts Manufacturing; 517410- Satellite Telecom-munications; 927110-Space Research and Technology
Georgia None at this time
Hawaii None at this time
Idaho None at this time
Illinois None at this time
Indiana None at this time
Iowa None at this time

Virginia’s Aerospace Industry | 23
State Study Summary Industry DefinitionKansas Kansas Aerospace Industry Fore-
cast. Center for Economic Develop-ment and Business Research. W. Frank Barton School of Business. Wichita State University, 2006. (http://www.kansasinc.org/pubs/working/Kan-sas%20Aerospace%20Industry%20Forecast%20-%202006.pdf )
History of IMPLAN multipliers by year from 1990-2004 and projections until 2016. Implemented a combination of IM-PLAN and RIMS II multipliers to com-pare and contrast economic impact fig-ures. Focused on the commercial aviation, military & defense aerospace, and general aviation sectors of Kansas’ aerospace indus-try to establish an optimistic, pessimistic, and likely scenario of the industry’s future development.
Analyzed aerospace products and parts manufacturing industry sector (NAICS code 33641), which includes:
-Aircraft engine and engine parts manufacturing
-Other aircraft parts and auxiliary equipment manufacturing
-Guided missile and space vehicle manufacturing
-Guided missile and space vehicle propulsion unit and propulsion unit parts manufacturing
-Other guided missile and space vehicle parts and auxiliary equipment manufacturing
Kentucky None at this time
Louisiana None at this time
Maine None at this time
Maryland None at this time
Massachusetts None at this time
Michigan None at this time
Minnesota None at this time
Mississippi Stennis Space Center 2008 Eco-nomic Impact. National Aeronautics and Space Administration. NASA-Facts. NASA.gov. *Referenced study conducted by Charles A. Campbell, Professor of Economics, Mississippi State University.
Very brief economic impact snapshot of the Stennis Space Center. Diagrams the direct global impact of the Stennis Space Center’s 2008 operations. Focuses more specifically on the workforce directly as-sociated with the space center.
Missouri None at this time
Montana None at this time
Nebraska None at this time
Nevada None at this time
New Hampshire None at this time
New Jersey None at this time
New Mexico New Mexico Commercial Space-port Economic Impact Study. Developed for the State of New Mexico Economic Development Corporation. Futron Corporation. December 2005.
Estimated economic impacts based on an aerospace cluster analysis and regional im-pact multipliers. Futron used the Regional Input-Output Modeling System (RIMS II) to calculate anticipated economic impacts of the commercial spaceport.
The NAICS industry codes input into the RIMS II system were those associated with:
-Air transportation
-Hotels and Motels
-Spectator Sports
-Manufacturing
-Management of Enterprises
-Construction
New York None at this time
North Carolina None at this time
North Dakota None at this time

24 | November 2010
State Study Summary Industry DefinitionOhio A Strategy for Growing the Ohio
Aerospace & Defense Industry. Pre-pared for The Ohio Aerospace and Defense Advisory Council & The Ohio Department of Development, Technology Division. Prepared by Jack Kleinhenz, Ziona Austrian, Ed Morrison. May 2005.
Quantitative analysis methods were based on those found in the final report issued by the Commission on the Future of the U.S. Aerospace Industry. As such, the aerospace industry was divided into aerospace defense manufacturing and aerospace and defense services.
Aerospace and Defense Manufacturing Seg-ment (NAICS codes—Descriptions):
336411-Aircraft; 336413-Other Air-craft Parts & Auxiliary Equipment; 336414-Guided Missiles and Space Vehicles; 336419-Other Missile & Space Vehicle Parts & Equipment; 336412-Aircraft Engine and Parts; 336415-Guided Missile & Space Ve-hicle Propulsion Units; 334511-Search, Detection, Navigation, Guidance, Aero-nautical; 332992-Small Arms Ammunition; 332993-Ammunition; 332994-Small arms; 332995-Other Ordinance and Accessories; 336992-Military Armored Vehicle, Tank & Tank Components.
Aerospace and Defense Services Segment (NAICS codes—Descriptions):
481111-Scheduled Passenger Air Transporta-tion; 481112-Scheduled Freight Air Trans-portation; 481211-Nonscheduled Chartered Passenger; 481212-Nonscheduled Chartered Freight; 481219-Other Nonscheduled Air; 488111-Air Traffic Control; 488119-Other Airport Operations; 488190-Other Support Activities for Air Transportation; 517410-Sat-ellite Communications; 611512-Flight Training Schools; 927110-Space Research & Technology; 928110-National Security
Oklahoma Economic Impact of Aviation and the Aerospace Industry in Okla-homa - Final Report. Prepared for the Oklahoma Aeronautics and Space Commission of the Oklahoma Department of Transportation. Prepared by the Center for Economic and Management Research. Michael F. Price College of Business. The University of Oklahoma. September 1999.
An economic impact analysis based on a summary of payroll and employment data, in combination with an airport survey. Estimates rate of growth for the aviation and aerospace industries in the state, as well as, the elevation in the rate of fuel consumption. Analysis is divided into three major sectors: Air transportation, Aircraft Manufacturing, and Federal Government and Military Aviation.
Multipliers were generated by IMPLAN program, however no specifics were provided beyond the explanation of the major sectors:
Air transportation – including civilian airports, airlines, airline aircraft maintenance centers, air freight and air cargo, airline reservation centers, and local spending by commercial airline passengers.
Aircraft manufacturing – including private sector manufacturing of aircraft, aircraft engines, and aircraft parts.
Federal Government and Military Avia-tion – including civilian, military, and federal government employment at Tinker Air Force Base, Altus Air Force Base, Vance Air Force Base, Henry Post Field at Ft. Sill, Air National Guard facilities and the Mike Monroney Aeronautical Center.
Oregon None at this time
Pennsylvania None at this time
Rhode Island None at this time
South Carolina None at this time
South Dakota None at this time
Tennessee None at this time

Virginia’s Aerospace Industry | 25
State Study Summary Industry DefinitionTexas Aerospace Industry Competitive-
ness Study. April 2009.
The Aerospace Industry in San An-tonio – Economic Impact in 2007. Prepared for the San Antonio Cham-ber of Commerce by Richard V. But-ler, Ph.D. and Mary E. Stefl, Ph.D. Trinity University
The study is completed strictly from an aeronautics perspective. The industry is divided into two all-encompassing sectors: Services/Manufacturing and Transporta-tion. It outlines the industry’s growth, em-ployment numbers, wage numbers, and economic impact.
Services and Manufacturing (NAICS code—description):
33641-Aerospace Products and Parts Manu-facturing; 42386-Transportation Equipment and Supplies Wholesaling
Transportation (NAICS codes—description):
48111-Scheduled Air Transportation; 48121-Nonscheduled Air Transportation; 48811-Airport Operations; 48819-Other Support Activities for Air Transportation; 611512-Flight Schools
Utah None at this time
Vermont None at this time
Virginia Definition of the Aerospace Indus-try. Virginia Economic Development Partnership. (http://www.yesvirginia.org/businesssectors/Aerospace.aspx )
Washington The Washington Aerospace Indus-try. Prepared for Aerospace Futures Alliance of Washington. Richard S. Conway, Jr. and Douglas H. Pedersen of The Puget Sound Economic Fore-caster / Conway Pedersen Econom-ics, Inc. January 2006
The study attributes one chapter to an eco-nomic impact analysis of the aerospace in-dustry in Washington. It takes a company/establishment based approach from which employment figures are then derived. These employment figures are then plugged into multiplier simulations which provide esti-mates for the overall impact of the industry on the state’s economy.
Provides company numbers divided into four aerospace industry sectors:
Aircraft manufacturing, Aircraft engines and parts, Other aircraft parts, Space vehicles
West Virginia None at this time
Wisconsin None at this time
Wyoming None at this time
Other Aerospace Links (Not Economic Impact Studies)
Alabama: Up in the Air Alabama. Barbara Sloan. Partners. Spring 2004.
* explores Alabama’s role in aerospace and aviation
California: California Economic Strategy Panel - Special Statewide Forum on the California Aerospace Industry Cluster - White Paper on Issues and Opportunities.
Texas: A Snapshot of the Texas Aerospace Industry and a Comparison of Competitor States. The Bush School of Government and Public Service. Texas A&M University.
Texas: State of Texas Aerospace and Defense Cluster Assessment. August 2005.
Utah: Utah Aerospace Industry Profile. Economic Development Corporation of Utah. 2009.
United States: America’s Aerospace Industry: Identifying and Addressing Workforce Challenges. Report of Findings and Rec-ommendations for The President’s High Growth Job Training Initiative in the Aerospace Industry. May 2005
Washington: Aerospace Industry Competitiveness Study. Deloitte Consulting. Prepared for the Economic Development Council of Snohomish County. April 2009.

26 | November 2010
APPENDIX 3: DETAILED NAICS DEFINITIONS FOR AEROSPACE
339113 Surgical Appliance and Supplies Manufacturing
This industry comprises establishments primarily engaged in manufacturing surgical appliances and supplies. Examples of products made by these establishments are orthopedic devices, prosthetic appliances, surgical dressings, crutches, surgical sutures, personal industrial safety devices (except protective eyewear), hospital beds, and operating room tables.
334220 Radio and Television Broadcasting and Wireless Communications Equipment Manufacturing
This industry comprises establishments primarily engaged in manufacturing radio and television broadcast and wireless communications equipment. Examples of products made by these establishments are: transmitting and receiving antennas, cable television equipment, GPS equipment, pagers, cellular phones, mobile communications equipment, and radio and television studio and broadcasting equipment.
334511 Search, Detection, Navigation, Guidance, Aeronautical, and Nautical System and Instrument Manufacturing
This industry comprises establishments primarily engaged in manufacturing search, detection, navigation, guidance, aeronautical, and nautical systems and instru-ments. Examples of products made by these establishments are aircraft instruments (except engine), flight recorders, navigational instruments and systems, radar systems and equipment, and sonar systems and equipment.
336411 Aircraft Manufacturing
This industry comprises establishments primarily engaged in one or more of the following: (1) manufacturing or assembling complete aircraft; (2) developing and making aircraft prototypes; (3) aircraft conversion (i.e., major modifications to systems); and (4) complete aircraft overhaul and rebuilding (i.e., periodic restora-tion of aircraft to original design specifications).
336412 Aircraft Engine and Engine Parts Manufacturing
This industry comprises establishments primarily engaged in one or more of the following: (1) manufacturing aircraft engines and engine parts; (2) developing and making prototypes of aircraft engines and engine parts; (3) aircraft propulsion system conversion (i.e., major modifications to systems); and (4) aircraft propulsion systems overhaul and rebuilding (i.e., periodic restoration of aircraft propulsion system to original design specifications).
336413 Other Aircraft Parts and Auxiliary Equipment Manufacturing
This industry comprises establishment primarily engaged in (1) manufacturing aircraft parts or auxiliary equipment (except engines and aircraft fluid power subassemblies) and/or (2) developing and making prototypes of aircraft parts and auxiliary equipment. Auxiliary equipment includes such items as crop dusting apparatus, armament racks, inflight refueling equipment, and external fuel tanks.
336414 Guided Missile and Space Vehicle Manufacturing
This industry comprises establishments primarily engaged in (1) manufacturing complete guided missiles and space vehicles and/or (2) developing and making prototypes of guided missiles or space vehicles.
336415 Guided Missile and Space Vehicle Propulsion Unit and Propulsion Unit Parts Manufacturing
This industry comprises establishments primarily engaged in (1) manufacturing guided missile and/or space vehicle propulsion units and propulsion unit parts and/or (2) developing and making prototypes of guided missile and space vehicle propulsion units and propulsion unit parts.
336419 Other Guided Missile and Space Vehicle Parts and Auxiliary Equipment Manufacturing
This industry comprises establishments primarily engaged in (1) manufacturing guided missile and space vehicle parts and auxiliary equipment (except guided missile and space vehicle propulsion units and propulsion unit parts) and/or (2) developing and making prototypes of guided missile and space vehicle parts and auxiliary equipment.
332995 Other Ordnance and Accessories Manufacturing
This industry comprises establishments primarily engaged in manufacturing ordnance (except small arms) and accessories.
481212 Nonscheduled Chartered Freight Air Transportation
This industry comprises establishments primarily engaged in providing air transportation of cargo without transporting passengers with no regular routes and regular schedules.
517410 Satellite Telecommunications
This industry comprises establishments primarily engaged in providing telecommunications services to other establishments in the telecommunications and broad-casting industries by forwarding and receiving communications signals via a system of satellites or reselling satellite telecommunications.
541370 Surveying and Mapping (except Geophysical) Services
This industry comprises establishments primarily engaged in performing surveying and mapping services of the surface of the earth, including the sea floor. These services may include surveying and mapping of areas above or below the surface of the earth, such as the creation of view easements or segregating rights in parcels of land by creating underground utility easements.
927110 Space Research and Technology
This industry comprises government establishments primarily engaged in the administration and operations of space flights, space research, and space exploration. Included in this industry are government establishments operating space flight centers.

Virginia’s Aerospace Industry | 27
APPENDIX 4: IMPACT STUDY GLOSSARY
IMPLAN Professional is an economic impact assessment modeling system. It allows the user to build economic models to estimate the impact of economic changes in states, counties, or communities. It was created in the 1970s by the Forestry Service and is widely used by economists to estimate the impact of specific events on the overall economy.
Input-Out Analysis—an examination of business-business and business-consumer economic relationships capturing all monetary transactions in a given period, allowing one to calculate the effects of a change in an economic activity on the entire economy (impact analysis).
Direct Impact—economic activity generated by a project or operation. For construction, this represents activity of the contractor; for operations, this represents activity by tenants of the property.
Overhead—construction inputs not provided by the contractor.
Indirect Impact—secondary economic activity that is generated by a project or operation. An example might be a new office building generating demand for parking garages.
Induced (Household) Impact—economic activity generated by household income resulting from direct and indirect impact.
Multiplier—the cumulative impact of a unit change in economic activity on the entire economy.

28 | November 2010
APPENDIX 5: DETAILED AEROSPACE IMPACT BY METRO AREA
Economic Impact of the Aerospace Industry on the Bristol MSA Spending Impact ($Millions) Employment Impact
Direct Indirect Induced Total Direct Indirect Induced TotalSearch, Detection, Navigation, Guidance, Aero-nautical, and Nautical System and Instrument Manufacturing
$0.0 $0.0 $0.0 $0.0 0 0 0 0
Aircraft Manufacturing $0.0 $0.0 $0.0 $0.0 0 0 0 0
Aircraft Engine and Engine Parts Manufacturing $0.0 $0.0 $0.0 $0.0 0 0 0 0
Other Aircraft Parts and Auxiliary Equipment Manufacturing
$0.0 $0.0 $0.0 $0.0 0 0 0 0
Guided Missile and Space Vehicle Manufacturing $0.0 $0.0 $0.0 $0.0 0 0 0 0
Guided Missile and Space Vehicle Propulsion Unit and Propulsion Unit Parts Manufacturing
$0.0 $0.0 $0.0 $0.0 0 0 0 0
Other Guided Missile and Space Vehicle Parts and Auxiliary Equipment Manufacturing
$0.0 $0.0 $0.0 $0.0 0 0 0 0
Satellite Telecommunications $0.0 $0.0 $0.0 $0.0 0 0 0 0
Space Research and Technology $0.1 $0.0 $0.0 $0.1 <10 0 0 <10
Total $0.1 $0.0 $0.0 $0.1 <10 0 0 <10
Note: Figures may not sum due to rounding.Source: Chmura Economics & Analytics and IMPLAN 2008
Economic Impact of the Aerospace Industry on the Charlottesville MSA Spending Impact ($Millions) Employment Impact
Direct Indirect Induced Total Direct Indirect Induced TotalSearch, Detection, Navigation, Guidance, Aero-nautical, and Nautical System and Instrument Manufacturing
$407.8 $125.9 $86.5 $620.2 500-1,000 758 677 1,935-2,435
Aircraft Manufacturing $0.0 $0.0 $0.0 $0.0 0 0 0 0
Aircraft Engine and Engine Parts Manufacturing $0.7 $0.2 $0.1 $1.0 1 1 1 3
Other Aircraft Parts and Auxiliary Equipment Manufacturing
$0.0 $0.0 $0.0 $0.0 0 0 0 0
Guided Missile and Space Vehicle Manufacturing $0.0 $0.0 $0.0 $0.0 0 0 0 0
Guided Missile and Space Vehicle Propulsion Unit and Propulsion Unit Parts Manufacturing
$0.0 $0.0 $0.0 $0.0 0 0 0 0
Other Guided Missile and Space Vehicle Parts and Auxiliary Equipment Manufacturing
$0.0 $0.0 $0.0 $0.0 0 0 0 0
Satellite Telecommunications $0.0 $0.0 $0.0 $0.0 0 0 0 0
Space Research and Technology $0.0 $0.0 $0.0 $0.0 0 0 0 0
Total $408.5 $126.1 $86.6 $621.2 500-1,000 759 678 1,938-2,438
Note: Figures may not sum due to rounding.Source: Chmura Economics & Analytics and IMPLAN 2008
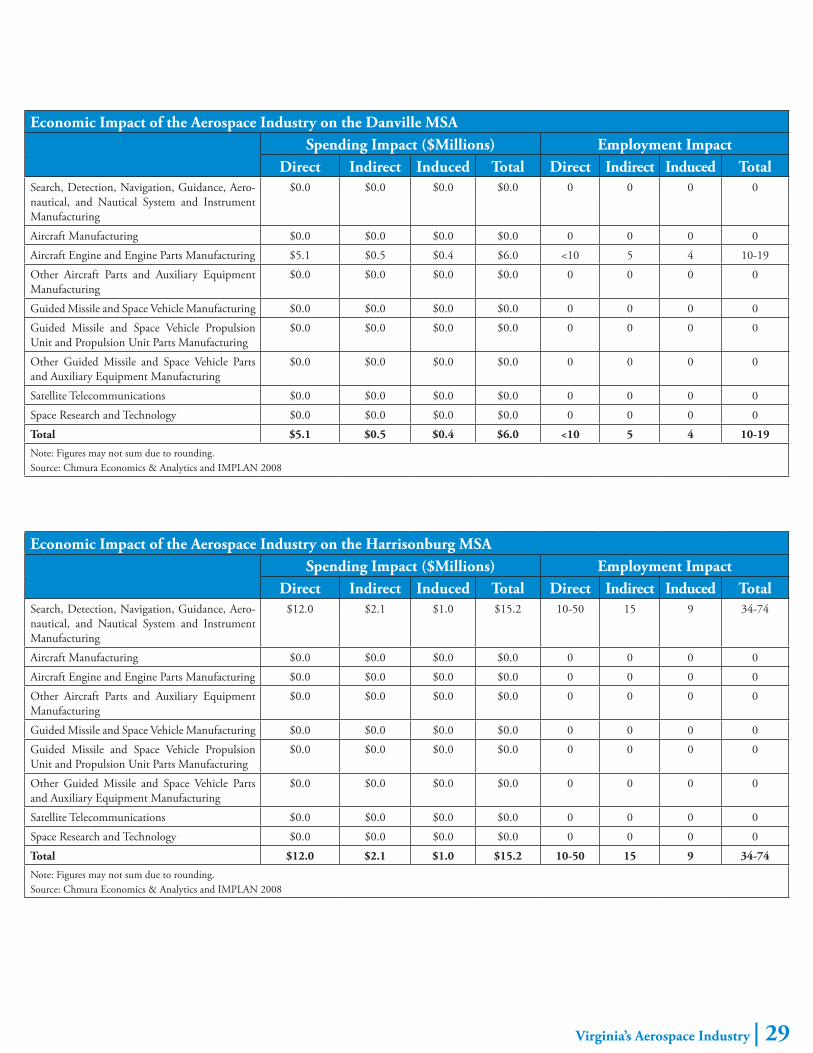
Virginia’s Aerospace Industry | 29
Economic Impact of the Aerospace Industry on the Danville MSA Spending Impact ($Millions) Employment Impact
Direct Indirect Induced Total Direct Indirect Induced TotalSearch, Detection, Navigation, Guidance, Aero-nautical, and Nautical System and Instrument Manufacturing
$0.0 $0.0 $0.0 $0.0 0 0 0 0
Aircraft Manufacturing $0.0 $0.0 $0.0 $0.0 0 0 0 0
Aircraft Engine and Engine Parts Manufacturing $5.1 $0.5 $0.4 $6.0 <10 5 4 10-19
Other Aircraft Parts and Auxiliary Equipment Manufacturing
$0.0 $0.0 $0.0 $0.0 0 0 0 0
Guided Missile and Space Vehicle Manufacturing $0.0 $0.0 $0.0 $0.0 0 0 0 0
Guided Missile and Space Vehicle Propulsion Unit and Propulsion Unit Parts Manufacturing
$0.0 $0.0 $0.0 $0.0 0 0 0 0
Other Guided Missile and Space Vehicle Parts and Auxiliary Equipment Manufacturing
$0.0 $0.0 $0.0 $0.0 0 0 0 0
Satellite Telecommunications $0.0 $0.0 $0.0 $0.0 0 0 0 0
Space Research and Technology $0.0 $0.0 $0.0 $0.0 0 0 0 0
Total $5.1 $0.5 $0.4 $6.0 <10 5 4 10-19
Note: Figures may not sum due to rounding.Source: Chmura Economics & Analytics and IMPLAN 2008
Economic Impact of the Aerospace Industry on the Harrisonburg MSA Spending Impact ($Millions) Employment Impact
Direct Indirect Induced Total Direct Indirect Induced TotalSearch, Detection, Navigation, Guidance, Aero-nautical, and Nautical System and Instrument Manufacturing
$12.0 $2.1 $1.0 $15.2 10-50 15 9 34-74
Aircraft Manufacturing $0.0 $0.0 $0.0 $0.0 0 0 0 0
Aircraft Engine and Engine Parts Manufacturing $0.0 $0.0 $0.0 $0.0 0 0 0 0
Other Aircraft Parts and Auxiliary Equipment Manufacturing
$0.0 $0.0 $0.0 $0.0 0 0 0 0
Guided Missile and Space Vehicle Manufacturing $0.0 $0.0 $0.0 $0.0 0 0 0 0
Guided Missile and Space Vehicle Propulsion Unit and Propulsion Unit Parts Manufacturing
$0.0 $0.0 $0.0 $0.0 0 0 0 0
Other Guided Missile and Space Vehicle Parts and Auxiliary Equipment Manufacturing
$0.0 $0.0 $0.0 $0.0 0 0 0 0
Satellite Telecommunications $0.0 $0.0 $0.0 $0.0 0 0 0 0
Space Research and Technology $0.0 $0.0 $0.0 $0.0 0 0 0 0
Total $12.0 $2.1 $1.0 $15.2 10-50 15 9 34-74
Note: Figures may not sum due to rounding.Source: Chmura Economics & Analytics and IMPLAN 2008

30 | November 2010
Economic Impact of the Aerospace Industry on the Lynchburg MSA Spending Impact ($Millions) Employment Impact
Direct Indirect Induced Total Direct Indirect Induced TotalSearch, Detection, Navigation, Guidance, Aero-nautical, and Nautical System and Instrument Manufacturing
$0.0 $0.0 $0.0 $0.0 0 0 0 0
Aircraft Manufacturing $0.0 $0.0 $0.0 $0.0 0 0 0 0
Aircraft Engine and Engine Parts Manufacturing $3.4 $0.7 $0.2 $4.3 <10 5 2 7-17
Other Aircraft Parts and Auxiliary Equipment Manufacturing
$0.0 $0.0 $0.0 $0.0 0 0 0 0
Guided Missile and Space Vehicle Manufacturing $0.0 $0.0 $0.0 $0.0 0 0 0 0
Guided Missile and Space Vehicle Propulsion Unit and Propulsion Unit Parts Manufacturing
$0.0 $0.0 $0.0 $0.0 0 0 0 0
Other Guided Missile and Space Vehicle Parts and Auxiliary Equipment Manufacturing
$0.0 $0.0 $0.0 $0.0 0 0 0 0
Satellite Telecommunications $0.0 $0.0 $0.0 $0.0 0 0 0 0
Space Research and Technology $0.0 $0.0 $0.0 $0.0 0 0 0 0
Total $3.4 $0.7 $0.2 $4.3 <10 5 2 7-17
Note: Figures may not sum due to rounding.Source: Chmura Economics & Analytics and IMPLAN 2008
Economic Impact of the Aerospace Industry on the Hampton Roads MSA Spending Impact ($Millions) Employment Impact
Direct Indirect Induced Total Direct Indirect Induced TotalSearch, Detection, Navigation, Guidance, Aero-nautical, and Nautical System and Instrument Manufacturing
$50.9 $18.2 $13.0 $82.0 100-500 105 101 306-706
Aircraft Manufacturing $58.6 $11.3 $6.3 $76.1 50-100 84 67 201-251
Aircraft Engine and Engine Parts Manufacturing $12.9 $2.8 $2.3 $18.0 10-50 19 18 47-87
Other Aircraft Parts and Auxiliary Equipment Manufacturing
$59.3 $23.3 $10.6 $93.2 100-500 169 102 371-771
Guided Missile and Space Vehicle Manufacturing $0.0 $0.0 $0.0 $0.0 0 0 0 0
Guided Missile and Space Vehicle Propulsion Unit and Propulsion Unit Parts Manufacturing
$0.0 $0.0 $0.0 $0.0 0 0 0 0
Other Guided Missile and Space Vehicle Parts and Auxiliary Equipment Manufacturing
$0.0 $0.0 $0.0 $0.0 0 0 0 0
Satellite Telecommunications $2.6 $1.3 $0.5 $4.4 <10 4 2 6-16
Space Research and Technology $339.3 $29.7 $173.5 $542.5 1,000-2,000
106 864 1,970-2,970
Total $523.6 $86.6 $206.1 $816.2 2,000-3,000
487 1,154 3,641-4,641
Note: Figures may not sum due to rounding.Source: Chmura Economics & Analytics and IMPLAN 2008

Virginia’s Aerospace Industry | 31
Economic Impact of the Aerospace Industry on the Northern Virginia MSA Spending Impact ($Millions) Employment Impact
Direct Indirect Induced Total Direct Indirect Induced TotalSearch, Detection, Navigation, Guidance, Aero-nautical, and Nautical System and Instrument Manufacturing
$1,430.3 $526.3 $444.2 $2,400.8 2,000-3,000
2,240 2,806 7,046-8,046
Aircraft Manufacturing $249.0 $50.0 $31.9 $330.8 100-500 284 277 661-1,061
Aircraft Engine and Engine Parts Manufacturing $0.9 $0.3 $0.1 $1.3 <10 1 1 2-12
Other Aircraft Parts and Auxiliary Equipment Manufacturing
$1.6 $0.5 $0.4 $2.4 <10 3 3 6-16
Guided Missile and Space Vehicle Manufacturing $931.7 $383.1 $220.9 $1,535.7 1,000-2000
2,129 1,429 4,558-5,558
Guided Missile and Space Vehicle Propulsion Unit and Propulsion Unit Parts Manufacturing
$2.6 $0.8 $0.9 $4.4 <10 5 7 12-22
Other Guided Missile and Space Vehicle Parts and Auxiliary Equipment Manufacturing
$0.0 $0.0 $0.0 $0.0 0 0 0 0
Satellite Telecommunications $534.1 $285.3 $99.0 $918.3 100-500 590 369 1,059-1,459
Space Research and Technology $0.0 $0.0 $0.0 $0.0 0 0 0 0
Total $3,150.1 $1,246.2 $797.4 $5,193.8 4,000-5,000
5,252 4,892 14,144-15,144
Note: Figures may not sum due to rounding.Source: Chmura Economics & Analytics and IMPLAN 2008
Economic Impact of the Aerospace Industry on the Richmond MSA Spending Impact ($Millions) Employment Impact
Direct Indirect Induced Total Direct Indirect Induced TotalSearch, Detection, Navigation, Guidance, Aero-nautical, and Nautical System and Instrument Manufacturing
$0.3 $0.1 $0.1 $0.5 <10 1 1 2-12
Aircraft Manufacturing $0.0 $0.0 $0.0 $0.0 0 0 0 0
Aircraft Engine and Engine Parts Manufacturing $10.6 $0.0 $0.0 $10.6 <20 0 0 <20
Other Aircraft Parts and Auxiliary Equipment Manufacturing
$0.8 $0.4 $0.2 $1.4 <10 2 2 4-14
Guided Missile and Space Vehicle Manufacturing $0.0 $0.0 $0.0 $0.0 0 0 0 0
Guided Missile and Space Vehicle Propulsion Unit and Propulsion Unit Parts Manufacturing
$0.0 $0.0 $0.0 $0.0 0 0 0 0
Other Guided Missile and Space Vehicle Parts and Auxiliary Equipment Manufacturing
$0.0 $0.0 $0.0 $0.0 0 0 0 0
Satellite Telecommunications $0.9 $0.5 $0.2 $1.6 <10 1 1 2-12
Space Research and Technology $0.0 $0.0 $0.0 $0.0 0 0 0 0
Total $12.6 $0.9 $0.6 $14.1 10-20 4 4 18-28
Note: Figures may not sum due to rounding.Source: Chmura Economics & Analytics and IMPLAN 2008

32 | November 2010
Notes: