point of view - learning effectiveness measurement · a digital brain facilitates all interactions...
TRANSCRIPT

VIEW POINT
POINT OF VIEW - LEARNING EFFECTIVENESS MEASUREMENT

External Document © 2020 Infosys Limited External Document © 2020 Infosys Limited
Live enterprise explained ............................................................................................................................................................................................................................. 04
Learning the live enterprise way .............................................................................................................................................................................................................. 04
Tracing the learning value chain .............................................................................................................................................................................................................. 05
Why measure the learning effectiveness? ........................................................................................................................................................................................... 06
What is learning effectiveness? ................................................................................................................................................................................................................ 07
How to measure learning effectiveness? .............................................................................................................................................................................................. 09
Sense ............................................................................................................................................................................................................................................................... 10
Stakeholder identification ............................................................................................................................................................................................................. 11
Define metrics to capture data ..................................................................................................................................................................................................... 12
Identify data sources ........................................................................................................................................................................................................................ 12
Feel ................................................................................................................................................................................................................................................................... 14
Analyze data ......................................................................................................................................................................................................................................... 14
Decipher patterns .............................................................................................................................................................................................................................. 16
Correlate patterns .............................................................................................................................................................................................................................. 17
Respond ......................................................................................................................................................................................................................................................... 18
Predictions and recommendations to stakeholders ........................................................................................................................................................... 18
Compare predictions with actuals and take corrective actions ..................................................................................................................................... 20
Compute ROI ........................................................................................................................................................................................................................................ 20
Evolve continually .......................................................................................................................................................................................................................................... 21
Closing comments ........................................................................................................................................................................................................................................... 23
Authors ................................................................................................................................................................................................................................................................. 24
References .......................................................................................................................................................................................................................................................... 24
Table of Contents
External Document © 2020 Infosys Limited External Document © 2020 Infosys Limited
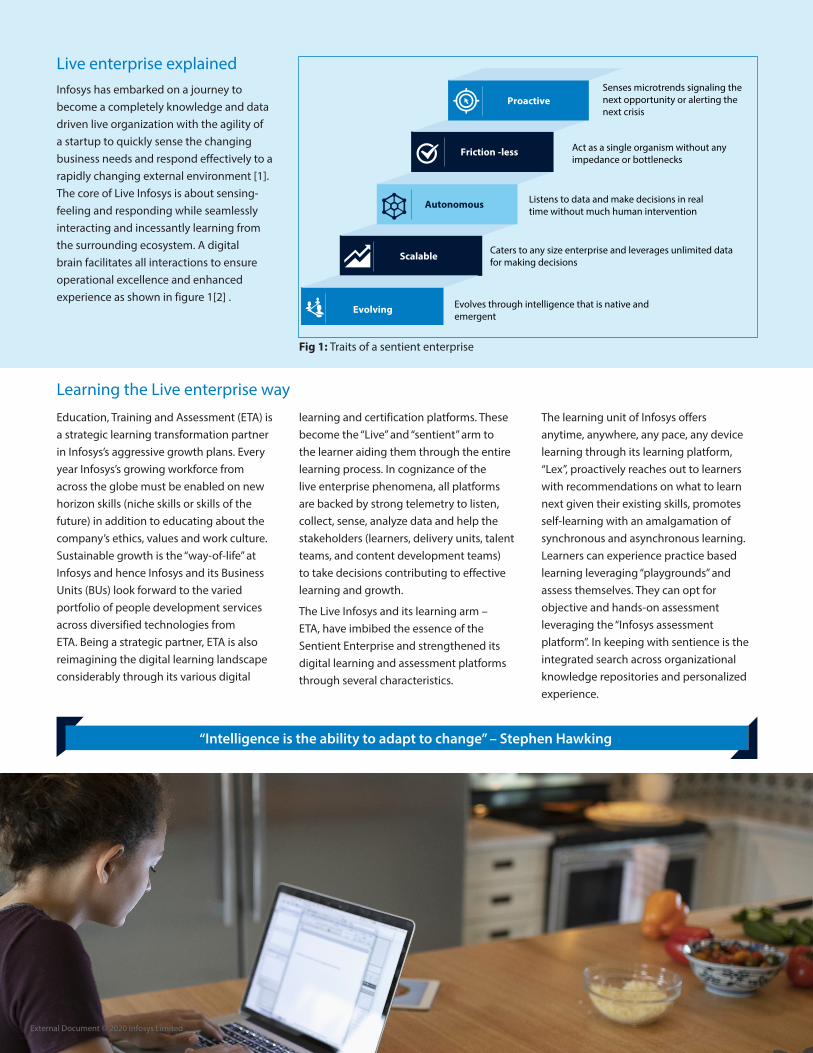
Fig 1: Traits of a sentient enterprise
Infosys has embarked on a journey to become a completely knowledge and data driven live organization with the agility of a startup to quickly sense the changing business needs and respond effectively to a rapidly changing external environment [1]. The core of Live Infosys is about sensing-feeling and responding while seamlessly interacting and incessantly learning from the surrounding ecosystem. A digital brain facilitates all interactions to ensure operational excellence and enhanced experience as shown in figure 1[2] .
Live enterprise explained
Proactive
Friction -less
Autonomous
Scalable
Evolving
Senses microtrends signaling the next opportunity or alerting the next crisis
Act as a single organism without any impedance or bottlenecks
Listens to data and make decisions in real time without much human intervention
Caters to any size enterprise and leverages unlimited data for making decisions
Evolves through intelligence that is native and emergent
The learning unit of Infosys offers anytime, anywhere, any pace, any device learning through its learning platform, “Lex”, proactively reaches out to learners with recommendations on what to learn next given their existing skills, promotes self-learning with an amalgamation of synchronous and asynchronous learning. Learners can experience practice based learning leveraging “playgrounds” and assess themselves. They can opt for objective and hands-on assessment leveraging the “Infosys assessment platform”. In keeping with sentience is the integrated search across organizational knowledge repositories and personalized experience.
Education, Training and Assessment (ETA) is a strategic learning transformation partner in Infosys’s aggressive growth plans. Every year Infosys’s growing workforce from across the globe must be enabled on new horizon skills (niche skills or skills of the future) in addition to educating about the company’s ethics, values and work culture. Sustainable growth is the “way-of-life” at Infosys and hence Infosys and its Business Units (BUs) look forward to the varied portfolio of people development services across diversified technologies from ETA. Being a strategic partner, ETA is also reimagining the digital learning landscape considerably through its various digital
learning and certification platforms. These become the “Live” and “sentient” arm to the learner aiding them through the entire learning process. In cognizance of the live enterprise phenomena, all platforms are backed by strong telemetry to listen, collect, sense, analyze data and help the stakeholders (learners, delivery units, talent teams, and content development teams) to take decisions contributing to effective learning and growth.
The Live Infosys and its learning arm – ETA, have imbibed the essence of the Sentient Enterprise and strengthened its digital learning and assessment platforms through several characteristics.
Learning the Live enterprise way
“Intelligence is the ability to adapt to change” – Stephen Hawking
External Document © 2020 Infosys Limited External Document © 2020 Infosys Limited
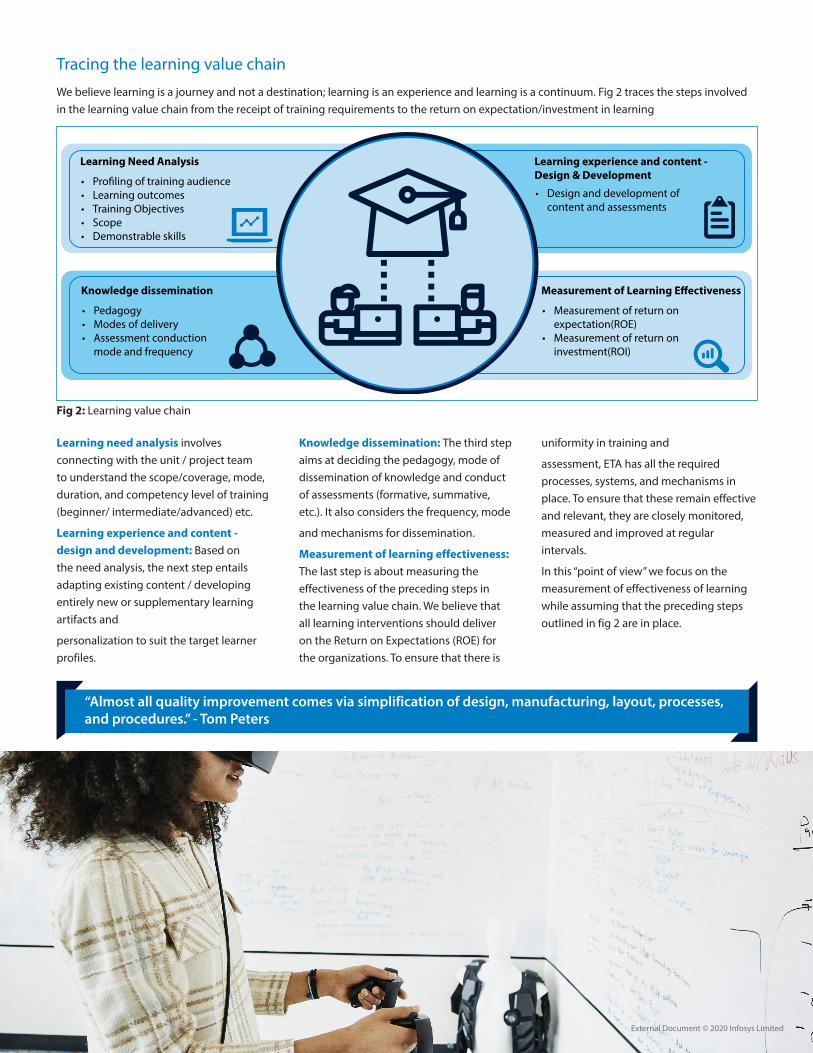
Fig 2: Learning value chain
uniformity in training and
assessment, ETA has all the required processes, systems, and mechanisms in place. To ensure that these remain effective and relevant, they are closely monitored, measured and improved at regular intervals.
In this “point of view” we focus on the measurement of effectiveness of learning while assuming that the preceding steps outlined in fig 2 are in place.
Learning need analysis involves connecting with the unit / project team to understand the scope/coverage, mode, duration, and competency level of training (beginner/ intermediate/advanced) etc.
Learning experience and content - design and development: Based on the need analysis, the next step entails adapting existing content / developing entirely new or supplementary learning artifacts and
personalization to suit the target learner profiles.
We believe learning is a journey and not a destination; learning is an experience and learning is a continuum. Fig 2 traces the steps involved in the learning value chain from the receipt of training requirements to the return on expectation/investment in learning
Knowledge dissemination: The third step aims at deciding the pedagogy, mode of dissemination of knowledge and conduct of assessments (formative, summative, etc.). It also considers the frequency, mode
and mechanisms for dissemination.
Measurement of learning effectiveness: The last step is about measuring the effectiveness of the preceding steps in the learning value chain. We believe that all learning interventions should deliver on the Return on Expectations (ROE) for the organizations. To ensure that there is
Tracing the learning value chain
Learning Need Analysis
• Pro�ling of training audience• Learning outcomes• Training Objectives • Scope• Demonstrable skills
Learning experience and content - Design & Development
• Design and development of content and assessments
Knowledge dissemination
• Pedagogy• Modes of delivery• Assessment conduction mode and frequency
Measurement of Learning E�ectiveness
• Measurement of return on expectation(ROE)• Measurement of return on investment(ROI)
“Almost all quality improvement comes via simplification of design, manufacturing, layout, processes, and procedures.” - Tom Peters
External Document © 2020 Infosys Limited External Document © 2020 Infosys Limited

in training, the learning unit is able to compute the ROI
· The learnings that ensued is looped back to further improve the learning experience.
The pre-hire activities using platforms like InfyTQ reduces time taken to transform a campus graduate to a skilled professional ready for deployment to units. In case of lateral recruits with adjacent skills, the time taken to refactor and deploy to business units is reduced because of the learning interventions in place. The learning interventions are facilitated through micro feedback and responsiveness of the learning platforms involved. This also contributes to the return on learning investment as the lateral hiring can be at a lower per capita rate specially when hiring employees with adjacent skills in lieu of required niche skills.
The live Infosys learning unit like a live organism is constantly reinventing, reimagining and evolving its mechanisms, processes and systems basis its experience and learning from its ecosystems. If measured in this spirit the following outcomes ensue:
1. Better Intuitive decision makingCapturing the digital learning footprint [telemetry] of every learner, deciphering patterns from data, and drawing inferences leads to intuitive decision making. E.g. A learner basis his learning telemetry can take an informed decision on what course to learn next, which code contest/ hackathon to participate in etc. A business unit intuitively decides on where to engage the employees with a particular skill set etc. The telemetry empowers the learning unit to sense the relationship between sets of data and share predictions with stakeholders for appropriate perusal and action. The stakeholders can thereby imagine business outcomes owing to learning much before the learning journey is complete .
2. Improved closed loop responsive value chainThere are measuring mechanisms in place at key milestones in the journey outlined in Figure 3.
As an example, let us trace the journey of a campus graduate through this responsive learning chain.
· A prospective employee learns through the InfyTQ platform much before joining the organization. Their performance is measured and the assessment has significance in deciding the training program (short/long duration) in which the learner will be placed upon hiring.
· The campus graduates undergo the foundation training program, micro and
macro feedback is collected from the learners during and after the training to improve content /instruction delivery. Assessment scores of the learner give a sense of the employee performance and help predict his performance on the job upon successful release to production environments.
· These campus graduates are then deployed in project where “on the job” performance, customer feedback, measurement of the contributions constitute but just a few significant measurements.
· Basis the data available on tangible and intangible benefits and cost accrued
Why measure the learning effectiveness?
Fig 3: Closed loop responsive chain for a learner
54
3
12
6
Prospective Campus Grads learn from Learning Platforms (InfyTQ/Path�ndersOnline Institute)
Campus Graduates
Activities during learning
• Sense learning metrics
• Decipher learning, assessment, subject coverage & satisfaction patterns
• Predict performance in daily assignments and assessments
• Predict employee score card and skill set
Activities during working
• Sense learner metrics
• Decipher subject coverage patterns
• Predict list of skilled employees
• Predict and recommend skill needs for accounts
• Recommend courses, learning paths
Post learning activities
• Sense learning metrics
• Decipher learning, assessment, subject coverage & satisfaction patterns
• Predict performance in daily assignments and assessments
• Predict employee score card and skill
Activities during learning
• Sense learning metrics
• Decipher learning, assessment, subject coverage & satisfaction patterns
• Predict performance in daily assignments and assessments
• Predict employee score card and skill setRecruited to Infosys
Undergoes Foundation Training Program
Deployed to Business Units / Projects
Upgrades Skills through Infosys Digital Platforms
Demonstrates Skills and Contributesat Micro, Macro and Mega Level Initiatives
Lateral Hires
Pre-learning /Pre-hire activities
• Sense learning metrics
• Decipher learning patterns, scores
• Decide duration of foundation program based on performance
External Document © 2020 Infosys Limited External Document © 2020 Infosys Limited
chain for the better. The adaptive learning experience draws(“pull”) the learner to the learning rather than force(“push”) learners to learn. This improves internalization and absorption of the disseminated knowledge. This focused approach on learning through digital tracking of the learning journey will provide an effective nurturing of creative talent in the organization.
3. Enhanced Perceptive learning experienceFor a live organism, perceptual learning happens through cumulative learning experience. It occurs through sensory interaction with the environment as well as through practice in performing specific
sensory tasks [7]. This learning is reinforced by actions performed and micro feedback
received. All systems, processes and mechanisms in place is improved basis the micro and macro feedback captured and patterns studied to improve the learning experience.
Learning measurement is more than just about tangible monetary benefits. It brings about significant changes in the traditional learning/deployment value
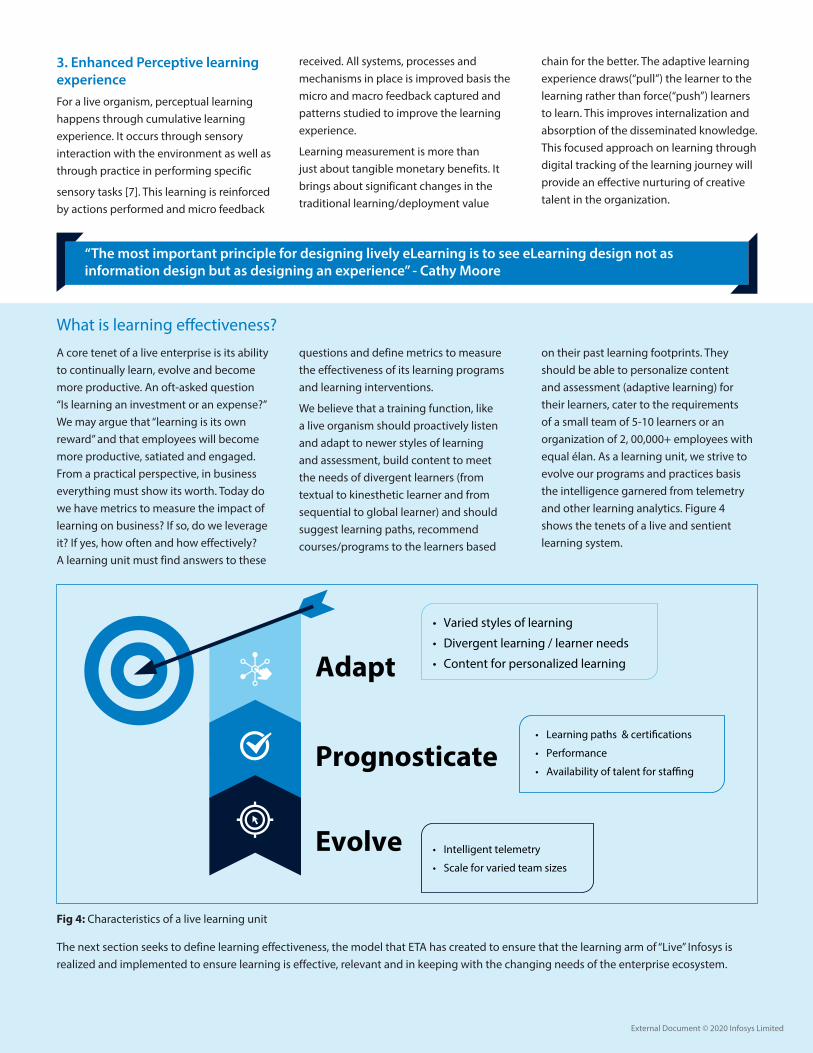
Fig 4: Characteristics of a live learning unit
“The most important principle for designing lively eLearning is to see eLearning design not as information design but as designing an experience” - Cathy Moore
on their past learning footprints. They should be able to personalize content and assessment (adaptive learning) for their learners, cater to the requirements of a small team of 5-10 learners or an organization of 2, 00,000+ employees with equal élan. As a learning unit, we strive to evolve our programs and practices basis the intelligence garnered from telemetry and other learning analytics. Figure 4 shows the tenets of a live and sentient learning system.
A core tenet of a live enterprise is its ability to continually learn, evolve and become more productive. An oft-asked question “Is learning an investment or an expense?” We may argue that “learning is its own reward” and that employees will become more productive, satiated and engaged. From a practical perspective, in business everything must show its worth. Today do we have metrics to measure the impact of learning on business? If so, do we leverage it? If yes, how often and how effectively? A learning unit must find answers to these
The next section seeks to define learning effectiveness, the model that ETA has created to ensure that the learning arm of “Live” Infosys is realized and implemented to ensure learning is effective, relevant and in keeping with the changing needs of the enterprise ecosystem.
questions and define metrics to measure the effectiveness of its learning programs and learning interventions.
We believe that a training function, like a live organism should proactively listen and adapt to newer styles of learning and assessment, build content to meet the needs of divergent learners (from textual to kinesthetic learner and from sequential to global learner) and should suggest learning paths, recommend courses/programs to the learners based
What is learning effectiveness?
Adapt
Prognosticate
Evolve
• Varied styles of learning
• Divergent learning / learner needs
• Content for personalized learning
• Learning paths & certi�cations
• Performance
• Availability of talent for sta�ng
• Intelligent telemetry
• Scale for varied team sizes
External Document © 2020 Infosys Limited External Document © 2020 Infosys Limited
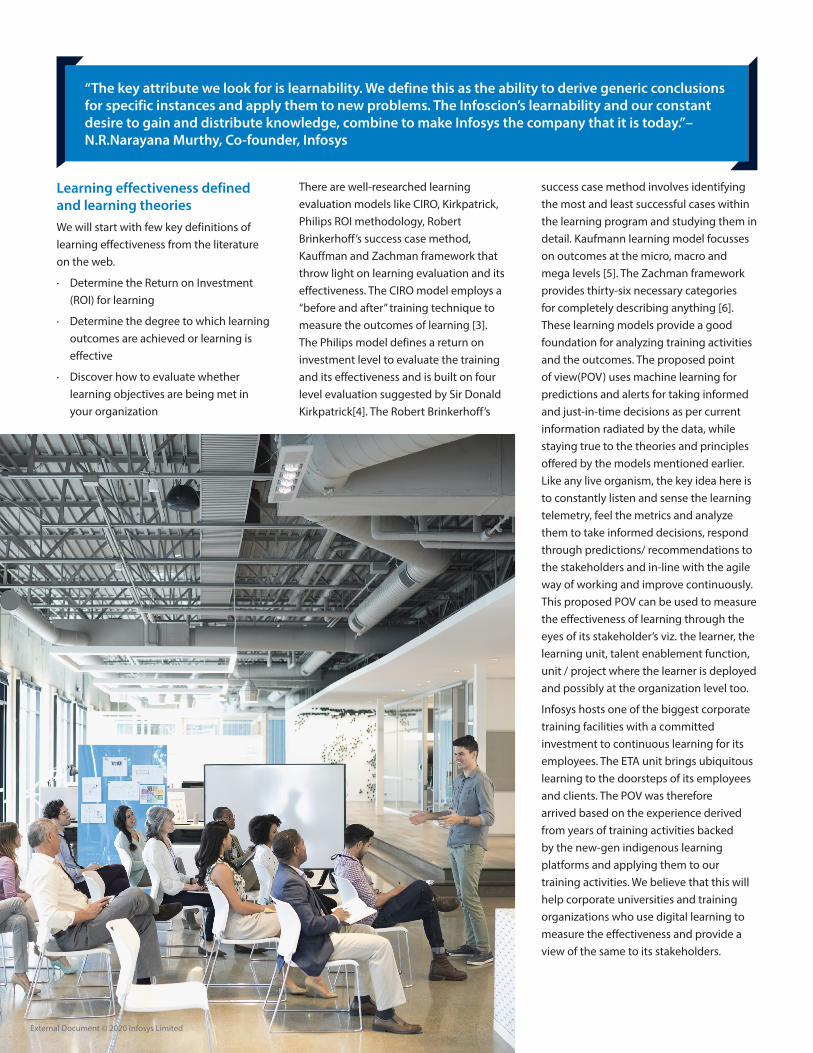
“The key attribute we look for is learnability. We define this as the ability to derive generic conclusions for specific instances and apply them to new problems. The Infoscion’s learnability and our constant desire to gain and distribute knowledge, combine to make Infosys the company that it is today.”– N.R.Narayana Murthy, Co-founder, Infosys
success case method involves identifying the most and least successful cases within the learning program and studying them in detail. Kaufmann learning model focusses on outcomes at the micro, macro and mega levels [5]. The Zachman framework provides thirty-six necessary categories for completely describing anything [6]. These learning models provide a good foundation for analyzing training activities and the outcomes. The proposed point of view(POV) uses machine learning for predictions and alerts for taking informed and just-in-time decisions as per current information radiated by the data, while staying true to the theories and principles offered by the models mentioned earlier. Like any live organism, the key idea here is to constantly listen and sense the learning telemetry, feel the metrics and analyze them to take informed decisions, respond through predictions/ recommendations to the stakeholders and in-line with the agile way of working and improve continuously. This proposed POV can be used to measure the effectiveness of learning through the eyes of its stakeholder’s viz. the learner, the learning unit, talent enablement function, unit / project where the learner is deployed and possibly at the organization level too.
Infosys hosts one of the biggest corporate training facilities with a committed investment to continuous learning for its employees. The ETA unit brings ubiquitous learning to the doorsteps of its employees and clients. The POV was therefore arrived based on the experience derived from years of training activities backed by the new-gen indigenous learning platforms and applying them to our training activities. We believe that this will help corporate universities and training organizations who use digital learning to measure the effectiveness and provide a view of the same to its stakeholders.
Learning effectiveness defined and learning theoriesWe will start with few key definitions of learning effectiveness from the literature on the web.
· Determine the Return on Investment (ROI) for learning
· Determine the degree to which learning outcomes are achieved or learning is effective
· Discover how to evaluate whether learning objectives are being met in your organization
There are well-researched learning evaluation models like CIRO, Kirkpatrick, Philips ROI methodology, Robert Brinkerhoff’s success case method, Kauffman and Zachman framework that throw light on learning evaluation and its effectiveness. The CIRO model employs a “before and after” training technique to measure the outcomes of learning [3]. The Philips model defines a return on investment level to evaluate the training and its effectiveness and is built on four level evaluation suggested by Sir Donald Kirkpatrick[4]. The Robert Brinkerhoff’s
External Document © 2020 Infosys Limited External Document © 2020 Infosys Limited

• Co-create • Fluid • Proximity to data source • Zero latency
Sense
• Micro-feedback• Accessibility• Self-service• Collaboration
Feel
• Micro-feedback• Personalized recommendations• Knowledge graphs • Guided practice
Respond
INTUITIVE decisions
Observability at all levels
Improved PERCEPTIVE learning experience
Improved closed loop RESPONSIVE value chain
Reliable & compliance to security policies Automated Scalable
The Live Infy
Learning E�ectiveness Measurement - POV
The three-pronged approachThere are actors and beneficiaries in the learning process (corporate learning). This includes the learners, learning unit , talent management teams, business units (where learners are deployed) and the organization where learning is a function.
How to measure learning effectiveness?
LEARNERS
TALENT TEAMS BUSINESS UNITS
ACTORS/BENEFICIARIES
LEARNING UNIT
Fig 5: Actors / beneficiaries in the learning journey
Fig 6a: The Live Infosys Learning effectiveness measurement POV – characteristics view
The learning effectiveness measurement POV is an inclusive one and can help assess the impact of learning on stakeholders through their learners. “Sense”, “Feel” and “Respond” is the three-pronged approach adopted in our model as shown in figure 6a and 6b. In the subsequent sections, we will take one of the actors – the Learning unit such as ETA as an example to illustrate the point of view.
External Document © 2020 Infosys Limited External Document © 2020 Infosys Limited
• Stakeholder Identi�cation• De�ne Metrics to capture data• Data source establishment
Sense
• Analyze data
• Decipher patterns
• Correlate patterns
Feel
• Predictions to stakeholders• Compare actuals and take corrective actions• Compute ROI
Respond
Engagement
Relevance
Satisfaction
Attitude
Con�dence & Commitment
Knowledge Gained
Skills Gained
Application
Implementation
Improved PERCEPTIVE learning experience
Improved closed loop RESPONSIVE value chain
INTUITIVE decisions
The Live Infy
Learning E�ectiveness Measurement - POV
During learning Post completion (1-6 months) Post learning (6+ months)
• Stakeholder Identi�cation• De�ne Metrics to capture data• Data source establishment
Sense
• Analyze data
• Decipher patterns
• Correlate patterns
Feel
• Predictions to stakeholders• Compare actuals and take corrective actions• Compute ROI
Respond
Engagement
Relevance
Satisfaction
Attitude
Con�dence & Commitment
Knowledge Gained
Skills Gained
Application
Implementation
Improved PERCEPTIVE learning experience
Improved closed loop RESPONSIVE value chain
INTUITIVE decisions
During learning Post completion (1-6 months) Post learning (6+ months)
The Live Infy
Learning E�ectiveness Measurement - POV
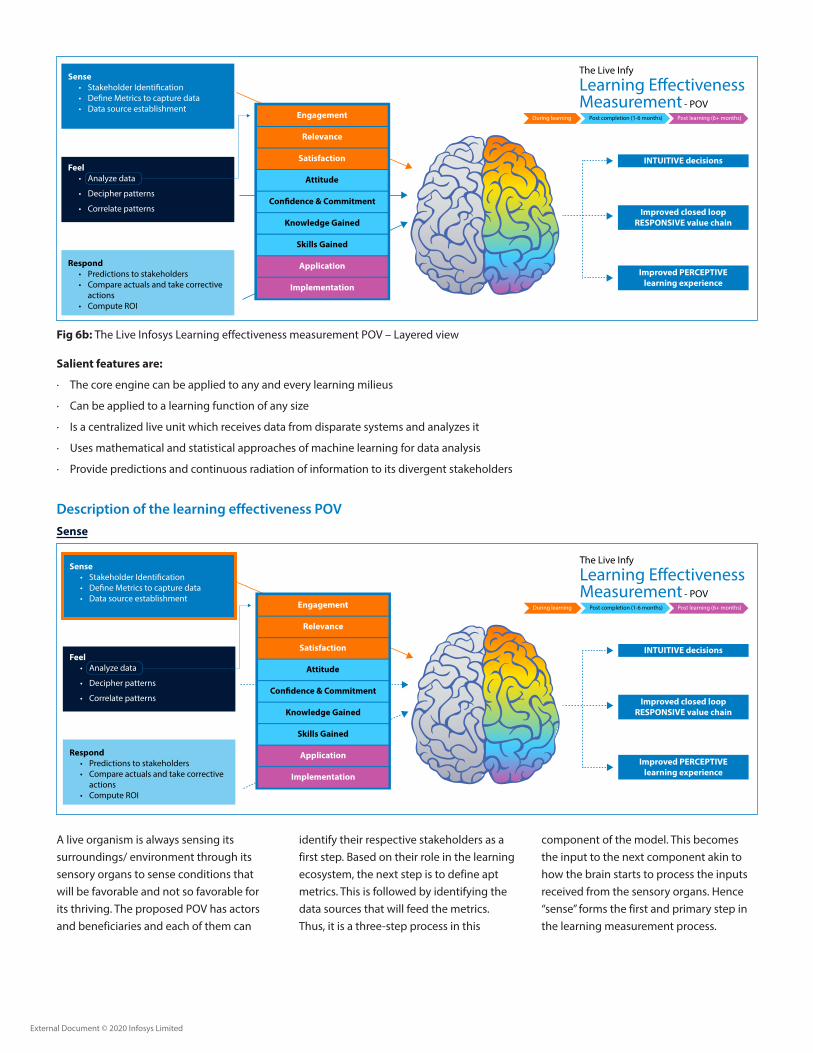
Fig 6b: The Live Infosys Learning effectiveness measurement POV – Layered view
Salient features are:
· The core engine can be applied to any and every learning milieus
· Can be applied to a learning function of any size
· Is a centralized live unit which receives data from disparate systems and analyzes it
· Uses mathematical and statistical approaches of machine learning for data analysis
· Provide predictions and continuous radiation of information to its divergent stakeholders
Description of the learning effectiveness POVSense
component of the model. This becomes the input to the next component akin to how the brain starts to process the inputs received from the sensory organs. Hence “sense” forms the first and primary step in the learning measurement process.
A live organism is always sensing its surroundings/ environment through its sensory organs to sense conditions that will be favorable and not so favorable for its thriving. The proposed POV has actors and beneficiaries and each of them can
identify their respective stakeholders as a first step. Based on their role in the learning ecosystem, the next step is to define apt metrics. This is followed by identifying the data sources that will feed the metrics. Thus, it is a three-step process in this
External Document © 2020 Infosys Limited External Document © 2020 Infosys Limited
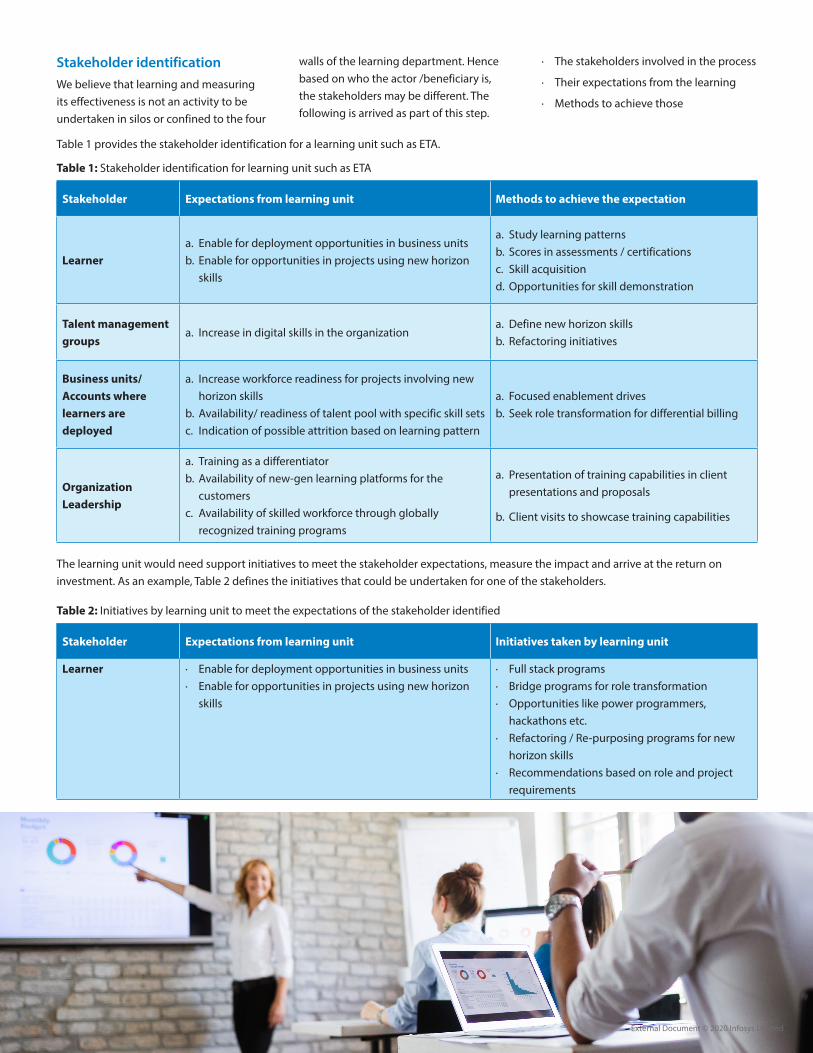
Table 1: Stakeholder identification for learning unit such as ETA
Table 1 provides the stakeholder identification for a learning unit such as ETA.
Table 2: Initiatives by learning unit to meet the expectations of the stakeholder identified
· The stakeholders involved in the process
· Their expectations from the learning
· Methods to achieve those
Stakeholder identificationWe believe that learning and measuring its effectiveness is not an activity to be undertaken in silos or confined to the four
The learning unit would need support initiatives to meet the stakeholder expectations, measure the impact and arrive at the return on investment. As an example, Table 2 defines the initiatives that could be undertaken for one of the stakeholders.
walls of the learning department. Hence based on who the actor /beneficiary is, the stakeholders may be different. The following is arrived as part of this step.
Stakeholder Expectations from learning unit Methods to achieve the expectation
Learnera. Enable for deployment opportunities in business unitsb. Enable for opportunities in projects using new horizon
skills
a. Study learning patternsb. Scores in assessments / certificationsc. Skill acquisitiond. Opportunities for skill demonstration
Talent management groups
a. Increase in digital skills in the organizationa. Define new horizon skillsb. Refactoring initiatives
Business units/Accounts where learners are deployed
a. Increase workforce readiness for projects involving new horizon skills
b. Availability/ readiness of talent pool with specific skill setsc. Indication of possible attrition based on learning pattern
a. Focused enablement drivesb. Seek role transformation for differential billing
Organization Leadership
a. Training as a differentiatorb. Availability of new-gen learning platforms for the
customersc. Availability of skilled workforce through globally
recognized training programs
a. Presentation of training capabilities in client presentations and proposals
b. Client visits to showcase training capabilities
Stakeholder Expectations from learning unit Initiatives taken by learning unit
Learner · Enable for deployment opportunities in business units· Enable for opportunities in projects using new horizon
skills
· Full stack programs· Bridge programs for role transformation· Opportunities like power programmers,
hackathons etc.· Refactoring / Re-purposing programs for new
horizon skills· Recommendations based on role and project
requirements
External Document © 2020 Infosys Limited External Document © 2020 Infosys Limited

· Business units -> How many full stack programmers were made available for staffing their projects quarter on quarter
· Organization leadership-> Reduction in external training and certification cost for creating full stack programmers
· The frequency at which the metrics would be measured and provided
o Feasibility of measuring the metric needs to be kept in mind
o Machine learning and AI backed systems for capturing data is recommended
· Accuracy of data stored and retrieved is crucial for the success of this step
· Accessibility and availability to systems for respective stakeholders is mandatory for success of metrics measurement
Define Metrics to capture dataThe next step of phase 1 is to define the KPI’s i.e. metrics for measuring the effectiveness of the initiatives taken by the learning unit and ascertain if the learning program helped in fulfilling the expectations.
· Metrics to measure the impact of initiatives taken
o Map metrics based on the learning objectives of the initiative taken
Identify data sourcesThe next step involves identifying/selecting the sources of data from where the metrics will be derived. For an organization to thrive like a live unit, investment in systems to facilitate automatic sensing for metrics is crucial. Here are some parameters to select/identify the data source:
• For example, if a full stack program is announced by the learning unit to create full stack programmers, here are the metrics that could be measured based on various stakeholders
· Learner -> learning completion status of learner
· Talent management group -> Tracking number of full stack programmers on a monthly basis
Metrics should be captured using systems and retrieved through them
o While there may be multiple systems involved, a handshake between them is recommended
o Data sharing between systems to be standardized
Table 3: Defining metrics by the learning unit for the Learner (stakeholder)
StakeholderExpectations from learning unit
Initiatives taken by learning unit
Metrics measuredMapping of metrics to expectations
Frequency of measurement
Learner · E1->Enabling for deployment opportunities in business units employing new horizon skills
· E2->Acquiring skills for enhanced compensation and progress
· Full stack programs· Bridge programs for
role transformation· Opportunities
like power programmers, hackathons etc.
· Programs for new horizon skills
· Recommendations based on role and project requirements
Group I· Learning time· Learning patterns· Performance
in quizzes & assignments
· Cohort learning· Course assessment
scores· Goal completion
pattern· Chatbot
interactivity· Course/certification
completion based on job role and project needs
Group 2· Adjacent skill
learning· Participation in
opportunities to demonstrate learning
· Group I metrics map to E1
· Group II metrics map to E2
Continuous, as and when the learning is happening
Table 3 provides an example of how the learning unit can define metrics as stated in this step. “E” stands for expectation in the table.
External Document © 2020 Infosys Limited External Document © 2020 Infosys Limited
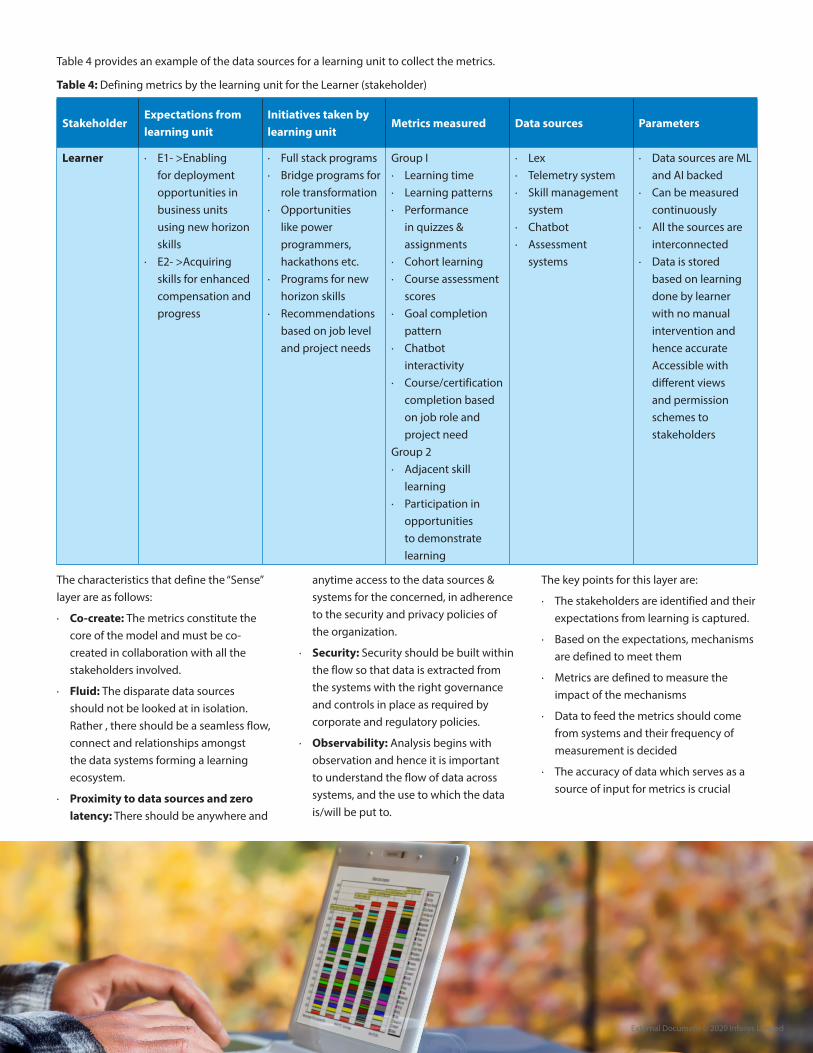
The key points for this layer are:
· The stakeholders are identified and their expectations from learning is captured.
· Based on the expectations, mechanisms are defined to meet them
· Metrics are defined to measure the impact of the mechanisms
· Data to feed the metrics should come from systems and their frequency of measurement is decided
· The accuracy of data which serves as a source of input for metrics is crucial
The characteristics that define the “Sense” layer are as follows:
· Co-create: The metrics constitute the core of the model and must be co-created in collaboration with all the stakeholders involved.
· Fluid: The disparate data sources should not be looked at in isolation. Rather , there should be a seamless flow, connect and relationships amongst the data systems forming a learning ecosystem.
· Proximity to data sources and zero latency: There should be anywhere and
anytime access to the data sources & systems for the concerned, in adherence to the security and privacy policies of the organization.
· Security: Security should be built within the flow so that data is extracted from the systems with the right governance and controls in place as required by corporate and regulatory policies.
· Observability: Analysis begins with observation and hence it is important to understand the flow of data across systems, and the use to which the data is/will be put to.
Table 4: Defining metrics by the learning unit for the Learner (stakeholder)
Table 4 provides an example of the data sources for a learning unit to collect the metrics.
StakeholderExpectations from learning unit
Initiatives taken by learning unit
Metrics measured Data sources Parameters
Learner · E1- >Enabling for deployment opportunities in business units using new horizon skills
· E2- >Acquiring skills for enhanced compensation and progress
· Full stack programs· Bridge programs for
role transformation· Opportunities
like power programmers, hackathons etc.
· Programs for new horizon skills
· Recommendations based on job level and project needs
Group I· Learning time· Learning patterns· Performance
in quizzes & assignments
· Cohort learning· Course assessment
scores· Goal completion
pattern· Chatbot
interactivity· Course/certification
completion based on job role and project need
Group 2· Adjacent skill
learning· Participation in
opportunities to demonstrate learning
· Lex· Telemetry system· Skill management
system· Chatbot· Assessment
systems
· Data sources are ML and AI backed
· Can be measured continuously
· All the sources are interconnected
· Data is stored based on learning done by learner with no manual intervention and hence accurate Accessible with different views and permission schemes to stakeholders
External Document © 2020 Infosys Limited External Document © 2020 Infosys Limited

• Stakeholder Identi�cation• De�ne Metrics to capture data• Data source establishment
Sense
• Analyze data
• Decipher patterns
• Correlate patterns
Feel
• Predictions to stakeholders• Compare actuals and take corrective actions• Compute ROI
Respond
Engagement
Relevance
Satisfaction
Attitude
Con�dence & Commitment
Knowledge Gained
Skills Gained
Application
Implementation
Improved PERCEPTIVE learning experience
Improved closed loop RESPONSIVE value chain
INTUITIVE decisions
During learning Post completion (1-6 months) Post learning (6+ months)
The Live Infy
Learning E�ectiveness Measurement - POV
Feel
the magic number three. The inputs from here help to predict outcomes and help the stakeholders take informed decisions.
o Post learning (>6 months)
• Application of acquired knowledge and skills
• Implementation or usage of acquired skills
Table 5 shows the terms and their interpretation while doing analysis from a learning perspective:
A live organism acquires the data on its surrounding through its sensory organs. The brain then processes this data to create patterns, which forms the basis for decision-making. In the “Feel” component
Analyze dataIn this step, we analyze the metrics defined in the “Sense” phase to arrive at patterns. The analysis is performed basis the expectations from each of the identified stakeholders and evaluation of whether the expectations are fulfilled. Therefore, it is required to map the metrics to categories/ aspects of learning that is measured. Here are some guidelines to consider while doing analysis of data.
· Analysis of learning should cover both, the analysis during learning and post learning:
o During learning
• Engagement of learner
• Relevance of the topics being learnt
of the proposed POV, the data collected in the previous component (“Sense”) is analyzed, processed to decipher patterns and then correlations are made to make informed decisions. Thus, this also follows
• Satisfaction of the learner while indicating learning experience
o Post learning (1-6 months)
• Attitude of the learner
• Confidence and commitment to learning
• Knowledge gained
• Skills gained
Table 5: Terminology used and their connotation
Knowledge “I know it.”
Skill “I can do it right now.”
Attitude “I believe this will be worthwhile to do on the job.”
Confidence “I think I can do it on the job.”
Commitment “I intend to do it on the job.”
External Document © 2020 Infosys Limited External Document © 2020 Infosys Limited
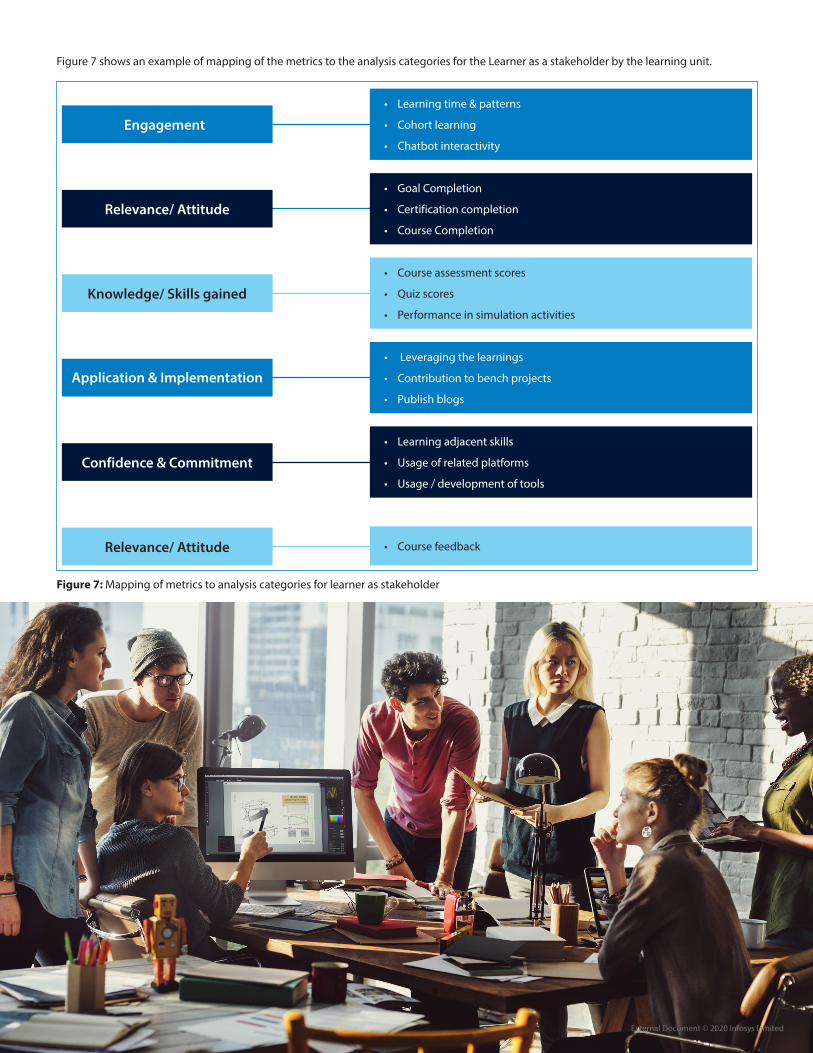
Figure 7 shows an example of mapping of the metrics to the analysis categories for the Learner as a stakeholder by the learning unit.
Engagement
Relevance/ Attitude
Relevance/ Attitude
Confidence & Commitment
Application & Implementation
Knowledge/ Skills gained
• Learning time & patterns
• Cohort learning
• Chatbot interactivity
• Leveraging the learnings
• Contribution to bench projects
• Publish blogs
• Goal Completion
• Certification completion
• Course Completion
• Learning adjacent skills
• Usage of related platforms
• Usage / development of tools
• Course assessment scores
• Quiz scores
• Performance in simulation activities
• Course feedback
Figure 7: Mapping of metrics to analysis categories for learner as stakeholder
External Document © 2020 Infosys Limited External Document © 2020 Infosys Limited

categories under which patterns can be derived. These are in-line with the analysis categories.
Figure 8 provides the patterns that can be derived.
Decipher patternsIn this step, we map the analyzed categories to their respective patterns. In the case of live organisms, the signals received from sensory organs are analyzed
and combined to form patterns, which then decide the next course of action. From the patterns, inferences are deduced, and decisions are made as part of the “Feel” component. Listed are the main
Engagement
Relevance/ Attitude
Relevance/ Attitude
Confidence & Commitment
Application & Implementation
Knowledge/ Skills gained
Individual Learning Pattern
Community Learning Pattern
Subject Coverage Pattern
Application Patterns
Assessment Patterns
Satisfaction Pattern
• Working in projects
• Contribution to bench projects
• Publish blogs
• Goal Completion
• Certification completion
• Course Completion
• Learning adjacent skills
• Usage of related platforms
• Usage and development of tools
• Course assessment scores
• Quiz scores
• Performance in simulation activities
• Course feedback
Figure 8: Mapping of metrics, analysis categories and the patterns for a learner
• Active time on learning and learning patterns
• Cohort learning
• Chatbot interactivity
External Document © 2020 Infosys Limited External Document © 2020 Infosys Limited
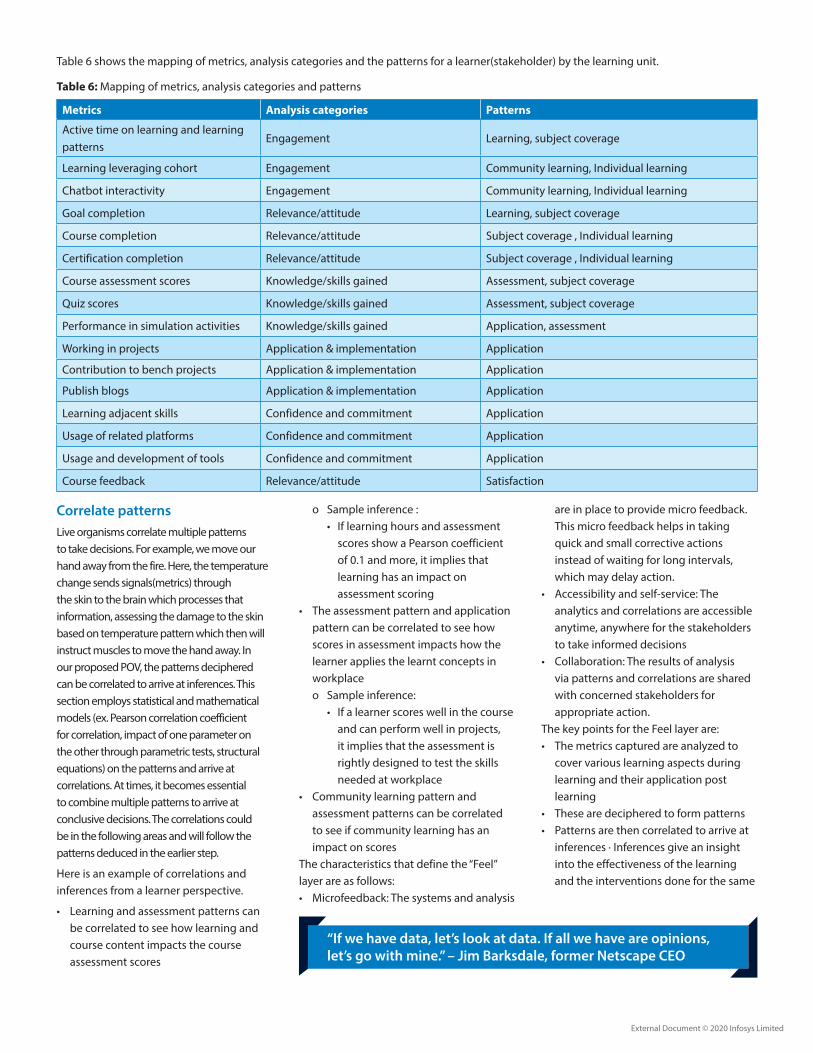
Table 6: Mapping of metrics, analysis categories and patterns
Table 6 shows the mapping of metrics, analysis categories and the patterns for a learner(stakeholder) by the learning unit.
Metrics Analysis categories Patterns
Active time on learning and learning patterns
Engagement Learning, subject coverage
Learning leveraging cohort Engagement Community learning, Individual learning
Chatbot interactivity Engagement Community learning, Individual learning
Goal completion Relevance/attitude Learning, subject coverage
Course completion Relevance/attitude Subject coverage , Individual learning
Certification completion Relevance/attitude Subject coverage , Individual learning
Course assessment scores Knowledge/skills gained Assessment, subject coverage
Quiz scores Knowledge/skills gained Assessment, subject coverage
Performance in simulation activities Knowledge/skills gained Application, assessment
Working in projects Application & implementation Application
Contribution to bench projects Application & implementation Application
Publish blogs Application & implementation Application
Learning adjacent skills Confidence and commitment Application
Usage of related platforms Confidence and commitment Application
Usage and development of tools Confidence and commitment Application
Course feedback Relevance/attitude Satisfaction
are in place to provide micro feedback. This micro feedback helps in taking quick and small corrective actions instead of waiting for long intervals, which may delay action.
• Accessibility and self-service: The analytics and correlations are accessible anytime, anywhere for the stakeholders to take informed decisions
• Collaboration: The results of analysis via patterns and correlations are shared with concerned stakeholders for appropriate action.
The key points for the Feel layer are:• The metrics captured are analyzed to
cover various learning aspects during learning and their application post learning
• These are deciphered to form patterns• Patterns are then correlated to arrive at
inferences · Inferences give an insight into the effectiveness of the learning and the interventions done for the same
Correlate patternsLive organisms correlate multiple patterns to take decisions. For example, we move our hand away from the fire. Here, the temperature change sends signals(metrics) through the skin to the brain which processes that information, assessing the damage to the skin based on temperature pattern which then will instruct muscles to move the hand away. In our proposed POV, the patterns deciphered can be correlated to arrive at inferences. This section employs statistical and mathematical models (ex. Pearson correlation coefficient for correlation, impact of one parameter on the other through parametric tests, structural equations) on the patterns and arrive at correlations. At times, it becomes essential to combine multiple patterns to arrive at conclusive decisions. The correlations could be in the following areas and will follow the patterns deduced in the earlier step.
Here is an example of correlations and inferences from a learner perspective.
• Learning and assessment patterns can be correlated to see how learning and course content impacts the course assessment scores
o Sample inference :• If learning hours and assessment
scores show a Pearson coefficient of 0.1 and more, it implies that learning has an impact on assessment scoring
• The assessment pattern and application pattern can be correlated to see how scores in assessment impacts how the learner applies the learnt concepts in workplace
o Sample inference:• If a learner scores well in the course
and can perform well in projects, it implies that the assessment is rightly designed to test the skills needed at workplace
• Community learning pattern and assessment patterns can be correlated to see if community learning has an impact on scores
The characteristics that define the “Feel” layer are as follows:• Microfeedback: The systems and analysis
“If we have data, let’s look at data. If all we have are opinions, let’s go with mine.” – Jim Barksdale, former Netscape CEO
External Document © 2020 Infosys Limited External Document © 2020 Infosys Limited

• Stakeholder Identi�cation• De�ne Metrics to capture data• Data source establishment
Sense
• Analyze data
• Decipher patterns
• Correlate patterns
Feel
• Predictions to stakeholders• Compare actuals and take corrective actions• Compute ROI
Respond
Engagement
Relevance
Satisfaction
Attitude
Con�dence & Commitment
Knowledge Gained
Skills Gained
Application
Implementation
Improved PERCEPTIVE learning experience
Improved closed loop RESPONSIVE value chain
INTUITIVE decisions
During learning Post completion (1-6 months) Post learning (6+ months)
The Live Infy
Learning E�ectiveness Measurement - POV
Respond
• Provides a quick way to monitor the learning related activities and make course corrections, true to the agile way of working
• Helps stakeholders take informed decisions like availability of enabled workforce for projects which further helps with future planning
• Helps corroborate the hypothesis made while designing courses, assessments, certification, learning pedagogies and ascertain their rightful alignment. Comparing the predictions versus the actuals will help in course corrections in the hypothesis.
A live organism responds to the stimulus after receiving data, processing and correlating it through the brain. The proposed model also responds to concerned stakeholders after analyzing the correlations derived from the patterns. The response is through predictions, recommendations and by ways of return on investment in the learning. As mentioned earlier, depending on the stakeholder, the responses vary, as the expectations differ from stakeholder to stakeholder. The ROI may be in the form of monetary value or fulfillment
of expectations basis the availability of accurate data through the data systems identified.
Predictions and recommendations to stakeholdersThis step enables predictions, which tend to prove if the learning interventions and initiatives for learning taken up by the stakeholders brought out the proposed value, meeting the expectations of the stakeholders. Several benefits accrue from timely predictions such as:
External Document © 2020 Infosys Limited External Document © 2020 Infosys Limited

Table 7: Predictions and recommendations to stakeholders by the learning unit
Table 7 shows the predictions that can be generated by a learning unit for its stakeholders.
StakeholderExpectations from learning unit
Metrics Correlation Prediction RecommendationsMeeting expectations
Learner E1->Enabling for deployment opportunities in business units using new horizon skills
Learning time & patterns
Correlation between learning and assessment patterns
How likely is an employee who spends 80% or more of the stipulated learning hours on the course likely to clear the end of course assessment?
System notifications to learners to spend more time on learning and nudge employees if there is a lag
If course and certifications are completed, the employees have opportunities to work in new horizon skills
What percentage of employees who have cleared the end of course assessment and learnt for 80% or more of the stipulated course time likely to qualify in the internal / external certification?
E2->Skilling for enhanced compensation and progress
Goal completion
Correlation between learning, subject coverage and assessment patterns
Recommendations of goals and learning paths to help employees refactor
Refactoring to new age roles may result in better compensation and career progression
How likely is an employee who completes the goals and the learning paths become suitably refactored/ re-purposed to a new age role?
Certification completion
Business units
E3-> Indication of possible attrition based on learning pattern
Goal and learning path completion
Correlation between learning, subject coverage and assessment patterns
How likely is the employee to quit the company if the progress is slow and are the topics being learnt not related to the goal/learning path
Provide the list of such employees to the business unit for further action
Actions to arrest attrition
o Attrition
o Subjects and learning paths that would be preferred
o Community collaboration
• Check if the predictions meet the expectations of the stakeholders
Here are some guidelines for coming up with predictions.
• Predictions must be based on accurate data collected through systems over a substantial period. Employing machine learning algorithms for predictions using metrics and patterns mentioned in earlier sections is recommended
• Predictions aligned to patterns deciphered & correlated could be as follows
o Completion of learning
o Scores
o Certification completion
o Readiness of learner for newer skills and roles
o Staffing availability
External Document © 2020 Infosys Limited External Document © 2020 Infosys Limited

terms of accuracy• Take corrective actions to ensure accuracy
checks• Machine learning based systems are
recommended for this stepTable 8 shows an instance of a prediction and actual comparison with corrective action from a learning unit for a learner (stakeholder).
ROI is computed as a percentage. Here is an example of computation of ROI done by a learning unit keeping in mind the learning services offered to its stakeholders.
The total cost accrued for training/learning would include -• Salaries of ETA team• Cost of infrastructure• Learning time spent by learner(billing
amount)• ETA educator enablement cost
The total gains are available in table 9.
Compare predictions with actuals and take corrective actionsThis step enables comparison of the predictions with actuals and take corrective actions. This will ensure the accuracy of predictions and the data used for these predictions. The accuracy will help in determining if the parameters
Compute ROI“What Is There Ain’t No Such Thing as a Free Lunch (TANSTAAFL)” says a management guru. Since learning is a committed investment for all learning units, they would want to compute the return on investment objectively. While we believe learning has both tangible and intangible benefits, it is important to jot down the tangible benefits with the intangible ones being the add-ons to learning. Tangible benefits would include return in financial terms, meeting of expectations for the stakeholder etc. An example of an intangible benefit would be
considered are correct and if enough learning has happened through the data fed to the system. This is akin to how the brain of a living organism stores memory of previous learnings and compares with current situations and updates the learning based on results. Here are the guidelines for this step-• Compare predictions against actuals in
the personality development and boost in the confidence level of the learner, which may be difficult to measure objectively.
We look at the tangible benefits and systems can help compute the same.
A fundamental formula for computing ROI would be as follows:
Return on investment = (Total gains from learning – total
cost accrued for training or learning) / total cost accrued for training or
learning
Table 8: Prediction vs actuals
Table 9: Gains and ROE/ROI for a learning unit
Stakeholder Prediction Actuals Corrective action
LearnerLearner has spent 80% of time on the course, cleared course assessment and hence likely to clear internal certification
Learner has not attempted certification
Awareness and recommendation of course related certification to the learner would help
Stakeholder Expectations from learning unit GainsROI/ROE component
Learner· Deployment opportunities in business units· Opportunities in projects using new
horizon skills
· If project to which the employee is deployed belongs to new horizon skills/roles, expectation is met
· ROE
· Participation in skill demonstration activities / initiatives / platforms / allocation to related projects
· ROI
Talent management groups
· Increase in digital skills in the organization· # of employees in the newer digital skills and
increasing trend· ROE
Business units/Accounts where learners are deployed
· Increase workforce readiness for projects involving new horizon skills
· # of employees in newer digital skills and staff fulfillment
· ROE
· Availability/ readiness of talent pool with specific skill sets
· Reduction in training and certification cost · ROI
· Indication of possible attrition based on learning pattern
· Differential billing · ROI
Organization Leadership
· Training as a differentiator · # of client visits where training is presented · ROI
· Availability of new-gen learning platforms for the customers
· # of employees in newer digital skills and staff fulfillment
· ROE
· Availability of skilled workforce through globally recognized training programs
· Reduction in movement of employees onsite – localization data
· ROI
External Document © 2020 Infosys Limited External Document © 2020 Infosys Limited

The entire measurement model needs to cater to any size organization and must produce reliable and consistent results through automated systems aided by machine learning and artificial intelligence. Thus, this constitutes the live digital brain for the organization.
The key points of the “Respond” layer are :• The deciphered patterns and inferences
are analyzed to provide predictions• Predictions are then compared with
actuals to check the accuracy of the patterns deciphered
• High accuracy indicates effectiveness of the interventions and metrics captures resulting in microfeedback
• The return on investment on learning can be computed providing business value in monetary terms serving as another indicator for learning effectiveness
ROI for ETA for a specific course would be –Expenses = Salaries of ETA team for the learning period + Cost of infrastructure (if any) + Learning time spent by learners(billing amount) + ETA educator enablement cost on the topic(if any)
Gains = Participation in skill demonstration activities / initiatives / platforms / allocation to related projects + Reduction in training and certification cost + Differential billing (if any)+ # of client visits anchored with training presentation + % reduction of global movement due to localization enablement
In a similar fashion, each of the actors (talent management teams, business units etc.) can compute their ROI for learning based on their expectations and data available.
The characteristics of the “Respond” layer are as follows:• Micro feedback: This is carried out in
a back and forth approach. The live system captures the feedback from the
learners. The system in turn provides the micro feedback to its stakeholders. For example, a learner completes a course. This is a micro feedback recorded by the system. As a feedback to the learner, the system sends out a notification to take the relevant certification.
• Personalized recommendations, guided practice and knowledge graph for “what to do next”: The predictions and recommendations are personalized. They guide the stakeholder to take relevant action. The knowledge graph indicates the stakeholder to look up the adjacency skills basis the learning journey undertaken. For ex. A learner is provided recommendation on the skills based on project needs/existing skills, the learning paths provide the guided practice to learning and the knowledge graph provides the adjacency skills for the learner.
“The goal is to turn data into information and information into insight.” – Carly Fiorina, former chief executive officer, Hewlett Packard
From merely measuring the feedback on course and instruction delivery a few years ago, the learning unit progressed to
• deciphering patterns,
• establishing correlations and making predictions,
• evaluating return on expectations, and
• computing return on investment (to assess the worthiness of the learning offering, savings of cost when trained employees went back to their projects, differential billing for the employees, rise in the number of employees trained on skills of the future etc.).
Several specially designed indigenous systems help to capture the footprints and trails of each learner.
The evolve component of the core engine brings in the collaboration and closing of feedback loop with the stakeholders more prominently. The reason for sensing, feeling and responding is to do continuous improvement and stay as a live organization. Based on inputs coming in, all the learning programs/ interventions are continually improved. Just as learning is a continuum, revision/ review/ alteration should be a continuous and integral activity. This will ensure that the learning unit is dynamic, proactive and live. The evolve phase addresses these with the help of systems aided recommendations, notifications triggering for continuous improvement. Continuous improvement or Kaizen is a Japanese business philosophy
of continuous improvement of working practices, personal efficiency, etc. Learning organizations need to put in place mechanisms for continuous improvement and actionize on them. Agile practices and frameworks can help in bringing this continuous improvement regularly and help actionize on them. Some of the points at regular cadence could include –
• Planning meetings with all stakeholders before new learning interventions
• Retrospective meetings post the learning interventions
• Off-site meetings with the team members
• Skip level meetings
Evolve continually
“Continuous improvement is better than delayed perfection.” – Mark Twain
External Document © 2020 Infosys Limited External Document © 2020 Infosys Limited

External Document © 2020 Infosys Limited External Document © 2020 Infosys Limited

A sentient enterprise is well equipped with required internal systems to collect/gather data, prepare the data for analysis and process it to yield useful insights. Analytics today has gained stature like never before and organizations the world over are attaching a huge significance to data being quickly captured, analyzed and actionable insights being worked upon to deliver business value.
ETA today is studying data garnered from internal systems such as
telemetry, learning management, Skill management systems and platforms for collaborating with significant others – Talent management teams, Skill council, Organization Development teams to understand learning patterns, engagement of learners, provide guidance to learners at appropriate intervals to further enhance
the learning experience, facilitate early deployment, negate competency/skill gaps, etc. As our non-executive Chairman, Nandan Nilekani says, “The only friction between an employee and their learning should be their motivation” , while the rest of the needs are taken care through learning the live enterprise way.
Closing comments
“We tend to overvalue the things we can measure and undervalue the things we cannot.” – John Hayes
External Document © 2020 Infosys Limited External Document © 2020 Infosys Limited

© 2020 Infosys Limited, Bengaluru, India. All Rights Reserved. Infosys believes the information in this document is accurate as of its publication date; such information is subject to change without notice. Infosys acknowledges the proprietary rights of other companies to the trademarks, product names and such other intellectual property rights mentioned in this document. Except as expressly permitted, neither this documentation nor any part of it may be reproduced, stored in a retrieval system, or transmitted in any form or by any means, electronic, mechanical, printing, photocopying, recording or otherwise, without the prior permission of Infosys Limited and/ or any named intellectual property rights holders under this document.
For more information, contact [email protected]
Infosys.com | NYSE: INFY Stay Connected
References
Authors
[1] “Infosys Live Enterprise – A continuously evolving and continuously Learning organization”, Mohammed Rafee Tarafdar, Jeff Kavanaugh , Harry Keir Hughes retrieved from https://www.infosys.com/about/knowledge-institute/insights/documents/learning-organization.pdf
[2] “The Sentient Enterprise: The Evolution of Business Decision Making”, Oliver Ratzesberger, Mohanbir Sawhney, Wiley publications, 2017
[3] “CIRO Model: The Definitive Guide”, Jonathan Deller, retrieved from https://kodosurvey.com/blog/ciro-model-definitive-guide
[4] “Complete Philips ROI Model Tutorial for Beginners”, Jonathan Deller, retrieved from https://kodosurvey.com/blog/complete-philips-roi-model-tutorial-beginners
[5] “Kaufman’s Model of Learning Evaluation: Key Concepts and Tutorial”, Jonathan Deller, retrieved from https://kodosurvey.com/blog/kaufmans-model-learning-evaluation-key-concepts-and-tutorial Kaufmann
[6]”The Concise Definition of The Zachman Framework”, John A. Zachman, retrieved from https://www.zachman.com/about-the-zachman-framework
[7]”Gibson’s Theory of Perceptual Learning”,Karen E. Adolph, Kari S. Kretch retrieved from https://nyuscholars.nyu.edu/en/publications/gibsons-theory-of-perceptual-learning-2
Meenakshi S Lead Principal- – Education, Training & Assessment
Thirumala Arohi VP and Head – Education, Training & Assessment
Seema Acharya AVP and Senior Lead Principal – Education, Training & Assessment