points of difference in affiliations within wireless
TRANSCRIPT

POINTS OF DIFFERENCE IN AFFILIATIONS WITHIN
WIRELESS INDUSTRY CONSORTIA
by
Sorin Sorlescu
A thesis submitted to the Faculty of Graduate Studies and Postdoctoral Affairs
in partial fulfillment of the requirements for the degree of
Master of Applied Science in Technology Innovation Management
Department of Systems and Computer Engineering
Carleton University
Ottawa, Ontario, Canada, K1S 5B6
December 2010
© Copyright 2010, Sorin Sorlescu

1*1 Library and Archives Canada
Published Heritage Branch
395 Wellington Street Ottawa ON K1A0N4 Canada
Bibliotheque et Archives Canada
Direction du Patrimoine de I'edition
395, rue Wellington Ottawa ON K1A 0N4 Canada
Your We Votre reference ISBN: 978-0-494-79555-2 Our file Notre reference ISBN: 978-0-494-79555-2
NOTICE: AVIS:
The author has granted a nonexclusive license allowing Library and Archives Canada to reproduce, publish, archive, preserve, conserve, communicate to the public by telecommunication or on the Internet, loan, distribute and sell theses worldwide, for commercial or noncommercial purposes, in microform, paper, electronic and/or any other formats.
L'auteur a accorde une licence non exclusive permettant a la Bibliotheque et Archives Canada de reproduire, publier, archiver, sauvegarder, conserver, transmettre au public par telecommunication ou par I'lnternet, preter, distribuer et vendre des theses partout dans le monde, a des ftns commerciales ou autres, sur support microforme, papier, electronique et/ou autres formats.
The author retains copyright ownership and moral rights in this thesis. Neither the thesis nor substantial extracts from it may be printed or otherwise reproduced without the author's permission.
L'auteur conserve la propriete du droit d'auteur et des droits moraux qui protege cette these. Ni la these ni des extra its substantiels de celle-ci ne doivent etre imprimes ou autrement reproduits sans son autorisation.
In compliance with the Canadian Privacy Act some supporting forms may have been removed from this thesis.
Conformement a la loi canadienne sur la protection de la vie privee, quelques formulaires secondaires ont ete enleves de cette these.
While these forms may be included in the document page count, their removal does not represent any loss of content from the thesis.
Bien que ces formulaires aient inclus dans la pagination, il n'y aura aucun contenu manquant.
•+•
Canada

ABSTRACT
Salient constructs of 736 organizations affiliated with 9 associations, forums and
alliances in the wireless industry are used to determine consortia points of
difference. The comparison of consortia indicates that: (i) support for legacy
technologies is focused on optimization, services, and cost reduction, (ii)
support for newer technologies is focused on standards, research, hardware,
and testing, (iii) two standards are paths of technological adoption, the third
standard suggests new market entrants, (iv) motivation for membership to
consortia is based on product certification and interoperability. Comparing
consortia's identified points of difference to consortia's declared objectives three
types of relationships are observed: (i) strong support, with a good mapping
between the constructs and the objectives for two consortia, (ii) a definitional
role, where the constructs provide suggestions for what six consortia's
objectives mean, and (iii) weak support, with a poor mapping between the
identified constructs and the objectives for one consortium.
in
iv
ACKNOWLEDGEMENTS
My deepest gratitude and thanks are extended to my thesis supervisor,
Professor Antonio Bailetti. Without his support, direction and continued
dedication this research would not have possible. I would like to thank Professor
Stoyan Tanev and Professor Michael Weiss for their expert knowledge and
feedback which contributed greatly to the completion of this research.

V
Table of Contents
1. Introduction 1
1.1 Objectives 2
1.2 Deliverables 3
1.3 Relevance 3
1.4 Contributions 4
1.5 Document Organization 4
2. Literature Review 6
2.1 Views on the Wireless Industry 6
2.1.1 Standards: competing through cooperation 6
2.1.2 The evolution of the value chain in the mobile industry 9
2.1.3 The layered model 13
2.1.4 The business ecosystem model and key players 14
2.1.5 The mobile ecosystem 16
2.1.6 The Double Helix model 17
2.1.7 The dynamic ecosystem model 18
2.1.8 Real options approach in the wireless industry evolution 19
2.1.9 Strategic value assessment model 19
2.2 External Networks of Collaboration 21
2.2.1 Modular industry structure 21
2.2.2 Evolution of a firm's networks of collaboration 23
2.2.3 Dynamics of entry and network position 24
2.2.4 Industry lifecycle 25
2.3 Clusters and Social Network Theory 26
2.4 Content Analysis of Websites 28
2.4.1 Corporate identity 28
2.4.2 Content analysis 29

vi
2.5 Lessons Learned from the Literature 31
3. Research Methodology 34
3.1 Research Strategy 34
3.2 Research Steps 35
3.3 Sample Selection 38
3.4 Keywords Selection 39
3.5 Data Acquisition 40
3.6 Factor Analysis Method 40
3.7 Initial Factor Analysis 42
3.8 Clusters as sub-samples 43
3.9 Multiple Factor Analysis 43
3.10 Validation of Results 44
3.11 Points of difference as measure of alternatives 45
3.12 Instruments 46
4. Research Results 50
4. 1 Research Sample 50
4. 2 Sub-sampling 54
4. 3 Keyword Selection 58
4. 4 Factor Analysis 60
4.5 Constructs 66
Mobile Services 67
Testing Solutions 68
Fee Based Business Solutions 69
WiMAX Technology and Standard 71
Hardware 72
vii
3GPP Standard and LTE Technology 73
Revenue Management Solutions 75
Security Solutions 76
Interoperability Solutions 78
Reputation 80
Research 81
3GPP Standard and 3G Technologies Evolution 82
Fraud Detection 82
Business Opportunity Solutions 84
Licenses and Regulation 84
Conformance and Certification 86
CDMA Technology and Standards 87
Consortia Brand Names 88
4.6 Points of Difference for Consortia 90
WiMAX Forum 91
GSM Association (GSMA) 93
CDMA Development Group (CDG) 95
Next Generation Mobile Networks Alliance (NGMN) 97
CDMA Certification Forum (CCF) 100
LSTI Forum 102
UMTS Forum 105
Wireless Broadband Alliance (WBA) 108
Open Patent Alliance (OPA) 111
4.7 Multiple Memberships 113
4.8 Construct Groups Visualization 114
5. Discussion of Results 118
5.1 Points of Difference 118
WiMAX Forum 119
GSM Association 120

viii
CDMA Development Group 121
LSTI Forum 122
NGMN Alliance 123
CDMA Certification Forum 124
UMTS Forum 125
Wireless Broadband Alliance 126
Open Patent Alliance 127
5.2 Legacy and Evolution 128
5.3 Technology Adoption 130
5.4 The Emerging Role of Backend Systems 132
5.5 Members Motivation for Participation 133
5.6 Phases of Development 136
5.7 Insights Gained From Research 138
5.8 Recommendations for Keystone Organizations 142
6. Conclusions 144
6.1 Conclusions 144
6.2 Limitations 147
6.3 Future Research 148
7. References 149
7.1 Web Based Sources 156
8. Appendix 157
Appendix A: URLs, Samples and Membership 157
Appendix B: Hierarchical Decomposition 165
Appendix C: Factor Analysis Results 166
Appendix D: Membership Distribution 179

ix
List of Tables
Table 1: Research Method 35
Table 2: Multiple Factor Analysis Solutions 44
Table 3: Factor Analysis Data Validity Test Criteria 45
Table 4: Instruments of Analysis and Interpretation 46
Table 5: Consortia Membership 54
Table 6: Sub-sampling Step 1 57
Table 7: Sub-sampling Step 2 57
Table 8: Number of keyword sets in each sample 59
Table 9: Factor Analysis Results 61
Table 10: Group E Factor Analysis Solutions 64
Table 11: Group F Factor Analysis Solutions 65
Table 12: Group G Factor Analysis Solutions 65
Table 13: Group H Factor Analysis Solutions 65
Table 14: Group I Factor Analysis Solutions 66
Table 15: Mobile Services 67
Table 16: Testing Solutions 68
Table 17: Fee Based Business Solutions 70
Table 18: WiMAX Technology and Standard 71
Table 19: Hardware 72
Table 20: 3GPP Standard and LTE Technology 74
Table 21: Revenue Management Solutions 75
Table 22: Security Solutions 77
Table 23: Interoperability Solutions 78
Table 24: Reputation 80
Table 25: Research 81
Table 26: 3GPP Standard and 3G Technologies Evolution 82
Table 27: Fraud Detection 83
Table 28: Business Opportunity Solutions 84
Table 29: Licenses and Regulation 85
Table 30: Conformance and Certification 86

X
Table 31: CDMA Technology and Standards 87
Table 32: Consortia Brand Names 88
Table 33: WiMAX Forum Salient Constructs 92
Table 34: WiMAX Forum POD 92
Table 35: GSMA Salient Constructs 94
Table 36: GSMA POD 94
Table 37: CDG Salient Constructs 96
Table 38: CDG POD 96
Table 39: NGMN Salient Constructs 98
Table 40: NGMN POD 99
Table 41: CCF Salient Constructs 101
Table 42: CCF POD 101
Table 43: LSTI Forum Salient Constructs 103
Table 44: LSTI Forum POD 104
Table 45: UMTS Forum Salient Constructs 106
Table 46: UMTS Forum POD 107
Table 47: WBA Salient Construct 109
Table 48: WBA POD 110
Table 49: OPA Salient Constructs 112
Table 50: OPA POD 112
Table 51: Mapped Objectives for WiMAX Forum 119
Table 52: Mapped Objectives for GSMA 120
Table 53: Mapped Objectives for CDG 121
Table 54: Mapped Objectives for LSTI Forum 122
Table 55: Mapped Objectives for NGMN Alliance 123
Table 56: Mapped Objectives for CCF 124
Table 57: Mapped Objectives for UMTS 125
Table 58: Mapped Objectives for WBA 126
Table 59: Mapped Objectives for OPA 127
Table 60: Legacy and Evolution Constructs 128
Table 61: Members Motivation for Participation 134

XI
Table 62: Consortia Phases of Development 136
Table 63: Recommendations for Keystone Organizations 142

xii
List of Figures
Figure 1: Hemphill's Wireless Standards Development Model 8
Figure 2: Value Chain in the Wireless Industry 10
Figure 3: Players in the Wireless Industry Value Chain 13
Figure 4: Basole's Converging Mobile Ecosystem 17
Figure 5: Fine's Double Helix Model 18
Figure 6: Construct and Consortium PODI Lists 49
Figure 7: Networks Based on Keyword Scores 55
Figure 8: Clustering Dendrogram 56
Figure 9: Sample I and sub-samples E, F, G, H 58
Figure 10: WiMAX Forum POD Index Chart 91
Figure 11: GSM Association POD Index Chart 93
Figure 12: CDG POD Index Chart 95
Figure 13: NGMN Alliance POD Index Chart 97
Figure 14: CCF POD Index Chart 100
Figure 15: LSTI Forum POD Index Chart 102
Figure 16: UMTS Forum POD Index Chart 105
Figure 17: WBA POD Index Chart 108
Figure 18: OPA POD Index Chart 111
Figure 19: Distribution of CDMA Technology and Standards 113
Figure 20: Distribution of WiMAX Technology and Standards 114
Figure 21: Distribution of LTE Technology and Standards 114
Figure 22: Sample Group E: Construct Groups Visualization 115
Figure 23: Sample Group F: Construct Groups Visualization 116
Figure 24: Sample Group G: Construct Groups Visualization 116
Figure 25: Sample Group H: Construct Groups Visualization 117
Figure 26: Sample Group I: Construct Groups Visualization 117
Figure 27: Legacy and Evolution 129
Figure 28: Chronological View 130
Figure 29: CDMA Adoption 131
Figure 30: WiMAX Adoption 131

xiii
Figure 31: LTE Adoption 132
Figure 32: Consortia Evolution Cycle 137

1
1. Introduction
Information and communication technology firms affiliate to industry
associations, forums and alliances as well as standards development
organizations that design or promote technical standards. Standard setting has
become such a central technology-strategic activity that many of these firms
make substantial financial investments in cooperative standard-setting
organizations (Leiponen and Bar, 2008). Standards are increasingly recognised
as a core alignment mechanism, in which the interests of various types of
stakeholders are being negotiated. This process has major economic and
political consequences, and covers not only technical but also many social,
economic and legal aspects (Bekkers and Martinelli, 2010). Participation in
associations, forums and alliances is very important for being able to contribute
to new specifications and work items (Leiponen, 2008).
In this study the term consortia is used to identify industry associations, forums
and alliances. Based on the definition suggested by Leiponen (2008), the
affiliation is defined by the links firms have with consortia and not directly with
one another. The indication of the links that firms have with consortia - or firms'
affiliation with consortia - is based on consortia membership. The term construct
is based on the definition provided by Carlile and Christensen (2005) and
represents an abstraction that help us rise above the details to understand the
essence of what the observed phenomena are and how they operate.

2
Anderson et al. (2006) identifies the points-of-difference as a building block of a
successful customer value proposition and defines it as elements that make a
supplier's offering either superior or inferior to the next best alternative. In this
study the points-of-difference term refers to the relative importance of the salient
constructs identified for each association, forum or alliance. For example, the
Points of Difference Index (POD) for the "Hardware" construct, for the WiMAX
Forum, provides a numerical value indicating the strength of the "Hardware"
construct for members versus non-members of the WiMAX Forum in the sample
analysed.
Although the literature has addressed the relationship between consortia and
standard setting, and how standards affect - or are affected by - technological
change, relatively little attention has been paid to what differentiate the
associations, forums and alliances that support standards.
1.1 Objectives
The first objective of the research is to analyze the constructs that can be used
to distinguish the members of 9 consortia: GSM Association (GSMA), CDMA
Development Group (CDG), UMTS Forum, WiMAX Forum, LTE/STI Trial
Initiative, Next Generation Mobile Networks (NGMN), Wireless Broadband
Alliance (WBA), CDMA Certification Forum (CCF) and Open Patent Alliance
(OPA). These organizations were created at various points over the last two
3
decades1, in order to support the wireless standards and technologies of the
day.
The second objective of this research is to provide a methodology for identifying
the predominant constructs that characterize wireless industry organizations.
1.2 Deliverables
The research produced the following deliverables:
• A list of salient constructs for organizations that are members of
associations, forums or alliances in the wireless industry
• The points of difference for each association, forum and alliance
• Interpretations of the points of difference to identify: (i) constructs of
organizations involved in legacy or evolution technologies, (ii) trajectories
for technological adoption, and (iii) the membership motivation
• Recommendations for designing non-profit keystone organizations
1.3 Relevance
This research is relevant to:
• Management teams and entrepreneurs who will be able to examine the
salient constructs that define the focus areas, business models and
collaborations of organizations at various stages of technology and
standards development.
11987 - 2008

4
• Academic researchers who will be interested in the methodology used for
searching for constructs; they will be interested in methods to automate
the process of classifying organizations.
1.4 Contributions
The research makes at least three contributions:
• Constructs and points-of-difference identification can help improve
member value proposition of associations, forums and alliances. The
consortia can add value to their members by anticipating the changes in
the standards and technologies they support, and the business models of
their members.
• It improves the terminology used to describe the mobile communication
industry attributes. The keywords identified from the organizations web
sites could assist in subsequent automated searches that can improve
the understanding of the evolution of standards, technologies and how
keystone organizations adapt. The terminology and the method could
provide a faster analysis of an industry and its evolution over time.
• The new approach for identifying the constructs improves the data mining
methodologies used for mapping companies' attributes and industry
trends.
1.5 Document Organization
This thesis is organized into six chapters. The first chapter includes the
introduction and an overview of the research. The second chapter contains a

5
review of the literature pertaining to the mobile communication industry, web
content analysis using keywords, hierarchical decomposition in relationship
networks and factor analysis. The research strategy and method are described
in chapter three. Chapter four provides the results of the data acquisition and
analysis. Chapter five contains a discussion of the results. Finally, chapter six
presents the conclusions, limitations and recommendation for future research.

6
2. Literature Review
This chapter provides the review of the literature. It is organized into five
sections. Section 2.1 reviews the literature on wireless industry. Section 2.2
reviews the literature on networks of collaboration. Section 2.3 reviews the
cluster and social network theory. Section 2.4 reviews the content analysis of
websites. Finally, section 2.5 provides lessons learned.
2.1 Views on the Wireless Industry
2.1.1 Standards: competing through cooperation
The impact of standards can be articulated both in terms of the technologies
and processes to which they are applied and in terms of economic issues that
they may resolve in the market (Blind et al, 2010). Open system standards are
defined by formal standard bodies and vendor consortia. The vendor consortia
are organizations primarily composed of companies from industry that have a
vested interest in defining standards for their own commercial products and who
work together to achieve consensus on standard services and interfaces
(Dargan, 2005). A standards strategy is a plan to achieve consistency between
product development and public standards evolution. The focus of the plan is
the alignment of the purpose of the firm's participation in standards
development, the identification of the activities to be undertaken, and the
structure required to implement these activities (Bailetti and Callahan, 1995).
Organizations are motivated to come together to reach common objectives in
order to create and develop new markets whose evolution depends on the

7
interoperability of the systems produced by different vendors and the
interconnection of the networks of different operators. It is the drive of this
common goal to move technology forward and create demand for the products
or services in the market (Kazi, 2006).
Blind et al. (2010) study on the impact of the information and communication
technology standards at firm and industry level, found that the most significant
impact of standards were seen to occur in the product development and in the
coordinating the structure of industries and markets. The study notes that
"somewhat counter-intuitively", formal standards were seen to actually increase
product variety by facilitating a greater number of value-added combinations.
Formal standards appear to have their greatest impacts at downstream
application levels; major positive impacts were also seen on the globalization of
markets and on market entry, but no overall impact in terms of changing market
structure. Contrary to claims that standards level the competitive playing field,
stakeholders perceived that formal standards may even increase the market
share of dominant firms. Regarding the impact of different standardisation
bodies, the same study shows that there is no particular variance according to
the primary institutional affiliation of the respondent. The overall conclusion of
the study is that the strategic impacts of the standards are more positive than
the traditionally assumed cost and price impacts based on the exploitation of the
economies of scale.
In a study of three generations of wireless standards development, Hemphill
(2009) provides three standards development models, for TDMA (generation

8
2.0), CDMA (generation 2.5) and WCDMA (generation 3.0). The three
conceptual models are shown to be generally similar in their designs and are
shown in Figure 1.
Regulatory Environment L e 9 a l Environment
Jl U Innovation Path ^ N Preliminary Standard ^ Formal Standard ^ commercialization
*—-y Development '—v Development t—v
I V External Liaisons
Figure 1: Hemphill's Wireless Standards Development Model
The study findings are relevant to the competitive strategy chosen by wireless
telecommunications firms. Manufacturing firms tend to have a greater stake in
the development of standards than the network operators since they profit from
the licensing fees on patents related to manufacturing to the standard. In the
case of competing technologies, as was the case for CDMA adoption, the owner
of the patents entered in joint testing arrangements with a number of network
operators and cooperative working relationships with other manufacturers that
lead to the move from the preliminary standards phase to the formal standards
phase. The competition for the dominant design was won by the firm that made
a concerted effort to place itself as de facto leader and establish a pre
conceived momentum for its technology. The study also highlights that in cases
where there are questions about its technology, a competing firm must actively
participate in public industry forums to address the technical concerns raised by

9
members of the industry. The strategic technology alliances, among
manufacturers and manufactures and carriers, must be entered before the
formal standards development phase begins, as these strategic alliances will
provide concerted support for agenda-setting in the standards organizations,
protecting the technology "champion" (Hemphill, 2010).
Keil (2002) argues that standards are increasingly created through alliances.
The standardization through alliances combines elements of pure market-based
and committee-based standardization. Its largest strength lies in enabling rapid
standardization while decreasing the uncertainty that is caused by a large
number of competing technologies. Standardization alliances are often semi-
open in that the standard is developed by a limited number of firms while a
larger number of companies support the standard as adopters.
Leiponen (2008) argues that affiliations with consortia, alliances, or committees
are relevant in standardization due to the knowledge accumulation through joint
research and development arrangements. The connections that firms form
directly to one another are more important in the work item committee network.
In the empirical study of the Third Generation Partnership Program (3GPP)
Leiponen (2008) suggests that participating in consortia significantly enhances a
firm contribution to the development of specifications in committees.
2.1.2 The evolution of the value chain in the mobile industry
The value chain analysis was introduced by Porter (1985) as an assessment
tool for businesses that wanted to understand how they should position
10
themselves strategically amongst their suppliers, buyers and competitors. Porter
argued that competitive advantage stemmed from many discreet activities a firm
performs in designing, producing, marketing, delivering, and supporting its
product. Porter's traditional value chain model proposed a sequential model for
value creation at the firm level. The value chain concept has been broadened
later to describe an entire industry
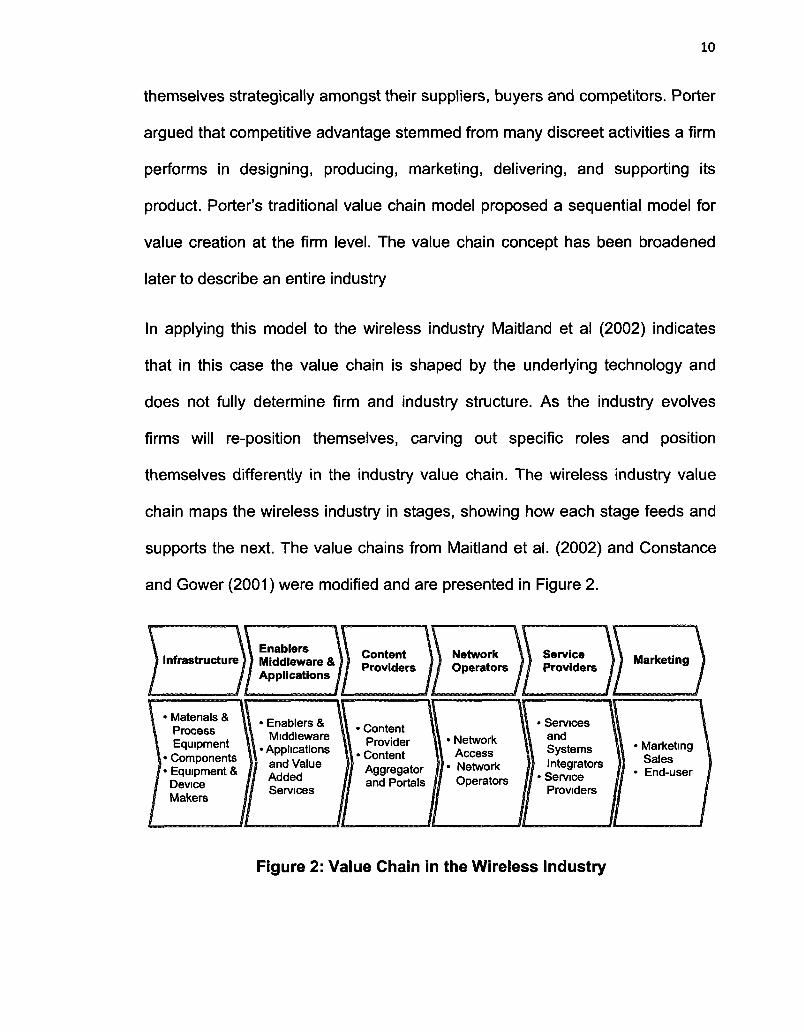
In applying this model to the wireless industry Maitland et al (2002) indicates
that in this case the value chain is shaped by the underlying technology and
does not fully determine firm and industry structure. As the industry evolves
firms will re-position themselves, carving out specific roles and position
themselves differently in the industry value chain. The wireless industry value
chain maps the wireless industry in stages, showing how each stage feeds and
supports the next. The value chains from Maitland et al. (2002) and Constance
and Gower (2001) were modified and are presented in Figure 2.
Infrastructure Enablers Middleware & Applications
Content Providers
Network Operators
Service Providers
Marketing
Materials & Process Equipment
• Components f • Equipment &
Device Makers
• Enablers & Middleware
[ • Applications and Value Added Services
• Content Provider
• Content Aggregator and Portals
Network Access Network Operators
Services and Systems Integrators Service Providers
Marketing Sales End-user
Figure 2: Value Chain in the Wireless Industry
11
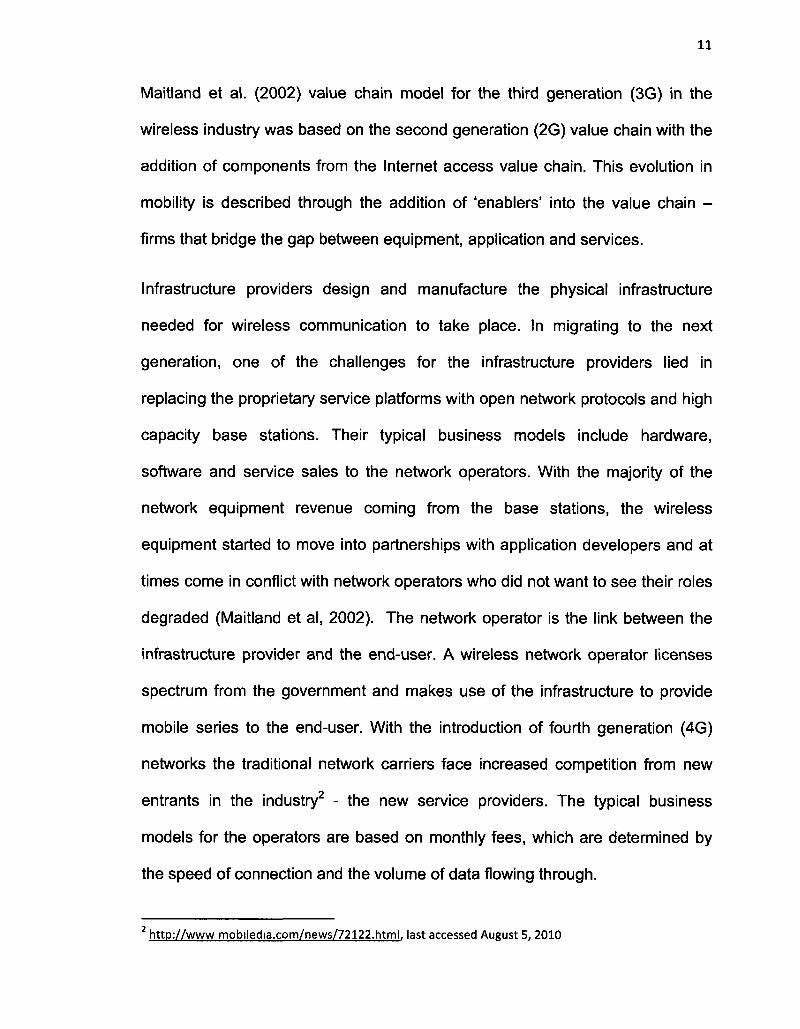
Maitland et al. (2002) value chain model for the third generation (3G) in the
wireless industry was based on the second generation (2G) value chain with the
addition of components from the Internet access value chain. This evolution in
mobility is described through the addition of 'enablers' into the value chain -
firms that bridge the gap between equipment, application and services.
Infrastructure providers design and manufacture the physical infrastructure
needed for wireless communication to take place. In migrating to the next
generation, one of the challenges for the infrastructure providers lied in
replacing the proprietary service platforms with open network protocols and high
capacity base stations. Their typical business models include hardware,
software and service sales to the network operators. With the majority of the
network equipment revenue coming from the base stations, the wireless
equipment started to move into partnerships with application developers and at
times come in conflict with network operators who did not want to see their roles
degraded (Maitland et al, 2002). The network operator is the link between the
infrastructure provider and the end-user. A wireless network operator licenses
spectrum from the government and makes use of the infrastructure to provide
mobile series to the end-user. With the introduction of fourth generation (4G)
networks the traditional network carriers face increased competition from new
entrants in the industry2 - the new service providers. The typical business
models for the operators are based on monthly fees, which are determined by
the speed of connection and the volume of data flowing through.
2 http://www mobiledia.com/news/72122.html. last accessed August 5, 2010

12
The analysis of the mobile industry through the evolution of the value chain
provides a framework for the assessment of the technical and competitive
landscape, and for value propositions of the industry. Sabat (2002) used this
model to show that over time the traditional players in the industry are
repositioning themselves from their old slots into newer niches even as new
entrants are rushing to grab their slots. Competitive threats lead to forming
synergistic partnerships in the value chain as the technological challenges and
costs of the 4G have forced device manufacturers to seek alliances to better
compete. Sabat (2002) indicates that customer demands for mobile business
value has led to the convergence of functionality in products, which in turn
necessitated the convergence of technology and standards and divergence of
products coupled with differentiation of services along the value chain.
Understanding the value chain and network economics will help the mobile
wireless companies 'unleash the potential of the value chain and to sustain
profitability levels' (Sabat, 2002).
The model for the wireless industry value chain proposed by Constance and
Gower (2001) is shown in Figure 3, in a map of the largest players in the
industry. A dotted line indicates an information exchange, while a solid line
indicates both information and a monetary exchange.

13
Application Developers
\ Network operators need \ Applications to enhance
v V
Infrastructure Providers
Content Providers
Content needs \ Content sites must develop to meet consumer \ brand and drive accessibility needs
2L Service contract End-user
Consumer
Infrastructure facilitates network management
Devices gain network access
Service contract I Sell devices
Retail
Sell devices
Device Manufacturers
Air interface compatibility
Figure 3: Players in the Wireless Industry Value Chain
2.1.3 The layered model
In an attempt to characterize the evolution of the telecommunication industry
Fransman (2002) proposes a layered model as a framework similar to the model
used by telecom engineers and software developers. In this model, Layer 1 is
defined by the Equipment and Software Layer (with solutions from infrastructure
providers), Layer 2 is defined by the Network Layer (represented mainly by
network operators), Layer 3 is the Connectivity Layer (Internet access, Web
hosting), Layer 4 is the Navigation and Middleware Layer (browsers, portals),
Layer 5 is the Application Layer (online information services) and finally Layer 6
is represented by the consumers. This approach allowed for identification of
opportunities for new entrants when the new TCP/IP became a platform on

14
which new services were built. The model also allows the visualization of the
industry modularization that facilitates entries of companies into all the layers by
allowing them to focus on their activities and ignoring the complementary ones.
The coordination of activities between layers and within layers, the comparison
and contrast between industries are also cited advantages of the model.
Fransman (2002) also highlights some of the shortcoming of the model: it is
static by not including the processes of change, it does not explain the
coordination among the players and it neglects the differences within layers.
The model leaves out the role of regulatory and standards organization.
A similar layered model presented by Maitland et al (2002) shows the position of
the mobile virtual network operators against a layered network architecture
composed of: physical, radio access, network, call control, and service platform
layers. The market orientation and business model of the network operator is
explained by the number of layers encompassed in its operations.
2.1.4 The business ecosystem model and key players
It has been argued that networks studied in biology and other natural sciences
provide an appropriate frame of reference and useful terminology for
understanding business networks (Moore, 1996; Peltoniemi, 2006). The
business ecosystem is "an economic community supported by a foundation of
interacting organizations and individuals - the organisms of the business world"
(Moore, 1993). A company should not be viewed as a member of a single
industry but "as part of a business ecosystem that crosses a variety of

15
industries". In business ecosystems, firms compete and cooperate at the same
time as they have a mutual interest in defending, developing, and growing an
ecosystem (Moore, 2006).
Similar to biological ecosystems, participants in a business ecosystem are not
all created equal and do not necessarily pursue the same strategies, lansiti and
Levien (2004a) identified three types of behaviours among actors, namely
keystone players, dominators, and niche players, which are useful in
understanding the strategies and positioning of participants in business
ecosystems. Keystone players are active leaders in the ecosystem and tend to
improve the overall health of the ecosystem. Keystones tend to assume roles of
hubs in the network; they often lie at the core's network as the most connected.
However, any firm occupying a hub in a business ecosystem, often faces
temptations to exploit their position - characteristic of a dominator, or hub
landlord, strategy. Dominators are firms that control a large part of their
networks. They take most of the value for themselves and leave little for other
companies in the ecosystem. In mature industries, where little innovation takes
place and change is slow, dominators can have a beneficial effect. In emerging
industries, this behaviour can be highly destructive as it limits innovation. Niche
players constitute the largest group in any ecosystem. They are non-dominant,
large, and small, companies that specialize in specific capabilities to
differentiate themselves from others in the ecosystem. Niche players collectively
create much of the value in a niche and generally capture the value they create.

16
Their growth depends on their ability to leverage keystone platforms and to
maintain a level of differentiation.
2.1.5 The mobile ecosystem
As early as 1980s, telecommunications industry was compared to an ecosystem
(Young, 1980), where the "ecological enquiry evaluates the adaptability of the
system". There are several recent studies that have adopted the ecosystem
perspective in the mobile industry context (Maitland et al., 2002; Tilson and
Lyytinen, 2005; 2006). There are studies on the role of specific players in the
industry, such as network operators (Peppard and Rylander, 2006) and device
manufacturers (Dittrich and Duysters, 2007). Some have focused on mobile
marketing (Becker, 2005), mobile multimedia (Balaji et al., 2005), mobile content
(Peppard and Rylander, 2006), mobile business (Coursaris et al., 2006) and
globalization of the mobile industry (Steinbock, 2003).
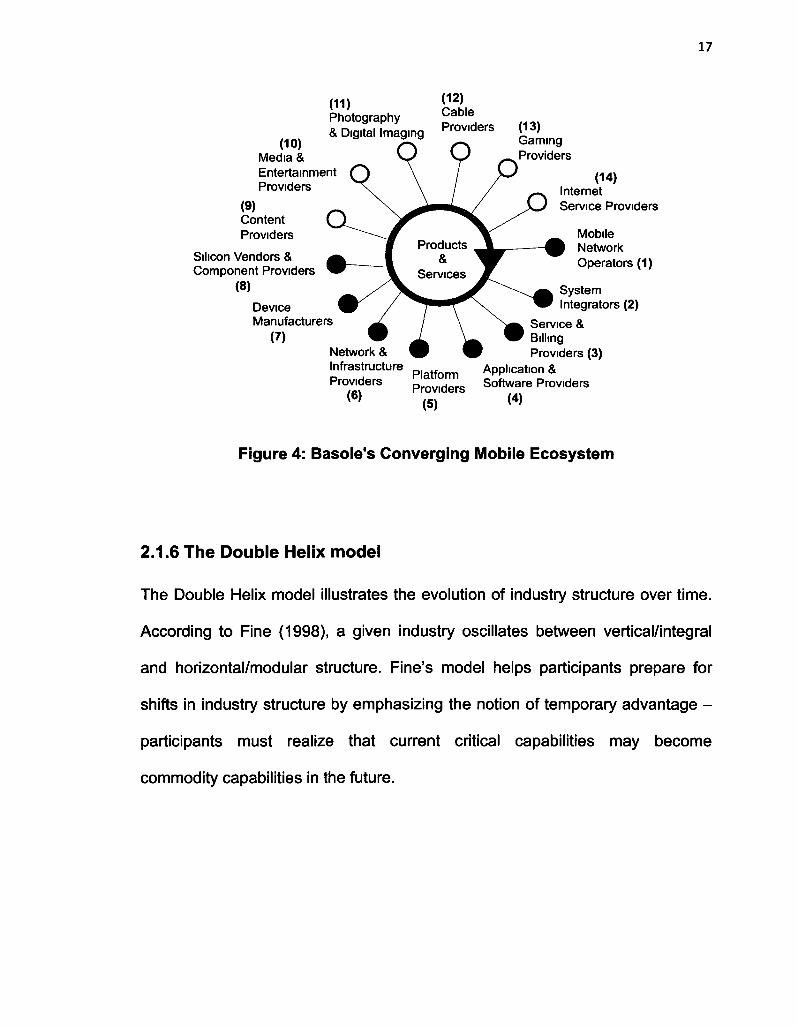
Basole (2009) presents a picture of the mobile ecosystem which consists of a
variety of firms from numerous enabling and supporting segments of products
and services. The incumbent (currently existing) segments are depicted by
darker spheres and the emerging segments by lighter spheres as indicated in
Figure 4.
17
(11) Photography & Digital Imaging
(10) Media & Entertainment Providers
(9) Content Providers
Silicon Vendors & Component Providers
(8)
Device Manufacturers
(7)
(12) Cable Providers
Network & Infrastructure Providers
(6)
(13) Gaming Providers
Platform
(14) Internet Service Providers
Mobile Network Operators (1)
System Integrators (2)
Service & Billing Providers (3)
Application & Providers S o f t w a r e Providers
(5) (4)
Figure 4: Basole's Converging Mobile Ecosystem
2.1.6 The Double Helix model
The Double Helix model illustrates the evolution of industry structure over time.
According to Fine (1998), a given industry oscillates between vertical/integral
and horizontal/modular structure. Fine's model helps participants prepare for
shifts in industry structure by emphasizing the notion of temporary advantage -
participants must realize that current critical capabilities may become
commodity capabilities in the future.

18
Integral Product Vertical Industry
Niche Competitors
High Dimensional Complexity
Organizational Rigidities
Modular Product Horizontal Industry
Technical Advances
Supplier Market Power
Proprietary Systems
Profitability
Figure 5: Fine's Double Helix Model
In this model the two drivers are the competitive intensity and technological
innovation. When the industry structure is vertical and products architectures
integral, the competitive intensity is low. Eventually the entry of competitors will
force the vertical firms to disintegrate. The previously vertical firms become
dependent on its new suppliers. These dynamics result in complete modularity,
as participants specialize in the production of horizontally applicable
components. The double helix model suggests an eventual reintegration of the
horizontally oriented industry. Constance and Gower (2001) applied this model
to the wireless industry in the 1990s to explain the device and infrastructure
value chain dynamics.
2.1.7 The dynamic ecosystem model
The dynamic ecosystem model (DEM) proposed by Vesa (2003) is an analytical
framework built on the business ecosystem concept and the Double Helix
model. It combines the evolutionary ideas of the business ecosystem and the

19
cyclic nature of the development of product architecture and organizational
structure. The DEM model is used to carry out a "macro-level" analysis of the
fast moving wireless industry and is able to manage the complexity of the
adaptive and dynamic nature of the industry and provides a network
perspective.
2.1.8 Real options approach in the wireless industry evolution
The real options approach (ROA) is a strategic tool to evaluate business
projects investment used by Kim et al (2009) to analyze the technology policy
issues in wireless networks, network service provisioning, and network
regulation and policy. Their study looked at the wireless industry migration path
options to 3G by exploring two typical network migration alternatives:
architectural innovation (infrastructure replacement) and modular innovation
(upgrades to existing equipment). The two alternatives involved evolution to two
different technologies (GSM-based or CDMA-based), and described by two
different sets of standards (3GPP or 3GPP2). The approach is a blend of a
comparative study and a "what i f study (or contingency study). Reaching
relevant data for technology development was considered challenging and as a
result the data used in the study was based on the market shares of competing
technologies.
2.1.9 Strategic value assessment model
Pagani and Fine (2008) developed a map to analyze the dynamic forces that
influence the structure and evolution of 3G wireless industry motivated by the

20
fact that this is an industry where competition is intense, growth is rapid,
innovation is abundant, and technological options are increasingly complex. The
dynamic of the industry creates great opportunities for the participants in the
global value network but poses enormous challenges for participating
organization and their business models. The resulting map focuses on the
dynamic complexity of the value network and on the interdependencies among
the wireless network providers, service providers, and the customers. The study
proposes a range of behaviours and plausible scenarios that resulted from the
discussions with several panels of experts and interviews. The 3G
communication value network scenarios were: (1) cycles of entry and
bankruptcy, where the combination of competition in infrastructure and service
provision and the creation of global markets for 3G infrastructure and terminals
may prove challenging for sustainable business models but good for customers,
(2) stable oligopoly, where powerful incumbents can discourage market entry by
new service providers, especially in the case of a breakdown in collaboration on
telecoms and software standards worldwide, (3) free for all, where governments
allow more unlicensed spectrum which could encourage market entry by service
providers and the development of global standards that could help to reduce
service and terminal prices, (4) appearance of a new dominant force, an
innovator entrant becoming a dominant force which might increase the barriers
to entry of other potential entrants while global standards help reduce service
and terminal prices, and (5) piracy development, which could be characterized
by slowing growth in profits for content providers, but could help to attract new

21
adopters and help network providers prosper from service to the customers. The
use of such a theoretical map for the industry is tentative until further data
collection could shed more light onto the likelihood of each scenario.
2.2 External Networks of Collaboration
Research into inter-firm networks has become prominent (Freeman, 1991;
Langlois, 1992; Baldwin, 2007) as a firm is no longer seen as a closed entity
that produces and markets products independently. The boundaries of the firm
are expanding to include their external interactions and relationships with
suppliers, customers, distributors, strategic partners and research organizations,
each who provide a source of innovation and have opportunities to shape the
final product. It has been found that product and industry structure have an
impact on the shape of these external networks as well as its evolution among
the firms within that industry (Hite and Hestley, 2001; Langlois, 1992; Langlois,
2002).
2.2.1 Modular industry structure
Modular product architectures can be an important source of strategic flexibility
when they enable a firm to respond faster to changing markets and technologies
by rapidly creating product variations based on new combinations of new or
existing modular components. They also enable the coordination of a global
network of component developers and suppliers (Sanchez and Mahoney, 1996).
One important implication of product modularity is that it leads to more modular
industry structure, with increased division of labour across companies,

22
specializing in different components within a given architecture. This demands
tight cross-company interaction and coordination that can be performed by
"system integrators" at the organizational and knowledge levels (Brusoni and
Prencipe, 2001). Greater heterogeneity in the production process for an industry
leads to a greater use of modular organization forms such as contract
manufacturing, alternative work arrangements, and strategic alliances. The
extent to which industries respond to heterogeneity partly depends on industry
standards, the rate of technological change, and the degree of competitive
intensity, which all facilitate the use of modular organizational forms (Schilling &
Steensman, 2001). The effect of modularity on external networks is one of
enablement (Baldwin, 2007). Transactions that previously were too expensive or
not possible now can take place. Modularization creates new boundaries -
transaction-free zones - where new entry can take place. For areas in the
network where transactions are dense and complex, their costs can be
minimized by moving them to transaction-free zones, thereby reducing the
burden on the system. These new boundaries form breakpoints where firms
(and industries) may split apart. The "modularity theory of the firm" (Langlois,
2002) suggests new roles for firms to facilitate the communication of rich
information for purposes of qualitative coordination, innovation, and re-
modularization. Hybrid forms like joint ventures and collaborative arrangements
arise for similar reasons. Modularity can help inter-firm networks engage in
knowledge exchanges, becoming brokers that specialize in the particular type of

23
knowledge exchanges within an industry - and extracting value from those
exchanges by becoming the entities that can execute them most optimally.
2.2.2 Evolution of a firm's networks of collaboration
The evolution of firm's networks is based on the firm's requirement to adapt to
the firm's resource needs and challenges (Hite and Hesterly, 2001). The main
driver is the resource availability, access and uncertainty. The identity-based
networks characterize the emergence phase. In this phase the networks are
egocentric, the ties are personal or socially related and who the ties are matter
more than the economic functions or resources that the tie provides to the firm,
because these ties are more likely to provide the resources. The ties are few
and strong. The identity-based networks do not possess the breath of resources
needed to meet the information and knowledge requirements and are more
path-dependent. By comparison, the calculative networks characterize the later,
early growth phase of a firm. The calculative networks provide greater
resources, the functions of the networks are more important than the identity of
the ties, which are motivated by economic benefits. They have a greater
density, the majority are week ties and more likely to be less redundant and
better able to bridge structural holes. The evolution of the firm networks "will be
dominated by path-dependent processes during emergence but will become
intentionally managed as the firm moves into early growth". An organization
needs to map the ecosystem in terms of inter-firm interconnections and adapt to
it as it evolves in order to have access to the complementary assets through
relationships (Iyer, 2006).

24
In the evolution of firms' strategic alliances, the alliance-based learning is vital in
the initial phase, when learning is associated with exploration. This learning
becomes more internalized, intra-firm and exploitative in the later phases
(Oliver, 2001). It has been proven that a lack of a strategic alliance can be
associated with organizational death. But participating in a network exposes
organizations to risks of being exploited by unpredictable and opportunistic
partners. There are liabilities associated with alliances. At the early stages, a
lack of alliances suggests inability to attract partners and thus inability to learn,
leading to organizational failure. The benefits from an increased number of
learning opportunities outweigh the risks and firms in this explorative phase
follow a path of increasing the number of alliances. In the later phases of the
lifecycle the alliances become more exploitative, it is a period of alliance
rationalization, as firms realize that the new alliances are too demanding in
terms of the communication energy they require, while they get too little in
return. Another view of this exploitative phase is that organizations already
raised enough funds so the alliances are not needed anymore. The organization
has already acquired the external knowledge from the new technologies and
enters a period of more internalized learning.
2.2.3 Dynamics of entry and network position
Orsenigo et al (2001) indicates that firms have found serious difficulties in
modifying their structural position within a network. Specialized firms have
tended to remain specialists, while early entrants have enjoyed significant first-
mover advantages, precisely because they have been able to embody

25
knowledge at a high level of generality. Thus, a major asymmetry seems to
have characterized the evolution of the network: while in many cases
"generalist" firms have been able to gradually absorb increasingly specific
knowledge, specialist firms found it much harder to move in the opposite
direction. As the locus of innovation moves from the firm to the network, the firm
position in the network becomes a competitive advantage (Iyer, 2006). The
network path length, clustering coefficient, and degree can be used to
understand an individual firm's position and relationships in the network
compared to competitors.
2.2.4 Industry lifecycle
The waves of diffusion and concentration in the networks evolution have been
observed since the late nineteen century (Freeman, 1991). The initial upsurge in
the inter-firm linkages is a transitory phenomenon of adaptation to the diffusion
of new generic technologies. Once firms have become familiar with these
technologies they will wish to shift the strategically sensitive areas under their
control and internalize some of the networks. According to this view, this phase
will be followed by a new wave of "rationalization and industrial re-
concentration". In the early formative period of any major new technology
system, almost by definition there are no dominant designs or standards and a
state of organizational flux. As technology becomes more mature the economies
of scale become more important and standardization takes place (Freeman,
1991). The patterns of inter-firm linkages are linked to industry's development
lifecycle (Gloor et al, 2007). The need to innovate places pressures on the

26
evolution of the network structures in the lifecycle of an industry. When firms in
the pharmaceutical industry entered a more mature era, the industry witnessed
a series of defensive mergers with direct rivals and takeovers of small
biotechnology firms, but the 'bureaucratic solidity' of the pharmaceutical firms
reduced the innovativeness of the biotechnology firms significantly.
Pharmaceutical firms were forced to change their strategy towards establishing
more loosely coupled linkages (Gloor et al, 2007).
Chesbrough and Prencipe (2008) propose a model for the innovation lifecycle,
which suggests that the evolutionary dynamics of modularity is reflected in the
innovation network evolution. In particular, they argue that firms should align
their innovation networks with phases of technology modularity, and focus their
openness in specific directions at specific stages of technology development. In
order to cope with changes in the information and knowledge requirements that
characterize the modularization process of technologies, firms must change
their innovation networks in terms of their search approach (explorative vs.
exploitative), intensity of relationships (weak vs. strong ties), number and type of
partners (research centers, startups, complementary asset holders)
(Chesbrough and Prencipe, 2008).
2.3 Clusters and Social Network Theory
The analysis of organizations through multidimensional constructs has a long
history, but it created a conceptual challenge in that a vast array of
combinations could be developed along multiple dimensions (Ketchen and
27
Shook, 1996). The response to the challenge was to identify the organizational
configurations: sets of firms that share a common profile along conceptually
distinct variables (Miller and Mintzberg, 1983). For example, an
"entrepreneurial" configuration is one that consists of firms that are small,
young, informal, and have centralized decision making; similar organizational
configurations are the organizational typologies and taxonomies.
One of the particularities of exploratory factor analysis is that the results cannot
be inferred from the sample to the population (Field, 2005). The use of factor
analysis in literature (Opoku, 2005; Hicks, 2006; Lombardi, 2008; Allen, 2009)
indicates that the sample is defined based on well-defined criteria rather than
selecting random cases from a population. The cluster analysis approach takes
a sample of elements (e.g. organizations) and groups them together such that
the statistical variance among the elements grouped together is minimized while
between-group variance is maximized (Ketchen and Shook, 1996). The cases
from the literature where databases with large sets of cases were available
(Hicks, 2005; Costello and Osborne, 2005) the variables for selecting the
clusters as samples for further factory analysis were clearly defined. In other
studies, the cluster selection was based on the researcher experience with the
subject matter and was based on a manual selection process (Allen, 2009).
Social and collaborative network theory provides us with a number of tools and
models for analyzing the relationships among actors in a network and for
creating clusters of actors with shared characteristics. Social network theory
models persons as nodes of a graph and their relationships as edges of the

28
graph (de Nooy, 2005; Caldarelli, 2007). Thus two actors are connected directly
if they have a relationship with each other, in which case they are one link away
from one another. More distant relationships are modeled as paths through the
graph. Collaborative networks are variations of social networks, where the
relationships are collaborations, e.g., open source software development
(Madey et al., 2002), or co-authors on research papers (Newman, 2001). Often
entire populations are connected into one large cluster with characteristic cluster
coefficients (Watts, 1999). Highly prolific actors or authors are linchpins in
collaborative networks. Linchpin actors or researchers play key roles in bridging
disparate groups into one large cluster by being the only joint participant in two
different projects.
2.4 Content Analysis of Websites
2.4.1 Corporate identity
The vast majority of companies use their corporate websites to reach a diverse
group of target audiences including investors, customers, employees,
researchers and the media (Insch, 2008). Companies use websites to advertise
their corporate identity and their aspirations, and to describe their products,
actions in the marketplace, and organizational credentials. This has led to a
wealth of research focusing on the content companies place on their website
and on why and how it is reflective of the company's position in the marketplace.
Almost every organization's website has an "About Us" page stating company
description, values and history. Heldal et al. (2004) discussed the usability,

29
human computer interaction and branding to demonstrate how each field alone
is insufficient but taken together they can offer optimal communication through
the Internet to maintain and build sustainable customer relationships.
Hicks et al. (2006) found that most websites are not used to interact with
potential customers. Most firms go beyond describing their current identity; they
describe their potential and their aspirations. Pollach (2005) found that even
large and well established companies use their about page to make themselves
look better than other firms in the industry. For example, many organizations
claimed dominance of the same market. Positive attributes were written in a
passive voice to insinuate a general acceptance of them. Hicks et al. (2006)
show that in defining their corporate identity, companies relate their current
situation as well as their aspirations. "A successful web site satisfies the goals of
both the users and the provider of the website" (Pollach, 2005).
2.4.2 Content analysis
The corporate website can be used as a valuable tool by researchers for
collecting information. Data is much more readily available than using interviews
or questionnaires and can be gathered quickly and efficiently using harvesting
tools. A number of tools that can scour a website searching for relevant
information can be used to find lists of sites based on a particular topic, can
search for specific content within a predefined set of websites or choose search
results based on any number of factors. Perry and Bodkin (2000) examined self
promotion by Fortune 100 companies on their websites. McMillan (2000)

30
surveyed 19 different studies using web content analysis. Pollach (2005)
examined how companies present themselves on their websites. Porter et al.
(2007) described a method for collecting technical intelligence and Opoku
(2005) investigated the most innovative business schools. A number of
researchers have recently used keyword based search techniques to build
theory and/or test hypotheses in the field of management science (Ferrier, 2001;
Hicks et al, 2006; Opoku, 2005; Lombardi, 2008; McGinnis, 2008).
Ferrier (2001) conducted an exhaustive manual search of keywords in
thousands of press releases of sixteen firms over seven years to study the
aspects and performance of different classes of competitive attacks within a
population of high tech firms. Hicks et al. (2006) used web mining techniques to
gather data on the commercialization strategies of innovative small high tech
firms. Opoku (2005) studied brand personality of US business schools using a
dictionary of terms representative of the dimensions of brand personality. The
frequencies of the words on the schools' websites were obtained and the
pattern of occurrence assessed to classify the schools. Lombardi (2009) used
web content analysis of keywords to assess and classify the interactions
between Eclipse Foundation Members and Eclipse Projects. McGinnis (2008)
used the same methodology to assess and classify the competitive actions of
companies reliant on open source software for revenue. Allen (2009) used the
content analysis of keywords to assess and classify the activities that
organizations employ to enable value co-creation with customers and end
users.

31
Various tools are available to support the web searches required to gather the
data for these analyses. Of the many commonly available search engines, those
with the most readily available and adaptable Application Programming
Interfaces (API) includes Google's Ajax API, Microsoft Live Search API, Yahoo!
Search API and KSAT3.
Exploratory Factor Analysis (EFA) has a long history in the social sciences.
While it has been used most often for research on human psychology, recently it
has been shown to be an effective tool to reduce the large volumes of data
gathered through internet mining by extracting the base constructs underlying
how small and medium firms do business (Hicks et al, 2006; Lombardi, 2009;
McGinnis, 2008; Allen 2009). In simple terms, factor analysis is used to discover
patterns in the relationships among a number of variables. It specifically seeks
to explain these relationships using a much smaller set of variables called
factors. A number of recent texts and papers provide excellent treatments of
how to perform exploratory factor analysis using SPSS (Darlington, 2010; Field,
2005; Costello & Osborne, 2005; Reinard, 2006; Stevens, 2009).
2.5 Lessons Learned from the Literature
The following are the major insights from the literature review.
Social network theory, content analysis and factor analysis can be used to
analyze the relationships among actors in a network.
3 http7/github com/mwnorman/KSAT

32
The participants in business ecosystems and networks of collaboration are
identified by various roles and behaviours. The keystones or the hubs assume
leadership role while niche players focus on specific capabilities.
Data on the wireless industry from public sources is scarce. The theoretical
studies use panels of experts and the ones from public data sources are most
often one-sided. The more detailed and complete studies of the wireless
industry use data from private sources.
Web sites are used to communicate the identity and aspirations of
organizations; the industry associations, forums and alliances are created to
promote the interests of their members, but there is little evidence on how this
information can be verified or validated; this creates an opportunity to confirm
this information by analyzing member's web pages.
Standards are increasingly created and influenced by consortia. This type of
standardization combines elements of pure market-based and committee-based
standardization. Its largest strength lies in enabling rapid standardization while
decreasing the uncertainty that is caused by a large number of competing
technologies. Standardization alliances are often semi-open in that the standard
is developed by a limited number of firms while a larger number of companies
support the standard as adopters.
A firm is no longer seen as a closed entity that produces and markets products
independently. The boundaries of the firm are expanding to include their
external interactions and relationships with industry stakeholders that contribute

33
to the development and commercialization of the firm's products. An
organization's identity is shaped by its external networks of collaboration.
As technology evolves and new standards emerge a firm's relationships in its
networks of collaboration are changing. By understanding the evolution cycles in
the industry a firm can shape its entry points and strategic alliances.

34
3. Research Methodology
This chapter describes the research design and method. It is organized into
eleven sections. Section 3.1 provides an overview of the research strategy.
Section 3.2 describes the steps carried out in this research. Section 3.3
describes the sample selection. Section 3.4 discusses the keyword selection
process. Section 3.5 describes how the data used in this research was
collected. Section 3.6 includes a description of the factor analysis method used
in this research. Section 3.7 describes the results from the initial analysis. The
methodology for creating the clusters is presented in Section 3.8. Section 3.9
discusses the use of multiple factor analyses. Section 3.10 covers the criteria
for results validation, and finally Section 3.11 presents the instruments for data
analysis and interpretation.
3.1 Research Strategy
This research uses data mining techniques and website content analysis to
identify the main characteristics of consortia in the wireless industry. The
approach is based on grounded theory and follows the recommendations of
Carlile and Christensen (2005).
A dataset comprised of information on members of several consortia in the
wireless industry was developed using search engines and keywords
associated with wireless technologies, standards and business models. Factor
analysis was used to reduce the dimensions of the information in the dataset.
As the goal of this research is to uncover the diversity of constructs, a multiple

35
non-probability sample approach was used to gain a better understanding of the
diversity of organizations' constructs.
This approach builds on the research of Hicks et al. (2006) and Opoku (2005)
for web search and analysis methods and on social network theory (de Nooy et
al, 2005) and Caldarelli (2007) for clustering methods.
The factor analysis results were grouped together, based on their similarity, to
form constructs. The relative importance of the constructs is used to present two
point-of-difference views: (i) how consortia ranks based on a construct, and (ii)
how the constructs rank for a consortium. The identified salient constructs
represent the points-of-difference for consortia.
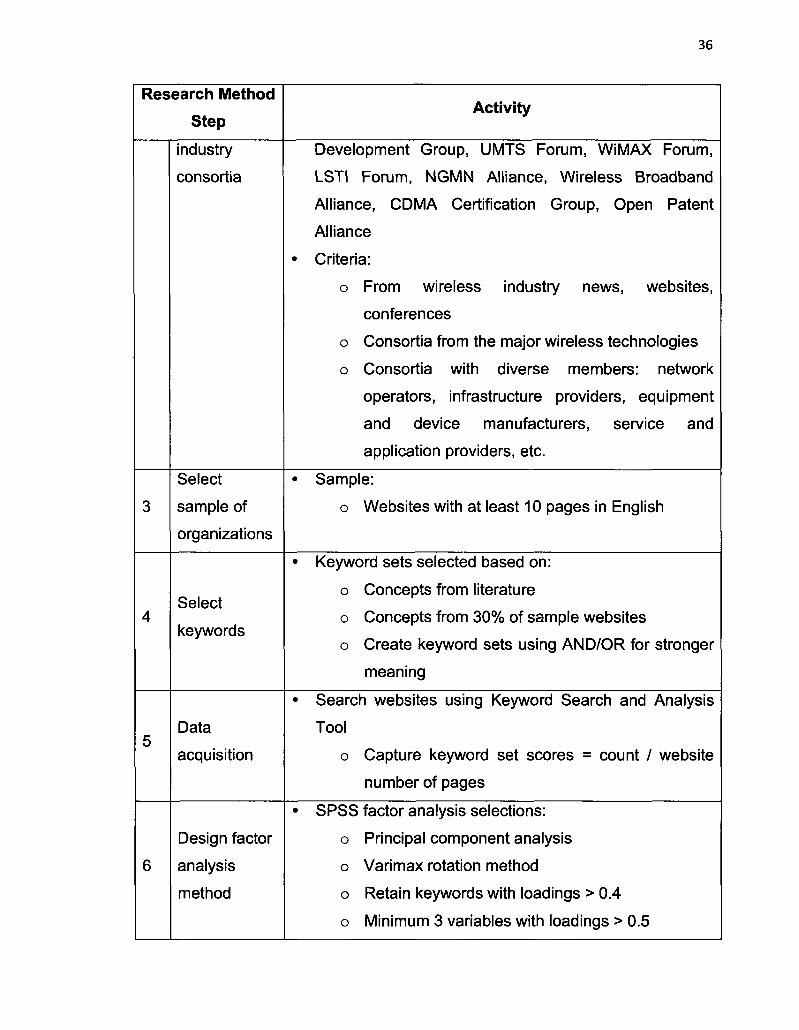
3.2 Research Steps
Table 1 identifies the steps carried out to complete this research:
Table 1: Research Method
Research Method
Step
1
2
Literature
review
Select
sample of
Activity
• Select and review literature on:
• business models, technologies and standards in the
wireless industry
• web data mining techniques
• clustering and similarity
• statistical techniques for dimension reduction
• develop lessons learned from the literature review
• Select a non-probability sample of consortia from the
wireless industry: GSM Association, CDMA
36
Research Method
Step
3
4
5
6
industry
consortia
Select
sample of
organizations
Select
keywords
Data
acquisition
Design factor
analysis
method
Activity
Development Group, UMTS Forum, WiMAX Forum,
LSTI Forum, NGMN Alliance, Wireless Broadband
Alliance, CDMA Certification Group, Open Patent
Alliance
• Criteria:
o From wireless industry news, websites,
conferences
o Consortia from the major wireless technologies
o Consortia with diverse members: network
operators, infrastructure providers, equipment
and device manufacturers, service and
application providers, etc.
• Sample:
o Websites with at least 10 pages in English
• Keyword sets selected based on:
o Concepts from literature
o Concepts from 30% of sample websites
o Create keyword sets using AND/OR for stronger
meaning
• Search websites using Keyword Search and Analysis
Tool
o Capture keyword set scores = count / website
number of pages
• SPSS factor analysis selections:
o Principal component analysis
o Varimax rotation method
o Retain keywords with loadings > 0.4
o Minimum 3 variables with loadings > 0.5

37
Research Method
Step
7
8
9
10
Initial factor
analysis
Clustering
Multiple
factor
analyses in
all sample
groups
Validate
factor
analysis
Activity
o Select number of factors: Kaiser criterion and
Scree plot
• Initial factor analysis
o Assess the degree of homogeneity of the sample
o Determine the number of factors that can be
extracted and the level of diversity of the factors
• Introduce dissimilarity as control variable
• Create networks of organizations that are linked if they
share similar scores for the same keywords
o Similar to four-point Likert scale
o 4 networks: organizations are linked if they share
keywords in the 1st, 2nd, 3rd and 4th quartile of the
keyword range
• Use hierarchical decomposition on each of the 4
networks
o Create clusters of organizations in each network
o Each cluster is defined by a dissimilarity index
• Retain all clusters with more than 200 organizations:
o Clusters A, B, C, D, E, F, G, H
• Run multiple factor analyses in each cluster
• Analyze the factors in each cluster
• As some clusters overlap retain only the clusters with
diverse and relevant factors
• Select factor analysis solution only if:
o Keywords associated in one factor make sense
to the experienced researcher
o Correlation table determinant > 1.0 x 10"5
o KMO sampling adequacy test > 0.5

38
Research Method
Step
11
12
13
14
15
Validate
results
Rank
consortia
Rank
constructs
Validate
factor groups
Draw
conclusions
Activity
o Bartlett's significance test < 0.05
• Repeat the factor analysis for the solutions retained for
interpretation with a sample or organizations not
involved in the wireless industry
• In each sample create a ranked list of consortia based
on the relative importance of each construct using the
POD Index as defined in Section 3.11
• In each sample create a ranked list of constructs based
on their relative importance in each consortium, using
the POD Index as defined in Section 3.11
• Check that factor analysis identified factors are part of
the same factor analysis solution
• Synthesize conclusions and insights
3.3 Sample Selection
The unit of analysis is the website of an organization which is a member of one
of the wireless industry consortia included in this research. Neuman (2003)
identified two types of sampling: probability and non-probability sampling.
Eisenhardt (1989, 2007) and Patton (1990) highlight the inappropriateness of
random sampling when searching for diversity of phenomena. This type of
sampling is used in similar research (Hicks et al., 2006) where factor analysis
methods are exploratory in nature and their results are not expanded to the
population from which the sample was selected.

39
In this study, the primary purpose of sampling is to collect a diverse enough
group of organizations that could help understand as many characteristics as
possible of the organizations in the wireless industry consortia. Random
(probability) sampling could carry the risk of samples too homogenous to allow
for meaningful cluster analysis and also of disproportionate representation of
organization types.
Regarding the size of the sample of consortia to include, this study followed the
recommendations made by Eisenhardt (1989, 2007) to include between four
and ten cases. Patton (1990) indicates that the validity and the insights
generated from qualitative research have to do more with the information
richness of the cases selected and the analytical capabilities of the researcher
than with the sample size.
3.4 Keywords Selection
The keywords are intended to represent as many of the characteristics of the
wireless industry consortia as possible. Keywords were collected through an
exhaustive search of the literature and supplemented with additional words
found through a theoretically informed contextual search of the 9 consortia' web
pages and from 30% of the selected organizations' web pages. The initial set of
keywords was rationalized to eliminate words that either produced negligible
successful searches or were found to be ubiquitous (Hicks et al, 2006).
Since the Keyword Search and Analysis Tool (KSAT) supports logical "OR" and
"AND" operations it was possible to combine many keywords to form sets of

40
keywords that allow a stronger and more focused meaning. In this study the
factor analysis is used with a large number of keywords aiming to uncover the
diversity of features in our samples.
3.5 Data Acquisition
Data was collected following a web data mining approach similar to Hicks et al.
(2006) and Opoku (2005). The Keyword Search and Analysis Tool (KSAT) is an
open source tool used to perform web searches and is based on the Google
Ajax search API. The tool uses text files containing lists of keywords and
website URLs to automate the search of applicable web-pages for the presence
of the desired keywords (Hicks et al., 2006). The output is an Excel comma
separated variable file containing counts of "hits" for each search term at each
website normalized by the total number of web pages present at the website.
The tool was configured to allow for English pages only. This change was
considered necessary because many of the firms searched maintain a global
presence and since the search terms were comprised of only English language
words, web pages in other languages artificially lowered the keyword
frequencies reported for those global firms.
3.6 Factor Analysis Method
The factor analysis is an exploratory research method used to identify the main
dimensions underlying the variation of a large number of variables. In our
research we are studying the patterns of relationships among the keywords
used on the web sites of organizations involved in the wireless industry.
41
The factor analysis was performed with IBM SPSS Statistics 18 software by
selecting the dimension reduction option with factor analysis.
As the factor analysis technique is complex in nature, with many options, this
research used the recommendations of Costello and Osborne (2005). There
are two statistical techniques used by researchers conducting exploratory factor
analysis, Common Factor Analysis (CFA) and Principal Component Analysis
(PCA). Recent publications generally recommend the use of CFA over PCA but
most acknowledge that usually both PCA and CFA produce equally valid results
and suggest that researches try multiple approaches and select the one that
produces the best fit of results with theory (Stevens, 2009). For this research
PCA was selected as it produced the best fit of the results with the knowledge
on the mobile communication industry.
While the literature differs on the strengths of the various extraction methods, it
indicates that a large sample size (300) results in similar results regardless of
extraction technique. In this sense researchers should choose the method
providing the clearest structure and the best fit with theory (Reinard, 2006).
SPSS allows the researcher to specify the number of factors to extract and
provides a scree plot as an aid tool. Kaiser's criterion and examination of the
scree plot are the two main approaches suggested in the literature for
determining the number of factors to extract. Kaiser's criterion assumes that all
factors with Eigenvalues > 1.0 represent a significant contribution to the overall
variation in the data. The scree plot can be used to identify a threshold for factor
selection because only factors that contribute a relatively high degree of

42
variation are above the knee. Like selecting the optimal extraction method,
many recent authors recommend that researchers examine the results of
extraction with a range of factors and select the set that provides the best
structure (Darlington, 2010).
Rotation is used to "find the best distribution of factor loadings in terms of the
meanings of the factors" (Reinard, 2006, p. 417). SPSS supports the five distinct
factor rotation methods: Varimax, Quartimax, Equamax, Promax and Direct
Oblimin. Orthogonal rotation such as Varimax is generally used for factors which
are expected to be uncorrelated (Field, 2005).
3.7 Initial Factor Analysis
An initial factor analysis was run on the results from the KSAT which contained
the scores of all keywords from the initial sample of websites. The use of a
large number of keywords is necessary with this type of exploratory research
but impedes significantly the selection of all the relevant factors. In this sample
group several factor analyses solutions were identified. The factors identified
are relevant but they do not reflect completely the diversity of the sample, due to
the heterogeneity of the sample and the strict criteria for acceptance as
indicated in Section 3.10 Validation of Results. The reduction in the number of
keywords provided factor analysis solutions at the expense of losing meaningful
information.
As the purpose of this study is to uncover as many constructs as possible, the
results from the initial factor analysis suggested a focus on more similar groups

43
of organizations in a sample. The literature on factor analysis indicates that the
methodology is used primarily for dimension reduction. In this study the content
analysis using factor analysis is meant to uncover as many factors as possible
and therefore the use of multiple sub-samples is warranted. The process for
identifying the sample groups is described in Section 3.8 Clusters as sub-
samples.
3.8 Clusters as sub-samples
The literature on sampling for factor analysis indicates that in the cases studied,
the criteria for sample selection were based on 'organizational configuration':
sets of firms that share a common profile along conceptually distinct variables
(Meyer et al., 1993). Studies which have identified "entrepreneurial"
organizations (Miller and Mintzberg, 1983) or "highly innovative" firms (Hicks et
al., 2006) are examples of creating clusters used as samples for further content
analysis with factor reduction. This is an accepted technique since the results
from exploratory factor analysis cannot be generalized outside the sample. This
study proposes a clustering methodology that is more suitable for large sets of
keywords which is meant primarily to map the characteristics of the cases in the
sample.
3.9 Multiple Factor Analysis
The literature on factor analysis indicates that the methodology is used primarily
as a factor reduction for understanding a few dimensions for the cases under
study. In this study the methodology is used for identifying and mapping the
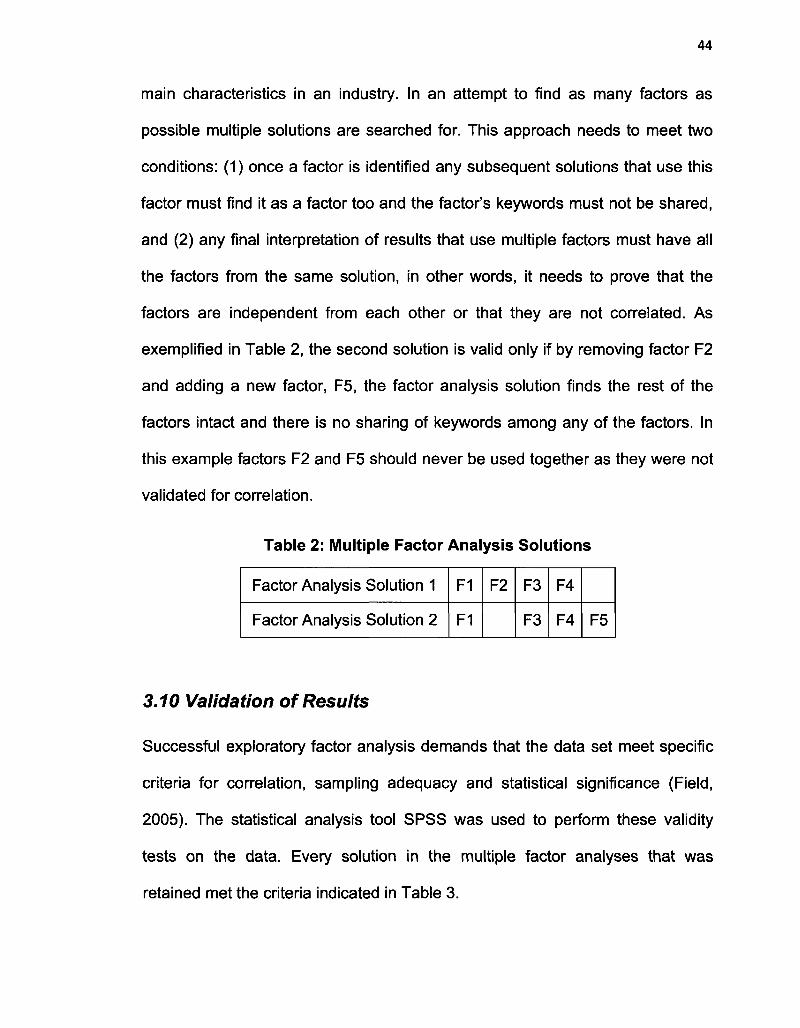
44
main characteristics in an industry. In an attempt to find as many factors as
possible multiple solutions are searched for. This approach needs to meet two
conditions: (1) once a factor is identified any subsequent solutions that use this
factor must find it as a factor too and the factor's keywords must not be shared,
and (2) any final interpretation of results that use multiple factors must have all
the factors from the same solution, in other words, it needs to prove that the
factors are independent from each other or that they are not correlated. As
exemplified in Table 2, the second solution is valid only if by removing factor F2
and adding a new factor, F5, the factor analysis solution finds the rest of the
factors intact and there is no sharing of keywords among any of the factors. In
this example factors F2 and F5 should never be used together as they were not
validated for correlation.
Table 2: Multiple Factor Analysis Solutions
Factor Analysis Solution 1
Factor Analysis Solution 2
F1
F1
F2 F3
F3
F4
F4 F5
3.10 Validation of Results
Successful exploratory factor analysis demands that the data set meet specific
criteria for correlation, sampling adequacy and statistical significance (Field,
2005). The statistical analysis tool SPSS was used to perform these validity
tests on the data. Every solution in the multiple factor analyses that was
retained met the criteria indicated in Table 3.
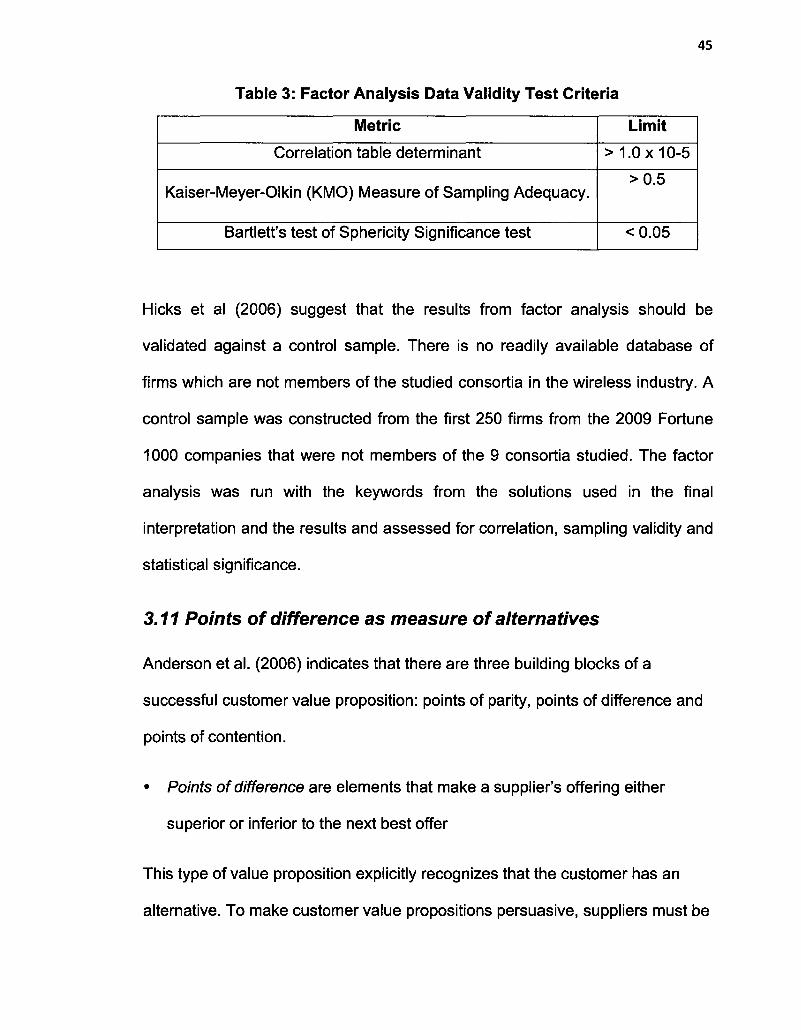
45
Table 3: Factor Analysis Data Validity Test Criteria
Metric
Correlation table determinant
Kaiser-Meyer-Olkin (KMO) Measure of Sampling Adequacy.
Bartlett's test of Sphericity Significance test
Limit
> 1.0x10⁻⁵
>0.5
<0.05
Hicks et al (2006) suggest that the results from factor analysis should be
validated against a control sample. There is no readily available database of
firms which are not members of the studied consortia in the wireless industry. A
control sample was constructed from the first 250 firms from the 2009 Fortune
1000 companies that were not members of the 9 consortia studied. The factor
analysis was run with the keywords from the solutions used in the final
interpretation and the results and assessed for correlation, sampling validity and
statistical significance.
3.11 Points of difference as measure of alternatives
Anderson et al. (2006) indicates that there are three building blocks of a
successful customer value proposition: points of parity, points of difference and
points of contention.
• Points of difference are elements that make a supplier's offering either
superior or inferior to the next best offer
This type of value proposition explicitly recognizes that the customer has an
alternative. To make customer value propositions persuasive, suppliers must be

46
able to demonstrate and document them. Anderson et al. (2006) recommends
the use of value word equations to express in words and simple mathematical
operators how to assess the differences in functionality of performance.
Following the model suggested by Anderson et al. (2006), this study defined the
points of difference as a numerical value for the relative strength or importance
of a construct.
3.12 Instruments
The following instruments are used in the analysis and interpretation of the
results:
Table 4: Instruments of Analysis and Interpretation
Instrument
Keyword
Score
Factor
Factor
Score
Factor
Average
Score
Construct
Description
The number of instances the keyword is found on a web site,
normalized to the number of web pages. The value is provided by
the Keyword Search and Analysis Tool (KSAT).
The keywords grouped by factor analysis in one sample.
For each website the factor score is calculated as the sum of the
keyword scores of the variables loaded on the factor. This
approach follows the recommendations described in Reinard
(2006)
Represents the average of a group of organizations' factor scores
in a sample.
The abstract concept represented by similar factors from all
samples. In a sample the construct is defined by a single factor.

47
Instrument
Points of
Difference
Index
(PODI)
Salient
Construct
Construct
PODI List
Consortium
Description
The points-of-difference index (PODI) represents the relative
importance of a factor.
In a sample, the PODI compares a factor's average scores for
members against non-members of a consortium. This provides an
indication of the factor or construct relevance for the consortium.
The numerical value for the points-of-difference is represented by
the POD Index and is defined as:
F - Factor
Y - Consortium Y
G - Sample group G
m - Number of organizations which are members of Y
n - Number of organizations which are not members of Y
The criterion for a salient construct is defined as follows:
PODI > 1.5
The criterion is based on the assumption that a consortium's
members with a factor that is 50% larger than the rest of the
sample is sufficiently large to be indicative of a salient construct.
It is used to rank consortia based on one construct.
It is defined as a ranked list of POD Indexes for a factor in a
sample group for all consortia:
{ PODI (Fx> A L S), .... PODI (Fx, A9, S) }
Fx - Factor X in sample S
A-Consortium:
WiMAX, GSMA, UMTS, CDG, CCF,
LSTI, NGMN, WBA, OPA
S - Sample Group: E, F, G, H or I
It is used to rank the constructs for one consortium.
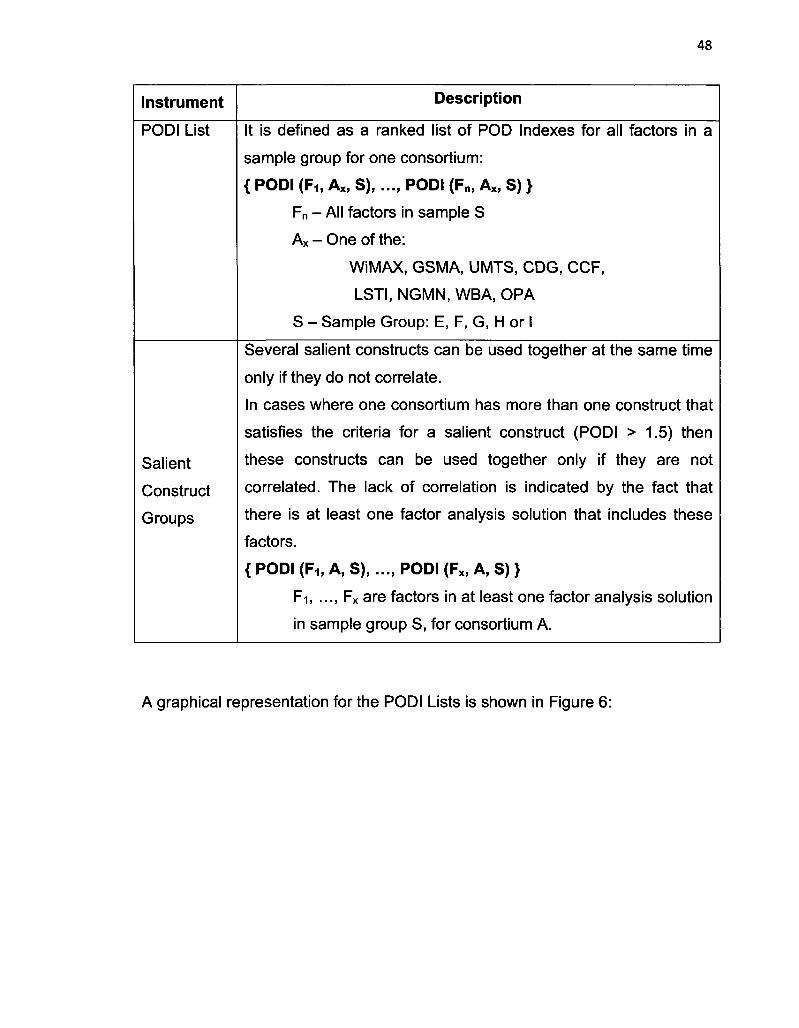
48
Instrument
PODI List
Salient
Construct
Groups
Description
It is defined as a ranked list of POD Indexes for all factors in a
sample group for one consortium:
{ PODI (Fi, Axs S) PODI (F„, Ax, S) }
Fn - All factors in sample S
Ax - One of the:
WiMAX, GSMA, UMTS, CDG, CCF,
LSTI, NGMN, WBA, OPA
S - Sample Group: E, F, G, H or I
Several salient constructs can be used together at the same time
only if they do not correlate.
In cases where one consortium has more than one construct that
satisfies the criteria for a salient construct (PODI > 1.5) then
these constructs can be used together only if they are not
correlated. The lack of correlation is indicated by the fact that
there is at least one factor analysis solution that includes these
factors.
{ PODI (Fi, A, S), .... PODI (Fx, A, S) }
Fi, ..., Fx are factors in at least one factor analysis solution
in sample group S, for consortium A.
A graphical representation for the PODI Lists is shown in Figure 6:

49
Consortium POD I List
Construct 1
...
Construct X
...
Construct N
Consortium 1
PODI (1,1)
...
PODI(X,l)
...
PODI(N,l)
...
...
...
...
. Consortium Y
i PODI (1,Y)
I PODI(X,Y)
!
& PODI(N,Y)
...
...
...
...
...
...
Consortium M
PODI(l,M)
PODI(X,M)
...
PODI(N,M)
Figure 6: Construct and Consortium PODI Lists
In summary, the points-of-difference term refers to the favourable points of
difference (Anderson et al., 2006) and is defined by the groups of salient
constructs:
Points of Difference (POD) = Groups of Salient Constructs

50
4. Research Results
This chapter is comprised of eight sections. Section 4.1 discusses the research
sample. Section 4.2 explains the multiple samples. Section 4.3 presents the
keywords and the samples. Section 4.4 presents the constructs identified from
the factor analysis. Section 4.5 identifies the constructs. Section 4.6 presents
the consortia points of difference. The multiple membership ranking is presented
for several factors in Section 4.7. A visualization of the construct groups is
presented in Section 4.8.
4. 1 Research Sample
Focusing on the diversity of the sample the study selected consortia that: (1)
represent organizations with interests in the major wireless technologies in the
last twenty years: GSM, CDMA, UMTS, WiMAX and LTE, (2) use the main
wireless communication standards: 3GPP, 3GPP2 and IEEE 802.16, and (3)
have different sizes.
Based on these recommendations, the selected organizations are members of 9
consortia4: GSM Association (GSMA), CDMA Development Group (CDG),
UMTS Forum, WiMAX Forum, LTE/STI Trial Initiative, Next Generation Mobile
Networks (NGMN), Wireless Broadband Alliance (WBA), CDMA Certification
Forum (CCF) and Open Patent Alliance (OPA).
From the complete list of members found on the consortia web sites, the
selected organizations have a good description in "About Us", and contained at
Based on the membership analyzed in January 2010

51
least ten pages in English, to avoid spurious results caused by sites with
minimal content (i.e. few keyword hits). From this population an initial research
sample of 889 organizations was extracted. When compiling the dataset, an
organization was identified as a member of one or more of the selected
consortia.
The GSM Association5 (GSMA) was launched in 1987 and represents the
interests of the worldwide mobile communications industry involved in GSM and
3GSM (WCDMA). With members from 219 countries, nearly 800 of the world's
mobile operators, and more than 200 companies in the broader mobile
ecosystem, including handset makers, software companies, equipment
providers, Internet companies, and media and entertainment organisations, the
GSMA is "focused on innovating, incubating and creating new opportunities for
its membership, all with the end goal of driving the growth of the mobile
communications industry"6
The CDMA Development Group7 (CDG), founded in 1993, is an international
consortium of 121 companies who have joined together to lead the adoption and
evolution of CDMA wireless systems around the world. The CDG is comprised
of CDMA service providers and manufacturers, application developers and
content providers, who work together to ensure the interoperability among
systems, while expediting the availability of CDMA technology to consumers8.
5 http-//www gsmworld.com, last accessed July 10, 2010 6 http.//www.gsmwoiid com/about-us/index.htm, last accessed July 10, 2010 7 http7/www.cdg.org, last accessed July 10, 2010 8http7/www.cdg.org/about/index.asp, last accessed July 10, 2010
52
The CDMA Certification Forum9 (CCF) is a partnership between CDMA
operators and CDMA device vendors to establish and maintain a core global
device certification process that helps improve quality through consistent
interoperability, conformance and performance testing. Currently it has 58
members10.
The UMTS Forum11 is a non-profit organization founded in 1996 to help its
members "understand and profit from the opportunities of 3G/UMTS networks
and their Long Term Evolution (LTE)". The forum supports the interests of its
membership with a range of studies and reports on markets trends, mobile
broadband services and applications, key growth markets, spectrum and
regulation, technology and implementation. Currently the forum has 38
members12
The WiMAX Forum13 is an industry-led, not-for-profit organization formed to
certify and promote the compatibility and interoperability of broadband wireless
products based upon the harmonized IEEE 802.16/ETSI HiperMAN standard.
The WiMAX Forum's goals are to accelerate the introduction of these systems
into the marketplace and to ensure that the products are fully interoperable and
support broadband fixed, portable and mobile services. The WiMAX Forum
works with service providers and regulators to ensure that its certification
programs meet customer and government requirements. The forum was
9 http://www.filobalccf.org, last accessed July 10, 2010 10 http://www.globalccf org/about us.php. last accessed July 10, 2010 11 http-//www umts-forum.org. last accessed July 10, 2010 12 http://www.umts-forum.org/coriterit/view/2002/125/, last accessed July 10, 2010 13 http://www.wimaxforum org, last accessed July 10, 2010

53
launched in 2001 and today has more than 500 members involved in 592
WiMAX network deployments, in 148 countries14.
The WBA15 (Wireless Broadband Alliance) was founded in 2003 and it currently
has 36 members from leading operators offering wireless services across Wi-Fi,
WiMAX and Mobile broadband networks and roaming providers16.
The NGMN17 (Next Generation Mobile Networks) is an alliance between the
major mobile service providers that was formed in 2006 to define the
requirements and recommendations for the next-generation broadband wireless
networks. Its mandate is to complement and support the work provided by the
standardization bodies. Currently the alliance has 58 members18
The LSTI Forum19 (Long Term Evolution / System Architecture Evolution Trial
Initiative) is a global, collaborative technology trial initiative focused on
accelerating the availability of commercial and interoperable next generation
LTE mobile broadband systems. One of the stated goals of the forum is to
"develop an open industry ecosystem by involving all stakeholders
(manufacturers, operators, regulators, research community, and application
developers) in the process". Launched in 2007, today the forum has 40
members20.
14 http://www wimaxforum.org/about, last accessed July 10, 2010 15 http7/www wballiance.net, last accessed July 10, 2010 16 http://www.wballiance.net/history.html, last accessed July 10, 2010 17 http://www.ngmn.org, last accessed July 10, 2010 18 http://www ngmn.org/aboutus.html, last accessed July 10, 2010 19 http://www.lstiforum.org, last accessed July 10, 2010 20 http.//www.lstiforum.org/about/intro.html, last accessed July 10, 2010
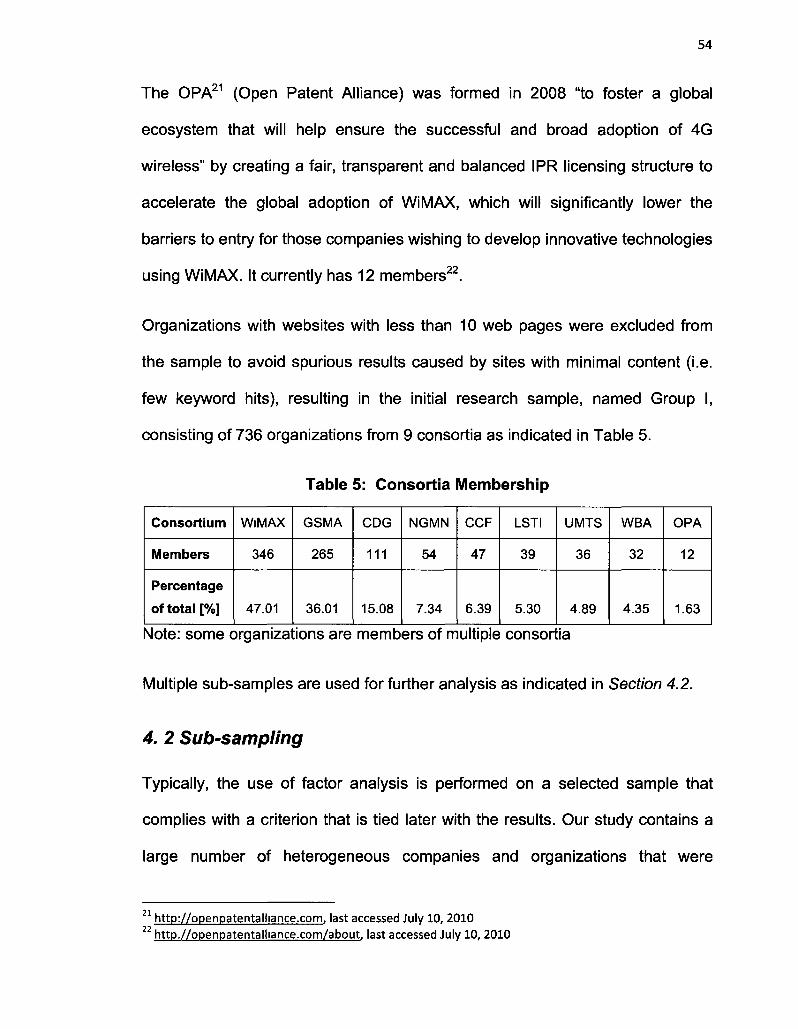
54
The OPA21 (Open Patent Alliance) was formed in 2008 "to foster a global
ecosystem that will help ensure the successful and broad adoption of 4G
wireless" by creating a fair, transparent and balanced IPR licensing structure to
accelerate the global adoption of WiMAX, which will significantly lower the
barriers to entry for those companies wishing to develop innovative technologies
using WiMAX. It currently has 12 members22.
Organizations with websites with less than 10 web pages were excluded from
the sample to avoid spurious results caused by sites with minimal content (i.e.
few keyword hits), resulting in the initial research sample, named Group I,
consisting of 736 organizations from 9 consortia as indicated in Table 5.
Table 5: Consortia Membership
Consortium
Members
Percentage
of total [%]
Note: some c
WiMAX
346
47.01
)rganizal
GSMA
265
36.01
tions are
CDG
111
15.08
memb
NGMN
54
7.34
ers of m
CCF
47
6.39
ultiple
LSTI
39
5.30
consorl
UMTS
36
4.89
ia
WBA
32
4.35
OPA
12
1.63
Multiple sub-samples are used for further analysis as indicated in Section 4.2.
4. 2 Sub-sampling
Typically, the use of factor analysis is performed on a selected sample that
complies with a criterion that is tied later with the results. Our study contains a
large number of heterogeneous companies and organizations that were
http://openpatentalliance.com, last accessed July 10, 2010 ! http.//openpatentalliance.com/about, last accessed July 10, 2010

55
selected based solely on the membership in wireless industry consortia. The
literature on content analysis of web pages using factor analysis provides little
evidence of the effect of samples on the final result. This study uses multiple
samples for two reasons: (i) capture as many diverse constructs as possible and
(ii) provide a better understanding on the impact of samples on the results.
From the initial research sample (Group I) the sub-samples were obtained in 2
steps. A visual inspection of the table with the score results from the KSAT
analysis suggests that there are "pockets" of organizations that share the same
keywords with scores values in the same range. Based on this observation, in
the first step, the keywords were grouped based on the quartile they belong to.
This approach is similar to the four-point Likert scale used in questionnaires
processed subsequently by factor analysis. The Q1, Q2, Q3 and Q4 are the four
networks created based on the shared keyword in the four quartiles. An
example is provided in Figure 7: the score for the keyword K1 is in the first
quartile for the organizations X1 and X2. If X1(K1) = q1 and X2(K1) = q1 then
X1 and X2 share an edge or a link in network Q1.
X1(K1) = q1 &X2(K1) = q1 => Q1(X1, X2) = 1
<£ XI X2 2
Q2 X2X3 1
Qi
XI X4 1 X3X4 1
Q4 X1X2 1 XI X3 1 X2X3 1
XI X2
XS X4
Kl
<?1
ql q4
m
K2 q3
q2
q2 q3
K3
¥ q4
q4
*
K4
ql ql q3
V
Figure 7: Networks Based on Keyword Scores
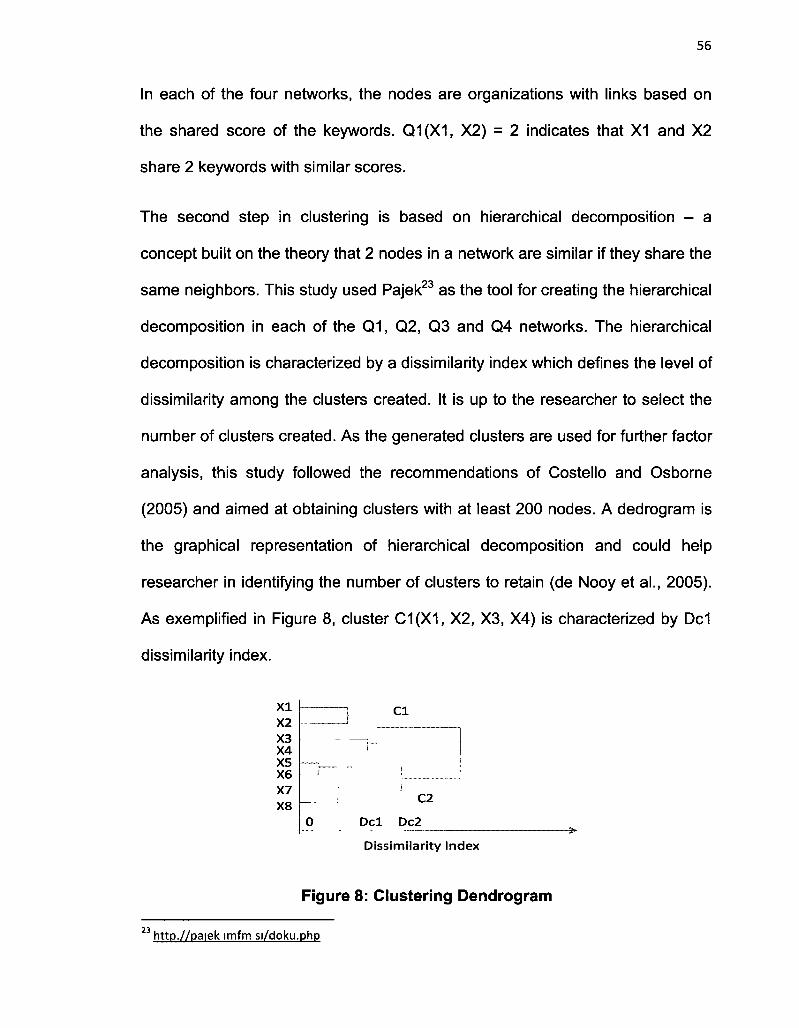
56
In each of the four networks, the nodes are organizations with links based on
the shared score of the keywords. Q1(X1, X2) = 2 indicates that X1 and X2
share 2 keywords with similar scores.
The second step in clustering is based on hierarchical decomposition - a
concept built on the theory that 2 nodes in a network are similar if they share the
same neighbors. This study used Pajek23 as the tool for creating the hierarchical
decomposition in each of the Q1, Q2, Q3 and Q4 networks. The hierarchical
decomposition is characterized by a dissimilarity index which defines the level of
dissimilarity among the clusters created. It is up to the researcher to select the
number of clusters created. As the generated clusters are used for further factor
analysis, this study followed the recommendations of Costello and Osborne
(2005) and aimed at obtaining clusters with at least 200 nodes. A dedrogram is
the graphical representation of hierarchical decomposition and could help
researcher in identifying the number of clusters to retain (de Nooy et al., 2005).
As exemplified in Figure 8, cluster C1(X1, X2, X3, X4) is characterized by Del
dissimilarity index.
X I X? X3 X4 X5 X6 X7 X8
__
J
O
—. :
D e l
C I
i
! J
C2
Dc2
Dissimilarity ln< dex
Figure 8: Clustering Dendrogram
1 http.//paiek imfm si/doku.php

57
The dissimilarity index is the control variable used in this study for creating the
clusters used as sub-samples for further factor analysis. The results are
presented in Table 6 and Table 7:
Table 6: Sub-sampling Step 1
Nr. Firms Sample Group I
736
Group
Q1 Q2 Q3 Q4
Nr. Firms
508 729 733 735
Nr. Keywords
46 133 205 255
Table 7: Sub-sampling Step 2
Q Group
Q1
Q2
Q3
Q4 Node
Partition P2 P1 P2
P1 +P4 P1 P2 P1 P2
cHDdl =d
Nr. Firms 295 218 269 336 312 202 305 228
issimilaril
HDd1 10.33 0.86 0.59 2.27 0.18 0.28 0.36 0.48
ty index
Sub-sample Groups
A B C D E F G H
ford l
For the complete results from the hierarchical decomposition see Appendix B:
Hierarchical Decomposition.
The factor analysis was run for the initial research sample (Group I) and for
every of the sub-sample groups: A, B, C, D, E, F, G and H. The E, F, G and H
groups produced multiple and meaningful factor analysis results and were

58
retained for further study. The groups E and F do not share organizations and
have a combined size of 514. The organizations in Groups G and H are also
different with a combined size of 533. The sub-samples contain a total number
of 611 organizations, while the initial sample, Group I, contains 736
organizations. A graphical view of the initial sample, Group I, and the sub-
samples, Groups E, F, G, and H is presented next in Figure 9:
Figure 9: Sample I and sub-samples E, F, G, H
The list of organizations' website URLs, the split samples groups and the
consortia they belong to is provided in Appendix A: URLs, Samples and
Membership.
4. 3 Keyword Selection
The initial list of keywords was selected based on the readings of mobile
communication literature including published academic works as well as books,
and from scanning the websites of the wireless industry consortia and their
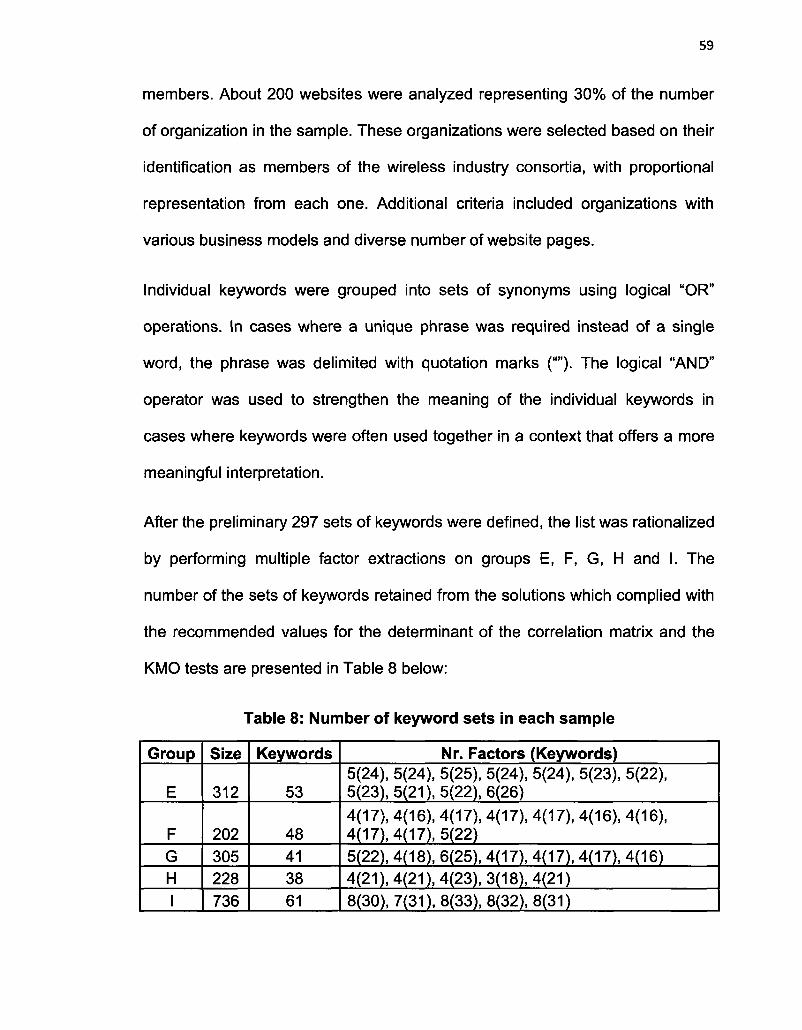
59
members. About 200 websites were analyzed representing 30% of the number
of organization in the sample. These organizations were selected based on their
identification as members of the wireless industry consortia, with proportional
representation from each one. Additional criteria included organizations with
various business models and diverse number of website pages.
Individual keywords were grouped into sets of synonyms using logical "OR"
operations. In cases where a unique phrase was required instead of a single
word, the phrase was delimited with quotation marks (""). The logical "AND"
operator was used to strengthen the meaning of the individual keywords in
cases where keywords were often used together in a context that offers a more
meaningful interpretation.
After the preliminary 297 sets of keywords were defined, the list was rationalized
by performing multiple factor extractions on groups E, F, G, H and I. The
number of the sets of keywords retained from the solutions which complied with
the recommended values for the determinant of the correlation matrix and the
KMO tests are presented in Table 8 below:
Table 8: Number of keyword sets in each sample
Group
E
F G H 1
Size
312
202 305 228 736
Keywords
53
48 41 38 61
Nr. Factors (Keywords) 5(24), 5(24), 5(25), 5(24), 5(24), 5(23), 5(22), 5(23), 5(21), 5(22), 6(26)
4(17), 4(16), 4(17), 4(17), 4(17), 4(16), 4(16), 4(17), 4(17), 5(22) 5(22), 4(18), 6(25), 4(17), 4(17), 4(17), 4(16) 4(21), 4(21), 4(23), 3(18), 4(21) 8(30), 7(31), 8(33), 8(32), 8(31)

60
The Keyword Search and Analysis Tool is based on the Google Ajax Application
Programming Interface (API) and counts the number of instances that each of
the logical combinations of the keywords is found in the web pages at each site
specified in the sample list. The tool also returns the total number of pages at
each site and the normalized keyword frequency by dividing the keyword counts
by the number of web pages found. The tool counts all instances of the keyword
sets and can provide normalized keyword frequency in excess of 100%. This is
not an issue since the factor extraction is concerned with correlations and not
with the specific value of an individual keyword frequency.
4. 4 Factor Analysis
Both Kaiser's criterion and the Scree plot criteria were used for extracting the
number of factors from the multiple factor analysis which were run on groups E,
F, G, H and I. Group E, with a size of 312 and average commonalities between
0.59 and 0.62, offers a sample large enough to allow reliance on the Scree plot.
For group F, with a size of 202 and average commonalities above 0.7 (except
for one analysis out of eight) only the factors with Eigenvalues above 1 were
selected. Group G, with a size of 305 and average commonalities between 0.59
and 0.64 has a size large enough to allow reliance on the Scree plot. For the
group H, with a size of 228 and average commonalities between 0.58 and 0.61
only the factors with Eigenvalues above 1 were selected. For Group I, with a
size of 736, the factors selected based on the Scree plot all have Eigenvalues
above 1.

Table 9: Factor Analysis Results
Group
E
F
G
H
1
Nr. Firms
312
202
305
228
736
Solution
1
2
3
4
5
6
7
8
9
10
11
1
2
3
4
5
6
7
8
9
10
1
2
3
4
5
6
7
1
2
3
4
5
1
2
3
4
5
DCM
1 18E-05
6 49E-05
1 51E-05
L 2 26E-05
2 11E-05
8 30E-05
8 20E-05
5 18E-05
1 00E-03
2 20E-05
3 60E-05
1 38E-05
3 05E-05
1 57E-05
2 29E-05
3 51E-05
1 96E-05^
4 76E-05
4 84E-05
3 37E-05
1 40E-05
3 19E-05
2 00E-03
7 11E-05
1 00E-03
1 00E-03
2 00E-03
1 00E-03
2 74E-05
2 15E-05
1 27E-05
2 18E-05
2 32E-05
3 65E-05
3 98E-05
9 43E-05
6 44E-05
9 20E-05
KMO
0 772
0 756
0 748
0 732
0 758
0 751
0 749
0 761
0 738
0 772
0 757
0 772
0 729
0 755
0 755
0 76
0 737
0 747
0 748
0 741
0 797
0 775
0 767
0 756
0 792
0 786
0 762
0 802
0 767
0 766
0 757
0 795
0 791
0 742
0 745
0 739
0 761
0 696
AVC
0 623
0 591
0 599
0 608
0 614
0 601
0 622
0 616
0 585
0 648
0 604
0 713
0 727
0 712
0 708
0 701
0 727
0 716
0 681
0 689
0 649
0 642
0 593
0 612
0 653
0 644
0 597
0 658
0 612
0 613
0 584
0 61
0 613
0 599
0 569
0 565
0 576
0 578
Nr. Keywords
24
24
25
24
24
23
22
23
21
22
26
17
16
17
17
17
16
16
17
17
22
22
18
25
17
17
17
16
21
21
23
18
21
30
31
33
32
31
Nr. Factors
5
5
5
5
5
5
5
5
5
5
6
4
4
4
4
4
4
4
4
4
5
5
4
6
4
4
4
4
4
4
4
3
4
8
7
8
8
8
Total Variance (%)
62 3
59 1
59 9
60 8
61 4
60 1
62 1
61 6
58 5
64 8
60 4
71 3
72 6
71 2
70 7
70 1
72 6
71 5
68 1
68 9
64 9
64 2
59 3
61 2
65 3
64 3
59 7
65 8
61 2
61 3
58 4
61
61 32
59 9
56 8
56 5
57 6
57 75
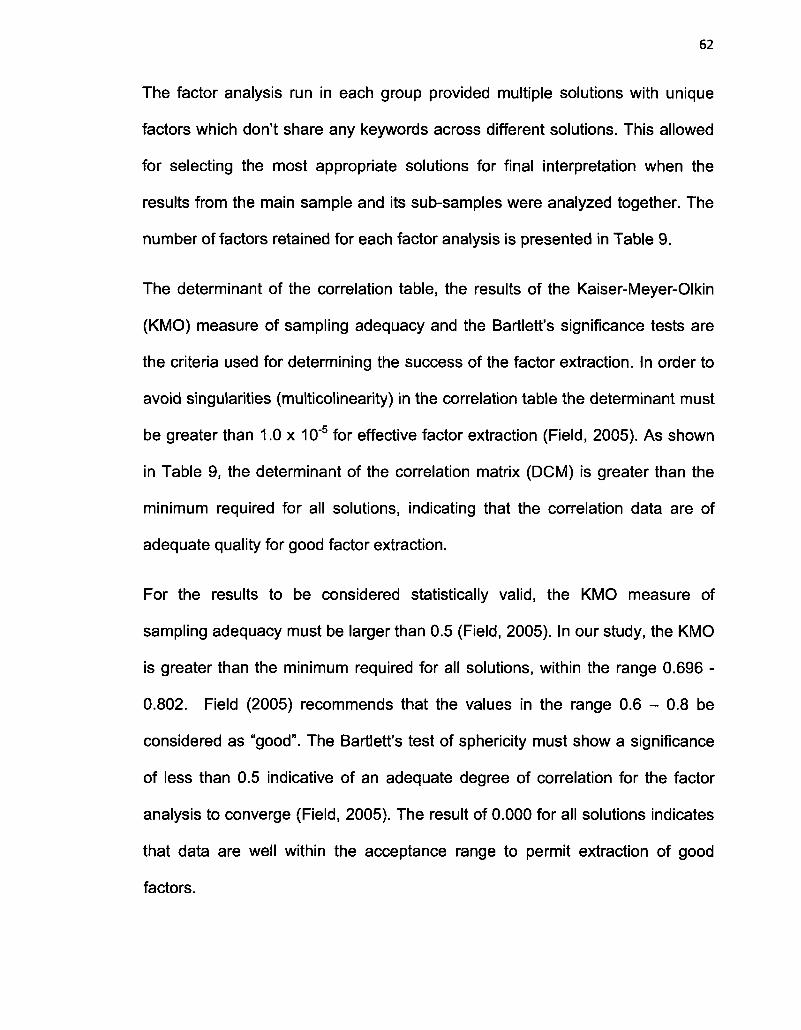
62
The factor analysis run in each group provided multiple solutions with unique
factors which don't share any keywords across different solutions. This allowed
for selecting the most appropriate solutions for final interpretation when the
results from the main sample and its sub-samples were analyzed together. The
number of factors retained for each factor analysis is presented in Table 9.
The determinant of the correlation table, the results of the Kaiser-Meyer-Olkin
(KMO) measure of sampling adequacy and the Bartlett's significance tests are
the criteria used for determining the success of the factor extraction. In order to
avoid singularities (multicolinearity) in the correlation table the determinant must
be greater than 1.0 x 10"5 for effective factor extraction (Field, 2005). As shown
in Table 9, the determinant of the correlation matrix (DCM) is greater than the
minimum required for all solutions, indicating that the correlation data are of
adequate quality for good factor extraction.
For the results to be considered statistically valid, the KMO measure of
sampling adequacy must be larger than 0.5 (Field, 2005). In our study, the KMO
is greater than the minimum required for all solutions, within the range 0.696 -
0.802. Field (2005) recommends that the values in the range 0.6 - 0.8 be
considered as "good". The Bartlett's test of sphericity must show a significance
of less than 0.5 indicative of an adequate degree of correlation for the factor
analysis to converge (Field, 2005). The result of 0.000 for all solutions indicates
that data are well within the acceptance range to permit extraction of good
factors.

63
The amount of variance in each variable that can be explained by the retained
factors is represented by the communalities after extraction. Together with the
sample size it provides an indication of the reliability of the factor analysis. This
research followed Costello and Osborne (2005) recommendation of keeping
only the items with commonalities above 0.4. The average communalities (AVC)
for each factor extraction solution are presented in Table 9 and suggest that the
analyses are adequate.
Rotation is used to simplify and clarify the data structure, by maximizing the
loadings of the variables of all components without affecting the relative
loadings of the variables. Most texts recommend the use of Varimax
(orthogonal) rotation for uncorrelated components (Field, 2005). The total
variance in our factor extraction solutions show that the factors extracted
account in all cases for the majority of the variation in the data. Table 9 shows
that the total variance in this study is in the range 56.5% - 72.6%.
Reinard (2006) recommends excluding variables with loadings less than 0.6 and
cross-loadings larger than 0.4 from being used when interpreting the meaning of
a factor. Costello and Osborne (2005) recommend a minimum loading of 0.32
and suggest that researchers should drop cross-loadings for factors with loaders
greater than 0.5. Stevens (2009) suggest that only variables with loadings larger
than 0.4 should be considered for interpretation purposes based on the
suggestion that a variable should share at least 15% of its variance with the
factor. In this study only items with loadings greater than 0.5 and with cross-
loadings below 0.4 were retained.
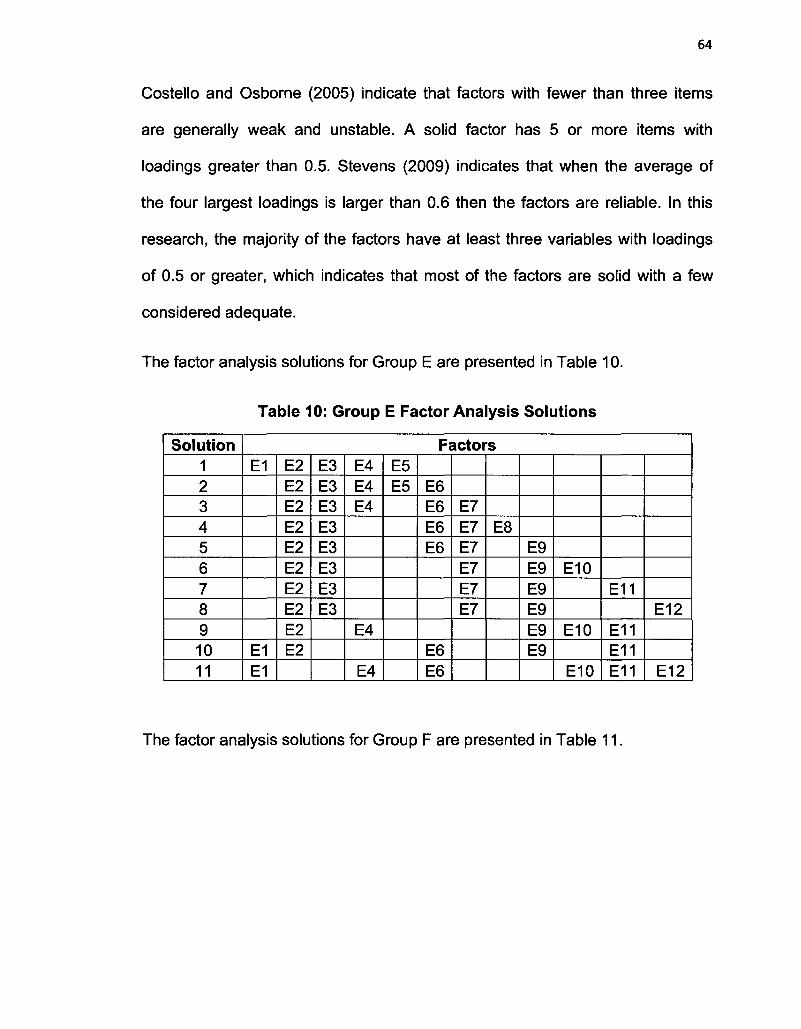
Costello and Osborne (2005) indicate that factors with fewer than three items
are generally weak and unstable. A solid factor has 5 or more items with
loadings greater than 0.5. Stevens (2009) indicates that when the average of
the four largest loadings is larger than 0.6 then the factors are reliable. In this
research, the majority of the factors have at least three variables with loadings
of 0.5 or greater, which indicates that most of the factors are solid with a few
considered adequate.
The factor analysis solutions for Group E are presented in Table 10.
Table 10: Group E Factor Analysis Solutions
Solution 1 2 3 4 5 6 7 8 9 10 11
Factors E1
E1 E1
E2 E2 E2 E2 E2 E2 E2 E2 E2 E2
E3 E3 E3 E3 E3 E3 E3 E3
E4 E4 E4
E4
E4
E5 E5 E6
E6 E6 E6
E6 E6
E7 E7 E7 E7 E7 E7
E8 E9 E9 E9 E9 E9 E9
E10
E10
E10
E11
E11 E11 E11
E12
E12
The factor analysis solutions for Group F are presented in Table 11.

65
Table 11: Group F Factor Analysis Solutions
Solution 1 2 3 4 5 6 7 8 9 10
Factors F1 F1 F1 F1 F1 F1 F1 F1 F1
F2
F2
F3 F3 F3 F3 F3 F3 F3 F3 F3 F3
F4 F4
F4
F5 F5 F5
F6
F6
F7 F7 F8
F8 F8
F9
F9
F10 F10
F10
F11 F11
The factor analysis solutions for Group G are presented in Table 12.
Table 12: Group G Factor Analysis Solutions
Solution 1 2 3 4 5 6 7
Fac G1
G1 G1 G1 G1 G1
G2 G2 G2 G2 G2
G3 G3 G3 G3 G3
G3
G4 G4 G4
G4
G5
G5
tors
G6 G7 G8
G9
G9 G9
G10 G10
The factor analysis solutions for Group H are presented in Table 13.
Table 13: Group H Factor Analysis Solutions
Solution 1 2 3 4 5
Factors H1 H1
H1 H1
H2 H2 H2
H2
H3 H4 H4
H4
H5 H5 H6
H6 H7 H7 H7

66
The factor analysis solutions for Group I are presented in Table 14
Table 14: Group I Factor Analysis Solutions
Solution 1 2 3 4 5
Factors 11
11 11 11
12
12 12 12
13
13 13
14
14 14 14
15
15
16
16 16 16
\7
\7
18
18 18 18
19 110 110 110
111 112 112
112
113 114 115
115
For more details on the factor analysis results see Appendix C: Factor Analysis
Results.
4.5 Constructs
The solutions retained from factor analysis identified factors corresponding to
companies' business models, technologies and standards. Based on the
knowledge about the industry and the definition of the keywords derived from
the literature each factor was interpreted to produce a descriptive definition for
each distinguishing characteristic of the wireless industry consortia.
The POD Index (factor, consortium, sample) is used to indicate the numerical
importance for each factor, consortium and sample as defined in Section 3.11 .
The Construct PODI List provides a ranked list of POD Indexes for all the
factors comprising the construct. Similar factors from each sample are grouped
together to form the following constructs:

67
Mobile Services
Table 15: Mobile Services
E1: Mobile Services (I) G1: Mobile Services (II)
a) "mobile AND content AND delivery" b) "mobile AND services AND (commerce OR billing)" c) "(consulting OR engineering) AND services" d) "mobile AND messaging AND services" e) "customization OR customize OR customized OR personalize OR individualize"
a) "(consulting OR engineering) AND services" b) "mobile AND content AND delivery" c) "database AND services" d) "mobile AND services AND (commerce OR billing)"
PODI(El, All, E)
0.5 0.7 0.8 1.0 1-3 1-4 1 8
, . * » » , • , p n , f i i i t g , B , i
PODI(Gl, All, G)
2.7 3.0
^V^//^ *v *s»
0.2 0.4 °"9 1.2 1.2 1.3 2.5 2.5
3.4
{ mm ( ™™s j » « ™ . » . / < ^ .
^^-VV^V^V' H6: Mobile Services (II)
a) "mobile AND applications" b) "mobile AND messaging AND services" c) "device AND management" d) "mobile AND services AND (commerce OR billing)" e) "mobile AND (advertising OR marketing)" f) "(data OR voice) AND plans" g) "(consulting OR engineering) AND services"
PODI(H6, All, H)
0 3 0.5 0.6 0.6 0.6 0.7 0.8 10 2.5 HI 1 ,
^^•^v
The keywords in Table 15 represent services that enable network operators to
efficiently manage and profit from mobile data services, content and commerce.
The customized mobile services for messaging, commerce or billing are
typically provided by the application or content providers.

68
Testing Solutions
Table 16: Testing Solutions
E2: Testing Solutions (I) F9: Monitoring Solutions
a) "measurement" b) "instrumentation OR instrument" c) "(performance OR optimization) AND (analysis OR audit)" d) "test AND evaluation AND equipment" e) "test AND equipment AND manufacturer"
PODI(E2, All, E) 2.4 2.5
1 2 1.5 1-5 m & 0.5 0.5 0.6 0.6
a) "solutions AND network AND monitoring AND analysis" b) "(performance OR optimization) AND (analysis OR audit)" c) "solutions AND (telematics OR metering OR tracking OR alarms OR monitoring)" d) "automation"
PODI(F9, All, F)
0.7 0.8 1-0 1-0 1.1 !_4 ™
J3_
2.0 2.7
& ff f oV>V* ̂ * # f *>V *f V̂ *
G10: Testing Solutions (II) H3: Testing Solutions (III)
a) "(performance OR optimization) AND (analysis OR audit)" b) "measurement" c) "test AND coverage" d) "research AND testing"
PODI(G10, All, G)
a) "test AND coverage" b) "solutions AND (VoIP OR 'Voice over IP' OR RCS OR 'Rich Communication Suite' OR VCC OR 'Voice Call Continuity')" c) "system AND solution" d) "multi-standard" e) "automation"
0.4 0.6 0.7 0.8 0.9
1.4 1.7 2.0 2.1
1.1 II 0.4 0.4
PODI(H3, All, H)
).7 0.7 0.9 0.9 1.1 1.1 1.3
o-vv^vvy ^ * / / *• w *y ^ cp ^P

69
113: Testing Solutions (IV)
» ., P0DI(I13, All, I) a) "measurement" 2.5 2.8 b) "test AND equipment AND manufacturer" Q 7 0 g 1.2 1 6 1 -8
c) "test AND evaluation AND equipment" °-4 °-5 ' ' : • m
d) "(performance OR optimization) AND , — , w - J U , w , • (analysis U K auait; ^ ^ . f> ^ ^ A. ^ ^ c<< e) "instrumentation OR instrument" ^ ^ 6> & ^> JS^JF ^ ^ ^
The keywords in Table 16 suggest that the test equipment manufacturers
provide instrumentation that allows measurement, performance and optimization
analysis for the infrastructure providers and network operators. The
infrastructure provider and device manufacturers' equipment needs to be
calibrated or certified for compliance before is accepted by the network
operators. The service providers provide software systems for monitoring the
mobile networks subscribers and customer's traffic flow. These solutions
maximize network performance, provide monitoring and analysis tools for
services and customer experience. The test coverage and automation for multi-
standard solutions is aimed at interoperability. This could help network
operators expand their coverage for mobile operations.
Fee Based Business Solutions
The network operator is the link between the infrastructure provider and the
end-user. A mobile phone network operator makes use of the infrastructure to
provide mobile services to the end-user. The typical business models, identified
in Table 17, are based on monthly fees from data and voice plans.

70
Table 17: Fee
E3: Fee Based Business Solutions (I)
a) "(data OR voice) AND plans" b) "unlimited AND (calling OR text OR distance)" c) "("Mobile Terminal Supplier" OR "Mobile Terminal" OR manufacturer) AND mobile AND phone" d) "internet AND mobile" e) "customer AND (options OR choice OR choose)"
PODI(E3, All, E)
G3: Fee Based Business Solutions (III)
a) "subscription OR activation OR contract" b) "ringtones OR games OR songs OR wallpaper OR screensavers OR tones OR IM" c) "service AND mobile AND (banking OR payment OR money OR financial)" d) "new AND (contract OR collaboration OR partner)"
PODI(G3, All, G)
Business Solutions
F7: Fee Based Business Solutions (II)
a) "phones OR smartphones OR PDA OR accessories OR cards" b) "customer AND (options OR choice OR choose) c) "(data OR voice) AND plans" d) "unlimited AND (calling OR text OR distance): e) "choose AND different AND plans"
110: Fee Based Business Solutions (IV)
a) "(data OR voice) AND plans" b) "unlimited AND (calling OR text OR distance)" c) "phones OR smartphones OR PDA OR accessories OR cards" d) "customer AND (options OR choice OR choose)" e) "("Mobile Terminal Supplier" OR "Mobile Terminal" OR manufacturer) AND mobile AND phone"
PODI(I10, All, I)

71
WiMAX Technology and Standard
Table 18: WiMAX Technology and Standard
The WiMAX Forum is a non-profit organization that lists about 500 companies
with the stated goal of promoting the WiMAX standard, which was developed by
the IEEE and also known as 802.16. TDD and FDD are variants of the
technology. The WiMAX Forum acts as a keystone. The keywords identified in
Table 18 characterize the members' support for the forum, technology and
standards.

72
Hardware
Table 19: Hardware
E5: Hardware (I) F4: Hardware (II)
a) "microprocessor OR processor OR microcontroller OR DSP OR 'RF subsystem' OR 'power management' OR chips OR chipsets OR sensor" b) "semiconductor" c) "design" d) "packaging"
a) "signal AND processing" b) "microprocessor OR processor OR microcontroller OR DSP OR 'RF subsystem' OR 'power management' OR chips OR chipsets OR sensor" c) "multi-standard" d) "'base station' OR 'base-station'"
0.2 0.6 0.7
PODI(E5, All, E) 1 o 1 1 1-6 1.6
1.1 1.1 1 3 lA _ _
PODI(F4, All, F)
4.6 5.2 6.0
r"^^~r~^^°T-^~"^r r-E1^~r~*HHi^T"
32 0.4 0.7 11 1.8
JH
2.8
^ v - v y ^ y *v ̂ y ^ * °v* G6: Hardware (III) 12: Hardware (IV)
a) "microprocessor OR processor OR microcontroller OR DSP OR 'RF subsystem' OR 'power management' OR chips OR chipsets OR sensor" b) "design" c) "(product OR process) AND (modularity OR modular OR module)" d) "system AND integration"
a) "microprocessor OR processor OR microcontroller OR DSP OR 'RF subsystem' OR 'power management' OR chips OR chipsets OR sensor" b) "semiconductor" c) "design" c) "signal AND processing"
PODI(G6, All, G)
0.3 0.6 0.7 0.9 I.O 1.1 1 3
1.7 1.8 PODI(l2, All, I)
^ j P_ 1,1,1,1, 0.2 0.6 0.7 °_f
M-JM.
1.2 1.6 1.6 1-8
2.5
i i • r "i i
ssffSSty* s <v *ss vo,fr
The keywords in Table 19 represent the involvement of the mobile
communication industry's infrastructure providers and device manufacturers in

73
the design, packaging of semiconductors, integrated circuits, radio frequency
(RF) and power management subsystems. The product or the process
modularity is one indicator of efficiency and flexibility which are required in
satisfying infrastructure provider or device manufacturer's needs for their cost
reduction and flexibility. Some of the companies for which these factors are
relevant are also involved in hardware for base stations - a term widely used by
the wireless industry to denote the portion of the wireless network responsible
for the communication over the air with the mobile user equipment.
3GPP Standard and LTE Technology
The Long Term Evolution (LTE) has become the next generation (4th generation
or 4G), the convergence technology to which the current technologies will
evolve to eventually, based on the involvement of the infrastructure providers
and network operators worldwide. The major changes are at the "radio access"
part of the network, which defines the connection over the air between the user
equipment (the mobile) and the radio base station. The Multiple In Multiple Out
(MIMO) or smart antenna allow for increased data rates between the base
station and the mobile unit. The TDD and FDD are variants of the technology for
over the air transmissions. The modularity, performance, and the cost
effectiveness could be associated with the fact that the network architecture has
become simpler, based on open standards, an all IP (Internet Protocol) network.
The keywords identified in Table 20 characterize the members' support for the
LTE technology and standards.
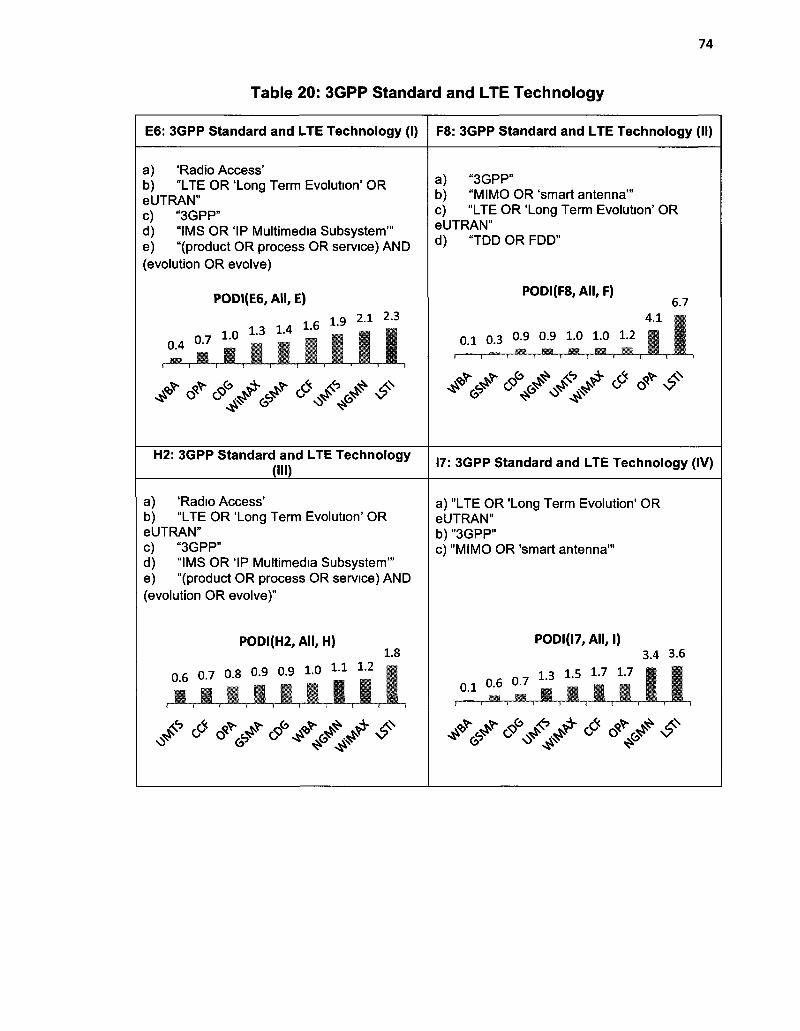
74
Table 20: 3GPP Standard and LTE Technology
E6: 3GPP Standard and LTE Technology (I) F8: 3GPP Standard and LTE Technology (II)
a) 'Radio Access' b) "LTE OR 'Long Term Evolution' OR eUTRAN" c) "3GPP" d) "IMS OR 'IP Multimedia Subsystem'" e) "(product OR process OR service) AND (evolution OR evolve)
a) "3GPP" b) "MIMO OR'smart antenna'" c) "LTE OR 'Long Term Evolution' OR eUTRAN" d) "TDD OR FDD"
PODI(E6, All, E)
1.3 1.4 1 6 1.9 2 1 2 3
PODI(F8, All, F)
0 - 1 0.3 °-9 °-9 1 0 1 0 12
KB E%9
6.7 4.1
^d^VV^V. /^ ^ / / / ^ ^
H2: 3GPP Standard and LTE Technology (III)
17: 3GPP Standard and LTE Technology (IV)
a) 'Radio Access' b) "LTE OR 'Long Term Evolution' OR eUTRAN" c) "3GPP" d) "IMS OR 'IP Multimedia Subsystem'" e) "(product OR process OR service) AND (evolution OR evolve)"
a) "LTE OR 'Long Term Evolution' OR eUTRAN" b) "3GPP" c) "MIMO OR "smart antenna'"
PODI(H2, All, H)
0 6 0.7 0.8 0.9 0.9 1.0 1-1 1 2
1.8
0.1 0.6 0
PODI(l7, All, I)
7 1.3 1-5 1-7 1-7
3.4 3.6
r~~ i ~ ~ r ^L.
//W^V^ £ ^

75
Revenue Management Solutions
Table 21: Revenue Management Solutions
E7: Revenue Management Solutions (I) F3: Revenue Management Solutions (II)
a) "solution AND (OSS OR 'Operation Support System')" b) "BSS OR 'Business Support System'" c) "solution AND (outsourcing OR delivery)" d) "billing" e) "provisioning"
a) "BSS OR 'Business Support System'" b) "solution AND (OSS OR 'Operation Support System')" c) "activation AND mediation AND service" d) "'cost of ownership' OR 'optimise infrastructure' OR 'optimize infrastructure'"
PODI(E7, All, E)
0.4 0.5 0.6 0.6 0.7 0.8 0.9 0.9
m , m , m , m J _ H B , 1 ,
2.3
0.2 0.3
PODI(F3, All, F)
0.5 1.0 1.2 1-5 I-9 3.4
r—™"- i " ^ i
5.9
JiilL-—
^vy^/^/ ^ ^ *s*f#SSSs 19: Revenue Management Solutions (III)
a) "solution AND (OSS OR 'Operation Support System')' b) "BSS OR 'Business Support System'" c) "solution AND (outsourcing OR delivery)" d) "'cost of ownership' OR 'optimise infrastructure' OR 'optimize infrastructure'" e) "billing"
PODI(l7, All, I)
a i °'6 °'? - i l l
3.4 3.6
^MLr
^ < ^ / * < ^ iSN
The "Revenue Management Solutions" factors are specific to service and billing
providers24. Service and billing providers provide software systems necessary
for provisioning, billing, and customer service. These backend systems enable
the operators to monetize the products and services they offer. These solutions
provide provisioning automation, revenue assurance, cost management, billing,
' http://www.ossbssworld.com/

76
and subscriber management. These factors indicated that the ability to
seamlessly provision and price new, bundled services is important. The
providers of Operations and Business Support Systems offer solutions to the
network operators to improve the operational efficiency and control. These
business models are represented by the keywords indicated in Table 21.
Security Solutions
The providers of security solutions offer security protection at the corporate and
consumer level against the threat of mobile viruses, malware, inappropriate
content, unsolicited communications and spam at a corporate and consumer
level; the digital signature, authentication and authority are part of the language
used in these solutions. These keywords are captured in the factors shown in
Table 22.

77
Table 22: Security Solutions
E8: Security Solutions (I) F5: Security Solutions (II)
a) "(protect OR protecting OR promote) AND (consumers OR users)" b) "(security OR 'customer protection' OR protection) AND (virus OR malware OR 'inappropriate content' OR spam OR phishing)" c) "authentication OR security OR signature" d) "authority"
PODI(E8, All, E)
0.7 0.8 0.8 0.9 1.1 1.1 1.2 1-3
<V *6 ̂ v^yy* ^
a) "(protect OR protecting OR promote) AND (consumers OR users)" b) "reputation OR competence" c) "(security OR 'customer protection' OR protection) AND (virus OR malware OR 'inappropriate content' OR spam OR phishing)" e) "conformity OR compliance"
PODI(F5, All, F)
0 6 0.8 0.9 1.0 I f I f 13 L4 1A
, m , 11,1 ^ i . 2 o
(5 •s >
< CO
13 Q
to 13
G8: Security Solutions (III) H5: Security Solutions (IV)
a) "(protect OR protecting OR promote) AND (consumers OR users) b) "conformity OR compliance" c) "authentication OR security OR signature
a) "(protect OR protecting OR promote) AND (consumers OR users)" b) "reputation OR competence" c) "(security OR 'customer protection' OR protection) AND (virus OR malware OR 'inappropriate content' OR spam OR phishing)" d) "router OR gateway" e) "conformity OR compliance"
PODI(G8, All, G)
.9 0.9 0.9 1.0 1.0 1-1 1-2 1.3 PODI(H5, All, H)
1.1 1.5
0.5 0.5 0.5 0.6 0.7 0.8 0.8 "- j
s ov oV ^ v y " / ^ # <** <%?jf^
114: Security Solutions (V)
a) "(protect OR protecting OR promote) AND (consumers OR users)" b) "(security OR 'customer protection' OR protection) AND (virus OR malware OR 'inappropriate content' OR spam OR phishing)" c) "authentication OR security OR signature" d) "reputation OR competence"
PODI(ll4, All, I)
0.8 0.9 1.0 1.0 1.1 1.1 1-2 1-3 1.3
u. m <
u s 2
B • •
u u p < £ < <
2 K S . t "5 CO O 2 z 1J . 1 > - *> 5 3 yj

78
Interoperability Solutions
Table 23: Interoperability Solutions
E9: Interoperability Solutions (I) F6: Interoperability Solutions (II)
a) "(SMS OR MMS) AND services" b) "VAS OR 'Value Added Services'" c) "roaming OR NRTRDE" d) "network AND operator"
a) "(SMS OR MMS) AND services" b) "roaming OR NRTRDE" c) "mobile AND messaging AND services" d) "VAS OR 'Value Added Services'" e) "GSM"
PODI(E9, All, E)
0.2 0.4 0.5 0.7 0.9 1.1 1-4
1.9 2.0 PODI(F6, All, F)
_E2U_EL i t -!—"""*•• 'i *•" r
1.8 2.2 2.2
°V V ^ <*/w 0 3 0.5 0.5 0.7 0.7 1-0
G5: Interoperability Solutions (III) H7: Interoperability Solutions (IV)
a) "roaming OR NRTRDE" b) "solutions AND (roaming OR VAS OR 'Customer Care')" c) "network AND operator" d) "(SMS OR MMS) AND services"
PODI(G5, All, G) 1.8 1.8 2 1
a) "(SMS OR MMS) AND services" b) "solutions AND ('SIM card' OR 'smart card')" c) "solutions AND (roaming OR VAS OR 'Customer Care')" d) "service AND mobile AND (banking OR payment OR money OR financial)" e) "roaming OR NRTRDE"
PODI(H7, All, H)
0.2 0.4 0.5 0.6 0.7 0 9
* </ <v ̂ >vv rf»
0.1 0.4 0.4 0.5 0.5
dVy^aV'^V

79
112: Interoperability Solutions (V)
P0DI(I12, All, I)
a) "(SMS OR MMS) AND services" 1 6 i 8 2.0 2A
b) "VAS OR Value Added Services"' Q2 0A o.5 0.5 0.8 " _ g : c) "roaming OR NRTRDE" t I_ | M _ •» ™ _ 111 J l JllMlll ; B d) "solutions AND (roaming OR VAS OR •Customer Care"' ^ > c6 ^ f tf J? *> ^
The text messaging (SMS) and multimedia messaging (MMS) services require
interoperability solutions when moving from one operator to the other or from
one technology to another (e.g. CDMA and GSM). These services also allow the
message conversion to and from various formats. These solutions are designed
to enable mobile network operators to make more profits out of messaging. For
the mobile operators interested to manage large-scale Value Added Services
(VAS) applications based on SMS, MMS, WAP and Voice, the providers offer
complete solutions. The application providers help mobile operators and service
providers to reduce customer care costs and increase revenues from advanced
data services such as over the air configuration of terminals, service agreement
updates, administration tools, etc. The Near Real Time Roaming Data
Exchange (NRTRDE) is a platform for roaming management that provides
immediate access to the critical information needed to combat roaming fraud;
NRTRDE was introduced by one of the working groups in the GSM Association.
These interoperability indicators are captured by the factors shown in Table 23.

Reputation
Table 24: Reputation
80
Sociological studies on market competition (Podolny, 2005) indicate that under
conditions of market uncertainty the reputation and the status of a firm play an
important role in its success. Among the main players in the mobile
communication industry the application developers and content providers face
the highest levels of rivalry (Teo, 2001). The reputation indicators are captured
by the "Reputation" factor as shown in Table 24.

81
Research
Table 25: Research
The keywords in Table 25 identify research and innovation as a characteristic of
the technology organizations and universities with ties in the mobile
communication industry. The factors indicate that organizations are involved in
the research and development of the new wireless technologies.

82
3GPP Standard and 3G Technologies Evolution
Table 26: 3GPP Standard and 3G Technologies Evolution
E12: 3GPP Standard and 3G Technologies Evolution
a) "GPRS" b) "UMTS" c) "GSM" d) "WCDMA"
PODI(E12, All, E)
0.5 0.7 0.9 1.1 1.2 1.2 1-3 1A 1.6
°v^<^^./
The 3GPP 3G standards cover the technology evolution from GSM, GPRS to
UMTS/WCDMA over the last two decades. The organizations for which the
component is relevant could indicate continuous involvement with these
technologies as indicated in Table 26.
Fraud Detection
Fraud monitoring and detection are some of the solutions offered by firms
involved in the testing and improving of the communication quality. The web
pages of the organizations that this study analyzed also indicates that for the
companies involved in roaming, the exchange of information related to user's
access to other networks require fraud monitoring and analysis. Factor F1 also
includes a keyword identifying the GSM Association. This fact confirms that
these solutions are provided to the operators to enable the operators monetize
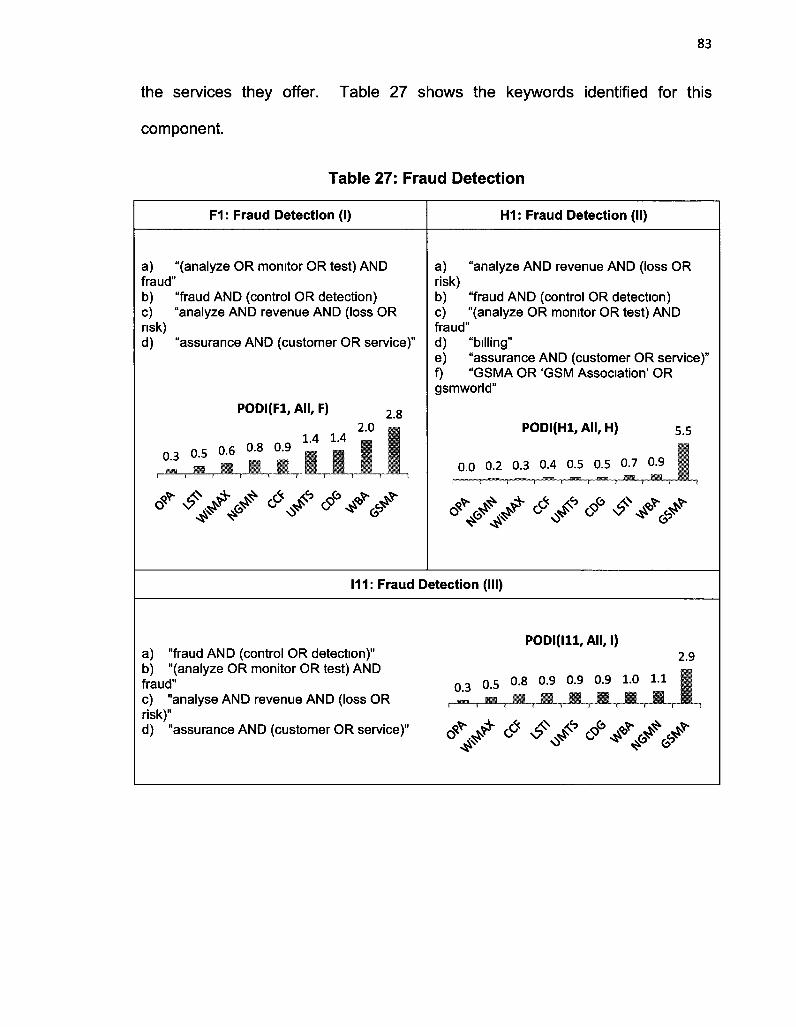
83
the services they offer. Table 27 shows the keywords identified for this
component.
Table 27: Fraud Detection
F1: Fraud Detection (I) H1: Fraud Detection (II)
a) "(analyze OR monitor OR test) AND fraud" b) "fraud AND (control OR detection) c) "analyze AND revenue AND (loss OR risk) d) "assurance AND (customer OR service)"
PODI(Fl, All, F) 2 g
2.0 1.4 1.4 _
0 3 0.5 0.6 0.8 0.9 I
a) "analyze AND revenue AND (loss OR risk) b) "fraud AND (control OR detection) c) "(analyze OR monitor OR test) AND fraud" d) "billing" e) "assurance AND (customer OR service)" f) "GSMA OR 'GSM Association' OR gsmworld"
PODI(Hl, All, H) 5.5
0.0 0.2 0.3 0.4 0.5 0.5 0.7 0.9 H
° W <*y <? ̂ *v
111: Fraud Detection (III)
a) "fraud AND (control OR detection)" b) "(analyze OR monitor OR test) AND fraud" c) "analyse AND revenue AND (loss OR risk)" d) "assurance AND (customer OR service)"
2.9 PODI(lll, All, I)
Q 3 o.5 0.8 0.9 0.9 0.9 1.0 1.1 • _ _ | M | n i i a [ B i B [ B i B [ B
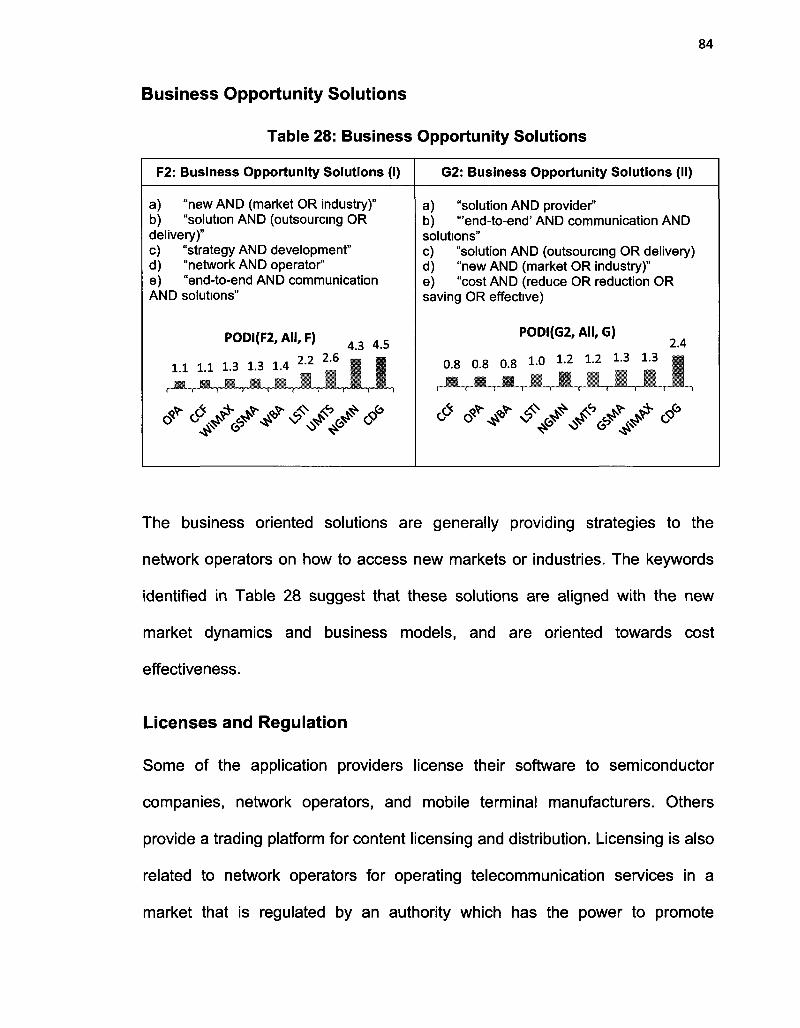
84
Business Opportunity Solutions
Table 28: Business Opportunity Solutions
F2: Business Opportunity Solutions (1)
a) "new AND (market OR industry)" b) "solution AND (outsourcing OR delivery)" c) "strategy AND development" d) "network AND operator" e) "end-to-end AND communication AND solutions"
PODI(F2,AII,F) 4 3 4 5
^. • . l i .n .E i . ra . f l . I . I ,
G2: Business Opportunity Solutions (II)
a) "solution AND provider" b) "'end-to-end' AND communication AND solutions" c) "solution AND (outsourcing OR delivery) d) "new AND (market OR industry)" e) "cost AND (reduce OR reduction OR saving OR effective)
PODI(G2, All, G) 2.4
0.8 0.8 0.8 10 1-2 1-2 1-3 1.3 |
o* o<v- ̂ y v v y **
The business oriented solutions are generally providing strategies to the
network operators on how to access new markets or industries. The keywords
identified in Table 28 suggest that these solutions are aligned with the new
market dynamics and business models, and are oriented towards cost
effectiveness.
Licenses and Regulation
Some of the application providers license their software to semiconductor
companies, network operators, and mobile terminal manufacturers. Others
provide a trading platform for content licensing and distribution. Licensing is also
related to network operators for operating telecommunication services in a
market that is regulated by an authority which has the power to promote

85
competition through its regulations. The keywords shown in Table 29 were
analyzed for a number of organizations from the sample and suggest that the
mobile communication companies may have just acquired a license for
operations and that their new entry in the market promotes competition which
ultimately benefits the consumers.
Table 29: Licenses and Regulation

86
Conformance and Certification
Table 30: Conformance and Certification
Network operators use products from infrastructure providers and device
manufacturers that passed the conformance and certification tests. The
conformity to standards and specification is validated by the certification service
providers. Besides safety, interference and performance, one of the reasons for
certification is interoperability which ensures that similar products from different
providers are inter-changeable and integrate seamlessly with other parts of the
network. Table 30 presents the keywords that are representative for
conformance and certification. The G4 factor defines one of the main

87
characteristics of the WiMAX Forum - its focus on certification. A study of the
WiMAX Forum confirms that the certification services for the base stations are
widely used by its members.
CDMA Technology and Standards
Table 31: CDMA Technology and Standards
I6: CDMA Technology and Standards
The code division multiple access (CDMA) is a wireless technology used in the
cdmaOne and CDMA2000 mobile phone family of standards (which are often
referred to as simply CDMA). The 1xRTT and EV-DO are part of the CDMA2000
family of standards and were developed by the "3rd Generation Partnership
Project 2" (3GPP2). Therefore factor 16 is relevant for organizations with
business models and offerings based on CDMA technologies and 3GPP2
standard.
a) "CDMA OR 'Code Division Multiple Access'" b) "1xRTT" c) "EV-DO OR EVDO" d) "3GPP2"
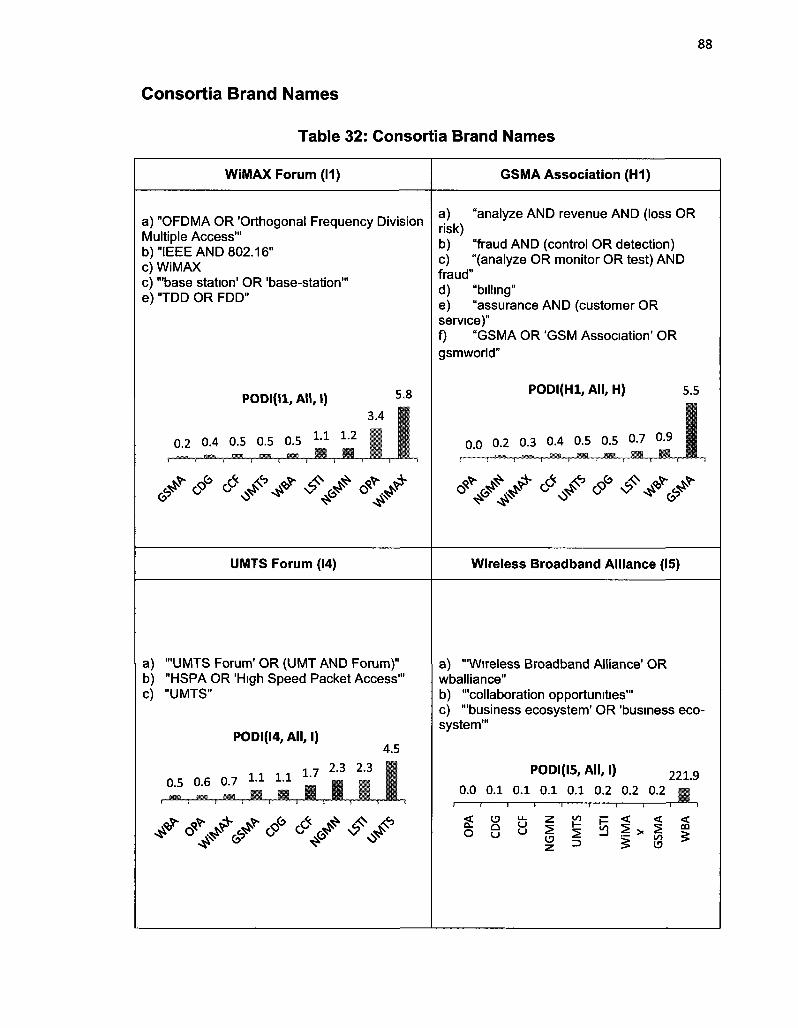
88
Consortia Brand Names
Table 32: Consortia Brand Names
WiMAX Forum (11) GSMA Association (H1)
a) "OFDMA OR 'Orthogonal Frequency Division Multiple Access'" b) "IEEE AND 802.16" c) WiMAX c) "'base station' OR 'base-station'" e) "TDD OR FDD"
a) "analyze AND revenue AND (loss OR risk) b) "fraud AND (control OR detection) c) "(analyze OR monitor OR test) AND fraud" d) "billing" e) "assurance AND (customer OR service)" f) "GSMA OR 'GSM Association' OR gsmworld"
PODI(ll, All, I)
0.2 0.4 0.5 0.5 0.5
3.4
0.0
PODI(Hl, All, H)
0.2 0.3 0.4 0.5 0.5 0.7 0 9
5.5
I # <t *j>s ff <jy °vy *v * ̂ / /
UMTS Forum (14) Wireless Broadband Alliance (15)
a) '"UMTS Forum' OR (UMT AND Forum)" b) "HSPA OR 'High Speed Packet Access" c) "UMTS"
PODI(l4, All, I)
0.5 0.6 0.7 1-1 1-1
4.5
a) "'Wireless Broadband Alliance' OR wballiance" b) "'collaboration opportunities'" c) "'business ecosystem' OR 'business ecosystem"'
PODI(l5,AII,l) 2 n 9
0.0 0.1 0.1 0.1 0.1 0.2 0.2 0.2 m
^dVV^-V^V &
1
< Q. O
ID
U
U_
U
z
Z
1 to
2 3
to _ i
i i i
< < <r CO
5

89
The majority of organizations' websites studied indicate the membership to
industry consortia. The presence of a consortia' logo or name on an
organization webpage is an indication of membership to the association. It also
indicates an interest in the technologies, standards or the collaboration
supported by the association. The factors and keywords identified in Table 32
show some of the consortia' names (WiMAX Forum, GSMA Association, UMTS
Forum and Wireless Broadband Alliance) and some the constructs relevant to
their members. GSMA is associated mostly with constructs of fraud control,
UMTS Forum is associated mostly with its technology, Wireless Broadband
Alliance members regard themselves as members of an ecosystem, and
WiMAX Forum shows focus on the base stations. CDG and CCF show a strong
focus on the CDMA standards and technologies.

90
4.6 Points of Difference for Consortia
The points-of-difference (POD) for each consortium is defined by the groups of
salient uncorrelated constructs identified from the Consortia PODI List. The
Consortia PODI List provides a ranked list of POD Indexes for all the factors in
each consortium. The POD Index (factor, consortium, sample) is used to
indicate the numerical importance for each factor, consortium and sample as
defined in Section 3.11 .

91
WiMAX Forum
The PODI Indexes for the identified factors in each sample group are presented
in Figure 10.
PODI (E1-E12, WiMAX, E)
1 . j 3 1.5 1-6 1 7
0 6 0.7 0.8 0.8 l-° • i l l
.y.i.a.i.a,1,1,1,1,1,1,1, E9 E7 E12 E3 El E10 E8 Ell E6 E2 E5 E4
PODI (Fl-Fll , WiMAX, F)
0.5 0.5 °-6 0.9 0.9 1.0 1.0 1.0 1.3 1.5 1.8
• ,11,1,1 i \ i t i i i
F6 F7 Fl F10 F5 F9 F3 F8 F2 Fll F4
PODI (G1-G10, WiMAX, G)
0.5 0.8 1.0 1-2 1-3 1-3 1-4 1.6 1.7 2.3
PODI (H1-H7, WiMAX, H)
0 5 0-8 1 0 " " 0 3 0.4 0.5
G5 G3 G7 Gl G2 G8 G10 G9 G6 G4 HI H7 H6 H5 H4 H3 H2
PODI (11-115, WiMAX, I)
0 2 0.4 0.5 0.6 0.6 0.7 0.7 1-1 1-1 I-4 1A 15 L 6 1 8
m , pa m
5.8
i f
15 112 111 19 110 14 16 115 114 18 13 17 113 12 II
Figure 10: WiMAX Forum POD Index Chart
The WiMAX Forum salient constructs, with their comprising factors from each
sample, and their POD Index are shown in Table 33.

92
Table 33: WiMAX Forum Salient Constructs
WiMAX Forum Salient Constructs
WiMAX Technology and Standards
Certification
Hardware
Testing Solutions
Factors
11, E4
G4, F11
12, G6, E5, F4
113
POD Index
5.81, 1.74
2.34, 1.77
1.76, 1.69, 1.58, 1.47
1.60
Grouping the salient constructs has to comply with the results from factor
analysis in each sample group, in order to avoid any correlation between
keywords. Based on the solutions indicated in Table 10, Table 11, Table 12,
Table 13 and Table 14 the following salient construct groups, or POD, were
identified for WiMAX Forum, and are shown in Table 34:
Table 34: WiMAX Forum POD
WiMAX Forum POD
WiMAX Technology and Standards (E4)
Hardware (E5)
Certification (F11)
Hardware (F4)
Certification (G4)
Hardware (G6)
WiMAX Technology and Standards (11)
Hardware (12)
Testing Solutions (113)
POD Index
1.74
1.58
1.77
1.47
2.34
1.69
5.81
1.76
1.60

93
GSM Association (GSMA)
The POD Indexes for the identified factors in each sample group are presented
for in Figure 11.
PODI (E1-E12, GSMA, E)
2.3
0.5 , . i i 1 3 1.4 1.4 1.4
D.7 0.8 0.9 1.0 12 _ m m m
i 1,1,1,1 1 E2 E5 E4 E10E11 E8 E3 El E6 E12 E9 E7
PODI (Fl-Fll , GSMA, F)
0.3 0.4 0 5 0.9 1.0 1-3 1-4 1-4 1.9 2.2
2.8
I B i i i I
F8 F4 F l l F10 F9 F2 F5 F7 F3 F6 Fl
0.5 0.7 0.7
PODI (G1-G10, GSMA, G)
1.0 1.0 1.1
PODI (H1-H7, GSMA, H)
••"i i"
G4 G10 G6 G9 G7 G8 Gl G2 G3 G5
0.7 0.9 0.9 — | MM | IB
1.5
T — —<r
H4 H3 H2 H5 H6 H7 HI
PODI (11-115, GSMA, I)
0.2 0.2 0.5 0.6 0.6 0.7 0.8 0.8 0.9 1 1 I-3 * f 2.4 2.5 2.9
„,i?rffi, , FTffi,
15 II 113 17 16 12 13 115 18 14 114 110 112 19 111
Figure 11: GSM Association POD Index Chart
The GSM Association salient constructs, with their comprising factors from each
sample, and their POD Index are shown in Table 35.

94
Table 35: GSMA Salient Constructs
GSMA Salient Constructs
Fraud Detection
Interoperability Solutions
Mobile Services
Revenue Management Solutions
Fee Based Business Solutions
Factors
H1, 111, F1
H7, 112, F6, E9, G5
H6
19, E7, F3
G3
POD Index
5.47, 2.92, 2.83
2.97,2.36,2.18,2.0, 1.85
2.49
2.47,2.27, 1.88
1.46
Grouping the salient constructs has to comply with the results from factor
analysis in each sample group, in order to avoid any correlation between
keywords. Based on the solutions indicated in Table 10, Table 11, Table 12,
Table 13 and Table 14 the following salient construct groups, or POD, were
identified for GSMA and are shown in Table 36.
Table 36: GSMA POD
GSMA POD
Revenue Management Solutions (E7)
Interoperability Solutions (E9)
Fraud Detection (F1)
Interoperability Solutions (F6)
Revenue Management Solutions (F3)
Interoperability Solutions (G5)
Fee Based Business Solutions (G3)
Fraud Detection (H1)
Interoperability Solutions (H7)
Mobile Services (H6)
Fraud Detection (111)
Revenue Management Solutions (19)
Interoperability Solutions (112)
POD Index
2.27
2.00
2.83
2.18
1.88
1.85
1.46
5.47
2.97
2.49
2.92
2.47
2.36

95
CDMA Development Group (CDG)
The POD Indexes for the identified factors in each sample group are presented
in Figure 12.
PODI (E1-E12, CDG, E)
„ 5 0.6 0.6 0.7 " ? < ? ? ? " "
• • i l l
1.4
E4 E2 E5 E l l E8 E10 E7 El E6 E12 E9 E3
PODI ( F l - F l l , CDG, F)
5.0 5.0 6.1
0.7 0.7 0.7 0.8
F6 F l l F7 F8 F5 F9 F10 Fl F2 F4 F3
PODI (G1-G10, CDG, G) PODI (H1-H7, CDG, H)
1.9 2.5
0.4 0.4 0.4 0.4 0.4 0.7 0 8 0L9
G9 G8 G10 Gl G5 G6 G7 G3 G4 G2
0.7 0.7 0.9 1.0 1.3
JUUXL -HI H4 H5 H3 H2 H6 H7
0.1 0.4
PODI (11-117, CDG, I)
0.6 0.7 0.7 0.7 0.7 0.9 0.9 0.9 1.0 1
4.4 11 1"6 1'8 1 § , 1 , 1 , 1 ,
Figure 12: CDG POD Index Chart
The CDG salient constructs, with their comprising factors from each sample,
and their POD Index are shown in Table 37.

96
Table 37: CDG Salient Constructs
CDG Salient Constructs
Revenue Management Solutions
Hardware
Business Opportunity Solutions
CDMA Technology and Standards
Fee Based Business Solutions
WiMAX Certification
Interoperability Solutions
Factors
F3
F4
F2, G2
16
110
G4
112
POD Index
6.10
5.05
4.99, 3.53
4.43
1.78
1.88
1.60
Grouping the salient constructs has to comply with the results from factor
analysis in each sample group, in order to avoid any correlation between
keywords. Based on the solutions indicated in Table 10, Table 11, Table 12,
Table 13 and Table 14 the following salient construct groups, or POD, were
identified for CDG and are shown in Table 38.
Table 38: CDG POD
CDG POD
Revenue Management Solutions (F3)
Hardware (F4)
Business Opportunity Solutions (F2)
Business Opportunity Solutions (G2)
WiMAX Certification (G4)
CDMA Technology and Standards (16)
Fee Based Business Solutions (110)
Interoperability Solutions (112)
POD Index
6.10
5.05
4.99
3.53
1.88
4.43
1.78
1.60

97
Next Generation Mobile Networks Alliance (NGMN)
The POD Indexes for the identified factors in each sample group are presented in
Figure 13.
PODI (E1-E12, NGMN, E)
0 6 0.7 0.8 0.9 1.0 1.0 ^2 13
J U U U U L I
1.5 l-7 I-8
i 2.1
t i f i -r—~-r-~-T—~-T' i
E7 E9 E8 E3 E10 E4 E12 E5 E2 Ell El E6
PODI ( F l - F l l , NGMN, F)
3.4 4.3 6.0
0.5 0.5 0.6 0.7 0.8 0.8 0.9 0.9 i I I I ! f 5 !
F6 F7 F l l F9 F5 Fl F10 F8 F3 F2 F4
PODI (G1-G10, NGMN, G)
0.7 1.0 1.0 1.0 1.1 1.1 1-2
G5 G8 G3 G7 G4 G6 G2 G9 G10 G l
0.2
PODI (H1-H7, NGMN, H)
n , 0.9 1.0 L 1
0.4 0.5 0-6
i i r
HI H7 H5 H6 H3 H4 H2
PODI (11-115, NGMN, I)
1 0 -5 0.9 1.0 1.0 1.1 1.1 1.1 1.1 1.2 1-6 1-8 2 1 2-3
i ™
3.4
1 15 112 19 110 114 111 16 115 13 II 12 113 18 14 17
Figure 13: NGMN Alliance POD Index Chart
The NGMN Alliance salient constructs, with their comprising factors from each
sample, and their POD Index are shown in Table 39.

98
Table 39: NGMN Salient Constructs
NGMN Salient Constructs
Hardware
Business Opportunity Solutions
Revenue Management Solutions
3GPP Standards and LTE Technology
Mobile Services
UMTS
Research
Testing Solutions
Factors
F4, 12
F2
F3
17, E6
G1.E1
14
18, E11.G9
113, G10, E2
POD Index
6.00, 1,57
4.28
3.43
3.41,2.13
2.50, 1.71
2.27
2.06, 1.71, 1.54
1.83, 1.73, 1.54
Grouping the salient constructs has to comply with the results from factor
analyses in each sample group, in order to avoid any correlation between
keywords. Based on the solutions indicated in Table 10, Table 11, Table 12,
Table 13 and Table 14 the following salient construct groups, or POD, were
identified for NGMN and are shown in Table 40.

Table 40: NGMN POD
NGMN POD
3GPP Standards and LTE Technology (E6)
Mobile Services (E1)
Research (E11)
Testing Solutions (E2)
Hardware (F4)
Business Opportunity Solutions (F2)
Revenue Management Solutions (F3)
Mobile Services (G1)
Testing Solutions (G10)
Research (G9)
3GPP Standards and LTE Technology (17)
UMTS (14)
Research (18)
Hardware (12)
POD Index
2.13
1.77
1.71
1.54
6.00
4.28
3.43
2.50
1.73
1.54
3.41
2.27
2.06
1.57

100
CDMA Certification Forum (CCF)
The POD Indexes for the identified factors in each sample group are presented
in Figure 14.
PODI (E1-E12, CCF, E)
2.5
0.4 0.5 0.7 °-7 °-7 _ _ ~ ™ • a MM ~
ta
E7 E9 E8 E10 El E3 E5 E l l E4 E12 E6 E2
PODI ( F l - F l l , CCF, F)
Q 5 0.7 0.9 1-0 I f I f 1-2 ^
' JUU
2.2 2.7 2.7
i i ™
F3 F4 Fl F6 F2 F5 F8 F10 F7 F9 F l l
2.1
PODI (G1-G10, CCF, G)
0.6 0.8 0.9 0.9 0.9 0.9 0.9 0.9
G5 G2 G6 G7 Gl G3 G8 G4 G9 G10
PODI (H1-H7, CCF, H)
8.5
PODI (11-115, CCF, I)
0.1 0.5 0.5 0.7 0.8 0.8 0.9 1.0 1-5 1.6 1.7 1.7 2.0 2.8
4.7 Hi |jj
Figure 14: CCF POD Index Chart
The CCF salient constructs, with their comprising factors from each sample, and
their POD Index are shown in Table 41.

101
Table 41: CCF Salient Constructs
CCF Salient Constructs
Licenses and Regulation
CDMA Standards and Technology
Conformance and Certification
Testing Solutions
Fee Based Business Solutions
3GPP and LTE Technology
UMTS
Research
Factors
H4
16
F11.I3
F9, E2, G10, 113
F7, 110
17, E6
14
18
POD Index
8.53
4.66
2.65, 1.99
2.65, 2.48, 2.10, 2.75
2.17, 1.55
1,69, 1.64
1.67
1.52
Grouping the salient constructs has to comply with the results from factor
analysis in each sample group, in order to avoid any correlation between
keywords. Based on the solutions indicated in Table 10, Table 11, Table 12,
Table 13 and Table 14 the following salient construct groups, or POD, were
identified for CCF and are shown in Table 42.
Table 42: CCF POD
CCF POD
Testing Solutions (E3)
3GPP and LTE Technology (E6)
CDMA Standards and Technology l(6)
Conformance and Certification (13)
3GPP and LTE Technology (17)
UMTS (14)
Fee Based Business Solutions (110)
Research (18)
POD Index
2.48
1.64
4.66
1.99
1.69
1.67
1.55
1.52
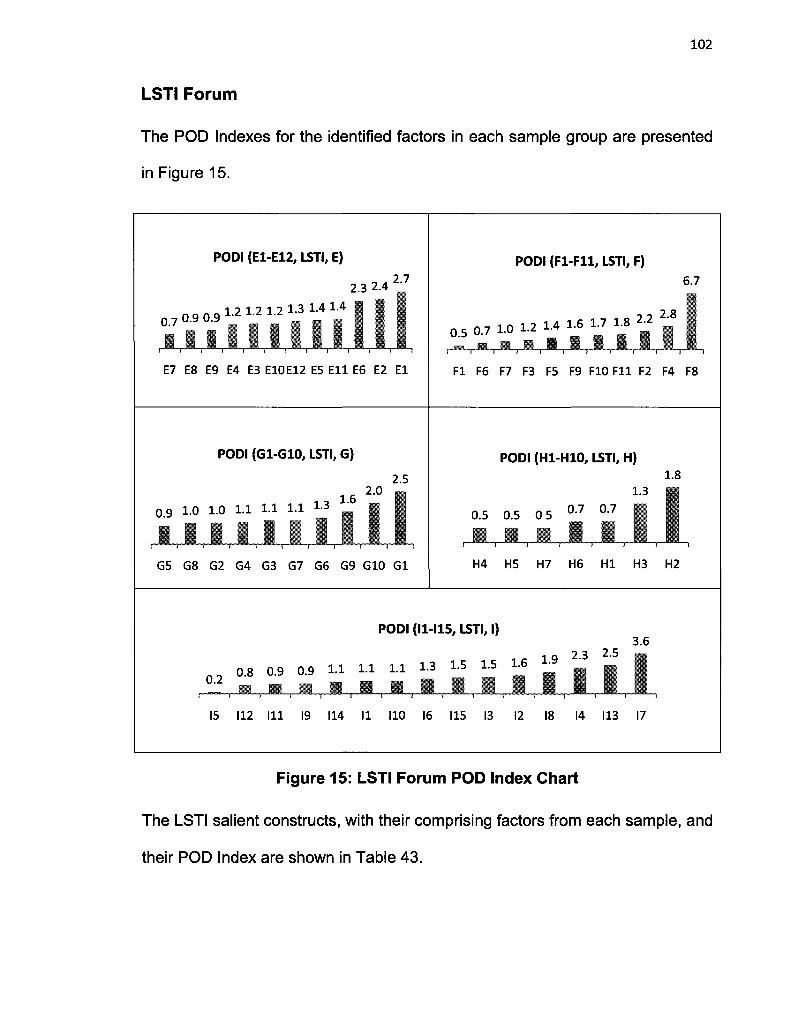
102
LSTI Forum
The POD Indexes for the identified factors in each sample group are presented
in Figure 15.
PODI (E1-E12, LSTI, E)
2.3 2.4 2.7
0.7 0.9 0.9 1.2 1.2 1.2 1-3 1-4 1-4 fK
! i — r - ~ i ,•••—.••• ,••— , ~i ( — , r „ , . . . . r — . . , „ . . . , _ ,
E7 E8 E9 E4 E3 E10E12 E5 E l l E6 E2 El
PODI ( F l - F l l , LSTI, F)
6.7
0 . 5 0.7 1.0 1-2 1-4 1-6 1-7 1-8 2 J
Fl F6 F7 F3 F5 F9 F10 F l l F2 F4 F8
PODI (G1-G10, LSTI, G) PODI (H1-H10, LSTI, H)
0 9 1.0 1.0 1.1 1 1 1.1 ^
i , 1 i P i \ J i ! r
1.6 2.0
2.5
t ! i
G5 G8 G2 G4 G3 G7 G6 G9 G10 Gl
0.5 0.5 0 5
PODI (11-115, LSTI, I)
0.2 0.8 0.9 0.9 """""uitXi
3.6
Figure 15: LSTI Forum POD Index Chart
The LSTI salient constructs, with their comprising factors from each sample, and
their POD Index are shown in Table 43.

103
Table 43: LSTI Forum Salient Constructs
LSTI Salient Constructs
3GPP Standards and LTE Technology
Hardware
Mobile Services
Testing
UMTS
Business Opportunity Solutions
Research
Conformance and Certification
Licenses and Regulation
Factors
F8, 17, E6, H2
F4, 12
E1.G1
113, E2, G10, F9
14
F2
18, G9
F11.I3
F10
POD Index
6.72,3.57,2.27, 1.84
2.74, 1.63
2.72, 2.52
2.51,2.38, 1.96, 1.56
2.29
2.19
1.94, 1.55
1.79, 1.50
1.70
Grouping the salient constructs has to comply with the results from factor
analysis in each sample group, in order to avoid any correlation between
keywords. Based on the solutions indicated in Table 10, Table 11, Table 12,
Table 13 and Table 14 the following salient construct groups, or POD, were
identified for LSTI Forum and are shown in Table 44.

Table 44: LSTI Forum POD
LSTI POD
3GPP Standards and LTE Technology (F8)
Licenses and Regulation (F10)
3GPP Standards and LTE Technology (F8)
Testing (F9)
3GPP Standards and LTE Technology (17)
UMTS (14)
Research (18)
Hardware (12)
Conformance and Certification (13)
Business Opportunity Solutions (F2)
Licenses and Regulation (F10)
Testing (F9)
Mobile Services (E1)
Testing (E2)
3GPP Standards and LTE Technology (E6)
Mobile Services (G1)
Testing (G10)
Research (G9)
POD Index
6.72
1.70
6.72
1.56
3.57
2.29
1.94
1.63
1.50
2.19
1.70
1.56
2.72
2.38
2.27
2.52
1.96
1.55

105
UMTS Forum
The POD Indexes for the identified factors in each sample group are presented
in Figure 16.
PODI (E1-E12, UMTS, E)
3.0
0.8
M
. . 1 6 1.8 1.8 1-9 2 0
1.1 1.1 1.1 1.2 1-4 m - • • H
j....wnm....|....*Bs™....̂ ...»-rn™, , j ™™ j„ j •r™1T„„j,„n,-v™ , ju . ,™. . ^ . . . j ^ ^ ^ ™ ^ ,j „™n i
E7 E3 E5 E8 E2 E9 E12E11 E4 E6 E10 El
PODI (Fl-Fll , UMTS, F)
• • • 1 1 1 " 5
2.0 2.2 2.6 3.2
r ' " S" t ' , " "«™™. , s ...c-.T......r...m™™.... ]__(a.c- ,j j , ™ ^ - ™ . . . . ^ . ! ™ ™ , . ™ ^ . ^ ™ , . , ^
Fll F8 F4 F5 Fl F7 F3 F9 F6 F2 F10
PODI (G1-G10, UMTS, G)
3.4
0.9 0 .9 0.9 1.0 1.2 " 1-5 " 2.1
. • . • . • , l , B , | J , - , - , - n G4 G8 G10 G6 G2 G3 G7 G9 G5 Gl
PODI (H1-H7, UMTS, H)
0.3 0.4 0.5 0.6 0.8
4.1
H6 H3 HI H2 H5 H7 H4
PODI (11-115, UMTS, I)
0 5 0.7 0.7 0.9 0.9 1.1 1.2 1.2 1.2 1.3 " ^ — "~ • • m i • _ • i •
E"
4.5 2.6
( r
15 II 13 16 111 19 110 12 114 113 17 112 18 115 14
Figure 16: UMTS Forum POD Index Chart
The UMTS Forum salient constructs, with their comprising factors from each
sample, and their POD Index are shown in Table 45.
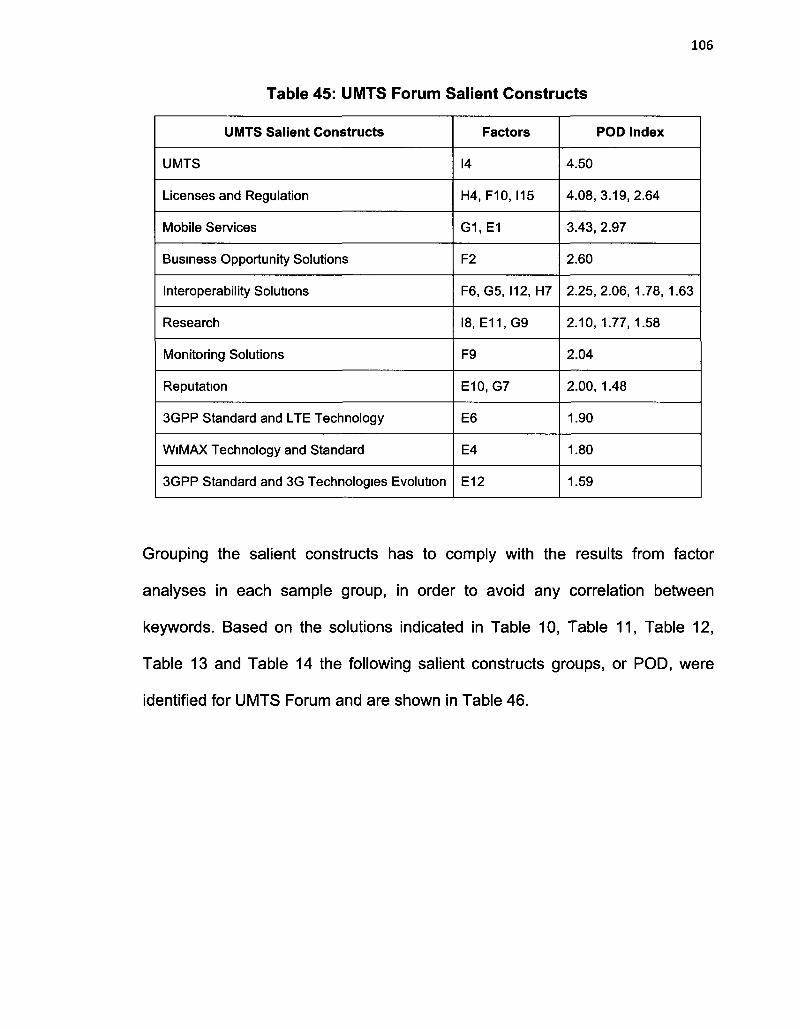
106
Table 45: UMTS Forum Salient Constructs
UMTS Salient Constructs
UMTS
Licenses and Regulation
Mobile Services
Business Opportunity Solutions
Interoperability Solutions
Research
Monitoring Solutions
Reputation
3GPP Standard and LTE Technology
WiMAX Technology and Standard
3GPP Standard and 3G Technologies Evolution
Factors
14
H4.F10, 115
G1.E1
F2
F6, G5, 112, H7
18, E11.G9
F9
E10, G7
E6
E4
E12
POD Index
4.50
4.08,3.19,2.64
3.43, 2.97
2.60
2.25,2.06, 1.78, 1.63
2.10, 1.77, 1.58
2.04
2.00, 1.48
1.90
1.80
1.59
Grouping the salient constructs has to comply with the results from factor
analyses in each sample group, in order to avoid any correlation between
keywords. Based on the solutions indicated in Table 10, Table 11, Table 12,
Table 13 and Table 14 the following salient constructs groups, or POD, were
identified for UMTS Forum and are shown in Table 46.
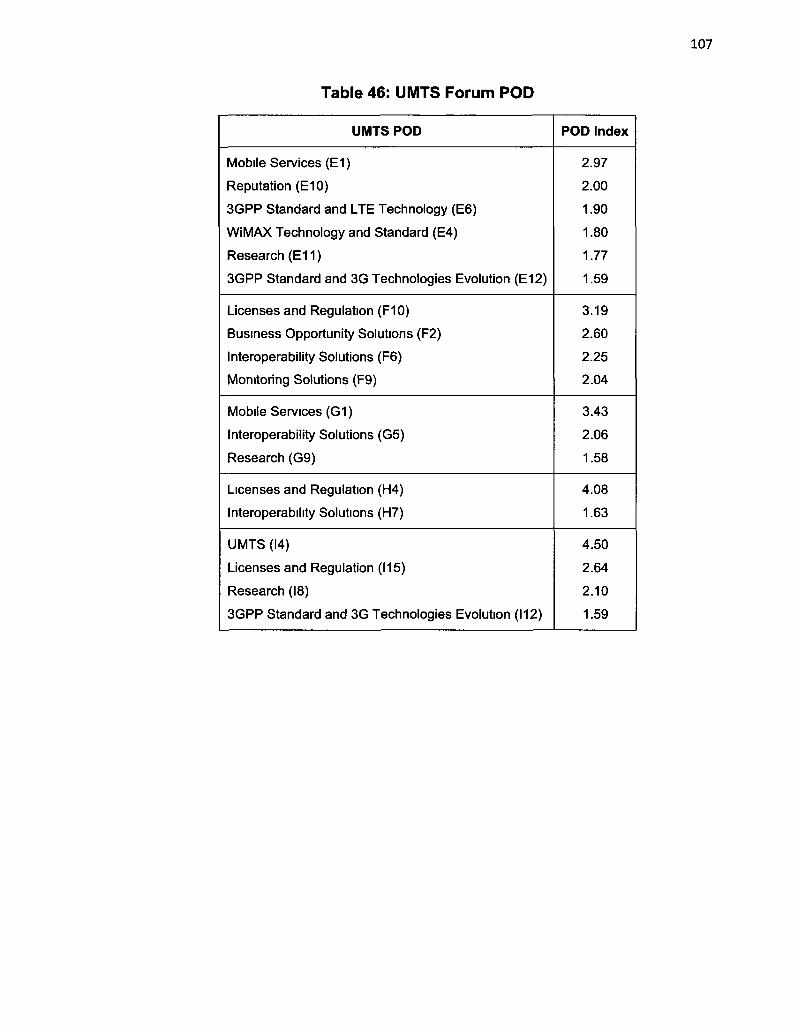
Table 46: UMTS Forum POD
UMTS POD
Mobile Services (E1)
Reputation (E10)
3GPP Standard and LTE Technology (E6)
WiMAX Technology and Standard (E4)
Research (E11)
3GPP Standard and 3G Technologies Evolution (E12)
Licenses and Regulation (F10)
Business Opportunity Solutions (F2)
Interoperability Solutions (F6)
Monitoring Solutions (F9)
Mobile Services (G1)
Interoperability Solutions (G5)
Research (G9)
Licenses and Regulation (H4)
Interoperability Solutions (H7)
UMTS (14)
Licenses and Regulation (115)
Research (18)
3GPP Standard and 3G Technologies Evolution (112)
POD Index
2.97
2.00
1.90
1.80
1.77
1.59
3.19
2.60
2.25
2.04
3.43
2.06
1.58
4.08
1.63
4.50
2.64
2.10
1.59

108
Wireless Broadband Alliance (WBA)
The POD Indexes for the identified factors in each sample group are presented
in Figure 17.
PODI (E1-E12, WBA, E)
1.9 2.0
0 8 0.9 0.9 1.0 1 1
° - 2 0 - 4 - ' j J l l l
1.3 1.3 .0.5
• , • . 1
E5 E6 E2 E4 E12 E7 E l l E8 E10 El E9 E3
PODI ( F l - F l l , WBA, F)
0.1 0.2 0.3 0.4 0.6 1.0
1.4 1.4 1-5 1.8 2.0
).3 u.^ — {j
uiXl ™ f I i i I" " I T " i
F8 F4 F3 F7 F10 F5 F2 F9 F l l F6 Fl
PODI (G1-G10, WBA, G) PODI (H1-H7, WBA, H)
0.3
JBL
0.6 0.8 0.8 0.9 1.1 1.2 1 3
1.6 1.8
1 H 1 !
0.4 0.6 0.9 1.0 1.1
! I
G6 G10 G9 G2 G4 G7 G8 Gl G3 G5 H3 H6 HI H2 H5 H4 H7
PODI (11-15, WBA, I)
221.9 0.1 0.2 0.4 0.4 0.5 0.5 0.7 0.8 1.0 1.0 1.1 1.3 1.3 2.0
r — — T 1 1 1 1 1 i r — — s r 1 1 1 r
17 12 16 113 14 II 18 13 111 110 115 19 114 112 15
Figure 17: WBA POD Index Chart
The WBA salient constructs, with their comprising factors from each sample,
and their POD Index are shown in Table 47.

109
Table 47: WBA Salient Construct
WBA Salient Constructs
Wireless Broadband Alliance
Interoperability Solutions
Fraud Detection
Fee Based Business Solutions
Licenses and Regulation
Conformance and Certification
Factors
15
H7, 112, E9, F6, G5
F1
E3, G3
H4
F11
POD Index
221.9
2.09,2.03, 1.87, 1.84, 1.79
2.04
1.97, 1.59
1.63
1.51
Grouping the salient constructs has to comply with the results from factor
analyses in each sample group, in order to avoid any correlation between
keywords. Based on the solutions indicated in Table 10, Table 11, Table 12,
Table 13 and Table 14 the following salient construct groups, or POD, were
identified for WBA and are shown in Table 48.
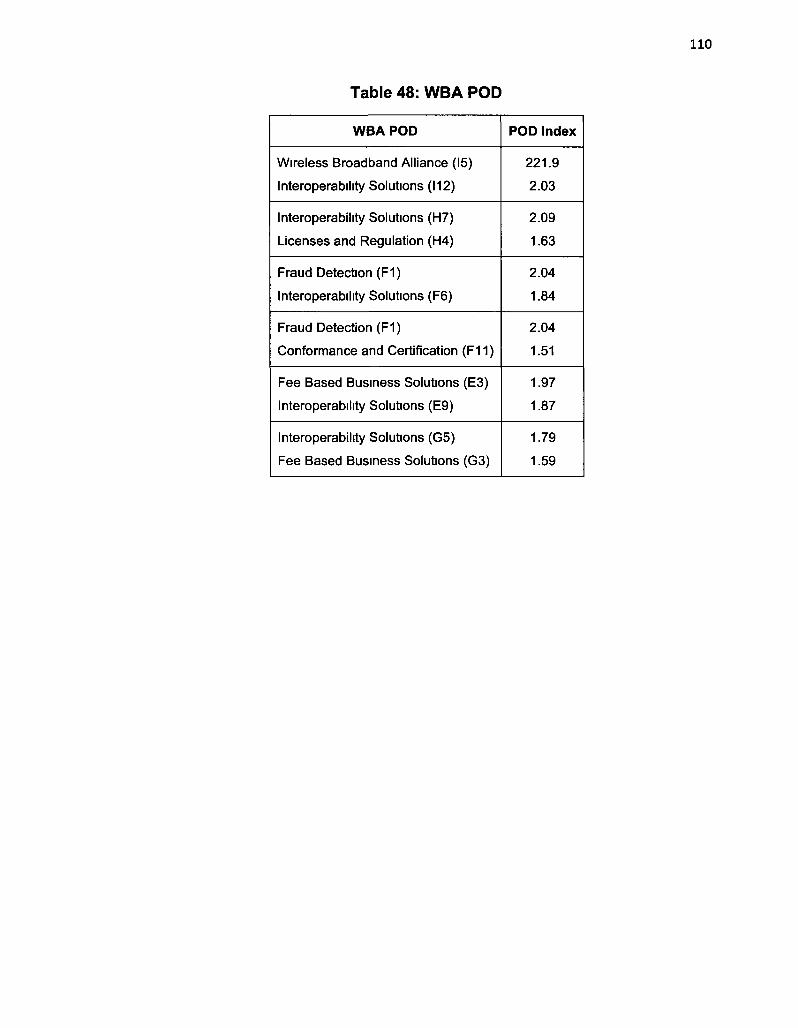
Table 48: WBA POD
WBA POD
Wireless Broadband Alliance (15)
Interoperability Solutions (112)
Interoperability Solutions (H7)
Licenses and Regulation (H4)
Fraud Detection (F1)
Interoperability Solutions (F6)
Fraud Detection (F1)
Conformance and Certification (F11)
Fee Based Business Solutions (E3)
Interoperability Solutions (E9)
Interoperability Solutions (G5)
Fee Based Business Solutions (G3)
POD Index
221.9
2.03
2.09
1.63
2.04
1.84
2.04
1.51
1.97
1.87
1.79
1.59

I l l
Open Patent Alliance (OPA)
The POD Indexes for the identified factors in each sample group are presented
in Figure 18.
PODI (E1-E12, OPA, E)
1.3 1.3 1.6
0 5 0.5 0.5 0.5 0-6 0.6 0.7 0'2liJjJjJ
0.8
E9 E12 El E10 E7 Ell E2 E6 E3 E8 E4 E5
PODI (Fl-Fll, OPA, F)
4.1 5.2
3.2 0.2 0.3 0.3 0.5 0.6 0.8 1.1
2.3
• , B — — T r — ' — I 1 ~ i 1 i — • — t i """ i ~ i
F3 F10 F6 Fl F7 F5 F9 F2 Fll F8 F4
PODI (G1-G10, OPA, G) 3.2
0.2 0.2 0.6 0.6 0.8 0 8 0.9 L0
a l i i
1.8
PODI (H1-H7, OPA, H)
0 7 0.8 0.8
Gl G5 G7 G3 G10 G2 G8 G9 G6 G4
0.0 0.1 o-2
_ K3
HI H7 H4 H5 H3 H2 H6
PODI (11-115, OPA, I)
1.0 0.2 0.3 0.5 0.6 0.6 0.8 0.9 0.9 1.0 1-2 ™ ^
2.5 3.4
Figure 18: OPA POD Index Chart
The OPA salient constructs, with their comprising factors from each sample, and
their POD Index are shown in Table 49.

112
Table 49: OPA Salient Constructs
OPA Salient Constructs
Hardware
3GPP Standard and LTE Technology
WiMAX Technology and Standard
WiMAX Certification
Conformance and Certification
Factors
F4, 12, G6, E5
F8, 17
11
G4
F11
POD Index
5.16,2.47, 1.79, 1.58
4.09, 1.70
3.39
3.21
2.34
Grouping the salient constructs has to comply with the results from factor
analysis in each sample group, in order to avoid any correlation between
keywords. Based on the solutions indicated in Table 10, Table 11, Table 12,
Table 13 and Table 14 the following salient construct groups, or POD, were
identified for OPA and are shown in Table 50.
Table 50: OPA POD
OPA POD
Hardware (F4)
Conformance and Certification (F11)
WiMAX Technology and Standard (11)
Hardware (12)
3GPP Standard and LTE Technology
WiMAX Certification (G4)
Hardware (G6)
POD Index
5.16
2.34
3.39
2.47
1.70
3.21
1.79

113
4.7 Multiple Memberships
An analysis of single and multiple memberships for organizations in sample
Group I using the technology factors could provide additional insights on the
technology adoption. The POD Index ranking of organizations based on either
the single or double membership was performed for the following factors:
• 16: CDMA Technology and 3GPP2 Standards
• 11: WiMAX Technology and IEEE 802.11 Standards
• 17: LTE Technology and 3GPP Standards
The PODI (16, All, I) index for groups of organizations that are members of one
or two consortia is shown in Figure 19.
PODI (16, All, I) . o 5 5
Figure 19: Distribution of CDMA Technology and Standards
The PODI (11, All, I) index for groups of organizations that are members of one or two consortia is shown in Figure 20.

114
PODI ( I I , All, I)
Figure 20: Distribution of WiMAX Technology and Standards
The PODI (17, All, I) index for groups of organizations that are members of one
or two consortia is shown in Figure 21.
PODI (17, All, I)
Figure 21: Distribution of LTE Technology and Standards
4.8 Construct Groups Visualization
A graphical representation of the construct groups identified for each consortium
in each sample group is provided in Figure 22, Figure 23, Figure 24, Figure 25
and Figure 26. The visualization could help with the interpretation of constructs
and the impact the shared membership have on these constructs by bringing

115
together in one view, for each sample group, the construct groups identified for
each association and their respective POD Index, the number of organizations
in each association and the number of organizations shared between two
consortia.
Hardware Revenue Management Solutions
WiMAX Technology
Fee Based Business Solutions
Interoperability Solutions
Reputation
Mobile Services
Testing Solutions Research
3GPP Standard and 3G Technologies
3GPP Standard and LTE Technology
Figure 22: Sample Group E: Construct Groups Visualization

116
WiMAX
Conformance and Certification
Interoperability Solutions
Licenses and Regulation
Monitoring Solutions
Fraud Detection
WBA Revenue Management
Solutions
Testing
Business Opportunity Solutions
3GPP Standard and LTE Technology
Figure 23: Sample Group F: Construct Groups Visualization
Fee Based Business Solutions
Certif ication
Interoperabil i ty Solutions
W B A
Business Opportuni ty 1 5 3 I Solutions J
Testing Solutions I
Figure 24: Sample Group G: Construct Groups Visualization

117
119
Interoperability Solutions
OPA 74
WBA | Mobile Services I
NGMN 2 J
/ C C F
/ 4 0 8 ^ -1 63 / ^ ^ ^
Licenses and Regulation
/^ " ">(1 63 ^ ~ V * ^ v s^"
U M T S / L S T I
184 /
3GPP Standards and LTE Technology
Figure 25: Sample Group H: Construct Groups Visualization
Testing Solutions
Fraud Detection
Wireless Broadband Alliance
Licenses and Regulation
3GPP Standards and 3G Technologies
2 47
\
SO—-
CDG
Revenue Management Solutions
___236
^ 1 6 0 178
4 43
Interoperability Solutions
t 1 Fee Based Business
Solutions * - • • '
CDMA Technology
Conformance and Certification
UMTS 3GPP Standards and LTE Technology
Figure 26: Sample Group I: Construct Groups Visualization

118
5. Discussion of Results
This chapter discusses the results of the research. It is divided into eight
sections. Section 5.1 provides a discussion on the points of difference in
wireless industry consortia. Section 5.2 identifies membership motivation.
Section 5.3 provides a view on the development phases of consortia. Section
5.4 identifies the characteristics of technological evolution. Section 5.5 provides
evidence of technological adoption. Section 5.6 identifies the emerging role of
backend systems. Section 5.7 discusses the insights acquired from the research
results. Section 5.8 provides recommendations for organizations that operate as
keystones.
5.1 Points of Difference
The points-of-difference (POD) for each consortia are defined by the groups of
salient constructs identified in Section 4.6 Points of Difference.
This section provides a comparison between the POD identified in this research
and the consortia's objectives obtained from the web pages of the associations,
forums and alliances studied.

119
WiMAX Forum
Table 51: Mapped Objectives for WiMAX Forum
WiMAX Forum POD
WiMAX Technology and Standards
Conformance and Certification
Hardware
(see Table 34 for details)
WiMAX Forum Objectives
"The WiMAX Forum is the worldwide
consortium focused on global adoption
of WiMAX and chartered to establish
certification processes that achieve
interoperability, publish technical
specifications based on recognized
standards, promote the technology
and pursue a favourable regulatory
environment"25
Discussion:
The certification of the hardware products for base stations are intended to
validate the cross-vendor interoperability at the lower layers of the
communication stack in the wireless network - the access network, and it is
based on the IEEE 801.16 standard and WiMAX technology. In summary, the
POD are an indication of:
• Certification for standard compliance and interoperability at the access
level of the network
Conclusion:
There is a good mapping between the points-of-difference identified and the
forum's objectives
http.//www.wimaxforum org/about/vision-and-mission, last checked July 14, 2010

120
GSM Association
Table 52: Mapped Objectives for GSMA
GSMA POD
Interoperability Solutions
Fraud Detection
Revenue Management Solutions
Mobile Services
Fee Based Business Solutions
(See Table 36 for details)
GSMA Objectives
"The GSMA's mission is to create
value for operators and the mobile
industry in the provision of services for
the benefit of end users"26.
Discussion:
The majority of the GSM Association members are mobile operators and this is
reflected on the focus on services and applications for end-users. In summary,
the POD show that:
• Interoperability is focused on the reliability of the user information
exchanged between the service providers when mobile users roam
between different networks
• There is a strong focus on operational optimization, mobile applications
and services
Conclusion:
GSMA objectives are vague and general. The identified POD have a definitional
role, they provide suggestions for the group's objectives meaning, and identify
how the group brings value to its members.
http.//www.gsmworld com/about-us/vision htm, last checked July 23, 2010
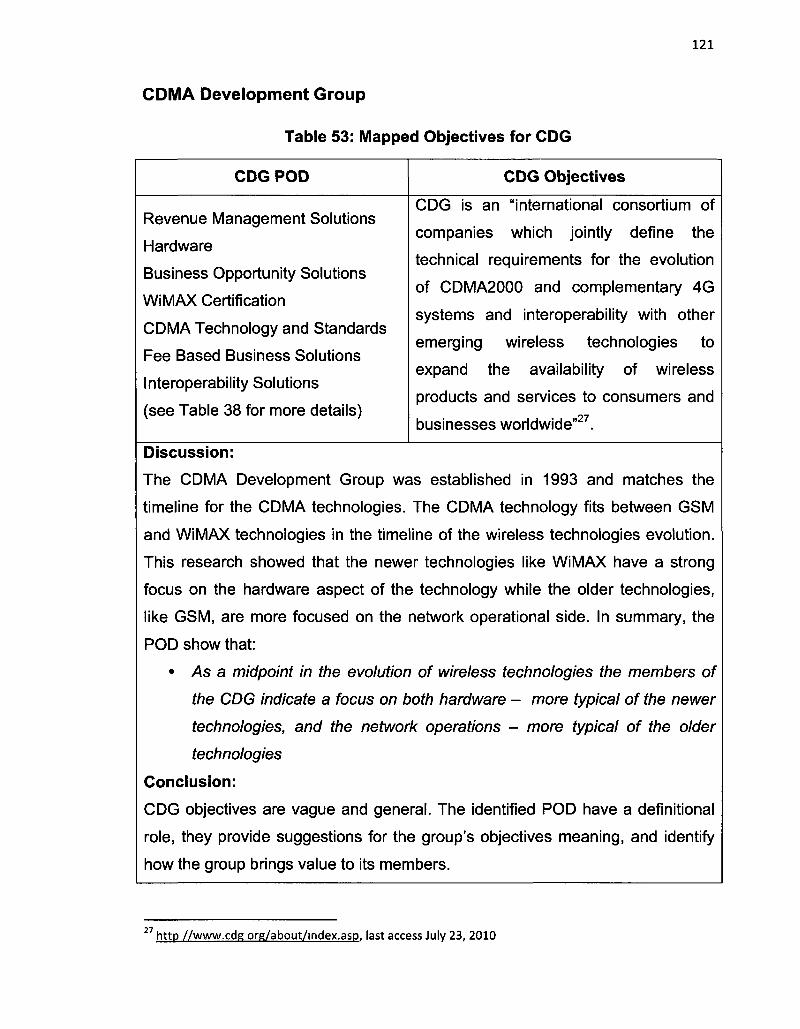
121
CDMA Development Group
Table 53: Mapped Objectives for CDG
CDG POD
Revenue Management Solutions
Hardware
Business Opportunity Solutions
WiMAX Certification
CDMA Technology and Standards
Fee Based Business Solutions
Interoperability Solutions
(see Table 38 for more details)
CDG Objectives
CDG is an "international consortium of
companies which jointly define the
technical requirements for the evolution
of CDMA2000 and complementary 4G
systems and interoperability with other
emerging wireless technologies to
expand the availability of wireless
products and services to consumers and
businesses worldwide"27.
Discussion:
The CDMA Development Group was established in 1993 and matches the
timeline for the CDMA technologies. The CDMA technology fits between GSM
and WiMAX technologies in the timeline of the wireless technologies evolution.
This research showed that the newer technologies like WiMAX have a strong
focus on the hardware aspect of the technology while the older technologies,
like GSM, are more focused on the network operational side. In summary, the
POD show that:
• As a midpoint in the evolution of wireless technologies the members of
the CDG indicate a focus on both hardware - more typical of the newer
technologies, and the network operations - more typical of the older
technologies
Conclusion:
CDG objectives are vague and general. The identified POD have a definitional
role, they provide suggestions for the group's objectives meaning, and identify
how the group brings value to its members.
http //www.cdg org/about/index.asp, last access July 23, 2010

122
LSTI Forum
Table 54: Mapped Objectives for LSTI Forum
LSTI POD
3GPP Standards and LTE Technology
UMTS
Research
Hardware
Conformance and Certification
(see Table 44 for more details)
LSTI Objectives
The LSTI Forum objective is to
"develop an open industry ecosystem
by involving all stakeholder
(manufacturers, regulators, operators,
research community, application
developers) in the process; early
cooperation to reduce risks; early proof
of concept and interoperability tests of
equipment between vendors; support
of 3GPP LTE/SAE standardization"28
Discussion:
With no commercial deployment at this time29 the area of focus for the member
organizations are in standards, research, and testing. As indicated in Appendix
D: Membership Distribution, the LSTI Forum membership is shared with other
consortia, more significantly with GSM Association and WiMAX Forum. The
mobile services components identified in our results are a measure of the
shared membership and it suggests that a large proportion of the participants
are incumbents involved in other mobile communication technologies. In
summary, the POD show that:
• The involvement in the newest mobile communication technologies has
its strongest constructs in standards, research, development and testing
Conclusion:
LSTI Forum objectives are vague and general. The identified POD have a
definitional role, they provide suggestions for the forum's objectives meaning,
and identify how the forum brings value to its members.
http://www.lstiforum.org/about/intro.html, last accessed July 23, 2010 July 2010

123
NGMN Alliance
Table 55: Mapped Objectives for NGMN Alliance
NGMN POD
3GPP Standards and LTE Technology
UMTS
Research
Hardware
Mobile Services
Testing Solutions
(see Table 40 for more details)
NGMN Objectives
"NGMN intends to complement and
support the work within standardisation
bodies by providing a coherent view of
what the operator community is going
to require in the decade beyond
2010"30
Discussion:
With no commercial deployment at this time31 the area of focus for the member
organizations are in standards, research, and testing.
As indicated in Appendix D: Membership Distribution, similar to the LSTI Forum,
the NGMN Alliance membership is shared with other consortia, more
significantly with GSM Association and WiMAX Forum. The mobile services
components identified in our results are a measure of the shared membership
and it suggests that a large proportion of the participants are incumbents
involved in other mobile communication technologies. In summary, the POD
show that:
• The involvement in the newest mobile communication technologies has
its strongest constructs in standards, research, development and testing
Conclusion:
NGMN Alliance objectives are vague and general. The identified POD have a
definitional role, they provide suggestions for the alliance's objectives meaning,
and identify how the alliance brings value to its members.
http://www.ngmn.org/aboutus.html, last accessed July 12, 2010 31 July 2010

124
CDMA Certification Forum
Table 56: Mapped Objectives for CCF
CCF POD
CDMA Standards and Technology
Conformance and Certification
3GPP and LTE Technology
UMTS
Fee Based Business Solutions
Research
Testing Solutions
(see Table 42 for more details)
CCF Objectives
"CDMA Certification Forum is a
partnership between CDMA operators
and CDMA device vendors to establish
and maintain a core global device
certification process that helps improve
quality through consistent
interoperability, conformance and
performance testing across the
globe."32
Discussion:
The CDMA Certification Group was established in 2004, a decade later after the
establishment of the CDMA Development Group, in order to establish a global
CDMA certification process. The CCF shows strong support for the CDMA
Standards and Technology construct and a relative medium support for the
Conformance and Certification construct. The relative weak support for a wide
range of other constructs, some of them specific to 3GPP technologies, is
explained by the shared membership of operators and device manufacturers to
other consortia, as shown in Appendix D: Membership Distribution. In summary,
the POD show that:
• The main focus is on standards and certification
Conclusion:
There is a good mapping between the points-of-difference identified and the
forum objectives.
http.//www.globalccf.org/about us php, last accessed July 12, 2010

125
UMTS Forum
Table 57: Mapped Objectives for UMTS
UMTS POD
UMTS
Licenses and Regulation
Research
3GPP Standard and 3G Technologies
3GPP Standard and LTE Technology
WiMAX Standard and Technology
Interoperability Solutions
Mobile Services
(see Table 46 for more details)
UMTS Objectives
UMTS Forum objective is to support its
members with a range of studies and
reports on markets trends, mobile
services and applications, key growth
markets, and with advice on 3GPP
and LTE licensing and regulation,
global spectrum arrangements, "LTE
ecosystem", and contributions to
international standards33.
Discussion:
The UMTS technology, also known as Wide Band CDMA (WCDMA), is part of
the 3GPP group of standards and it fits chronologically between GSM and LTE,
in a span over time of two decades. Some of UMTS Forum members in each of
the analyzed groups share their membership with GSM Association, LSTI
Forum and NGMN Alliance as indicated in Appendix D: Membership
Distribution. This fact could explain in part the wide scope of the constructs
identified. In summary, the POD show that:
• The advisory role of the consortium is suggested by a wide scope of
interests in research, standards, mobile services and interoperability
Conclusion:
UMTS Forum objectives are vague and general. The identified POD have a
definitional role, they provide suggestions for the forum's objectives meaning,
and identify how the forum brings value to its members.
http://www.umts-forum.org/content/view/2002/125/, last accessed July 9, 2010

126
Wireless Broadband Alliance
Table 58: Mapped Objectives for WBA
WBA POD
Interoperability Solutions
Fraud Detection
Fee Based Business Solutions
(see Table 48 for more details)
WBA Objectives
WBA objective is to "drive wireless
broadband adoption globally by
developing common commercial and
technical frameworks for
interoperability across networks,
technologies and devices"34.
Discussion:
The majority of the WBA members are mobile operators and this fact is reflected
on the identified constructs. The alliance is focused on services and applications
for end-users. In summary, the POD show that:
• The interoperability is focused on the reliability of the user information
exchanged between the service providers when mobile users roam
between different networks
Conclusion:
The WBA objectives are vague and general. The identified POD have a
definitional role, they provide suggestions for the alliance's objectives meaning,
and identify how the alliance brings value to its members.
http.//www.wballiance.net/history.html, last accessed July 12, 2010

127
Open Patent Alliance
Table 59: Mapped Objectives for OPA
OPA POD
WiMAX Technology and Standards
Conformance and Certification
Hardware
3GPP Standards and LTE Technology
(see Table 50 for more details)
OPA Objectives
OPA objective is to "foster a global
ecosystem that will help ensure the
successful and broad adoption of 4G
wireless [...] by creating a fair,
transparent and balanced IPR
licensing structure to accelerate the
global adoption of WiMAX, while
simultaneously fostering broader
choice and lowering costs for WiMAX
technology, devices and
applications"35.
Discussion:
The majority of Open Patent Alliance members are shared with WiMAX Forum.
This explains the similarity in the identified constructs of the alliance. The
alliance objective, to create a licensing IPR structure for WiMAX is not reflected
in the identified constructs. In summary, the POD show that:
• Certification for standard compliance and focus on hardware at the
access level of the network
Conclusion:
There is a poor mapping between the points-of-difference identified and the
alliance's objectives.
http //openpatentalliance.com/about, last accessed July 12, 2010

128
5.2 Legacy and Evolution
The analysis of the members of the wireless industry consortia, as indicated in
Section 5.1 Points of Difference, shows that based on their establishment date
and involvement with the respective technologies a map can be drawn that
indicates the consortia's focus at different stages in the evolution of
technologies.
Table 60: Legacy and Evolution Constructs
Technology
GSM
CDMA
UMTS
WiMAX
LTE
Standards
3GPP
3GPP2
3GPP
IEEE 802.11
3GPP
Consortia and year of establishment
GSM Association (1987)
CDMA Development Group (1993)
CDMA Certification Forum (2004)
UMTS Forum (1996)
WiMAX Forum (2001)
Open Patent Alliance (2008)
NGMN Alliance (2006)
LSTI Forum (2007)
Constructs
Operational Optimization Interoperability Solutions
Mobile Services
(see Table 36) Operational Optimization
Cost Reduction for Base Stations
Standards Testing
Certification
(see Table 38 and Table 42) Research
3G and 4G Standards Interoperability Solutions
Mobile Services Regulation
(see Table 46) Standards
Interoperability at Device Level Hardware
Certification
(see Table 34 and Table 50) Standards Research
Test Solutions Hardware
Mobile Services
(see Table 40 and Table 44)

129
The identified constructs provide a trajectory from the legacy to newer
technologies as indicated in Figure 27. This study shows that legacy
technologies are characterized by a focus on optimization, services and cost
reduction while the new and developing technologies are focused on standards,
research, hardware, and testing. The outlier in this interpretation is the CDMA
Certification Forum. The association was established ten years after the
introduction of the CDMA technology. As a certification organization the focus
on testing and certification at the access level of the network indicates that the
access equipment is possibly still under development and has not become a
commodity yet.
GSM
CDMA
UMTS
WiMAX
LTE
Optimization Services
Cost Reduction
Standards Research Hardware
Testing
1987 1993 1996 2001 2007 2010
Figure 27: Legacy and Evolution
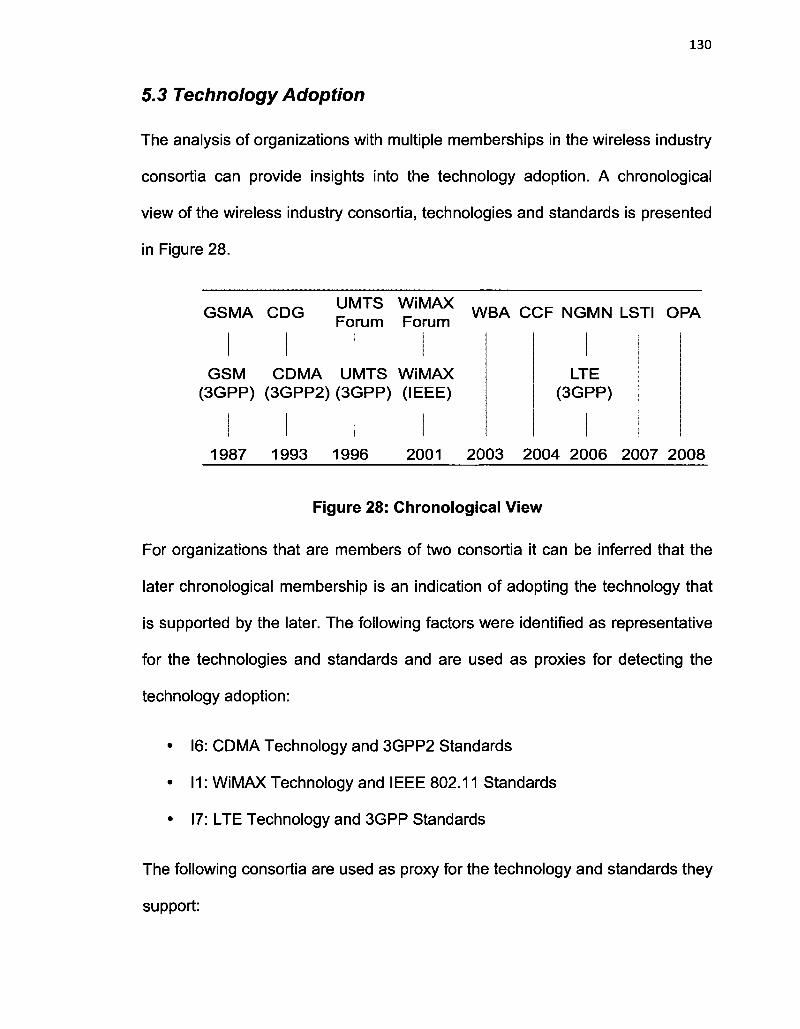
130
5.3 Technology Adoption
The analysis of organizations with multiple memberships in the wireless industry
consortia can provide insights into the technology adoption. A chronological
view of the wireless industry consortia, technologies and standards is presented
in Figure 28.
GSMA CDG UMTS WiMAX Forum Forum
GSM CDMA UMTS WiMAX (3GPP) (3GPP2) (3GPP) (IEEE)
WBA CCF NGMN LSTI OPA
LTE (3GPP)
1987 1993 1996 2001 2003 2004 2006 2007 2008
Figure 28: Chronological View
For organizations that are members of two consortia it can be inferred that the
later chronological membership is an indication of adopting the technology that
is supported by the later. The following factors were identified as representative
for the technologies and standards and are used as proxies for detecting the
technology adoption:
• 16: CDMA Technology and 3GPP2 Standards
• 11: WiMAX Technology and IEEE 802.11 Standards
• 17: LTE Technology and 3GPP Standards
The following consortia are used as proxy for the technology and standards they
support:

131
GSMA: GSM Technology and 3GPP Standards
CDG: CDMA Technology and 3GPP2 Standards
UMTS Forum: UMTS Technology and 3GPP Standards
WiMAX Forum: WiMAX Technology and IEEE 802.11 Standards
LSTI and NGMN: LTE Technology and 3GPP Standards
The adoption map to CDMA and from CDMA to other technologies, based on
PODI (16, All, I) Index identified in Figure 19, is presented in Figure 29:
2 7 , _ ^ ^ »
GSM 2.4
> CDMA
^--^"
3 1 >
- ^ ^
—̂
UMTS
2 8 --»
LTE
WiMAX
Figure 29: CDMA Adoption
The adoption map to WiMAX and from WiMAX to other technologies, based on
PODI (11, All, I,) Index identified in Figure 20, is presented in Figure 30:
GSM
UMTS
1.0
\ i o
- > WiMAX — T f
1-6J >
LTE
CDMA 0.9
Figure 30: WiMAX Adoption
The adoption map to LTE, based on PODI (11, All, I) Index identified in Figure
21, is presented in Figure 31:
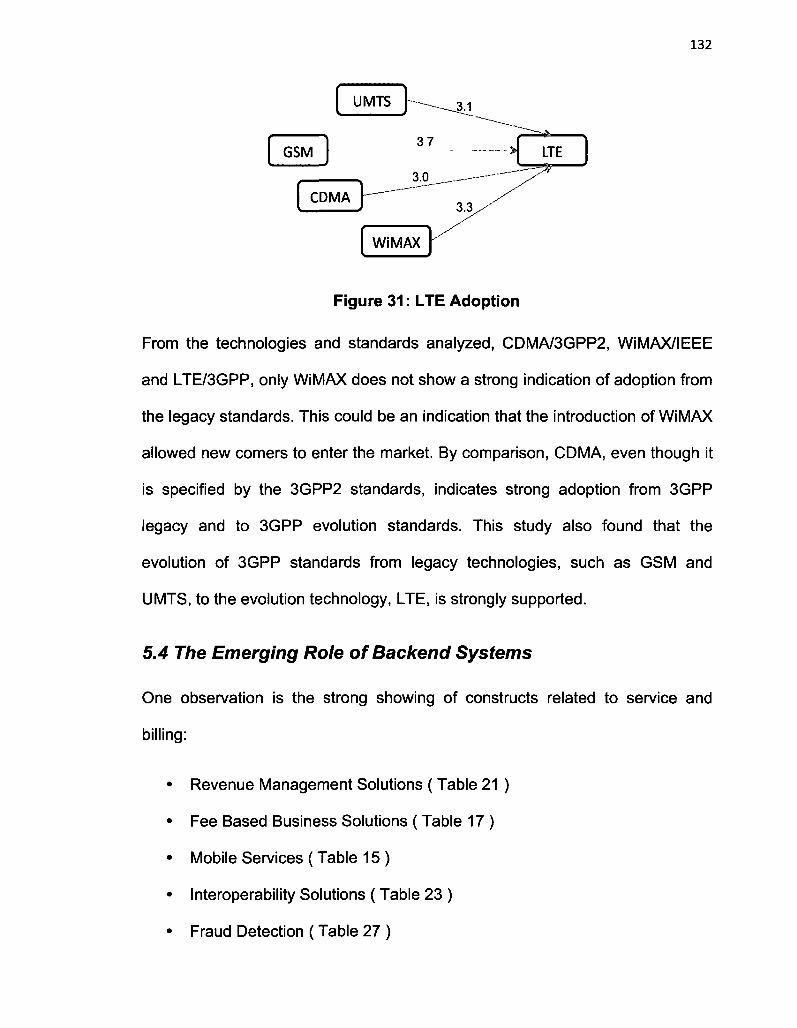
132
UMTS 3.1
GSM 37
3.0
LTE ^
CDMA 3.3.
WiMAX
Figure 31: LTE Adoption
From the technologies and standards analyzed, CDMA/3GPP2, WiMAX/IEEE
and LTE/3GPP, only WiMAX does not show a strong indication of adoption from
the legacy standards. This could be an indication that the introduction of WiMAX
allowed new comers to enter the market. By comparison, CDMA, even though it
is specified by the 3GPP2 standards, indicates strong adoption from 3GPP
legacy and to 3GPP evolution standards. This study also found that the
evolution of 3GPP standards from legacy technologies, such as GSM and
UMTS, to the evolution technology, LTE, is strongly supported.
5.4 The Emerging Role of Backend Systems
One observation is the strong showing of constructs related to service and
billing:
Revenue Management Solutions (Table 21 )
Fee Based Business Solutions (Table 17 )
Mobile Services (Table 15 )
Interoperability Solutions (Table 23 )
Fraud Detection (Table 27 )
133
• Business Opportunity Solutions (Table 28 )
• Security Solutions (Table 22)
In the study of the convergence of the mobile ecosystem Basole (2009)
highlights the relative central network position of the service and billing
providers. The service and billing providers provide software systems necessary
for provisioning, billing, and customer service. Basole (2009) arguments that, as
technologies, content and offerings converge, the ability to seamlessly provision
and price new, bundled service becomes even more important as these
backend systems enable network operators, service and content providers to
monetize the products and services they offer.
These points explain in part the strength of the service and billing constructs
identified in this study.
5.5 Members Motivation for Participation
The participation of the industry stakeholders in standards development
activities, technology trials and equipment certification to validate the cross-
vendor interoperability of the radio access and core networks is often regarded
as an effort to create or further the mobile ecosystem36. The niches created in
the industry by associations, forums or alliances take shape under the
leadership of these organizations which act as keystones and network hubs,
lansiti and Levien (2004) defines them as active leaders, effective at both
creating and sharing value across the system; they are the network hubs that sit
36 http //www.lstiforum.org/media/press html?listNum=160, last accessed August 8, 2010

134
at the core of the collaboration network. These associations, forums and
alliances have attracted membership based on several manifest characteristics.
A summary of these characteristics based on the results identified in Chapter 5
and the consortia "About Us" web pages is provided in Table 61.
Table 61: Members Motivation for Participation
Consortia
WiMAX Forum
GSM
Association
LSTI Forum
NGMN Alliance
Main Drivers for Participation
The forum is an exclusive WiMAX certification provider:
• The certification for standard compliance and
interoperability at the access level of the network is one
of the main reasons for membership
The association is an interoperability enabler:
• In the absence of industry standards regulating the
roaming data exchange between network operators the
GSMA working groups have developed the NRTRDE -
a method to monitor customer's activities in the visited
networks and quickly detect roaming fraud
Members and the consortia are setting the LTE/SAE
standards:
• The 3GPP standard and the LTE technology represent
one of the strongest constructs found for the LSTI
Forum and NGMN Alliance members
Members participate in technology trials to test for
interoperability:
• The early stages of interoperability are defined by
research and testing as the technology is not mature
and stable enough
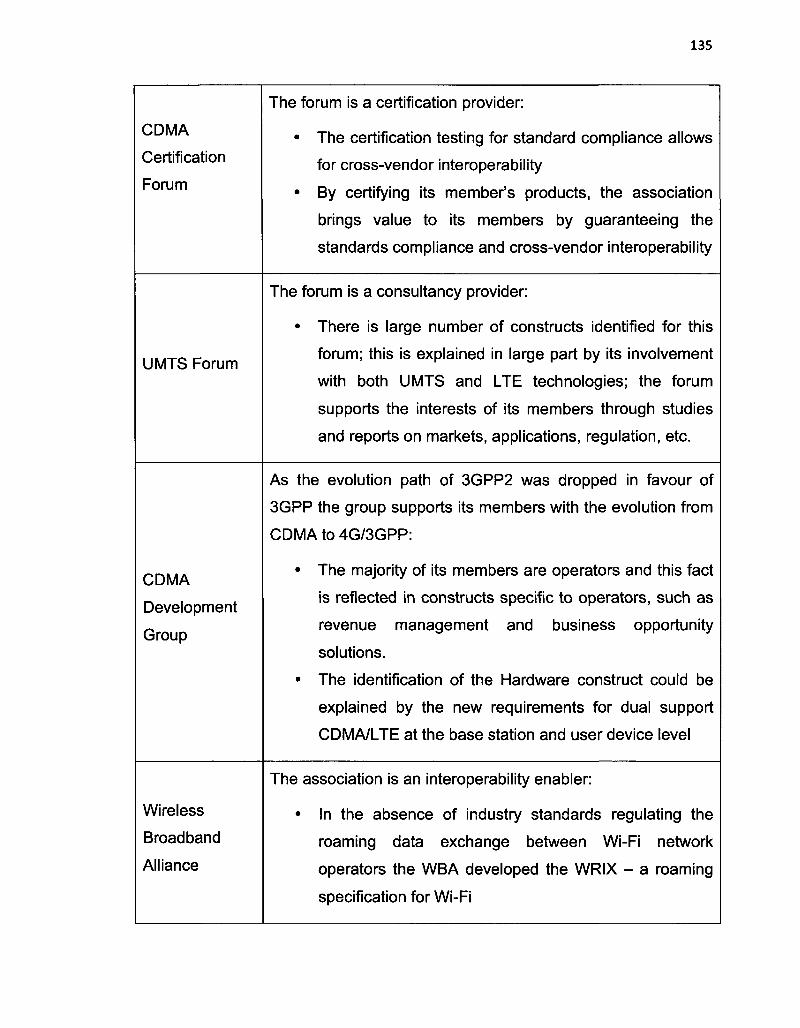
135
CDMA
Certification
Forum
UMTS Forum
CDMA
Development
Group
Wireless
Broadband
Alliance
The forum is a certification provider:
• The certification testing for standard compliance allows
for cross-vendor interoperability
• By certifying its member's products, the association
brings value to its members by guaranteeing the
standards compliance and cross-vendor interoperability
The forum is a consultancy provider:
• There is large number of constructs identified for this
forum; this is explained in large part by its involvement
with both UMTS and LTE technologies; the forum
supports the interests of its members through studies
and reports on markets, applications, regulation, etc.
As the evolution path of 3GPP2 was dropped in favour of
3GPP the group supports its members with the evolution from
CDMA to 4G/3GPP:
• The majority of its members are operators and this fact
is reflected in constructs specific to operators, such as
revenue management and business opportunity
solutions.
• The identification of the Hardware construct could be
explained by the new requirements for dual support
CDMA/LTE at the base station and user device level
The association is an interoperability enabler:
• In the absence of industry standards regulating the
roaming data exchange between Wi-Fi network
operators the WBA developed the WRIX - a roaming
specification for Wi-Fi

136
Open Patent
Alliance
The alliance's goal is to create an IPR licensing structure for
WiMAX
• Most of the members are also members of WiMAX
Forum
• The constructs identified in this study do not indicate a
focus on the IPR licensing
5.6 Phases of Development
The characteristics identified in Table 61 suggest several phases in the
development of consortia, as shown in Table 62.
Table 62: Consortia Phases of Development
Phase
1
2
Phase Name
Provide a platform for
discussion among
interested parties
Work with members
and standard bodies
in setting and
implementation of
standards
Phase Description
The industry consortia enable the
communication among member organizations
on how to enter into an agreement to
accomplish a common purpose
CDMA Certification Forum works with its
members to ensure the compliance to 3GPP2
standards. WiMAX Forum works with its
members to promote and support the 802.16
standard developed by IEEE. UMTS Forum,
LSTI Forum and NGMN Alliance work with
their members to ensure that their
recommendations are included in the
standards by the 3GPP organization

137
Enable the
interoperability of
members' products
WiMAX Forum enables interoperability at the
lower layers of the communication stack (e.g.
technology trials for cross-vendor
interoperability or certification for industry
acceptance). GSM Association show a strong
focus on interoperability at higher layers of the
communication stack (e.g. methodologies for
inter-operator roaming user data exchange)
This study provided a cross-sectional analysis of consortia that were created at
various points in time and suggests that these associations, forums and
alliances evolve over time to adapt to the new technologies and business
models of their members and cycle through phases 1, 2 and 3 as shown in
Figure 32.
Establish Member Communication
Standards Setting and
Implementation
Figure 32: Consortia Evolution Cycle

138
5.7 Insights Gained From Research
The following insights were gained from this research:
11: Product certification motivates organizations to join industry consortia
There is an identifiable niche for certification for standard compliance at the
access level of the network as indicated by the "Conformance and Certification"
construct in Table 30. WiMAX Forum has become de facto the exclusive
certification organization for base stations and user equipment for compliance to
the WiMAX standard37. Members use "WiMAX Forum Certified" logo on their
websites as a mark of compliance.
12: Interoperability of their products motivates organizations to join
industry consortia
The conformance certification of products at the access level of the wireless
network is based on the standards developed by 3GPP, 3GPP2 and IEEE
standard organizations and represents a mandatory requirement for cross-
vendor interoperability. With the advance of global mobility the network
operators have new requirements for roaming, user data exchange and fraud
detection. These characteristics were identified by the "Interoperability
Solutions" construct as shown in Table 23. In the absence of standards provided
by the standard organizations, consortia such as GSM Association and
http.//www.wimaxforumorg/certificahon/certification-ovcrview. last accessed July 30, 2010
139
Broadband Wireless Alliance have stepped in and provided platforms for
interoperability such as NRTRDE38 or WRIX39.
13: As technology matures the new interoperability requirements move up
in the network stack
If the layered model proposed by Fransman (2002) (see Section
2.1.3 The layered model) is used as a backdrop for mapping the salient
constructs of interoperability identified by insights 11 and 12, then it can be
suggested that as the technology evolves and matures, the new requirements
for product interoperability move up to the next layer in the wireless
communication network stack.
14: Organizations involved in legacy technologies are characterized by a
focus on optimization, services and cost reduction; organizations
involved in the new and developing technologies are focused on
standards, research, hardware, and testing
The most active organizations involved in the new and developing technologies
are the infrastructure providers and the device manufacturers. In time, as the
technology evolves, there is a drive for cost reduction for infrastructure
equipment and devices as indicated by the identified constructs in Table 60 and
Figure 27. As technologies, content, and offerings converge (Basole, 2009) the
ability to provide new, bundled services becomes more important.
http://www.gsmworld com/ncwsroom/press-releases/2069 htm, last accessed July 30, 2010 http //www.wballiance.net/index.html. last accessed July 30,2010

140
15: Service and billing providers form a critical segment in the wireless
industry
Traditionally, the infrastructure providers, device manufacturers, network
operators, application developers and content providers were regarded as the
main players in the industry. Some of the salient constructs, identified and
summarized in Section 5.4 The Emerging Role of Backend Systems, confirm the
observations in Basole (2009) that the service and billing providers occupy a
central position and play a critical role in the mobile ecosystem. These backend
systems enable operators to provision and price new, bundled services and
products.
16: The membership to wireless industry consortia provides an indication
of technology adoption
Based on the chronological comparison between the consortia's establishment
date and the technologies they support it can inferred that membership to more
than one association, forum or alliance can be used as an indicator for the
adoption of the technology supported by the later membership (see Section 5.3
Technology Adoption).
17: The hierarchical decomposition dissimilarity index is an indicator for
factor analysis solutions
As indicated in Table 7, the initial exploratory sub-sampling resulted in eight
sample groups (A, B, C, D, E, F, G, and H). The factor analysis results were
retained only for groups E, F, G, and H, as these groups provided more relevant

141
solutions. One observation is that the retained groups are characterized by
small values of the dissimilarity index. Although the intent was to create sub-
samples with higher degrees of similarity this observation is no hard-set rule and
more research is needed to validate this observation.
18: Non random sampling is recommended for content analysis
The results in this study show that the content analysis using factor reduction
depends significantly on the sample. This reinforces the recommendations from
Eisenhardt (1989, 2007) and Patton (1990) which highlight the
inappropriateness of random sampling. This approach is particularly relevant in
this study as its goal was to uncover as many and diverse constructs as
possible and this was possible by creating sub-samples with higher similarity.
Summary
The results of this research identified the following points of difference for the
associations, forums and alliances in the consortia studied:
• Supporters of legacy technologies are characterized by a focus on
optimization, services and cost reduction. This is the case for GSM
Association, CDMA Development Group and in part UMTS Forum.
• Supporters of newer technologies are characterized by a focus on
standards, research, hardware, and testing. This is the case for WiMAX
Forum, NGMN Alliance, LSTI Forum, and in part UMTS Forum.
• Member's motivation to participate is driven by two constructs: certification
and interoperability. WiMAX Forum, CDMA Certification Forum and Open

142
Patent Alliance are more active in certification. The interoperability is a focus
area for GSM Association, CDMA Development Group, Wireless Broadband
Alliance, and LSTI Forum.
• Multiple memberships combined with technology focus provide an indication
of technology adoption:
o CDMA technology supporters also support GSM, UMTS, WiMAX and
LTE technologies
o LTE technology supporters also support GSM, CDMA, UMTS and
WiMAX technologies
o WiMAX technology supporters support LTE technology only, which
suggests a large number of new market entrants
5.8 Recommendations for Keystone Organizations
Based on the research insights (see Section 5.7 Insights Gained From
Research) and the identified constructs for the wireless industry consortia (see
Section 4.5 Constructs) the following recommendations can be inferred for non
profit organizations that play a keystone role:
Table 63: Recommendations for Keystone Organizations
1
2
Get involved in the
early stages of
technology
Act as an enabler of
• Attract members by supporting their
recommendations to the standards bodies
• Work with members and standards bodies in
setting and implementation of standards
• Provide a solutions for member's cross-

143
3
4
interoperability for
members products
and services
Prepare to move up
the interoperability
stack as technology
matures
Identify the most
active members at
each stage in the
technology evolution
and support their
interests
vendor interoperability needs such as
certification services (see Section 5.7,11)
• Provide platforms of interoperability if no
standards are available (e.g. NRTRDE and
WRIX roaming platforms identified in Section
5.7,12)
• As the technology matures a keystone should
prepare the ground for the next interoperability
needs (e.g. WiMAX Forum, which is focused
on certification, launched its roaming
guidelines and specifications under a new
brand name, WiMAX Roaming, and a new
website40)
• In the early stages of a technology the most
active members are the infrastructure
equipment providers and device
manufacturers. Later on, as the network
operators and service providers become the
most active members they depend more and
more on the service and billing providers (see
Section 5.7,15)
http.//www.wimaxroammg org/, last accessed August 12, 2010

144
6. Conclusions
This chapter is organized into three sections. The first section provides the
conclusions of this research. The second section provides the limitations of this
research. The third section provides opportunities for future research.
6.1 Conclusions
The objective of this research was to examine the points of difference for
members of associations, forums or alliances operating in the wireless industry.
An organization' membership to an association, forum or alliance was used to
classify the organization as a stakeholder in the standard and technologies
supported by the consortium the organization is a member of. The introduction
of the POD Index, as an instrument of comparison for consortia, allowed for the
identification of differences amongst the associations, forums and alliances.
This approach was validated by the fact that the relatively high value for the
POD Index for standards and technologies constructs identified for a consortium
matches the standard and technology openly supported by that consortium, as
shown by Consortia Brand Names construct.
The points-of-difference (POD) - defined as groups of constructs - was used to
create a mapping of consortia's objectives to constructs identified from
consortia's members. The mapping of the 9 associations, forums and alliances
resulted in three types of links between constructs and objectives:

145
1. Strong support: there is a good mapping between the points-of-difference
identified and the consortia's objective for WiMAX Forum, and CDMA
Certification Forum.
2. Definitional role: the identified POD provide suggestions for what the
consortia's objective means, and identify how the consortia brings value
to its members. This is characteristic for consortia with vague and
general objectives as shown in the case of: GSM Association, CDMA
Development Group, UMTS Forum, LSTI Forum, NGMN Alliance, and
Wireless Broadband Alliance.
3. Weak support: There is a poor mapping between the points-of-difference
identified and the consortia's objective for Open Patent Alliance.
Another contribution made by this research was in identifying an opportunity on
how to enhance the use of factor analysis from a technique of dimension
reduction to a methodology of searching for construct diversity. In the research
process the following methodology steps were identified:
1. A priori classification: the initial classification of organizations, based on
the memberships to wireless industry consortia, helped identify which
organizations support what standards and technologies. This a priori
classification allows for constructs comparison between consortia.
2. Sub-sampling: using hierarchical decomposition, several homogenous
sub-samples were identified. The non-probability sampling methodology
created more similar samples on which factor analysis identified factors
that would not be found otherwise in a random sample.

146
3. Constructs identification: similar factors from the sub-samples are
grouped together to define a construct.
4. Points of difference: the salient constructs indicate the relative
importance of a construct for a consortium and are used for comparisons
to other consortia.
The techniques for analyzing the industries and competitors proposed by Porter
(2004) provide a view from an organization's level. By comparison, this
research provides an analysis of an industry by comparing the differentiating
points of its consortia.
To the best of my knowledge, this is the first study that uses this methodology.
The use of sub-samples created using hierarchical decomposition and multiple
factor analysis provides an approach that allows the identification of as many
and diverse factors as possible. The non probability sampling approach is
instrumental in the mapping of the wireless industry consortia.
A key finding made by this research was the identification of constructs that are
specific to legacy or newer technologies. Based on consortia's establishment
date and involvement with the respective technologies it was identified that:
1. Legacy technologies (GSM, CDMA): are characterized by constructs
indicating a focus on optimization, services and cost reduction
2. Evolution technologies (WiMAX, LTE): are characterized by constructs
indicating a focus on standards, research, hardware and testing

147
The results from the analysis of the organizations with multiple membership to
consortia helped in identifying the trajectories of technological adoption. From
the technologies and standards analyzed, CDMA/3GPP2, WiMAX/IEEE and
LTE/3GPP, only WiMAX does not show a strong indication of adoption from the
legacy standards. This could be an indication that the introduction of WiMAX
allowed more new comers to enter the market. By comparison, CDMA, even
though it is specified by the 3GPP2 standards, indicates strong adoption to
3GPP evolution standards, and thus supports the idea of LTE as the
convergence technology (Saini, 2009).
Another key finding is that membership to consortia is driven by two main goals:
certification and interoperability. Consortia's keystone organizations step in to
provide platforms for interoperability in the absence of standards.
6.2 Limitations
The research has at least three limitations:
• In general factor analysis requires that researchers have a good knowledge
of the domain. A deep understanding of the wireless industry was required to
conduct this research and as a result measuring the consistency is difficult.
• Factor analysis is a relatively subjective and especially so when used in
conjunction with content analysis. The solutions identified in this research
are based on my interpretation of the keywords and their meaning when
grouped together and represent no hard-set rule for meaning.

148
• The points-of-difference approach used in this research uses only those
constructs that are significantly stronger, at the expense of the rest.
6.3 Future Research
This research identifies four opportunities for future research:
• Measure the competition between ecosystems by identifying and comparing
their differentiating points using the methodology provided in this research.
• The results from this research can be enhanced by identifying each
organization type (network operator, infrastructure provider, device
manufacturer, application provider, content provider, service provider, etc.).
This additional information could shed more light into to which organizations
are the first technology adopters and whether the salient constructs identified
are more prevalent to certain types of organizations.
• Identify which organizations have multiple memberships and what is their
motivation. Are the multiple memberships specific to certain types of
companies?
• Enhance to mapping methodology and possibly automate it. This would
allow periodic evaluations of the industry over time and shed more light into
technology adoption and how the identified constructs evolve.

149
7. References
Allen, S. (2009). An empirical study of the components of value co-creation, Master Thesis, Technology Innovation Management, Carleton University, Ottawa, Ontario
Anderson, J.C, Narus, J.A., van Rossum, W. (2006). Customer value propositions in business markets, Harvard Business Review, March
Bailetti, A. and Callahan, J. (1995). Managing consistency between product development and public standards evolution, Research Policy, 24: 913-931
Balaji, T.S., Landers, B., Kates, J. and Moritz, B. (2005). A Carrier's Perspective on Creating a Mobile Multimedia Service, Communications of the ACM, 48(7): 49-53
Baldwin, C. Y. (2007). Modularity, Transactions, and the Boundaries of Firms: A Synthesis, Paper presented at the Ross School of Business Strategy Seminar, University of Michigan, Ann Arbor, Ml, September
Barney, J. D. and R. E. Hoskisson (1990). Strategic groups: Untested assertions and research proposals, Managerial and Decision Economics, 11: 187-198
Basole R.C. (2009). Visualization of inter-firm relations in a converging mobile ecosystem, Journal of Information Technology, 24: 144-159
Bauer J.M. (2010). Regulation, public policy, and investment in communications infrastructure, Telecommunication Policy, 34: 65-79
Becker, M. (2005). Unfolding of the Mobile Marketing Ecosystem: A growing strategic network, http://mmaqlobal.com/?q=node/737
Bekkers, R. and Martinelli, A. (2010). The interplay between standardization and technological change: a study on wireless technologies, technological trajectories, and essential patent claims, Conference on Opening Up Innovation: Strategy, Organization and Technology, London, June 16 -18
Blind K., Gauch S. and Hawkins R. (2010). How the stakeholders view the impacts of international ICT standards, Telecommunication Policy, 34: 162-174
Brusoni, S. and Prencipe, A. (2001). Unpacking the black box of modularity: technology, product, and organization, Industrial and Corporate Change, Vol. 21, No. 1
Caldarelli, G. (2007). Scale-free networks, Oxford University Press

150
Chesbrough, H. (2003). Open Innovation: the new imperative for creating and profiting from innovation, Harvard Business Press
Chesbrough, H. and Prencipe, A. (2008). Networks of innovation and modularity: a dynamic perspective, International Journal of Technology Management, Vol. 42, No. 4, 414-425
Carlile, R. and Christensen, CM. (2005). The cycles of theory building in management research, Research Paper, Version 6.0
Costello, A. B. and Osborne, J.W. (2005). Best practices in exploratory factor analysis: four recommendations for getting the most from your analysis, Practical Assessment Research and Evaluation, 10(7)
Coursaris, C , Hassanein, K. and Head, M. (2006). Mobile Technologies and the Value Chain: Participants, activities and value creation, International Conference on Mobile Business, Copenhagen, Denmark: IEEE, 8-18
Darlington, R. 2010. Factor Analysis. Last Accessed: July 2010. Available at: http://www.psych.cornell.edu/Darlington/factor.htm
Dargan, P. A. (2005). Open Systems and Standards for Software Product Development, Artech House Computing Library
de Nooy, W., Mrvar A. and Batagelj V. (2005). Exploratory Social Network Analysis with Pajek, Cambridge University Press
Deng, S. and Dart, J. (1994). Measuring market orientation: A multi-factor, multi-item approach, Journal of Marketing Management, Volume 10, Issue 8, 725-742
Dittrich, K. and Duysters, G. (2007). Networking as a Means to Strategy Change: The case of open innovation in mobile telephony, Journal of Product Innovation Management, 24(6): 510-521
Eisenhardt, K. M. (1989). Building theories from Case study research, Academy of Management Review, Vol.14, No.4, 532-550
Eisenhardt, K.M., Graebner, M.E. (2007). Theory building from cases: opportunity and challenges, Academy of Management Journal, 50(1), 25-32
Farrell, Winslow (2000). How hits happen, Texere Publishing, London

151
Ferrier, W. (2001). Navigating the Competitive Landscape: The Drivers and Consequences of Competitive Aggressiveness, Academy of Management Journal, 44(4): 858-877
Field, A. (2005). Discovering Statistics Using SPSS, Thousand Oaks, CA, Sage Publications
Fine, Charles H. (1998). Clock speed: Winning Industry Control in the Age of Temporary Advantage, Perseus Books
Fransman, Martin (2002). Mapping the evolving telecoms industry: the uses and shortcomings of the layer model, Telecommunications Policy, 26: 473-483
Fransman Martin (2007). The new ICT Ecosystem: Implications for Policy and Regulation, Cambridge University Press
Freeman, C. (1991). Networks of innovators: a synthesis of research issues, Research Policy, Vol. 20, No. 5, 499-514
Gemser G., Leenders M. and Wijnberg N. (1996). The Dynamics of Inter-firm Networks in the Course of the Industry Life Cycle: The Role of Appropriability, Technology Analysis and Strategic Management, Vol. 8, No. 4, 459-454
Gloor, P., Paasvaara, M., Schoder, D. and Willems, P. (2007). Finding Collaborative Innovation Networks Through Correlating Performance With Social Network Structure, Journal of Production Research, Taylor and Francis, April
Heldal, F., Sjovold, E., Heldal, A.F. (2004). Success on the Internet - optimizing relationships through the corporate site, International Journal of Information Management, Volume 24, Issue 2, April, 115-129
Hemphill Thomas (2009). Technology standards-setting in the US wireless telecommunications industry: A study of three generation of digital standards development, Telematics and Informatics, 26:103-124
Hicks, D.M., Libaers, D.P., Porter, A.L., Schoeneck, D.J. (2007). Identification of the technology commercialization strategies of high-tech small firms, Small Business Research Summary, December. Available at http://www.sba.gov/advo/research/rs289tot.pdf
Hite, J.M. and Hesterly, W.S. (2001). The evolution of firm networks: from emergence to early growth of the firm, Strategic Management Journal, Vol. 22, No. 3, 275-286

152
lansiti, M. and Levien, R. (2004a). The Keystone Advantage: What new dynamics of business ecosystems mean for strategy, innovation, and sustainability, Boston, MA, Harvard Business School Press
lansiti, M. and Levien, R. (2004b). Strategy as Ecology, Harvard Business Review 82(3): 68-78
Insch, A. (2008). Online communication of Corporate Environmental Citizenship: A study of New Zealand's electricity and gas retailers, Journal of Marketing Communications, 14(2): 139-153
Iyer B., Lee C. and Venkatraman N. (2006). Managing in a "Small World Ecosystem": Lessons from the Software Sector, California Management Review, 48(3): 28-47
Kazi, K. (2006). Optical Networking Standards: A Comprehensive Guide for Professionals
Keil T. (2002). De-facto standardization through alliances - lessons from Bluetooth, Telecommunication Policy, 26, Issues 3-4, 205-213
Ketchen, D. J. and Shook, C. L. (1996). The application of cluster analysis in strategic management research: an analysis and critique, Strategic Management Journal, Vol. 17, 441-458
Kim H. J., Weiss M.B.H., Morel B. (2009). Real options and technology management: Assessing technology migration in wireless industry, Telematics and Informatics, 26: 180-192
Kodama, Mitsuru (2002). Transforming an old economy company into a new economy success: the case of NTT DoCoMo, Leadership and Organization Development Journal, 23/1, 26-29
Kothandaraman, P. and Wilson, D. T. (2001). The Future of Competition: Value-Creating Networks, Industrial Marketing Management, 30: 379-389
Koza, M. P. and Lewin, A. Y. (1998). The Co-evolution of Strategic Alliances. Organization Science, Vol. 9, No. 3, May-June
Langlois, R. (2002). Modularity in technology and organization, Journal of Economic Behaviour and Organization, 49:19-37
Langlois, R. and Robertson, P. (1992). Networks and innovation in a modular system: Lessons from the microcomputer and stereo component industries, Research Policy, 21: 297-313

153
Leiponen, A. and Bar, T. (2008). Collaboration and networking in cooperative standard setting, Conference on Entrepreneurship and Innovation -Organizations, Institutions, Systems and Regions. Copenhagen, Denmark, June 1 7 - 2 0
Leiponen, A. (2008). Competing Through Cooperation: The Organization of Standard Setting in Wireless Telecommunications, Management Science, Vol. 54, Issue 11, 1904-1919
Lombardi, S. (2009). Interactions between Eclipse Foundation Members and Eclipse Projects, Master Thesis, Technology Innovation Management, Carleton University, Ottawa, Ontario
Madey, G., Freeh, V., Tynan, R. (2002). The open source software development phenomenon: an analysis based on social network theory, AMCIS Proceedings, Paper 247
Maitland, Bauer and Westerveld (2002). The European market for mobile data: evolving value chains and industry structure, Telecommunications Policy, 26: 485-504
McGinnis, G. (2008). Competitive actions of companies whose revenue relies on open source software, Master's Thesis, Technology Innovation Management, Carleton University, Ottawa, Ontario
McMillan, S. (2000). The microscope and the moving target: The challenge of applying content analysis to the world wide web, Journalism and Mass Communication Quarterly, 77(1): 80-98
Meyer, A. D., Tsui, A. S. and Hinings, C. R. (1993). Configurational approaches to organizational analysis, Academy of Management Journal, 36: 1175-1195
Miller, D. and Mintzberg, H. (1983). The case for configuration, Sage, Beverly Hills, CA, 57-73
Moore, J. F. (1993). Predators and Prey: A New Ecology of Competition, Harvard Business Review, May-June
Moore, J.F. (1996). The Death of Competition: Leadership and strategy in the age of business ecosystems, HarperCollins, New York
Moore, J. F. (2006). Business ecosystem and the view from the firm, Antitrust Bulletin, Vol. 51, No. 1

154
Neuman, W. L. (2003). Social Research Methods: Qualitative and Quantitative approaches, Allyn and Bacon, Boston, 5th Ed.
Newman, M.E.J. (2001). The structure of scientific collaboration networks, Proceedings of the National Academy of Science (USA), 98, 404-409
Oliver A., (2001). Strategic Alliances and the learning life-cycle of biotechnological firms, Organization Studies, 22/3, 467-489
Opoku, R. (2005). Communication of Brand Personality by Some Top Business Schools Online, Licentiate Thesis, Lulea University of Technology, ISSN: 1402-1757
Orsenigo L, Pammolli F. and Riccaboni M. (2001). Technological change and network dynamics - Lessons from the pharmaceutical industry, Research Policy, 30: 485-508
Pagani M. and Fine C.H. (2008). Value network dynamics in 3G-4G wireless communications: A systems thinking approach to strategic value assessment, Journal of Business Research, 61: 1102-1112
Patton, M. Q. (1990). Qualitative Evaluation and Research Methods, Sage, Newbury Park, CA, 2nd Ed.
Peltoniemi M. (2006). Preliminary theoretical framework for the study of business ecosystems, ECO, Vol. 8, No. 1, 10-19
Peppard, J. and Rylander, A. (2006). From Value Chain to Value Network: Insights for mobile operators, European Management Journal, 24(2-3): 128-141
Perry, M. and Bodkin, C. (2000). Content analysis of 100 company Web sites. Corporate Communications: An International Journal, 5(2):87-97
Podolny, J. M. (2005). Status Signals: A Sociological Study of Market Competition, Princeton University Press
Pollach, I. (2005). Corporate self-presentation on the WWW: Strategies for enhancing usability, credibility and utility, Corporate Communications: An International Journal, 10(4): 285-301
Porter, Michael (1985). Competitive Advantage: Creating and Sustaining Superior Performance, New York: The Free Press

155
Porter, Michael (2004). Competitive Strategy: Techniques for Analyzing Industries and Competitors, The Free Press
Porter, A., Schoeneck, D., Frey, P., Hicks, D. and Libaers, D. (2007). Mining the Internet for Competitive Technical Intelligence, Competitive Intelligence Magazine, 10(5): 24-28
Reinard, J. (2006). Communication Research Statistics, Thousand Oaks, CA, Sage Publications
Sabat H. K. (2002). The evolving mobile wireless value chain and market structure, Telecommunication Policy, 26: 505-535
Saini, G. (2009). Examining the 4G mobile standard convergence to the LTE standard, Master Thesis, Technology Innovation Management, Carleton University, Ottawa, Ontario
Sanchez, R. and Mahoney, J. (1996). Modularity, flexibility, and knowledge management in product and organization design, Strategic Management Journal, Vol. 17, Winter Special Issue, 63-76
Schilling, M., and Steensma, K. H. (2001). The use of modular organizational forms: An industry-level analysis, Academy of Management Journal, 44(6): 1149-1168
Steinbock D. (2003). Globalization of wireless value system: from geographic to strategic advantages, Telecommunication Policy, 27: 207-235
Stevens, J.P. (2009). Applied Multivariate Statistics for the Social Sciences, New York, NY, Routledge
Teo, S. (2002). Market entry strategies of wireless start-ups, Master Thesis, Lappeenranta University of Technology, Finland
Thomas, H. and Venkatraman, N. (1988). Research on strategic groups: Progress and Prognosis, Journal of Management Studies, 25: 537-555
Tilson, D. and Lyytinen, K. (2005). Making Broadband Wireless Services: An actor-network study of the US wireless industry standard adoption, Sprouts: Working Papers on Information Environments, Systems and Organizations, 5(3): 137-154
Tilson, D. and Lyytinen, K. (2006). The 3G Transition: Changes in the US wireless industry, Telecommunications Policy, 30(10-11): 569-586

156
Vesa, J. (2003). The impact of industry structure, product architecture, and ecosystem on the success of mobile data services: a comparison between European and Japanese markets, Presented at ITS 14th European Regional Conference, Helsinki, Finland, August 23 - 24
Watts, D. (1999). Small Worlds, Princeton University Press, Princeton
Young D.L. (1980). Telecommunications as ecosystem: An Australian case study. Telecommunications Policy, Volume 4, Issue 3, September, 183-207
7.1 Web Based Sources
Keyword Search and Analysis Tool (KSAT): http://qithub.com/mwnorman/KSAT
SPSS Statistics: http://www.spss.com/
CDMA Certification Forum: http://www.qlobalccf.org
CDMA Development Group: http://www.cdq.org
GSM Association: http://www.qsmworld.com
LSTI Forum: http://www.lstiforum.org
Next Generation Mobile Networks Alliance: http://www.ngmn.org
Open Patent Alliance: http://openpatentalliance.com
Pajek: http://paiek.imfm.si/doku.php
UMTS Forum: http://www.umts-forum.org
WiMAX Forum: http://www.wimaxforum.org
Wireless Broadband Alliance: http://www.wballiance.net

157
8. Appendix
Appendix A: URLs, Samples and Membership
URL http //accuns-networks com/ http //authentec com/ http //www axxcelera com/ http //cellatsea com http //colibna com/ http //en bnqroup com/ http //en enforta ru/ http //qlobal mitsubishielectric co m/ htto //mobihcitv ca/ http //openpatentalhance com/ http //Panasonic net/ http //redknee com/ http //roamsvs com http //tatacommumcations com/ http //us funtsu com/ htto //us zvxel com/ http //w3 tue nl http //wateentel com/ http //ww2 cox com/ http //www 2deqreesmobi!e co nz htto //www 7lavers com/ http //www aa-tec com http //www accenture com/ http //www accuns-networks com/ htto //www acer com/ htto //www acision com/ htto //www acmeoacket com/ http //www actix com/ http //www adaptivemobile com/ http //www adecef com/ http //www adt com tw/ http //www advantest co 10/ http //www aeroflex com/ http //www aeronix com/ http //www aervox com/ http //www afdtech com/ http //www aailent com/ http //www aailismternational co m/ http //www ahciet net http //www aheadcommunication com
X 1 1 2 1 1 3 3
1 3 3 2 3 2 2 1 1 3 3 3 2 1 3 1
1 1 3 3 1 1 3 2 3 3 2 2 2 1
3 1
3
Y 1 2 1 2 1 3 2
1 3 2 2 2
3 1 1 1 2 4 2 3 1 4 1
1 2 2 2 2 3 2 2 4 1 2 3 3 1
3 2
3
A 1 1 2 5 1 2 2
2 1 9 2 1 1 1 2 2 4 2 5 1 2 1 2
52 92 1 1 4 1 1 2 2 62 2 1 1 3
1 5
2
URL http //www aicent net/ http //www aircell com/ http //www aircomintemational co ml http //www airvana com/ http //www airwalkcom com/ http //www airwidesolutions com http //www aksoran kz http //www alaska-wireless com/ http //www albentia com/
http //www alcatel-lucent com http //www aleqro com ec http //www alepo com/ http //www ahanza com/ http //www allround net http //www alltel com http //www altair-semi com/ http //www altobndqe com http //www alvanon com/ http //www amdocs com/ http //www amdtelecom net/ http //www amencanroamer com http //www amerilinkwireless com / htto //www anacom ot http //www animatele com/ http //www anite com/ htto //www anvdata com/ http //www apacewave com/ http //www aptilo com/ http //www arabtel net/ http //www aradial com/ htto //www arbinet com http //www arcadvan com/ http //www archclearmq com http //www anstaenterprise com http //www araiva com/ http //www arravcomm com/ http //www aselsan com tr/ http //www astac net/ http //www astelha com/ http //www astn orq/ http //www at4wireless com/
X 2 1
2 3 3 2 4 3 3
2 4 2 2 2 3 3 3 3 1 3 3
3 3 4 2 2 3 1 4 3 3 4 4 3 1 2 2 3 2 2 1
Y 1 1
1 1 2 1 4 4 3
1 4 1 3 2 3 2 3 3 1 3 3
3 2 4 1 3 2 3 4 3 4 4 4 3 2 1 2 3 3 2 2
A 52 5
4 5 5 1 2 1 2
564 23 5 2 2 1 1 2 1
92 2 1 2
1 7 1 2 56 2 2 2 2 1 2 1 6 2 2 2 1 1 2 2

158
URL http //www atdi com/ http //www atheeb com/ http //www att com/ http //www auqereholdings com http //www avea com tr/ http //www awardsolutions com/ http //www awbnetworks com/ http //www axesstel com/ http //www axisnt com/ http //www avlus com http //www azimuthsvstems com/ http //www babilon-t ti/ http //www baknetelecom com/ http //www bassetlabs com http //www batelco com/ http //www bavan com ph/ http //www beceem com/ http //www belqacom-ics com/ http //www belizetelemedia net/ http //www bell ca
http //www bellmobihtv ca http //www bendbroadband com http //www bharti com/ http //www bilhnq ru http //www bksv com/ http //www bndqewatersvstems c om/ http //www broadcom com/ http //www broadhoo com/ http //www broadpomtinc com http //www bsnl co in/ http //www bt com http //www btc bw/ http //www btopenzone com/ http //www caci com http //www calcomo com tw http //www caprock-SDur com/ http //www cardboardfish com/ http //www catr en http //www cbnl com/ http //www ccsemc com/ http //www cctwireless com/ http //www 5 orq/ http //www cdot co in/ http //www cedicom ru/ http //www celestica com/ http //www cellc co za http //www cellcom com/ http //www celloneet com/ http //www cellonenation com/
X 4 2 2 3 3 3 3 3 3 3 3 4 3 3 3 3 4 3 2 2 2 1 2 3 2
3 3 2 3 2 3 2 3 3 4 3 3 3 3 2 3 2 1 1 2 1 1 2 2
Y 4 3 2 3 4 2 3 2 2 2 2 0 4 3 4 4 2 2 3 2 1 2 3 3 1
1 1 2 3 2 2 2 3 3 4 4 3 1 2 2 3 1 2 1 2 3 1 1 1
A 2 2
42 2 7 2 2 56 2 1 3 2
5 1 7 5
92 1 5
421 5 1 2 1 6
1 1 2 1 2 2 2 8 2
6 1 1 6 4 2 5 5 1 2 2 1 5 1 1
URL http //www cellularl net/ http //www cellularone bm/ http //www cellularoneonline com / http //www cellularone-slo com/ http //www celplan com/ http //www centennialpr com/ http //www ceriaku com http //www cenlhon com/ http //www cetecomusa com/ http //www cewit orq in http //www cqctw com http //www cherrvpio com http //www chinamobile com/en/ http //www chinatelecom com en/ http //www chinaunicom com/ http //www chinawllc com http //www cht com tw/ http //www chuanwei com kh/ http //www cieluxtelecom com/ http //www ciena com/ http //www cincinnatibell com/ http //www cintenon com http //www Cisco com/ http //www citic1616 com http //www citvcell com/ http //www clearwire com/ http //www chckatell com/ http //www cloudmark com http //www cmotech com/ http //www coai com http //www comarch com/ http //www comarco com/ http //www comcast com http //www comfone com/ http //www commnetwireless co m/ http //www communoloqv com/ http //www comneon com/ http //www compnon com/ http //www comptel com/ http //www comreq ie/ http //www comsourceinc net/ http //www comstar ru/ http //www comsvsmobile com/ http //www comtec eecs uni-kassel de/ http //www comunicazioni it http //www comverse com/ http //www comviva com/
X 3 2
2 3 1 1 4 1 2 1 4 3 1 4 2 4 1 2 3 2 2 3 1 2 2 1 2 1 3 2 1 2 1 1
3 1 3 1 1 1 4 1 1
1 3 1 1
Y 2 3
3 4 2 1 4 1 2 2
3 2 1 4 3 4 2 2 4 1 1 2 1 3 3 1 1 2 3 1 1 3 1 2
3 1 1 2 1 2 2 2 1
2 3 1
1
A 1 5
1 1 2 5 5 1 2 2 6 2
43 52 2 6 2 2 2 2 1 1
923 51 5 92 1 1 2 7 1 2 2 1
1 4 1 6 1 7 1 2 2
4 7 7 1
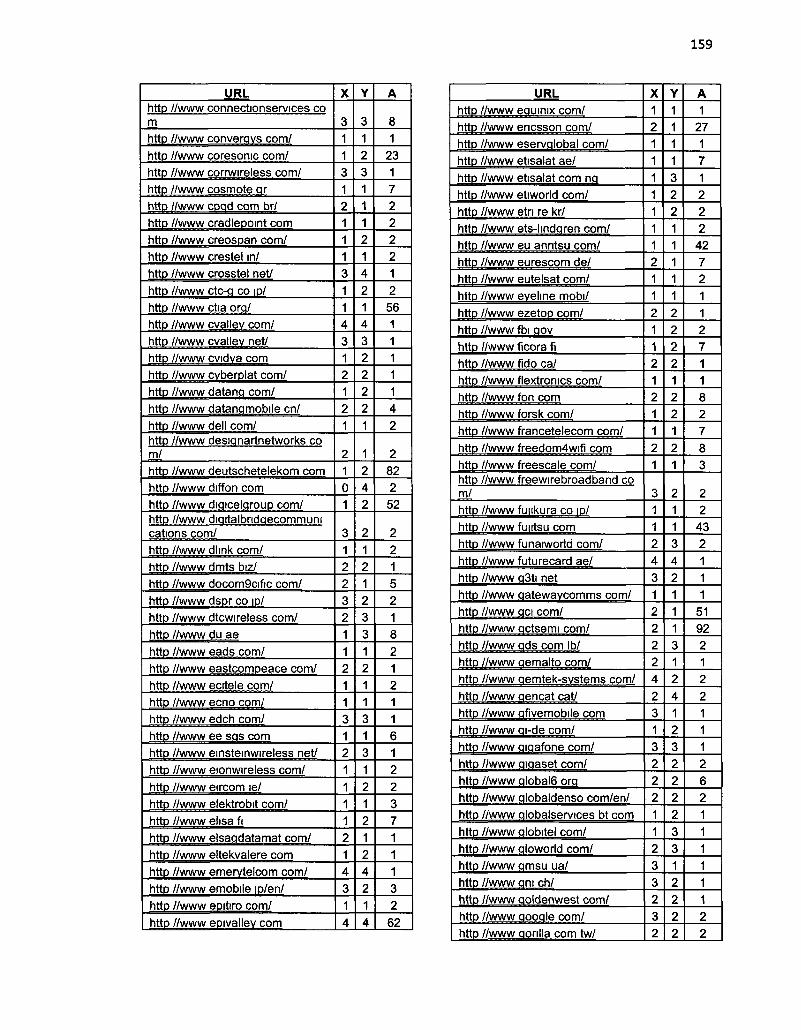
159
URL http //www connectionservices co m http //www converavs com/ http //www coresonic com/ http //www corrwireless com/ http //www cosmote ar htto //www cpqd com br/ http //www cradlepomt com http //www creosoan com/ http //www crestel in/ http //www crosstel net/ http //www ctc-q co IP/ http //www ctia orq/ http //www cvallev com/ http //www cvallev net/ http //www cvidva com http //www cvberplat com/ http //www datanq com/ http //www datanqmobile en/ http //www dell com/ http //www desiqnartnetworks co m/ http //www deutschetelekom com http //www diffon com http //www diqicelqroup com/ http //www diqitalbndqecommuni cations com/ http //www dhnk com/ http //www dmts biz/ http //www docom9cific com/ http //www dspr co IP/ http //www dtcwireless com/ http //www du ae http //www eads com/ http //www eastcompeace com/ http //www ecitele com/ http //www ecrio com/ http //www edch com/ http //www ee sqs com http //www einsteinwireless net/ http //www eionwireless com/ http //www eircom ie/ http //www elektrobit com/ http //www ehsa fi http //www elsaqdatamat com/ http //www eltekvalere com http //www emervtelcom com/ http //www emobile io/en/ http //www epitiro com/
http //www epivallev com
X
3 1 1 3 1 2 1 1 1 3 1 1 4 3 1 2 1 2 1
2 1 0 1
3 1 2 2 3 2 1 1 2 1 1 3 1 2 1 1 1 1 2 1 4 3 1 4
Y
3 1 2 3 1 1 1 2 1 4 2 1 4 3 2 2 2 2 1
1 2 4 2
2 1 2 1 2 3 3 1 2 1 1 3 1 3 1 2 1 2 1 2 4 2 1 4
A
8 1
23 1 7 2 2 2 2 1 2 56
4 2
2 82 2 52
2 2 1 5 2 1 8 2 1 2 1 1 6 1 2 2 3 7 1 1 1 3 2 62
URL htto //www equinix com/ htto //www encsson com/ htto //www eservqlobal com/ http //www etisalat ae/ http //www etisalat com nq htto //www etiworld com/ htto //www etn re kr/ http //www ets-hndqren com/ http //www eu anntsu com/ http //www eurescom de/ htto //www eutelsat com/ htto //www evelme mobi/ http //www ezetop com/ http //www fbi qov htto //www ficora fi http //www fido ca/ http //www flextronics com/ http //www fon com htto //www forsk com/ http //www francetelecom com/ http //www freedom4wifi com htto //www freescale com/ http //www freewirebroadband co ml htto //www funkura co io/ http //www funtsu com http //www funaiworld com/ htto //www futurecard ae/ http //www q3ti net http //www qatewavcomms com/ http //www qci com/ htto //www qctsemi com/ http //www qds com lb/ htto //www oemalto com/ http //www qemtek-svstems com/ htto //www qencat cat/ http //www qfivemobile com httD //www qi-de com/ httD //www qiqafone com/ http //www oiqaset com/ http //www qlobal6 ora httD //www qlobaldenso com/en/ htto //www alobalservices bt com htto //www qlobitel com/ http //www oloworld com/ httD //www qmsu ua/ http //www qni ch/ httD //www ooldenwest com/ httD //www oooole com/ httD //www qonlla com tw/
X 1 2
2
2
2
2
2
3
2 4 3 1 2 2 2 2 4 2 3 1 3 2 2 2 1 1 2 3 3 2 3 2
Y 1 1 1 1 3 2 2 1 1 1 1 1 2 2 2 2 1 2 2 1 2 1
2 1 1 3 4 2 1 1 1 3 1 2 4 1 2 3 2 2 2 2 3 3 1 2 2 2 2
A 1
27 1 7 1 2 2 2
42 7 2 1 1 2 7 1 1 8 2 7 8 3
2 2
43 2 1 1 1
51 92 2 1 2 2 1 1 1 2 6 2 1 1 1 1 1 1 2 2

160
URL http //www aotransverse com/ http //www aopm de http //www areenflvamenca com/ http //www areenpacket com http //www arid-net com/ http //www atlhmited com/ http //www quzik com/ http //www avsvstem com http //www haiertele com/ http //www hams com/ http //www hamsstratex com/ http //www hchnfinet com/ http //www hfclconnect com/ http //www hitachi com/ http //www hitachi-cta com/ http //www hkcsl com http //www hotspot ne IP http //www htc com http //www huawei com/ http //www hutch co th http //www lac com tw/ http //www ibasis com/ http //www icerasemi com/ http //www icewireless ca/ http //www idatech com/ http //www ideacellular com/ http //www idt net/ http //www HI orq tw/ http //www immix com/ http //www indosat com/ http //www indosatm2 com http //www Industrie qouv fr/ http //www infobip com http //www infobratn com/ http //www infodirections com/ http //www infomark co kr/ http //www informatm com/ http //www inn9th com/ http //www innowireless co kr/ http //www m-sprit com/ http //www intecbillmq com/ http //www mtel com/ http //www interbro net/ http //www interdiqital com/ http //www interoptechnoloqies c om http //www interoptechnoloqies c om/en/ http //www intertek-etlsemko com http //www intracom-telecom com
X 2 2 3 1 3 1 3 4 3 2 2 2 1 1 1 1 3 2 1 3 1 1 1 3 2 1 2 2 3 2 3 1 3 3 1 4 1 2 4 2 1 1 0 2
1
1 1 1
Y 2 3 1 2 1 3 4 4 1 1 2 3 1 3 1 3 2 1 3 2 1 1 3 2 1 2 2 1 1 3 1 3 3 2 4 1 1 3 2 1 1 4 1 1
1
2 1 1
A 1 7 1 2 2 2 2 2 6 2 2 2 2
42 5 8 8 52 567 5 2 1
41 1 1 2 2 2 1
52 82 7 51 1 1 2 2 21 2 2 1
921 2 1
5
1 6 2
URL http //www ipass com http //www ipaxiom com/ http //www iDcomsa com http //www ipfabrics com/ http //www inshbroadband ie/ http //www inswireless com/ http //www isb co IP/ http //www iskratel com/ http //www itisaluna com/ http //www itn orq tw http //www its ws/ http //www wireless com/ http //www lasperwireless com/ http //www |dsu com http //www ihuapl edu/ http //www nnnvsoftware com/ http //www ire co ip/enq/ http //www luniqlobal com/ http //www lumper net/ http //www kabira com/ http //www kddi com/ http //www keithlev com/ http //www kevnote-siqos com/ http //www kineto com/ http //www kke co io/ http //www koc net/ http //www kpn com/ http //www kt com/ http //www kvocera-wireless com/ http //www l2one com http //www laotel com http //www laser ir/ http //www leapwireless com/ http //www lenovo com/us/en/
http //www Iqe com http //www latelecom com/ http //www Imt Iv http //www Intinfotech com/ http //www lonqlmes com/ http //www look ca/ http //www 3 http //www m800400 com/
http //www mach com/ http //www mainstreetbb com http //www martin-qrouo com/ http //www marvell com/ http //www maxis com mv
X 2 2 3 1 1 2 1 1 3 1 2 2 1 1 1 1 2 2 2 1 1 4 1 1 3 2 1 3
1 3 4 4 3 2
1 4 3 1 2 1 2 3
2 1 1 1 1
Y 1 1 1 2 2 2 1 4 1 2 2 1 1 1 1 2 2 2 1 1 4 1 1 1 3 1 4 1
2 4 4 1 3 2
4 3 1 2 2 2 4 1
3 1 1 1 2
A 82 2 5 2 2 1 2 2 5 2
21 1 1 1 2 1 2 2
42 1
524 2 1 1 2 2 4
482
56 1 5 2 5 2
564 21 53 7 2 1 2 3 1
582 1 2 1 2
82

161
URL http //www mblox com/ http //www mctel net/ http //www menatelecom com/ http //www metncowireless com/ http //www meucci-solutions com/ http //www mfone com kh/ http //www mformation com/ http //www microsoft com http //www mid-texcellular com/ http //www mimoon de/ http //www mimos mv/ http //www mindspeed com/ http //www mindtree com http //www minowireless com http //www mitac-mtc com tw/ http //www mitre orq/ http //www mitsumi co IP/ http //www mlltelecom com/ http //www mobile-8 com/ http //www mobileaccess com/ http //www mobilemark com/ http //www mobilemetncs net/ http //www mobihnkqsm com/ http //www mobilkom at/ http //www mobitel si/ http //www mobitv com/ http //www modacom co kr/ http //www monitiseqroup com/ http //www mosaictelecom com/
http //www motorola com http //www movial com http //www moviuscorp com/
http //www mtasolutions com http //www mti com tw/ http //www mtiwe com/ http //www mtk com tw/ http //www mtn co za/ http //www mtnonhne com/ http //www mts ca/ http //www mts ru/ http //www mtsqsm com/ http //www mtsindia in/ http //www multilinks com/ http //www multmet net/ http //www murandi com/ http //www murata com/ http //www mvmotorola co kr/ http //www mvunqmm com
X 1 2 2 2
3 2 1 1 3 2 1 1 1 3 3 1 3 1 0 1 2 3 2 1 2 1
3 1 2
1 1 1 2 1 2 2 2 1 1 3 1 1 2 3 3 1 3 3
Y 1 2 2 3
3 1 1 4 2 1 1 1 3 4 1 3 3 3 1 2 2 3 1 3 1 3 2 2 1
2 1 2 1 2 3 1 1 1 1 2 1 1 3 3 2 1 4 4
A 1 1 2 6
1 5 1 1 1 4 2 2 2 1 2 2 2 2 5 2 2 2 1 7 7 2 2 1 1
562 41 1 1
5 2 2 2 1 1 1 7 2 5 5 2 2 2 3 2
URL http //www naqra com/ http //www nawras om/ http //www nee com/ http //www neotel co za/ http //www nep net http //www netcommlimited com/ http //www nethawk fi/ http //www netindex co IP http //www netkrom com/ http //www neuralt com/ http //www neustar biz/ http //www neustnnq com/ http //www newcorewireless net/ http //www newsiq-inc com/ http //www nex-techwireless com http //www 4 orq/
http //www nokia com http //www nokiasiemensnetwork s com/ http //www nortel com/ http //www n-tele com/ http //www ntt com/ http //www nttdocomo com/ http //www nubilus eu/ http //www nu-z net/ http //www oki com/ http //www olivetelecom in/ http //www onkvo com/ http //www on-waves com/ http //www openmindnetworks co m/ http //www openranqecomm com / http //www openwave com http //www optel-informatik de/ http //www option com/ http //www optus com au http //www oranqe com http //www oranqe-wifi com http //www orqa-svstems com/ http //www otz net/ http //www palm com http //www Panasonic net/ http //www pavfone com/ http //www pcccinc com/ http //www occw com http //www pctestlab com/ http //www personalcommunicati onsdevices com/ http //www oicochio com/
X 1 1 1 2 2 1 1 3 1 2 1 3 3 4 2 1
1
1
2 3 2 1 3 3 1 3 3 3
1
3 1 3 1 1 1
3 1 1 1 1 3 4 1 2
2 2
Y 2 2 1 1 2 1 1 4 2 3 1 3 2 2 1 1
1
1 1 3 2 1 3 2 1 3 3 3
1
1 1 3 1 1 1 3 2 2 1 1 3 4 1 2
1 1
A 2 2
47 2 1 1 2 2 2 1 1 1 1 6 5 4
562 7
47 7 1 1 3 2 1 2 5 2 5
1
2 1 1 1 1 1 8 1 1
56 3 1 2
582 562
5 2

162
URL http //www pixip net/ http //www plateautel net/ http //www pmc-sierra com/ http //www pocket com/ http //www pointredtech com http //www polvstar com/ http //www posdata co kr/enq/ http //www powerwave com/ http //www prisma-enq com/ http //www proximetrv com/ http //www proximiti com/ http //www pt com/ http //www pticom com/ http //www ptwifi pt http //www publicsafetv oc ca http //www pwnets com/ http //www pvroqroup com http //www qtel com qa/ http //www qualcomm co kr/
http //www qualcomm com/ http //www ouantatw com/ http //www quiconnect com http //www quintechelectronics c om/ http //www racsa co cr/ http //www radius-ed com/ http //www radwin com/ http //www rcom co in http //www reach com http //www realnetworks com/ http //www redlinecommunication s com/ http //www redpinesiqnals com/ http //www redplc com/ http //www reliancecommunicatio ns co in/ http //www reverbnetworks com/
http //www rim com/ http //www nncon com/ http //www nnq hr http //www nvada com http //www roamware com/ http //www roaers com
http //www rohde-schwarz com/ http //www romtelecom ro/ http //www rsvstems com/ http //www runcom com/ http //www saqem com/
X 3 4 1 2 3 1 2 2 1 2 2 1 1 3 2 1 2 1 2
1 3 1
2 1 1 2 1 1 1
2 2 1
1 2
1 3 3 1 1 2
1 1 1 1 1
Y 2 4 1 1 1 1 3 1 1 1 3 1 1 3 2 2 1 3 1
1 3 1
3 3 2 2 1 2 1
1 1 2
1 2
1
3 3 1 1 2
1 1 2 1 2
A 1 1 2 5 2 1 2 42 1 2 1 1
5 8 2 2 1 2 3
564 7 2 8
2 2 1 2 6 1 1
2 2 1
2 42
425 61 2 1 5 1 1
426 3 5 2 2 2
URL http //www saqem-commumcations com/ http //www saqemwireless com
http //www saitechnoloqv com/
http //www samsuno com http //www samsunqindiasoft co m/ http //www samsunqtelecom com / http //www sandvine com/ http //www saniole com/ http //www sasktel com/ http //www satimo com/ http //www scarlet an/ http //www scarlet nl/ http //www sei co IP/ http //www selex-comms com/ http //www seowonintech co kr/ http //www sequans com/ http //www setar aw/ http //www setcom eu/ http //www sfone com vn http //www sfr com http //www sharp co io/ http //www sharp co uk/ http //www siaemic it/ http //www sicap com/ http //www sierrawireless com/ http //www sifvcorp com/ http //www siqnalion com/ http //www sim com
http //www simmetrvpcs com/ http //www sinm-qas com mv
http //www sktelecom com/ http //www skvcross com http //www skvnetwork Ik/ htto //www skvpe com/ http //www skvtel mn/ http //www skvterra com/ http //www sib com/ http //www smart-bz com/ http //www smartcall us/ http //www smarttrust com/ http //www smilecoms com/ http //www smithmicro com htto //www snet co kr htto //www somanetworks com/ http //www sonusnet com/ http //www sonv com/
X
1 3 2
1
3
2 1 3 1 3 2 3 3 1 3 2 3 3 3 3 2 2 2 1 2 1 2 1 1 2
1 2 3 2 4 1 1 3 3 1 2 1 4 1 1 3
Y
1 3 2
2
2
1 1 2 1 3 3 3 2 1 3 1 3 1 3 1 2 2 2 2 1 1 1 2 1 2
1 1 2 2 4 1 1 3 3 2 3 1 4 1 1 2
A
2 1 2
429 1
56
3 2 2 1 2 2 2 2 2 2 29 5 63 5 3 2 7 2 1
562 2 3 5 1 2
542 3 2 2 2
5 5 2 5 1 1 2 21 2 2 1
52

163
URL http //www sonvencsson com http //www spacetime-enq com/ http //www sp-ausnet com au/ http //www spb com http //www spectec com tw/ http //www spiceqlobal com http //www spidercloud com/ http //www spirent com/ http //www sprint com/ http //www st co kr/ http //www starcomms com/
http //www starentnetworks com http //www starhome com/ http //www starhub com http //www starsolutions com/ http //www stc com sa/ http //www stencsson com http //www subexworld com/ http //www suntecqroup com/ http //www swiftnq com/ http //www swisscom ch http //www svbase com/mobilese rvices http //www svchip com/ http //www svmsoft com/
http //www svniverse com http //www t ht hr/eno/ http //www taisvs com/ http //www tatacommunications c om
http //www tataelxsi com/ http //www tataindicom com/ http //www tatunq com/ http //www tcs com/ http //www tdf fr/ http //www tec oov in http //www techmahindra com/ http //www tecnotree com http //www tecomproduct com/ http //www tecore com/ http //www teiath qr/ http //www tek com/ http //www tekelec com/ http //www tektronix com/ http //www telcordia com/ http //www telec or \ol http //www telecom co nz http //www telecom na/ http //www telecom sitronics com
X 1 3 1 2 2 2 3 2 2 1 3
1 1 1 3 1 2 2 2 3 2
3 1 1
2 1 3
2 1 2 2 1 1 1 2 1 1 3 2 1 1 3 3 3 2 1 1
Y 2 3 2 1 3 1 1 1 1 1 3
1 1 1 2 1 2 2 2 3 2
2 2 1
1 2 2
1 1 1 3 1 1 1 1 1 1 1 2 1 1 4 1 2 1 3 1
A 41 2 2 1 2 51 1
56 562 2 5
452 3
51 8 5 2 43 1 1 2 8
1 2 1
582 1 7 1
2 2 56 2 2 2 2 2 1 2 1 2 3 1 2
421 2 1 5 1
URL http //www telecomitaha com http //www telecomsvs com/ http //www teleeooch com/ http //www telefonica com http //www telefonica-wholesale com/ http //www telekom com http //www telenor com http //www telenor com pk/ http //www telepin com/ http //www telespree com/ http //www telesur sr/ http //www tehasonera com/ http //www telit com/ http //www telkom co id/ http //www telkomsel com/ http //www tellabs com/ http //www telmex com http //www telnamobile com/ http //www telsasrl it/ http //www telsis com/ http //www telstra com au http //www teltronic es/ http //www telus com/ http //www telusmobihtv com http //www terrestar com/ http //www testquest com/ http //www tfl com fi/ http //www thecableshoppe com/ http //www three com au/ http //www timewamercable com/ http //www ti-sparkle it/ http //www tmnq com/ http //www t-mobile com/ http //www tno nl/ http //www tnsi com/ http //www tnzi com/ http //www tomizone com/ http //www torresnetworks com/ http //www toshiba com/ http //www towerstream com/ http //www tradevan com tw/ http //www trda-inc com/ http //www tnatel lv/ http //www tnquint com/ http //www trooos com/ http //www truewifi net http //www trustvesta com/ http //www tstt co tt/ http //www tta or kr
X
3 3
3
2
3 2 2 1 1 1 1 1 1 3 2 1 1 3 2 2 1 2 3 1 1 1
Y 2 1 3 1
1 2 1 2 1 2 2 1 1 1 1 1 2 4 3 1 1 1 1 1 1 2 1 4 3 2 1 2 1 2 1 2 2 1 1 2 2 2 3 1 1 3 2 1 1
A 423 521
6 43
1 482
1 1 1 5 5 4 1
52 7 4 8 1 2 1 1 2
421 56 1 6 5 2 1 2 1 1 3 7 51 1 8 2 2 2 2 2
5 2 2 8 1 5
62

164
URL http //www ttc orq tw/ http //www turboconcept com/ http //www turkcell com tr/ http //www turktelekom com tr/ http //www turner com/ http //www tvcoelectronics com/ http //www tvntec com/ http //www ubeeinteractive com/ http //www ubidvne com/ http //www ubiauam com/ http //www ubiauisvs com/ http //www ufone com/ http //www uk sqs com/ http //www umic rwth-aachen del http //www 7 http //www unicel com/ http //www unionwireless com/ http //www unistars lv/ http //www unwired com au/ http //www unwiredaustraha com au/ http //www uo2 IP/ http //www us anntsu com http //www uscellular com http //www utimaco com/ http //www utu fi/ http //www vanso com/ http //www vanu com/ http //www vee com tw/ http //www velti com/ http //www veraznetworks com/ http //www vensian com/ http //www venzonwireless com http //www vermontel com/ http //www viaero com/ http //www via-telecom com/ http //www vi bo com tw/ http //www videotron com http //www vimoelcom com/ http //www visafone com nq/ http //www vivotech com/ http //www vnl in/ http //www vodacom co za/ http //www vodafone co nz/ http //www vodafone com au http //www vodafone com/ http //www vodafone nl http //www voxbone com/ http //www vtt fi/ http //www w2bi com/
X 3 3 1 1 2 3 1 2 1 3 1 2 1 1 1 2 3 4 3
1 2 1 2 1 2 3 2 3
2 2
2
3
2
Y 1 2 1 2 4 2 1 1 1 4 2 3 2 2 1 2 3 3 3
2 1 1 1 1 2 4 1 4 1 1 1 2 4 1 2 2 1 1 3 2 1 3 2 1 1 1 3 1 1
A 2 2 3 2 2 2 1 2 4 62 1 1 2 4 7 1 1 2 8
2 g 56 56 2 2 1 1 2 1 1
281 56 1 1
56 2 1 7 5 1 1 1 1 1 3 5 1 2 56
URL http //www wandtel co uq/ http //www wandtel com/ http //www wasko pi/ http //www watchdata com/ http //www wavesat com/ http //www 8lliance net http //www wedotechnolooies co m http //www westcentral com/ http //www westhnkcom com/ http //www wichorus com http //www 2 bq/ http //www 22020 com/ http //www 2forum orq/ http //www wimoss com/ http //www windmobile ca/ http //www windnver com/ http //www wirelessloqix com/ http //www wisperhiqhspeed com http //www witech it/ http //www wi-tribe com/ http //www workssys com/ http //www worldmax nl/ http //www xintec com/ http //www xirkachipset com/ http //www xit net/ http //www vemenmobile com ve/ http //www vota ru/en/ http //www vtlcomms mv http //www vtlesolutions com/ http //www zain com http //www zono com pk/ http //www zscaler com
http //www zte com en http //wwwl olobe com oh/ http //www2 btcbahamas com/ http //www2 ctcak net/ https //www nethawk fi/ https //www wireless att com
X 2 2 2 1 2 1
1 3 3 2 2 3 1 4 2 1 3 3 1 2 3 1 1 4 2 4 1 2 2 1 3 2
1 1 1 3 1 1
Y 3 3 2 2 1 1
2 3 2 1 3 1 1 3 2 1 2 2 2 3 2 2 3 3 1 3 2 2 2 1 3 2
1 1 2 4 1 1
A 2 1 2 1 2 8
1 1 1
423 2 2 2 2 1 2 2 2 2 2 2 2 1 2 1 5 2 2 28 1 1 1
564 23 2 5 1 3 1
Legend
X-1 Group E X-2 Group F Y-1 Group G Y-2 Group H
X & Y Group I A Consortia
1 GSMA 2 WiMAX
3 LSTI 4 NGMN 5 CDG 6 CCF
7 UMTS 8 WBA 9 OPA

165
Appendix B: Hierarchical Decomposition
As indicated in de Nooy (2005), in social network analysis a position in the network is
indicated by a particular pattern of ties. Actors with similar patterns of ties are said to be
relationally equivalent, to constitute an equivalence class or occupy equivalent
positions in a network. Two vertices are structurally equivalent if they have identical ties
with themselves, each other and all other vertices.
Structural equivalence could be calculated based on the dissimilarity of two vertices
and is expressed by an index that ranges from zero (completely similar) to one
(completely different). The hierarchical clustering is a statistical technique which allows
the clustering of vertices based on the structural equivalency. The clustering process
can be visualized by a dendrogram, which can be used as a reference when creating a
partition with classes of companies belonging to the same cluster. It is up to the
researcher to decide the number of classes. For this study we aimed at having clusters
with a sufficient number that offers a sample large enough for subsequent factor
analysis.
The Pajek41 hierarchical clustering is based on dissimilarity "d1" which represents the
number of neighbours the 2 vertices don't share. The hierarchical decomposition for
the initial sample groups Q1, Q2, Q3 and Q4 is presented next:
Initial Sample Group Q1
n Mll#|fiffB8| B 100506 [10.96] (347)
9 100505 [10.33] (296) (Close) ' S 100494 [296] (51) (Close)
S 100504 [8.78] (161) Pose)
Initial Sample Group Q3
a pilllllillllj B 100731 [155] (697) J 8 100723 [0 54] (514)
, t 100669 [0.18] (312) (Close) B 100698 [0.28] (202) (Close)
, m 100729 [0.83] (183) Pose) m 100730 [204] (36) Pose)
E Initial Sample Group Q2
E! 100727 [6.24] (652) B 100726 [4.421 (383)
g 100724(227](336) , ffl 100716 [0.86] (218) (Close)
B 100720 [1.25] (118) Pose) S 100714 [0.83] (47) (Close)
, B 100700 [0.59] (269) Pose) S 100725 [287] (77) (Close)
Initial Sample Group Q4
B fll lffpiplppl| B 100732(2.811(676)
a 100731 [1.10] (533) S 100711 [0.36] (305) (Close) S 100723 [0.48] (228) (Close)
i H 100730 [1.01] (143) Pose) m 100733 [3.68] (59) Pose)
http://pajek lmfm.si/doku.php

166
Appendix C: Factor Analysis Results
E1 Mobile Services (I)
a) "mobile AND content AND delivery"
b) "mobile AND services AND (commerce OR billing)"
c) "(consulting OR engineering) AND services"
d) "mobile AND messaging AND services"
e) "customization OR customize OR customized OR personalize OR individualize"
Average Loading
Variance after Rotation (%)
Loading
ES1
902
896
870
778
719
833
14 97
ES11
89
912
845
817
715
83
13 90
E2 Testing Solutions (I)
a) "measurement" b) "instrumentation OR instrument" c) "(performance OR optimization) AND (analysis OR audit)" d) "test AND evaluation AND equipment" e) "test AND equipment AND manufacturer" Average Loading Variance after Rotation (%)
Loading ES1 878
861
808
798
689
807 14 41
ES2 883
869
791
800
676
804 14 39
ES3 877
862
792
828
691
818 13 88
ES4 875
862
796
828
695
811 14 36
ES5 878
867
794
821
685
809 14 25
ES6 878
851
814
811
703
811 14 79
ES7 877
848
804
805
712
809 15 48
ES8 875
856
813
818
696
812 14 82
ES9 881
849
798
807
710
809 16 22
E3 Fee Based Business Solutions (I)
a) "(data OR voice) AND plans"
b) "unlimited AND (calling OR text OR distance)" c) "("Mobile Terminal Supplier" OR "Mobile Terminal" OR manufacturer) AND mobile AND phone" d) "internet AND mobile" e) "customer AND (options OR choice OR choose)" Average Loading Variance after Rotation (%)
Loading ES1
801
784
761
671
645
732 12 04
ES2
801
783
761
682
654
736 11 52
ES3
815
786
749
675
642
733 1141
ES4
820
797
752
662
617
730 11 87
ES5
812
801
764
643
624
729 11 92
ES6
813
805
752
633
620
725 12 76
ES7
818
798
754
641
632
729 13 09
ES8
817
798
752
639
631
727 12 59
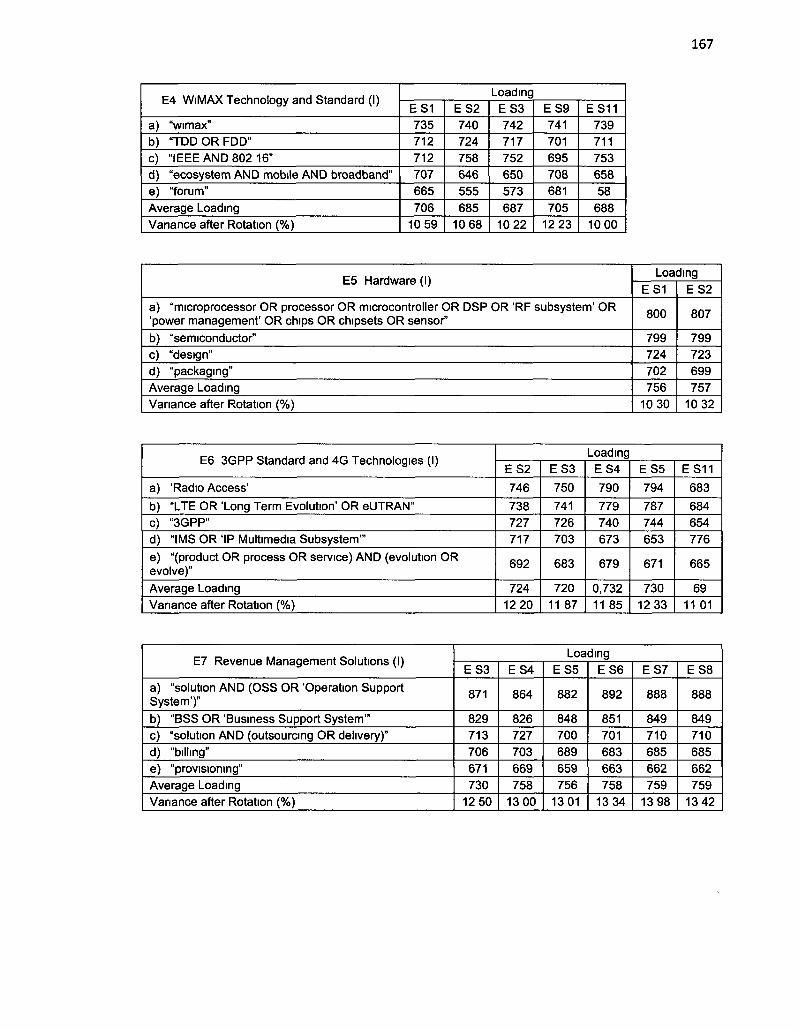
E4 WiMAX Technology and Standard (1)
a) "wimax" b) "TDD OR FDD" c) "IEEE AND 802 16" d) "ecosystem AND mobile AND broadband" e) "forum" Average Loading Variance after Rotation (%)
Loading ES1 735 712 712 707 665 706
10 59
ES2 740 724 758 646 555 685
10 68
ES3 742 717 752 650 573 687
10 22
ES9 741 701 695 708 681 705
12 23
ES11 739 711 753 658 58
688 10 00
E5 Hardware (I)
a) "microprocessor OR processor OR microcontroller OR DSP OR 'RF subsystem' OR 'power management' OR chips OR chipsets OR sensor" b) "semiconductor" c) "design" d) "packaging" Average Loading Variance after Rotation (%)
Loading ES1
800
799 724 702 756
10 30
ES2
807
799 723 699 757
10 32
E6 3GPP Standard and 4G Technologies (I)
a) 'Radio Access'
b) "LTE OR 'Long Term Evolution' OR eUTRAN" c) "3GPP" d) "IMS OR 'IP Multimedia Subsystem'"
e) "(product OR process OR service) AND (evolution OR evolve)" Average Loading Variance after Rotation (%)
Loading ES2
746
738 727 717
692
724 12 20
ES3
750
741 726 703
683
720 11 87
ES4
790
779 740 673
679
0,732 11 85
ES5
794
787 744 653
671
730 12 33
ES11
683
684 654 776
665
69 11 01
E7 Revenue Management Solutions (I)
a) "solution AND (OSS OR 'Operation Support System')"
b) "BSS OR 'Business Support System'" c) "solution AND (outsourcing OR delivery)" d) "billing" e) "provisioning" Average Loading Variance after Rotation (%)
Loading ES3
871
829 713 706 671 730
12 50
ES4
864
826 727 703 669 758
13 00
ES5
882
848 700 689 659 756
13 01
ES6
892
851 701 683 663 758
13 34
ES7
888
849 710 685 662 759
13 98
ES8
888
849 710 685 662 759
13 42
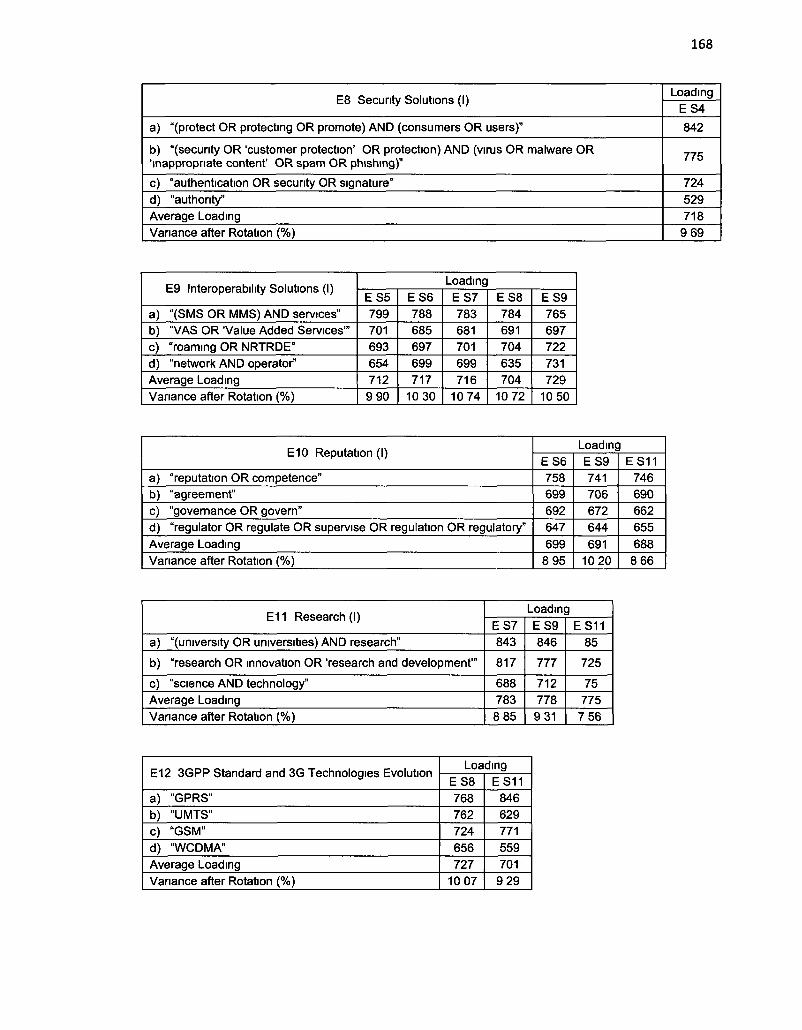
168
E8 Security Solutions (1)
a) "(protect OR protecting OR promote) AND (consumers OR users)"
b) "(security OR 'customer protection' OR protection) AND (virus OR malware OR 'inappropriate content' OR spam OR phishing)"
c) "authentication OR security OR signature" d) "authority" Average Loading Variance after Rotation (%)
Loading ES4
842
775
724 529 718
9 69
E9 Interoperability Solutions (I)
a) "(SMS OR MMS) AND services" b) "VAS OR 'Value Added Services'" c) "roaming OR NRTRDE" d) "network AND operator" Average Loading Variance after Rotation (%)
Loading ES5 799 701 693 654 712 9 90
ES6 788 685 697 699 717
10 30
ES7 783 681 701 699 716
10 74
ES8 784 691 704 635 704
10 72
ES9 765 697 722 731 729
10 50
E10 Reputation (I)
a) "reputation OR competence" b) "agreement" c) "governance OR govern" d) "regulator OR regulate OR supervise OR regulation OR regulatory" Average Loading Variance after Rotation (%)
Loading ES6 758 699 692 647 699
8 95
ES9 741 706 672 644 691
10 20
ES11 746 690 662 655 688 8 66
E11 Research (I)
a) "(university OR universities) AND research"
b) "research OR innovation OR 'research and development'"
c) "science AND technology" Average Loading Variance after Rotation (%)
Loading ES7 843
817
688 783 8 85
ES9 846
777
712 778 9 31
ES11 85
725
75 775
7 56
E12 3GPP Standard and 3G Technologies Evolution
a) "GPRS" b) "UMTS" c) "GSM" d) "WCDMA" Average Loading Variance after Rotation (%)
Loading ES8 768 762 724 656 727
10 07
ES11 846 629 771 559 701
9 29

169
F1 Fraud Detection (I)
a) "(analyze OR monitor OR test) AND fraud" b) "fraud AND (control OR detection) c) "analyse AND revenue AND (loss OR risk) d) "assurance AND (customer OR service)" Average Loading Variance after Rotation (%)
Loading FS1
945
920
876
821
891 19 56
FS2
943
913
905
825
897 20 89
FS3
944
907
897
825
893 19 81
FS4
944
915
902
825
897 19 70
FS5
947
919
903
824
898 19 48
FS6
949
925
877
810
890 21 01
FS7
946
922
894
819
895 20 80
FS8
947
924
894
815
895 19 57
FS9
947
920
906
818
898 19 44
F2 Business Opportunity Solutions (I)
a) "new AND (market OR industry)" b) "solution AND (outsourcing OR delivery)" c) "strategy AND development" d) "network AND operator" e) "end-to-end AND communication AND solutions" Average Loading Variance after Rotation (%)
Loading FS1 817 784 779 700 681 752
19 05
FS10 793 681 762 574 708 704
14 27
F3 Revenue Management Solutions (II)
a) "BSSOR 'Business Support System"' b) "solution AND (OSS OR 'Operation Support System')" c) "activation AND mediation AND service" d) "'cost of ownership' OR 'optimise infrastructure' OR 'optimize infrastructure'" Average Loading Variance after Rotation (%)
Loading
FS1
904
890
869
720
846
18 47
FS2
882
917
880
761
860
18 95
FS3
881
917
878
760
859
17 80
FS4
880
915
880
763
859
17 94
FS5
878
914
880
766
860
17 95
FS6
888
909
882
756
859
19 02
FS7
881
914
881
760
859
19 09
FS8
880
914
879
764
859
17 94
FS9
880
915
879
767
860
17 82
FS10
920
883
865
695
841
14 32

170
F4 Hardware (II)
a) "signal AND processing"
b) "microprocessor OR processor OR microcontroller OR DSP OR 'RF subsystem' OR 'power management' OR chips OR chipsets OR sensor"
c) "multi-standard" d) "'base station' OR 'base-station'" Average Loading Variance after Rotation (%)
Loading FS1 853
749
748 681 758
14 18
FS2 836
716
803 712 767
15 27
FS9 840
730
778 664 753
14 37
F5 Security Solutions (II)
a) "(protect OR protecting OR promote) AND (consumers OR users)"
b) "reputation OR competence" c) "(security OR 'customer protection' OR protection) AND (virus OR malware OR 'inappropriate content' OR spam OR phishing)" d) "conformity OR compliance" Average Loading Variance after Rotation (%)
Loading FS2
928
903
837
595 816
17 54
FS3
926
899
840
597 816
16 50
FS4
921
903
831
606 815
16 54
F6 Interoperability Solutions (II)
a) "(SMS OR MMS) AND services" b) "roaming OR NRTRDE" c) "mobile AND messaging AND services" d) "VAS OR 'Value Added Services'" e) "GSM" Average Loading Variance after Rotation (%)
Loading FS3 890 840 738 723 505 739
17 05
FS10 878 840 703 719 527 733
14 89
F7 Fee Based Business Solutions (II)
a) "phones OR smartphones OR PDA OR accessories OR cards"
b) "customer AND (options OR choice OR choose) c) "(data OR voice) AND plans" d) "unlimited AND (calling OR text OR distance) e) "choose AND different AND plans" Average Loading Variance after Rotation (%)
Loading FS4
778
770 761 707 693 742
16 58
FS5
775
772 758 703 700 742
16 37

171
F8 3GPP Standard and LTE Technology (II)
a) "3GPP" b) "MIMO OR 'smart antenna'" c) "LTE OR 'Long Term Evolution' OR eUTRAN" d) "TDD OR FDD" Average Loading Variance after Rotation (%)
Loading FS5 883 883 865 666 824
16 32
FS6 888 883 857 670 824
17 36
FS7 884 887 868 665 826
17 34
F9 Monitoring Solutions
a) "solutions AND network AND monitoring AND analysis"
b) "(performance OR optimization) AND (analysis OR audit)"
c) "solutions AND (telematics OR metering OR tracking OR alarms OR monitoring)" d) "automation" Average Loading Variance after Rotation (%)
Loading FS6
889
790
660
623 741
15 27
FS10
816
732
585
738 718
10 72
F10 Licenses and Regulation (I)
a) "(issue OR administer) AND (licence OR licensing)" b) "market AND (regulation OR oversight)"
c) "(enable OR enabling OR promote OR promoting) AND competition"
d) "authority" Average Loading Variance after Rotation (%)
Loading FS7 790 778
728
683 745
14 32
FS8 796 782
734
662 744
13 47
FS10 794 716 717
665 723
10 69
F11 Conformance and Certification (I)
a) "conformance" b) "test AND equipment AND manufacturer" c) "validate AND technology" d) "certified OR certification" e) "interoperability" Average Loading Variance after Rotation (%)
Loading FS8 889 822 793 690 528 745
17 14
FS9 912 822 787 657 495 735
17 22
G1 Mobile Services (II)
a) "(consulting OR engineering) AND services" b) "mobile AND content AND delivery" c) "database AND services" d) "mobile AND services AND (commerce OR billing)" Average Loading Variance after Rotation (%)
Loading GS1 873 867 866 851 865
14 74
GS3 865 887 872 862 873
12 74
GS4 848 892 866 871 869
18 76
GS5 862 890 869 866 872
18 73
GS6 848 897 871 883 875
18 61
GS7 872 867 856 847 861
20 13

172
G2 Business Opportunity Solutions (II)
a) "solution AND provider" b) "'end-to-end' AND communication AND solutions" c) "solution AND (outsourcing OR delivery) d) "new AND (market OR industry)"
e) "cost AND (reduce OR reduction OR saving OR effective)
Average Loading Variance after Rotation (%)
Loading GS1 835 763 739 689
661
737 14 37
GS2 849 750 779 667
628
735 17 65
GS3 843 741 756 661
665
733 12 39
GS4 843 760 723 693
701
744 18 46
GS5 843 767 716 698
708
746 18 49
G3 Fee Based Business Solutions (III)
a) "subscription OR activation OR contract"
b) "nngtones OR games OR songs OR wallpaper OR screensavers OR tones OR IM"
c) "service AND mobile AND (banking OR payment OR money OR financial)"
d) "new AND (contract OR collaboration OR partner)" Average Loading Variance after Rotation (%)
Loading GS1 810
750
735
715 752
12 01
GS2 802
752
758
746 765
13 73
GS3 788
776
764
688 754
1011
GS4 819
765
770
713 767
14 69
GS5 817
777
770
694 765
14 69
GS7 826
743
743
725 759
16 38
G4 WiMAX Certification
a) "'base station' OR 'base-station'" b) "wimax" c) "forum" d) "management AND spectrum" e) "certified OR certification" Average Loading Variance after Rotation (%)
Loading GS1 789 766 716 593 549 683
11 80
GS2 761 777 734 618 465 671
14 02
GS3 780 763 726 607 527 681
10 28
GS6 767 801 723 589 557 687
14 86
G5 Interoperability Solutions (III)
a) "roaming OR NRTRDE" b) "solutions AND (roaming OR VAS OR 'Customer Care')" c) "network AND operator" d) "(SMS OR MMS) AND services" Average Loading Variance after Rotation (%)
Loading GS1 797 790 694 686 742
11 26
GS7 797
801 717 668 746
15 12

173
G6 Hardware (III)
a) "microprocessor OR processor OR microcontroller OR DSP OR 'RF subsystem' OR 'power management' OR chips OR chipsets OR sensor"
b) "design"
c) "(product OR process) AND (modularity OR modular OR module)"
d) "system AND integration" Average Loading Variance after Rotation (%)
Loading GS2
802
786
710
669 742
13 89
G7 Reputation (II)
a) "reputation OR competence" b) "governance OR govern" c) "agreement" d) "regulator OR regulate OR supervise OR regulation OR regulatory" Average Loading Variance after Rotation (%)
Loading GS3 792 691 669 560 678 8 39
G8 Security Solutions (III)
a) "(protect OR protecting OR promote) AND (consumers OR users) b) "conformity OR compliance" c) "authentication OR security OR signature Average Loading Variance after Rotation (%)
Loading GS3 715 691 636 681
7 30
G9 Research (II)
a) "(university OR universities) AND research"
b) "research OR innovation OR 'research and development'"
c) "science AND technology" d) "technology AND development" Average Loading Variance after Rotation (%)
Loading GS4 802
710 694 683 722
13 41
GS6 794
720
698 626 710
14 03
GS7 785
717
693 701 724
14 17
G10 Testing Solutions (II)
a) "(performance OR optimization) AND (analysis OR audit)"
b) "measurement" c) "test AND coverage" d) "research AND testing" Average Loading Variance after Rotation (%)
Loading GS5
805
696 695 660 714
12 45
GS6
783
712 725 536 689
12 16

174
H1 Fraud Detection (II)
a) "analyse AND revenue AND (loss OR risk) b) "fraud AND (control OR detection) c) "(analyze OR monitor OR test) AND fraud" d) "billing" e) "assurance AND (customer OR service)" f) "GSMA OR 'GSM Association' OR gsmworld" Average Loading Variance after Rotation (%)
Loading HS1 901 890 877 705 685 606 777
18 11
HS2 900 892 883 703 681 609 778
18 13
HS5 871 902 801 618 755 597 757
17 49
H2 3GPP Standard and LTE Technology (III)
a) "(product OR process OR service) AND (evolution OR evolve)" b) "(product OR process) AND (modularity OR modular OR module)"
c) "(performance OR optimization) AND (analysis OR audit)"
d) "convergence" e) "'cost effective' OR migration OR evolution OR path" f) "LTE OR 'Long Term Evolution' OR eUTRAN" Average Loading Variance after Rotation (%)
Loading HS1 828 804
803
779 683 557 742
16 16
HS2 825 805
797
781 691 559 743
16 18
HS3 821 801
791
787 690 553 741
15 26
HS5 827 806
801
78 684 557 742
16 15
H3 Testing Solutions (III)
a) "test AND coverage"
b) "solutions AND (VoIP OR 'Voice over IP' OR RCS OR 'Rich Communication Suite' OR VCC OR 'Voice Call Continuity')"
c) "system AND solution" d) "multi-standard" e) "automation" Average Loading Variance after Rotation (%)
Loading HS1 862
818
785 739 607 762
14 39
H4 Licenses and Regulation (II)
a) "regulator OR regulate OR supervise OR regulation OR regulatory"
b) "market AND (regulation OR oversight)" c) "guidelines OR rules OR regulation"
d) "(issue OR administer) AND (licence OR licensing)"
Average Loading Variance after Rotation (%)
Loading HS1
844
824 812
693
793 12 50
HS2
861
803 792
694
787 13 09
HS5
847
816 815
698
794 15 18

175
H5 Security Solutions (IV)
a) "(protect OR protecting OR promote) AND (consumers OR users)"
b) "reputation OR competence" c) "(security OR 'customer protection' OR protection) AND (virus OR malware OR 'inappropriate content' OR spam OR phishing)" d) "router OR gateway" e) "conformity OR compliance" Average Loading Variance after Rotation (%)
Loading HS2
929
854
745
716 486 746
13 92
HS3
929
858
736
707 512 748
12 83
H6 Mobile Services (III)
a) "mobile AND applications" b) "mobile AND messaging AND services" c) "device AND management" d) "mobile AND services AND (commerce OR billing)" e) "mobile AND (advertising OR marketing)" f) "(data OR voice) AND plans" g) "(consulting OR engineering) AND services" Average Loading Variance after Rotation (%)
Loading HS3 793 781 776 732 720 702 651 736
16 76
H7 Interoperability Solutions (IV)
a) "(SMS OR MMS) AND services" b) "solutions AND ('SIM card' OR 'smart card')" c) "solutions AND (roaming OR VAS OR 'Customer Care')" d) "service AND mobile AND (banking OR payment OR money OR financial)" e) "roaming OR NRTRDE" Average Loading Variance after Rotation (%)
Loading HS3 816 766 743 704 643 734
13 53
HS5 807 777 724 705 633 729
12 50
11 WiMAX Technology and Standard (II)
a) "OFDMA OR 'Orthogonal Frequency Division Multiple Access'"
b) "IEEE AND 802 16" c) WiMAX c) "'base station" OR 'base-station'" e) "TDD OR FDD" Average Loading Variance after Rotation (%)
Loading IS1
762
743 649 630 608 679
9 61
I S3
764
745 664 628 651 691 7 85
IS4
756
744 651 63 6
676 8 96
IS5
755 754 671 64 67 698
8 26

176
12 Hardware (IV)
a) "microprocessor OR processor OR microcontroller OR DSP OR 'RF subsystem' OR 'power management' OR chips OR chipsets OR sensor"
b) "semiconductor" c) "design" c) "signal AND processing" Average Loading Variance after Rotation (%)
Loading IS1
77
74 74 60 71
815
I S3
78
74 72 60 71
7 38
IS4
78
74 73 59 71
7 72
IS5
79
75 74 60 72
7 34
13 Conformance and Certification (II)
a) "interoperability" b) "conformance" c) "certified OR certification" d) "standards" Average Loading Variance after Rotation (%)
Loading IS1 738 650 634 558 645 7 42
I S3 714 728 649 537 657
6 83
IS4 742 638 632 565 644 7 00
14 UMTS
a) '"UMTS Forum' OR (umts AND forum)" b) "HSPA OR 'High Speed Packet Access'" c) "UMTS" Average Loading Variance after Rotation (%)
Loading IS1 912 803 738 818
7 34
I S3 908 806 752 822 6 59
IS4 909 801 739 816 6 91
IS5 909 806 754 823
6 98
15 Wireless Broadband Alliance
a) '"Wireless Broadband Alliance' OR wbalhance" b) '"collaboration opportunities'" c) "'business ecosystem' OR 'business eco-system'" Average Loading Variance after Rotation (%)
Loading IS1 942 935 644 840 7 30
IS5 942 934 641 839
7 10
16 CDMA Technology and Standards
a) "CDMA OR 'code division multiple access'" b) "1xRTT" c) "EV-DO OR EVDO" d) "3GPP2" Average Loading Variance after Rotation (%)
Loading IS1 767 713 679 595 689
6 88
I S3 772 688 671 612 686 6 27
IS4 771 696 668 608 685 6 53
IS5 787 702 603 713 701
6 83
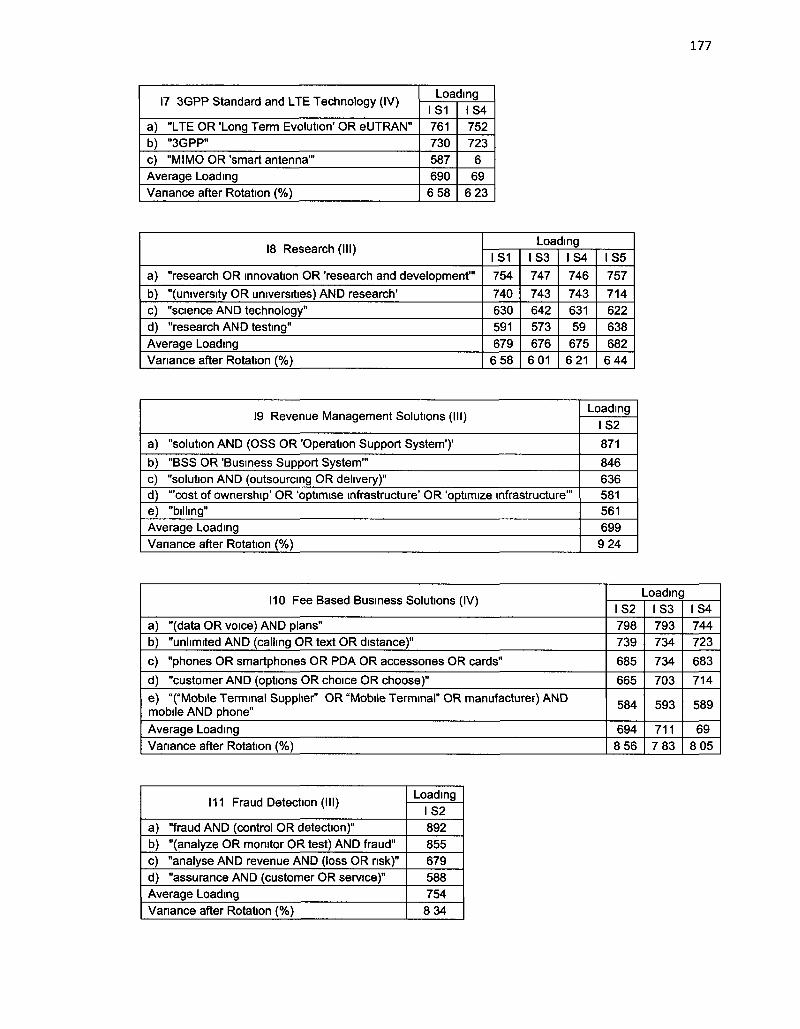
17 3GPP Standard and LTE Technology (IV)
a) "LTE OR 'Long Term Evolution" OR eUTRAN" b) "3GPP" c) "MlMO OR 'smart antenna'" Average Loading Variance after Rotation (%)
Loading IS1 761 730 587 690 6 58
IS4 752 723
6 69
6 23
18 Research (III)
a) "research OR innovation OR 'research and development'"
b) "(university OR universities) AND research' c) "science AND technology" d) "research AND testing" Average Loading Variance after Rotation (%)
Loading IS1
754
740 630 591 679 6 58
I S3
747
743 642 573 676
6 01
IS4
746
743 631 59 675
6 21
IS5
757
714 622 638 682
6 44
19 Revenue Management Solutions (III)
a) "solution AND (OSS OR 'Operation Support System')'
b) "BSS OR 'Business Support System'" c) "solution AND (outsourcing OR delivery)" d) "'cost of ownership' OR 'optimise infrastructure' OR 'optimize infrastructure'" e) "billing" Average Loading Variance after Rotation (%)
Loading IS2
871
846 636 581 561 699
9 24
110 Fee Based Business Solutions (IV)
a) "(data OR voice) AND plans" b) "unlimited AND (calling OR text OR distance)"
c) "phones OR smartphones OR PDA OR accessories OR cards"
d) "customer AND (options OR choice OR choose)"
e) "("Mobile Terminal Supplier" OR "Mobile Terminal" OR manufacturer) AND mobile AND phone"
Average Loading Variance after Rotation (%)
Loading IS2 798 739
685
665
584
694 8 56
I S3 793 734
734
703
593
711 7 83
IS4 744 723
683
714
589
69 8 05
111 Fraud Detection (III)
a) "fraud AND (control OR detection)" b) "(analyze OR monitor OR test) AND fraud" c) "analyse AND revenue AND (loss OR risk)" d) "assurance AND (customer OR service)" Average Loading Variance after Rotation (%)
Loading IS2 892 855 679 588 754 8 34

178
112 Interoperability Solutions (V)
a) "(SMS OR MMS) AND services" b) "VAS OR Value Added Services'" c) "roaming OR NRTRDE" d) "solutions AND (roaming OR VAS OR 'Customer Care'"
Average Loading Variance after Rotation (%)
Loading IS2 786 765 755 745 763 8 21
I S3 763 736 780 788 767 7 68
IS5 768 735 797 794 773 8 04
113 Testing Solutions (IV)
a) "measurement" b) "test AND equipment AND manufacturer" c) "test AND evaluation AND equipment"
d) "(performance OR optimization) AND (analysis OR audit)"
e) "instrumentation OR instrument" Average Loading Variance after Rotation (%)
Loading IS2 749 683 643
622
606 660 7 84
114 Security Solutions (V)
a) "(protect OR protecting OR promote) AND (consumers OR users)"
b) "(security OR 'customer protection' OR protection) AND (virus OR malware OR 'inappropriate content' OR spam OR phishing)"
c) "authentication OR security OR signature" d) "reputation OR competence" Average Loading Variance after Rotation (%)
Loading IS2 853
776
629 626 721
7 69
115 Licenses and Regulation (III)
a) "guidelines OR rules OR regulation"
b) "regulator OR regulate OR supervise OR regulation OR regulatory"
c) "(issue OR administer) AND (licence OR licensing)" d) "authority" Average Loading Variance after Rotation (%)
Loading IS2 744
723
680
618 691 6 94
IS5 752
756
646
692 711 6 77

Appendix D: Membership Distribution
Group E
WiMAX
GSMA
CDG
NGMN
LSTI
UMTS
CCF
WBA
OPA
312
144
124
43
37
25
20
20
15
6
WiMAX
144
20
14
21
14
5
8
7
6
GSMA
20
124
12
15
10
6
7
3
4
CDG
14
12
43
10
5
3
13
1
1
NGMN
21
15
10
37
16
6
7
2
2
LSTI
14
10
5
16
25
7
4
3
2
UMTS
5
6
3
6
7
20
3
0
1
CCF
8
7
13
7
4
3
20
0
1
WBA
7
3
1
2
3
0
0
17
0
OPA
6
4
1
2
2
1
1
0
6
Group E distribution
Consortium
Members
Percentage [%]
WiMAX
144
46 15
GSMA
124
39 74
CDG
43
13 78
NGMN
37
11 86
LSTI
25
8 01
UMTS
20
6 41
CCF
20
6 41
WBA
15
4 81
OPA
6
1 92
Group F
WiMAX
GSMA
CDG
NGMN
LSTI
UMTS
CCF
WBA
OPA
202
108
65
37
12
8
9
13
7
3
WiMAX
108
12
12
8
2
3
4
4
2
GSMA
12
65
10
4
3
2
1
2
0
CDG
12
10
37
2
2
3
10
2
0
NGMN
8
4
2
12
4
2
1
0
0
LSTI
3
3
2
4
8
2
1
0
0
UMTS
3
2
3
2
2
9
1
0
0
CCF
4
1
10
1
1
1
13
0
0
WBA
4
2
2
0
0
0
0
7
0
OPA
2
0
0
0
0
0
0
0
3
Group F distribution
Consortium
Members
Percentage [%]
WiMAX
108
53.47
GSMA
65
32.18
CDG
37
18.32
NGMN
12
5.94
LSTI
8
3.96
UMTS
9
4.46
CCF
13
6.44
WBA
7
3.47
OPA
3
1.49
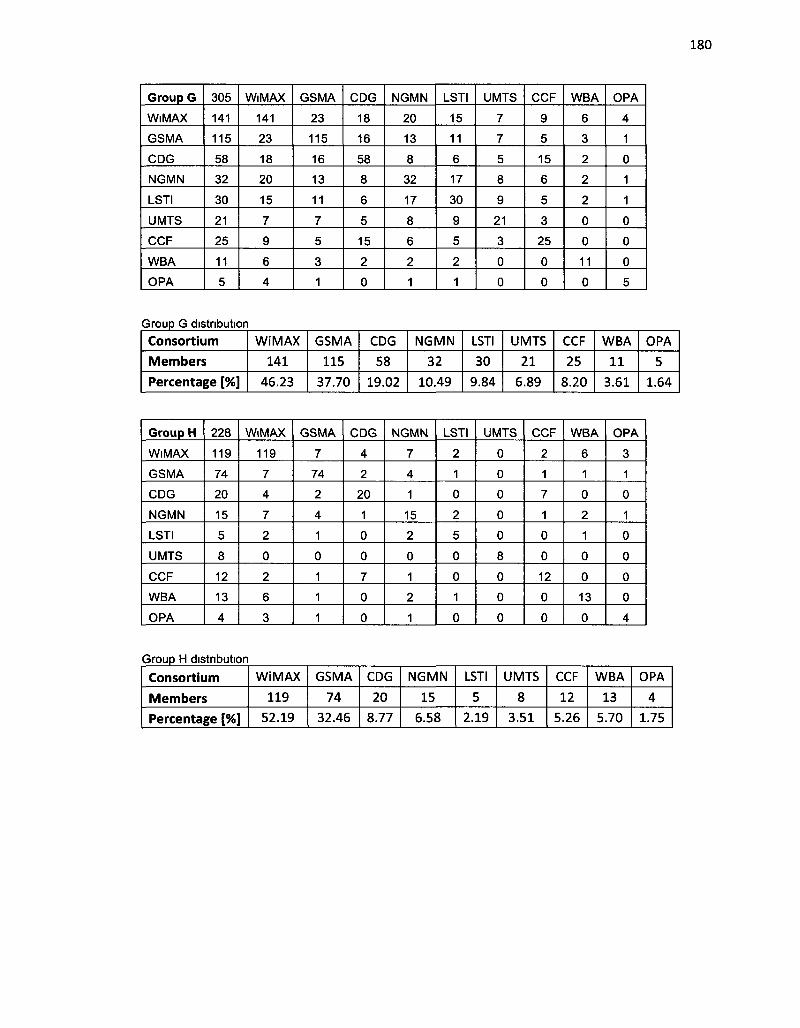
Group G
WiMAX
GSMA
CDG
NGMN
LSTI
UMTS
CCF
WBA
OPA
305
141
115
58
32
30
21
25
11
5
WiMAX
141
23
18
20
15
7
9
6
4
GSMA
23
115
16
13
11
7
5
3
1
CDG
18
16
58
8
6
5
15
2
0
NGMN
20
13
8
32
17
8
6
2
1
LSTI
15
11
6
17
30
9
5
2
1
UMTS
7
7
5
8
9
21
3
0
0
CCF
9
5
15
6
5
3
25
0
0
WBA
6
3
2
2
2
0
0
11
0
OPA
4
1
0
1
1
0
0
0
5
Group G distribution
Consortium
Members
Percentage [%]
WiMAX
141
46.23
GSMA
115
37.70
CDG
58
19.02
NGMN
32
10.49
LSTI
30
9.84
UMTS
21
6.89
CCF
25
8.20
WBA
11
3.61
OPA
5
1.64
Group H
WiMAX
GSMA
CDG
NGMN
LSTI
UMTS
CCF
WBA
OPA
228
119
74
20
15
5
8
12
13
4
WiMAX
119
7
4
7
2
0
2
6
3
GSMA
7
74
2
4
1
0
1
1
1
CDG
4
2
20
1
0
0
7
0
0
NGMN
7
4
1
15
2
0
1
2
1
LSTI
2
1
0
2
5
0
0
1
0
UMTS
0
0
0
0
0
8
0
0
0
CCF
2
1
7
1
0
0
12
0
0
WBA
6
1
0
2
1
0
0
13
0
OPA
3
1
0
1
0
0
0
0
4
Group H distribution
Consortium
Members
Percentage [%]
WiMAX
119
52.19
GSMA
74
32.46
CDG
20
8.77
NGMN
15
6.58
LSTI
5
2.19
UMTS
8
3.51
CCF
12
5.26
WBA
13
5.70
OPA
4
1.75

Group 1
WiMAX
GSMA
CDG
NGMN
LSTI
UMTS
CCF
WBA
OPA
736
346
265
111
54
39
36
47
32
12
WiMAX
346
36
28
31
18
8
15
13
10
GSMA
36
265
24
20
13
8
8
5
4
CDG
28
24
111
13
8
6
25
3
1
NGMN
31
20
13
54
21
9
9
4
3
LSTI
18
13
8
21
39
10
6
3
2
UMTS
8
8
6
9
10
36
4
0
1
CCF
15
8
25
9
6
4
47
0
1
WBA
13
5
3
4
3
0
0
32
0
OPA
10
4
1
3
2
1
1
0
12
Group I distribution Consortium
Members
Percentage [%]
WiMAX
346
47 01
GSMA
265
36 01
CDG
111
15 08
NGMN
54
7 34
CCF
47
6 39
LSTI
39
5 30
UMTS
36
4 89
WBA
32
4 35
OPA
12
1 63