poisoned apple? globalization and the natural resources ... · pdf fileglobalization and the...
TRANSCRIPT

DRAFT: Comments welcome, please consult author before citing.
Poisoned apple? Globalization and the natural resources ‘curse’ in Southeast Asia Ian Coxhead, University of Wisconsin-Madison1 Abstract The rapid growth of China, along with its increasing integration with world markets through WTO accession, abolition of MFA quotas, and reduced trade barriers with ASEAN, is expected to have significant effects on the structure of trade, and thus of production, in SE Asian economies. World Bank estimates indicate that through bilateral trade and through competition with China in third-country markets, SE Asia’s resource-abundant economies will become more intensive in natural resource-based exports and much less so in low-end, labor-intensive manufacturing such as garments. Both these effects will tend to increase demand for natural resources, one through a direct product market effect, the other by driving down the price of a complementary input, low-skill labor.
A question that then arises is how these trends will interact with the other major phenomenon currently sweeping through SE Asia, namely decentralization. Experience in the region indicates that in the best situations, decentralization plus local demands for more environmentally-friendly development are complemented by national laws and policies. In the worst cases, however, with reduced national government power and little or no accountability at the local level, the potential for disastrous rates of resource exploitation is high. If sufficiently severe, the combination of increased demand for natural resource products and diminished constraints on exploitation of the resource base could expose the region to reduced rates of economic growth, a variant of the “curse of natural resources” argument in which “resource intensity tends to correlate with slow economic growth” (Sachs and Warner 2001).
In this paper I explore issues arising from globalization and localization and their potential interactions in SE Asia’s natural resource-abundant economies. What are the long-run prospects in these economies for continued rapid rates of economic growth?
1 For presentation at the Indonesia Update, Canberra, September 24-25 2004. Thanks to Muqun Li and Aksarapak Wongcharoen for valuable research assistance. Send comments to [email protected]

The “curse” of natural resource abundance “Since the second world war it has become quite clear that rapid economic growth is available to those countries with adequate natural resources which make the effort to achieve it” (Lewis 1968: ix) Almost without exception, the resource-abundant countries have stagnated in economic growth since the early 1970s, inspiring the term ‘curse of natural resources’. Empirical studies have shown that this curse is a reasonably solid fact. It is not easily explained by other variables, or by alternative ways to measure resource abundance… resource-abundant economies tended to be high-price economies and… partly as a consequence, these countries tended to miss out on export-led growth… natural resource abundant countries systematically failed to achieve strong export led growth or other forms of growth (Sachs and Warner 2001:837).
The “curse of natural resources” is one of the more colorful phrases to be coined about a major subject in development economics, alongside the ill-fated “East Asian Miracle”. The “curse” is of slow growth due to a failure to sustain efficient factor use, especially in industrial sectors where the potential for productivity gain is highest. Its etymological roots lie with the much older and equally vivid “Dutch disease”, the term coined in the 1970s to describe the decline of some sectors of the Netherlands’ economy in the wake of large North Sea oil and gas discoveries. Like Dutch disease, the “curse” springs from a literature that finds a cloud in the silver lining of natural resource wealth. According to Sachs and Warner, “there is virtually no overlap between the set of countries with large natural resource endowments—and the set of countries that have high levels of GDP” (2001:828). Moreover, “extremely resource-abundant countries such as the Oil States in the Gulf, or Nigeria, or Mexico and Venezuela, have not experienced rapid economic growth… resource intensity tends to correlate with slow economic growth” (ibid).
If these predictions are generally true, then students of Southeast Asian economic development face two puzzles. First, are resource-abundant Southeast Asian economies like Indonesia and Vietnam, which have experienced periods of sustained high rates of economic growth, different in some way from the group of countries from whose experiences Sachs and Warner’s statements are derived? Do they not fit the definition of ‘resource abundant’ perhaps, or are there some features of these economies that set them apart? Second, supposing the answer to these two questions to be negative, what are economists to advise countries such as Vietnam or Myanmar that are presently contemplating more complete engagement with the global economy? What are the long-run prospects for sustained economic growth in countries like these, whose past and recent economic success has been predicated on the extraction of non-renewable natural resource wealth?
Turning to some region-specific issues, two interrelated phenomena now appear to pose challenges to the continued economic success of SE Asia’s resource-rich economies. First, the continued growth and structural transformation of China, along with its increasing integration in world markets through actions such as WTO accession, abolition of MFA quotas, and reduced trade barriers with Japan, East Asia and ASEAN, is expected to have significant effects on the structure of trade, and thus of production, in SE Asian economies. Recent World Bank estimates indicate that the effect of China’s increasing size and involvement in global and regional trade will be to cause SE Asia’s resource-abundant economies to become more intensive in resource-based exports, and much less so in low-end, labor-intensive manufacturing such as garments. Both these effects will tend to increase

2
demand for natural resource assets, directly, through a product market effect, and indirectly by driving down the price of low-skill labor.
The second phenomenon is the decentralization of control over natural resource stocks and their disposal in the countries of Southeast Asia. Decentralization, while it has many positive attributes, has a distinctly mixed record where management of ‘national’ wealth (forests, water resources, etc) is concerned. A theme of this paper is that if decentralization undermines the management and protection of natural resource stocks, the China trade effect could lead to a lower-welfare outcome.
In this paper, we begin with a discussion of the ‘curse’ and a review of global and regional evidence related to it. We then consider briefly the relevant time series data from resource-rich Southeast Asian countries, an analysis that sets the stage for the first big question, what effect will China’s expansion and increasing integration with world markets have on the structure of Southeast Asian production and trade? Subsequently, we explore possible ways in which the hypothesized structural changes might interact with a new policy and institutional setting in decentralizing Southeast Asian resource-rich economies. The paper concludes with some more speculative thoughts on possible future growth paths, welfare results and environmental outcomes for Southeast Asia.
What is the curse? Resource abundance, it is argued, contributes to low growth rates and thus to divergence in per capita incomes between resource-rich and resource-poor economies. Figure 1, from Sachs and Warner (2001), plots GDP growth rates against a measure of natural resource wealth for a large sample of countries; a negative relationship is clearly implied.
More than one explanation can be offered for this relationship. First, the uncorrected Dutch disease effects of natural resource exports inhibit growth in manufacturing, a sector whose growth is commonly believed to confer positive factor productivity externalities, giving rise increasing returns at the sectoral level. Slower growth of manufacturing industries, due to competition for labor and capital from resource sectors and secondary growth in non-traded sectors, reduces the gains available from manufacturing growth.2
Second, it has been argued that exploitation of natural resource wealth reduces the return to human capital, and thus diminishes incentives for educational attainment (Gylfason 2001). Resource-rich countries therefore encounter a form of low-level equilibrium trap when attempting to climb product variety or quality ladders in manufacturing, where human capital inputs are increasingly intensively employed.
Third, a variety of political economy arguments present some form of the case that resource wealth promotes the ascendance of the ‘predatory state’ over the ‘developmental state’, either by actively encouraging the former through corruption related to resource rents, or undermining the latter when revenue flows associated with resource extraction reduce the efficiency of policy and administration (Auty 2001). 3 This set of arguments has been made
2 These negative trends, it is stressed, are independent of endogenous terms-of-trade explanations for low growth in resource-abundant countries, as posited by the Prebisch-Singer hypothesis. 3 “Incentives to create wealth sometimes get blunted by the ability to extract wealth from the soil or the sea. Rich parents sometimes spoil their kids; Mother Nature is no exception” (Sachs and Warner 2001). This line of argument removes the contradiction between the passages from Lewis and Sachs/Warner cited on p.1, given the final phrase of Lewis’ statement.

3
with particular force in case studies of Latin American and sub-Saharan African countries in a recent series of papers by Acemoglu et al. (2001, 2003).
Fourth, it has also been argued, for Latin America, that natural resource wealth exacerbates distributional disparities and thus, in severe cases, causes the diversion of public sector fiscal resources and policies from growth-oriented development goals to less directly productive expenditures intended to forestall social unrest (Leamer et al. 1999).
A fifth argument is that the natural resources curse is a consequence of Dutch disease, which causes relative shrinkage in non-resource tradables sector output. The greater relative prominence of non-tradable sectors in GDP due to the spending effects of a boom increases aggregate vulnerability to destabilizing terms of trade shocks or global market volatility, since rather than adjust through a combination of intersectoral resource movements and expenditure effects, the burden falls on expenditure effects alone (Hausmann and Rigobon 2002).
Despite the intuitive appeal of these arguments, the natural resource curse hypothesis has also attracted considerable critical attention. A number of arguments can be made to the effect that what may appear to be slow growth caused by natural resource wealth is, instead, the product of other phenomena not directly related to resource exploitation. In particular, it is important that the slow growth observed by Sachs and Warner and others in a sample of developing economies is not consistent over time; rather, growth rates in many resource-abundant were very high in the 1960s and 1970s, but decelerated in the 1980s. Slower growth rates in that decade, moreover, were not unique to NR-abundant developing economies, and could instead have been the products of debt overhang or other post-oil shock imbalances and incomplete adjustments (Manzano and Rigobon 2001), in addition to the effects of the global commodity price collapses of the early 1980s. The structural stability of regression results in which growth rates (the endogenous variables) are averaged over fairly long periods is questionable, especially in light of the ‘lost’ decade of the 1980s. Other critics have focused on the econometric strategies from which empirical conclusions about the existence of the curse have been derived. One strand of the argument distinguishes between measures of resource abundance and those of dependence. Sachs-Warner and others mainly use dependence measures (e.g. trade intensities), but these are vulnerable to claims of endogeneity, especially when the effects of policies affecting exchange rates or the growth of other tradables sectors are taken in to account. Another question concerns the definition of abundance (or dependence) and the stability of the group of countries defined as such. This debate is analogous to that over the definition of ‘openness’, in which a country might be classed as ‘open’ by one set of measures but not by another (Rodriguez and Rodrik 1999; and for a Mauritian example see Subramanian et al 2003). By contrast with their approach in this trade literature, Sachs and Warner do not offer a firm criterion for resource ‘abundance’ or ‘dependence’; their conclusions, however, beg the question of how much resource wealth is ‘too much’.
Finally, it is of interest to note that in the empirical growth literature, there are very few instances of regression models not focused specifically on the resource curse hypothesis in which resource abundance emerges as a significant factor affecting long-run growth rates (Li and Coxhead 2004).
A reasonable conclusion to draw from this review is that while there are excellent theoretical grounds to suspect a broad correspondence between natural resource wealth and low rates of economic growth, the causal link, if it exists at all, is neither direct nor simple.

4
Rather, the negative association requires the presenceof some additional factor or factors: policy-induced distortions, market failures, or perhaps institutional failures, which inhibit optimal responses. It may be that each resource-abundant country experiences its own resource wealth-growth relationship, based on unique institutional and economic characteristics, but all such experiences lead to similar outcomes.4
How SE Asia averted the curse All of the above symptoms of the ‘curse’ can be seen in some form in each resource-abundant Southeast Asian country. Out-of sample tests on the data in figure 1 show that statistically, only the Malaysian data can be said not to be drawn by a common underlying data generation process; the null is comfortably accepted for the Philippines, Indonesia and Thailand. Paradoxically, however, the region’s resource-rich economies have in fact grown very rapidly by world standards. Therefore, if the natural resources curse does apply to developing countries in general, the economies of this region have undergone (or are undergoing) some other development experience unique to them (and perhaps a very few other economies such as Botswana) that more than compensates for its effects.
Perhaps the most obvious explanation for SE Asian success in diversification and industrialization is the very special period of the post-Plaza Accord (1985) boom in Japanese and East Asian FDI into the region, an occurrence whose intensity in the region ensured the inclusion of Thailand, Malaysia and Indonesia in the World Bank’s group of eight “East Asian Miracle” economies. Not only did these economies grow very rapidly and in sustained fashion over more than a decade; they also underwent structural changes that dramatically reduced their relative reliance on natural resources. By the early 1990s all of Southeast Asia’s market economies exported far more manufactures by value than agricultural and natural resource products. For these economies, then, we may hypothesize that the rapid expansion of labor-intensive manufacturing employment in the mid-late 1980s, caused by heavy inflows of foreign investment, forestalled the onset of the resource ‘curse’ by inducing rapid structural change.
For many of the world’s resource-abundant developing economies, the 1980s was a time when the world economy and domestic conditions conspired, in effect, to take them out into the woods and leave them to die. But like Snow White in the childrens’ story, Southeast Asia, was rescued by the economic equivalent of the seven dwarves and flourished. In the story, Snow White kept house (supplied unskilled labor intensive services) for the dwarves, who were industrious miners (owners of capital and technology), and they protected her from the perils of the forest (the world economy?). Similarly, Southeast Asia’s ‘miracle’ growth decade of the 1980s and early 1990s was made possible by a unique set of historical conditions. However, Snow White succumbed to a wicked witch who emerged from the forest with a tempting but poisoned apple. Will continued globalization allow the resource curse catch up with Southeast Asia yet?
Barring wars and catastrophic policy reversals, a necessary condition for the exploitation of their resource wealth to threaten the continued growth of the globalized, semi-industrialized, resource-abundant Southeast Asian economies is that their comparative 4 More formally, the observation of a negative relationship between resource wealth and growth does not imply that all the observations are generated by a common underlying process. A test of this would involve searching for significant differences and dividing the data accordingly, as has been done for the empirical growth literature (Durlauf and Johnson 1995; Brock and Durlauf 2001).

5
advantage shift dramatically back in the direction of natural resource sectors. This clearly is not a sufficient condition, however; greater comparative advantage in natural resource sectors will only hurt growth if it interacts with market failures or other distortions that affect factor productivity or accumulation. In the next two sections we first explore the shift in comparative advantage, then examine some ways in which such a shift might interact with known market and institutional failures.
Southeast Asian responses to Chinese growth Intra-East Asia trade volumes have growth enormously in the past three decades, by 15% per year in 1985-2001 and 16.4% per year in 1975-2001. These rates exceed any other region (for NAFTA the corresponding figures are 9.1% and 9.9%). East Asia-China trade is an increasingly important component of intraregional trade, rising from less than 1% of the total in 1975 to 7% in 2001 (Ng and Yeats 2003). China, with 43% of regional GDP in 2001, accounts for 30% of the region’s exports (ibid: 9). China’s growth, sustained at a rate of about 7% per year for many years, is a major driver of increased regional trade. At the same time, the Chinese economy has also become far more trade-dependent since the late 1980s, a shift caused by many factors, not least of which are the country’s accession to the WTO and the signing of trade liberalization agreements with many countries or regions, including ASEAN.
ASEAN’s share in China’s total imports rose from 6% to 9% in the 1990s, a 390% increase in value terms (Ianchovichina and Walmsley 2003:4). This trend was driven in part by China’s spectacular growth rate, and in part by the liberalization of trade between China and ASEAN. SE Asian economies saw big increases in the share of their regional trade going to China (Ng and Yeats 2003, Table 6.1), and the value of their exports to China’s rose much faster than total exports (Table 1). This growth will continue for the same two basic reasons, albeit not necessarily at the same rate, for at least the next decade. Consequences for production, trade and employment In manufacturing industries, the expansion of China is expected to have mixed effects. Implementation of the Agreement on Textiles and Clothing (ATC), the process for an orderly dismantling of the MFA, will be highly influential. By eliminating national quotas for the export of apparel to US and EU markets, the ATC will remove a serious distortion that has worked against the lowest-cost producers, primarily China. To see this, it is necessary only to compare China’s market share in the US and EU markets with that in the non-quota constrained Japanese market (see James et al. 2003).
At the same time, ASEAN-China competition has intensified in third country markets, mainly but by no means exclusively in labor-intensive, low-tech products. China’s WTO accession, which increased its market access and reduced the cost of imported intermediates for its manufacturers, is expected further to undermine the international competitiveness of key Southeast Asian manufacturing sectors (Ianchovichina and Walmsley 2003, Ianchovichina and Martin). Furthermore, if new FDI flows match the shifting pattern of production, then China’s lead in these sectors can be expected to widen further in the longer run.
How important are these trends? One measure of revealed export competition is the extent of overlap in product categories, adjusted by volumes of exports in each category. Kwan (2002) has computed this for manufactured exports from China and other East and SE

6
Asian economies to the US. The scores, in Table 2, reveal a high overlap between China’s exports and those of Indonesia, and rising overlap between China and exports from other SE Asian economies except the Philippines. The degree of overlap has been increasing as the Chinese manufacturing sector expands (increasing the number of product lines exported) and becomes more capital-intensive (Kwan 2003, Weiss and Gao 2002).5
A formal measure of multilateral trade intensity is that of revealed comparative advantage (RCA, Balassa 1965), which measures the intensity of a country’s exports of a good relative to the intensity of world exports of that good. For country j, good k and time period t, the RCA is defined as:
RCAjkt =Xkt
jXKt
j
Xkt
WXKt
W,
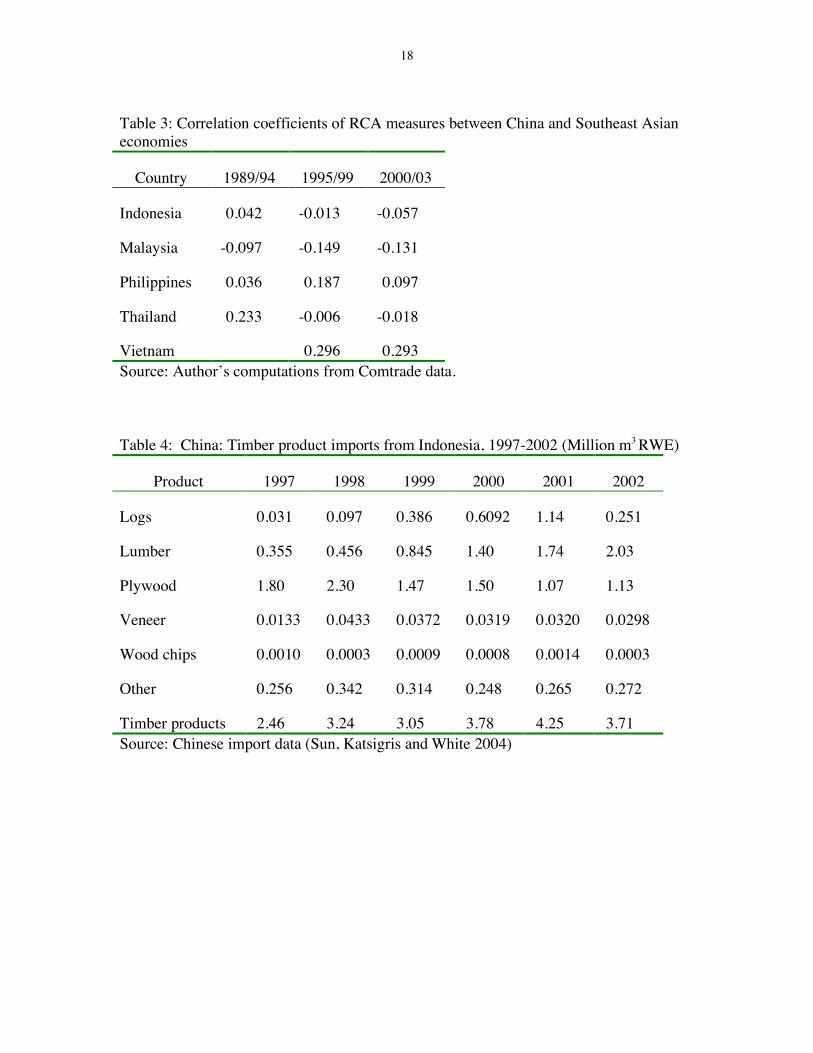
where K denotes the sum of all exports from country j or the world respectively. By convention, values of RCAjkt > 1 (< 1) are inferred to mean that country j has comparative advantage (disadvantage) in production of good k in year t.6 Figures 2-6 show RCA measures computed for 2-digit SITC categories for some Southeast Asian countries (appendix table A-1 provides a key to industry codes). The data are averaged across years into three periods: an early period 1989-94, prior to China’s 40% devaluation of the yuan against the US dollar in December 1993; a middle period 1994-99 spanning the Asian Crisis years; and a late period 2000-03. Each SITC category is represented by a line showing high and low values, with the most recent value shown as a solid point. These data show no distinctive patterns; rises and falls in RCA are widely distributed with few striking trends, although Thailand’s loss of comparative advantage in handbags, garments and footwear (SITC 83-85) is notable. However China (figure 7) has experienced huge increases in RCA in some capital-intensive industry sectors (SITC 62-70); in all kinds of assembly, notably electrical equipment, electronics, computers and components and office equipment (75-77); and also in furniture, handbags, garments and footwear (82-85). The foregoing RCA measures compare country export intensities with global data. Rising bilateral trade shares between ASEAN countries and China motivate a comparison of bilateral trends in trade intensities, as a means of evaluating the impact of China’s growth oin Southeast Asian trade patterns. These comparisons are presented in figures 8-12, which show the difference between each country’s RCA and that of China by two-digit SITC sector. The bilateral data display a very clear pattern in which Southeast Asian countries have a relative advantage in agricultural and natural resource industries, and in some processing sectors intensive in the use of natural resource or agricultural inputs, while China dominates in heavy industry and most light assembly operations. Even more surprising than the sectoral patterns are the trends: in each country, China has unambiguously gained dominance in almost all manufacturing sectors since the early 1990s—most markedly in such sectors as garments and footwear. Even in some natural resource processing sectors, such as timber products excluding furniture, China’s gains have been substantial.
5 Some of the increasing similarity in structure of manufacturing production is reflected not in competition in third markets but in intraregional inter-industry trade (Athukorala 2003), but these potential gains are countered by apparent diversion of FDI from ASEAN to China (source). 6 Of course, these ex post measures are subject to distortion from several sources, most obviously trade policies. The calculations presented below ignore these sources of inaccuracy.

7
The bilateral RCA differences make very clear a trend toward complementarity between China and some regional economies and China. Table 3 confirms this shift; between 1989-94 and 2000-03, RCA correlation coefficients between Southeast Asian countries and China generally declined (the decline is particularly marked for Indonesia). On current trade trends, Southeast Asian countries can expect to become major suppliers of natural resource products to the Chinese market, importing a wide range of manufactures in return, and with continued growth of the size of the China market, these patterns will become increasingly dominant in overall Southeast Asian trade.7
The drivers of shifts in the structure of SE Asian production and trade are potentially large and operate both directly and indirectly. Direct effects on exporters of many manufactures will be measured through negative terms of trade shifts, though these will be offset in some industries by cheaper imports of intermediates from China. Indirect effects will be felt through adjustments in the markets for labor and other factors, and possibly also through shifts in the composition and national distribution of FDI flows. A very large fraction of the Southeast Asian unskilled labor force is now employed in garments, textiles and other low-tech industries identified as under threat from Chinese competition. In Indonesia, the textile and apparel sectors account for 16.5% of non-oil exports by value, and 25% of employment in large and medium manufacturing industries (World Bank, cited in James et al 2003, fn. 1). In Vietnam, garments are 14% of exports by value and the industry employs between 25 and 40% of a manufacturing labor force of 4.6 million workers (Financial Times, June 24 2004, ADB).8 Loss of these sources of export revenue, and the lower wages (or reduced wage growth) that this will cause, will tend to reduce labor costs in natural resource industries, contributing indirectly to a shift in their profitability that will also have substantial direct drivers in the growth of China’s demand for resource-intensive products.9 Another indirect driver will be felt through FDI flows; the evidence is ambiguous, but one likely trend is of reduced FDI in SE Asian industries where competition with China is intense, perhaps offset somewhat by increased FDI in medium-tech or high-tech sectors (Ng and Yeats 2003; Krumm and Kharas 2003, Ch. 2).
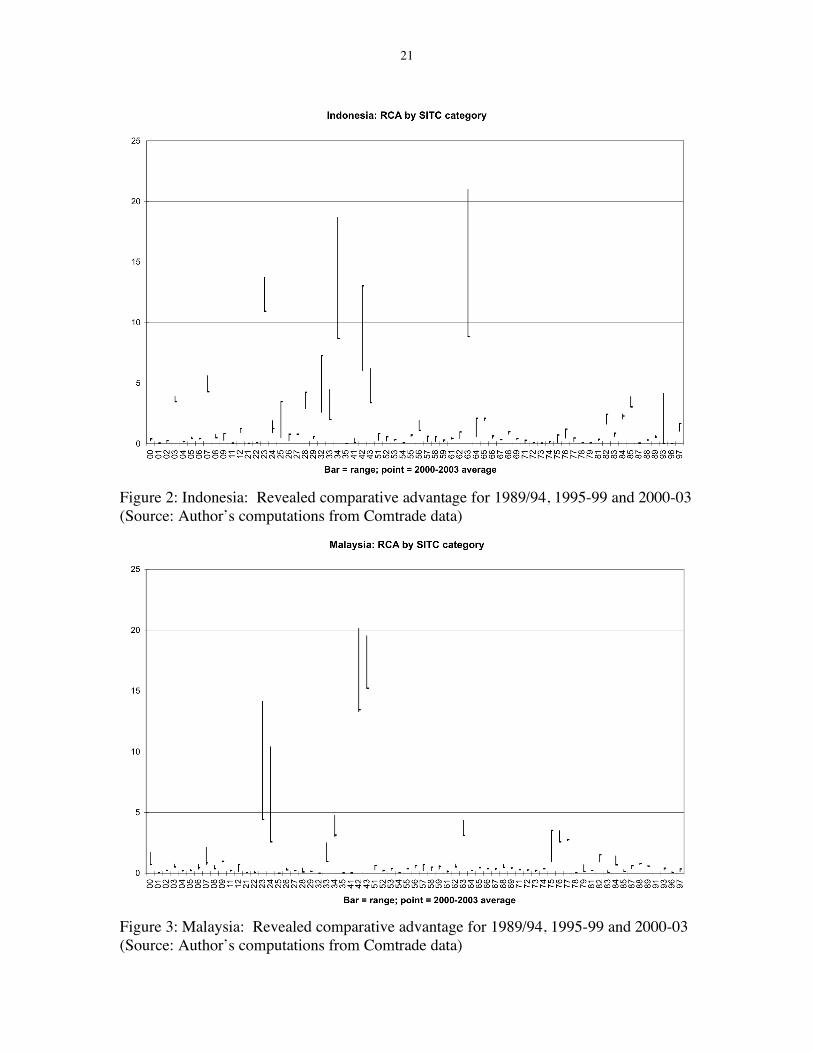
Another important area in which China’s growth, trade expansion and huge FDI inflows all combine to affect SE Asian trade is in forest products. China’s imports of forest products—logs, lumber, pulp and paper, plywood, veneer, woodchips and other products—have more than doubled since 1997 (figure 13). Flows have increased faster since China imposed a ban on logging, to protect its own forest resources, in 2001. Much of the new
7 In many respects this trend will reinstate the dominant trading pattern of precolonial times, which Reid (1993) described as follows: “Southeast Asia, taken as a whole, has always been an exporter of raw materials and an importer of manufactures. Its own manufactures were significant items of local trade, but (with the exception of Vietnamese silk) they were not needed in China or India, the two populous manufacturing centers on its borders. It was the products of tropical agriculture and horticulture… that received the greatest stimulus from the trade boom… followed by forest products” (Reid 1993:32). 8 In Cambodia the figures are much higher: garments account for 80% of exports and employ the majority of the manufacturing labor force; concern for the loss of these revenues and jobs motivated the Canbodian government to join the WTO in August 2004 (NYT, September 1 2004). 9 The extent to which labor is mobile from urban manufacturing-sector jobs to agriculture is of course an empirical question. Labor market adjustments during the recent Asian economic crises provide helpful pointers: in Indonesia, an official labor market data survey in August 1998 found that among workers leaving jobs in manufacturing and construction the previous year, 39% shifted to agriculture (Manning 2000:126), contributing to a net gain of 4.7m farm jobs, a 13.3% year-on-year increase (Hugo 2000).
8
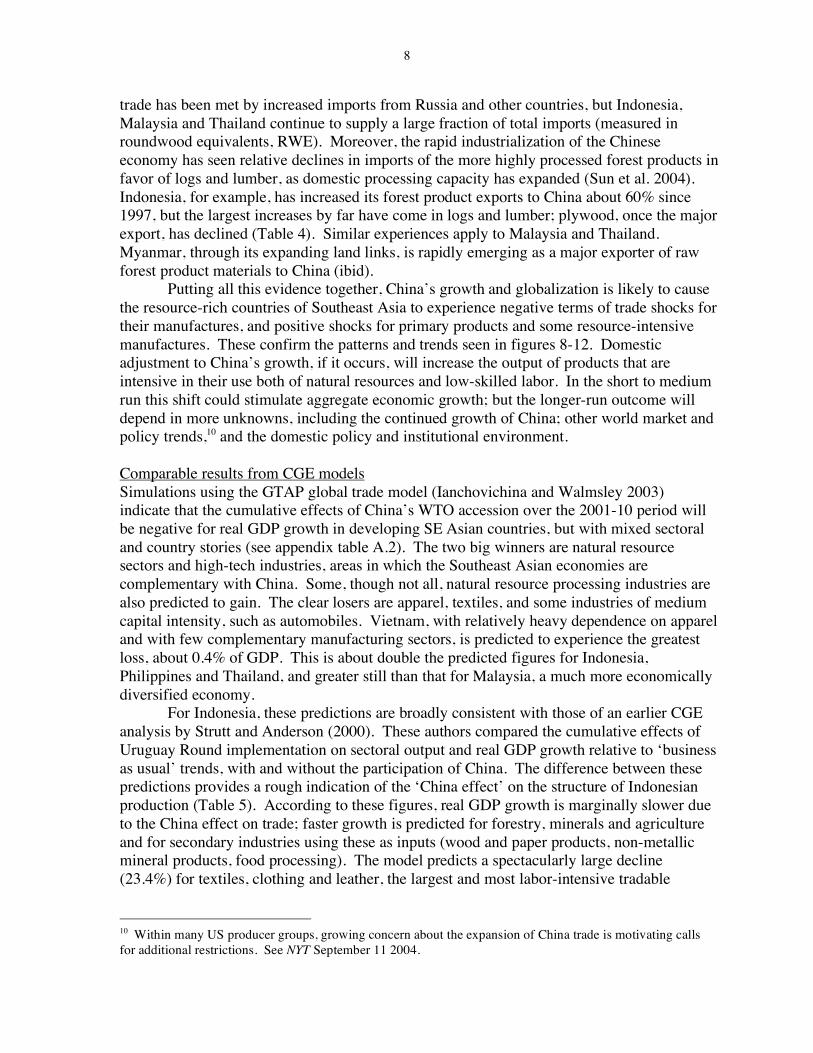
trade has been met by increased imports from Russia and other countries, but Indonesia, Malaysia and Thailand continue to supply a large fraction of total imports (measured in roundwood equivalents, RWE). Moreover, the rapid industrialization of the Chinese economy has seen relative declines in imports of the more highly processed forest products in favor of logs and lumber, as domestic processing capacity has expanded (Sun et al. 2004). Indonesia, for example, has increased its forest product exports to China about 60% since 1997, but the largest increases by far have come in logs and lumber; plywood, once the major export, has declined (Table 4). Similar experiences apply to Malaysia and Thailand. Myanmar, through its expanding land links, is rapidly emerging as a major exporter of raw forest product materials to China (ibid).
Putting all this evidence together, China’s growth and globalization is likely to cause the resource-rich countries of Southeast Asia to experience negative terms of trade shocks for their manufactures, and positive shocks for primary products and some resource-intensive manufactures. These confirm the patterns and trends seen in figures 8-12. Domestic adjustment to China’s growth, if it occurs, will increase the output of products that are intensive in their use both of natural resources and low-skilled labor. In the short to medium run this shift could stimulate aggregate economic growth; but the longer-run outcome will depend in more unknowns, including the continued growth of China; other world market and policy trends,10 and the domestic policy and institutional environment. Comparable results from CGE models Simulations using the GTAP global trade model (Ianchovichina and Walmsley 2003) indicate that the cumulative effects of China’s WTO accession over the 2001-10 period will be negative for real GDP growth in developing SE Asian countries, but with mixed sectoral and country stories (see appendix table A.2). The two big winners are natural resource sectors and high-tech industries, areas in which the Southeast Asian economies are complementary with China. Some, though not all, natural resource processing industries are also predicted to gain. The clear losers are apparel, textiles, and some industries of medium capital intensity, such as automobiles. Vietnam, with relatively heavy dependence on apparel and with few complementary manufacturing sectors, is predicted to experience the greatest loss, about 0.4% of GDP. This is about double the predicted figures for Indonesia, Philippines and Thailand, and greater still than that for Malaysia, a much more economically diversified economy.
For Indonesia, these predictions are broadly consistent with those of an earlier CGE analysis by Strutt and Anderson (2000). These authors compared the cumulative effects of Uruguay Round implementation on sectoral output and real GDP growth relative to ‘business as usual’ trends, with and without the participation of China. The difference between these predictions provides a rough indication of the ‘China effect’ on the structure of Indonesian production (Table 5). According to these figures, real GDP growth is marginally slower due to the China effect on trade; faster growth is predicted for forestry, minerals and agriculture and for secondary industries using these as inputs (wood and paper products, non-metallic mineral products, food processing). The model predicts a spectacularly large decline (23.4%) for textiles, clothing and leather, the largest and most labor-intensive tradable
10 Within many US producer groups, growing concern about the expansion of China trade is motivating calls for additional restrictions. See NYT September 11 2004.

9
manufacturing sector, and one whose contribution to value-added in manufacturing was about 20% throughout the 1990s (World Bank, World Development Indicators).
Decentralization and the management of natural resources Local government mandates and motives Conventional wisdom in the development community has turned decisively in favor of devolved approaches to economic growth and even to environmental and natural resource management (e.g. World Bank 2000). The devolution trend has been welcomed in principle by many development specialists, especially as it coincides with and is reinforced by a general trend towards democratization at the sub-national level.
There are, however, clear problems with decentralized management. Paramount among these is the problem that local administrations are motivated far more by the need to raise revenues and create jobs than to protect the environment, especially where the benefits of local sacrifices may be exported beyond local boundaries and planning horizons to communities downstream, elsewhere, or yet unborn.
Several other problems are also frequently observed. Incomplete democratization of local governments is a critical constraint on the effectiveness of local management: where local administrations are not accountable to their constituents, devolving authority may merely result in accelerated degradation. Capacity constraints bedevil the efforts even of the best and most sincere local administrations; most are simply too small to cover the fixed costs of specialists in resource management, legislative design, enforcement, or other critical areas. Moreover, the question of optimal policy ‘control areas’ for local administrations whose resource management activities affect production of transboundary externalities (both downstream, nationally, and in the cases of biodiversity and atmospheric carbon releases, globally) has yet to be seriously confronted (Rola and Coxhead 2004). The cards are thus stacked against effective local management of natural resources.
Lastly, ill-conceived administrative rules on decentralization undermine capacity for policy or action at all levels of government. In most countries, decentralization includes a shift of personnel away from central government offices, and the power of local branches of central government environmental agencies is frequently subordinated to that of local jurisdictions. If local administrations are weak, however, or compromised by conflicting goals and/or corrupt practices, the result of this shift is that control is exerted neither at the center, nor at the local level. Legal and institutional frameworks The period of decentralization has seen central governments commit to giving more power over environmental and natural resource management to local governments and communities, but the legal basis for such actions is only weakly established, and the practical issues of implementation are far from being worked out. Local forest management is officially encouraged in Cambodia, but the absence of documented forest rights and responsibilities leaves communities with no authority to protect local forests (Poffenberger 2000). Similarly, Thailand has implemented a National Forest Policy but does not specify environmental rights and responsibilities to communities, and the legal basis for local or community resource management is still lacking. In Vietnam, the 1993 Land Law conferred use rights over agriculture and forestlands to communities and individuals, but ownership still rests with ‘the people’, i.e. the state (Tachibana et al. 2001).

10
Indonesia, unfortunately, exemplifies the range of ways in which decentralization can undermine effective resource management. Under the New Order regime, forest management policies and processes were codified, for the most part, in the 1967 Basic Forestry Law (BFL). This established a legal and institutional framework for state-supported commercial forest exploitation. The central government was paramount; in particular, tensions between commercial/industrial forest use rights and those of communities were resolved by “categorically excluding” the latter and denying legitimacy to adat (traditional law) (Colfer and Resosudarmo 2002: 215). Laws passed in 1999 amended the BFL, while others in 2000 devolved substantive powers to local government. However these initiatives, which mark the country’s first genuine attempt at decentralized forest management, are unclear on state versus local powers and responsibilities. They are, moreover, laws enacted in a transitional moment during which regional and village elites, freed from the strictures of centralized New Order governance, began themselves to initiate a de facto decentralization of local development policy. Lacking either a strong (though arbitrary) central state or a clear set of rules for decentralized forest management, “policy implementation has depended to a great degree on personalities and place. The lack of certainty in the law, combined with the lack of a legal structure linking the forest resource to its users, has created a free-for-all in which forest management has become the responsibility of no-one” (Colfer and Resosudarmo 2002:24). Virtually the only certainty is that Indonesian timber removal rates, at about 80 million cubic meters per year, exceed even Jakarta’s own ‘sustainability criterion’ by a factor of more than three (ibid., p. 216).
Fiscal policies Other design faults in Southeast Asian decentralizations help create the conditions under which local governments are likely to tolerate high rates of resource depletion. In general, local governments have very limited capacity for revenue-raising through taxation, charges, or user fees. In Indonesia, the general purpose equalization transfer (DAU) to sub-national governments applies a formula for ‘fiscal capacity’ that excludes natural resource revenues. There is, in other words, no fiscal penalty to resource-rich sub-national administrations that choose to increase resource extraction rates, and “[t]his is a significant windfall gain for those local governments that receive large amounts of shared revenues from natural resources” (Lewis 2001:333). Under Law No. 25 (fiscal decentralization), Indonesia’s regions retain 15% of oil revenues, 30% of gas revenues, and 80% of revenues from other forms of natural resources (Hill 2002:26).
Still in Indonesia, national government expenditures on environment are low by regional standards, and during the crisis of 1997-98 were shown to be especially vulnerable to cuts, falling relative to both GDP and the national budget (Vincent et al. 2002). If these data are indicative of central government commitments to environmental protection, local administrations bent on raising revenues through environmentally damaging (or resource-depleting) means need not worry unduly that Jakarta will call them to task. 11
Vietnam’s recent experience is similar. Its major exports by value in 2003 were textiles and garments (18%), marine products (11%), and rice, coffee, wood products and rubber (11%), and China is a key trading partner, absorbing 6.4% or exports and supplying 11 For excellent recent analyses of decentralization and forest management in Indonesia, see Colfer and Resosudarmo 2002. Papers in this volume also provide insightful coverage of the complex issue of the distribution of resource management powers between central and local agencies in the Indonesian context.

11
14% of imports (ADB: 2004). Decentralization in Vietnam is stimulating a race for resources similar to that in Indonesia, with inadequate legal sanctions for violators of laws on land, forest and water use. As in Indonesia, an increase in Vietnam’s comparative advantage in natural resource products relative to its enormous neighbor and trading partner will lead to increased demand for land, forest conversion and related resource-depleting trends. In this setting local administrations, even those with significant pro-environment constituencies, will be hard-pressed to enforce limitations on resource depletion or pollution, just as has been documented among local governments within China itself.12 Localization, globalization and the resource curse The shifts in Southeast Asian economic structure caused by China’s expansion and increasing global integration are potentially huge, and seem systematically to involve expansion of natural resource-intensive industries and contraction of many labor-intensive assembly sectors. As was pointed out earlier, however, these changes can only reduce growth or economic welfare in the way predicted by the resource curse hypothesis if they encounter distortions that inhibit an optimal policy response. The purpose of this section has been to suggest that in Southeast Asia, there is a high probability that such a distortion will be encountered in the form of incomplete controls over exploitation of natural resource stocks. Moreover, recent steps toward decentralization appear to have greatly reduced the probability that resource stocks will in the future be managed in a socially optimal manner. With resource management powers poorly defined and imperfectly or corruptly exercised, the economies of the region are coming to resemble ever more closely the hypothetical economy in Brander and Taylor (1997), in which an economy having comparative advantage in a natural resource, by entering into trade, reduces its own welfare through open-access exploitation. In the absence of effective controls on resource depletion, and with no guarantee of future control over resource rents, such an economy experiences a race by all actors to liquidate natural resource wealth in the short term; in the longer term, therefore, it grows more slowly or not at all. China’s expansion could well fuel such a sequence of events in Southeast Asia. If it does, the real problem will lie not in China’s voracious import demand, but in the failings of Southeast Asian domestic policies and institutions.
Conclusions Will continuing globalization render the resource-abundant economies of SE Asia vulnerable to a variant of the curse of natural resources? In particular, will China’s globalization hand SE Asian economies a ‘poisoned apple’, delivering slower growth to the economies that escaped the crisis of the 1980s?
The trade and investment effects of China’s expansion are predicted to have slightly negative overall effects on the region, moderating the generally positive predicted effects of global trade liberalization and growth. Countries like Vietnam and Indonesia, whose industry sectors are less diversified, will suffer relatively more that those such as Malaysia, especially given the latter’s strength in high-tech sectors. The all-important apparel, footwear and related industries are especially vulnerable, and these are industries whose 12 “[T]he countryside, home to two-thirds of China's population, is increasingly becoming a dumping ground. Local officials, desperate to generate jobs and tax revenues, protect factories that have polluted for years. Refineries and smelters forced out of cities have moved to rural areas” (NYT, “Rivers Run Black”, September 12 2004). See also FT July 27 2004.

12
decline may have economy-wide consequences through adjustments in labor markets. The growth in demand for natural resource products, accompanied by declining or at least less rapidly growing real wages, will stimulate output in extractive industries such as forestry and mining, in rubber, oil palm and other and other industrial crops, and in specialized horticultural crops (tropical fruit, coffee) as well as in fisheries. The growth of these sectors’ output will reflect shifts in SE Asia’s comparative advantage associated with the China effect.
The long-term consequences of this possible reorientation of SE Asian economies will be slight, if legal and economic institutions exist to account for the true opportunity cost of the new mix of activities. However, to the extent that additional demand for timber, fisheries, and agricultural land is unrestrained by legal safeguards or externality-correcting economic instruments, higher commodity demands and lower labor costs may spark an acceleration in resource-extracting activities, including the conversion of forests to industrial agriculture. In some areas of the region, these changes, being difficult if not impossible to reverse, could spell long-term reductions in earnings power and increased vulnerability to environmental disasters. I have argued in this paper that the likelihood of such outcomes is higher where incomplete decentralization has devolved powers over resource use without commensurate responsibilities.
Turning to policy implications, it remains to be seen whether these possible changes will merit the term “curse”. First, these changes will take place in a context of overall (predicted) gains from globalization, from which the China effect could shave perhaps 25%. Sustained economic growth, as is well known, simultaneously raises demands for the conservation of resources, and creates the capacity to implement such demands—both factors cited by proponents of the idea of an environmental Kuznets curve. Second, the existence of a natural resource curse depends on market or institutional failures, including the effects of weak institutions of governance. Where such institutions are strong, property rights (including those of consumers of pollution) are generally better-protected, thereby inhibiting race-to-the-bottom resource exploitation strategies. On this score, the uplands of Vietnam and the other Indochinese countries, and the outer islands of Indonesia—areas where the restraining hand of central government is weakest at a regional scale—appear to be the most vulnerable. Other countries and regions display more heterogeneous experiences, some of which may be relevant to the more vulnerable ones. How decentralization affects NRM in these areas will be a critical factor determining the future of their forests, soils and other natural resource stocks and, ultimately, the welfare of their human populations.

13
References Athukorala, P. 2003. “Product fragmentation and trade patterns in East Asia.” Australian
National University, Research School of Pacific and Asian Studies, Division of Economics, Working Papers in Trade and Development No. 2003/21.
Auty, R. M. 2001. “…” European Economic Review 45: 839-846 Balassa, Bela. 1965. "Trade liberalization and 'revealed' comparative advantage," Manchester
School 33:99-123. Brander, J.A., and M.S. Taylor. 1997. “International trade and open-access renewable
resources: the small open economy case.” Canadian Journal of Economics 30(3): 526-552.
Colfer, Carol J. Pierce, and Ida Aju Pradnja Resosudarmo, eds. 2002. Which Way Forward? People, Forests and Policymaking in Indonesia. Washington, D.C.: Resources for the Future; Bogor, Indonesia: CIFOR; and Singapore: Institute for Southeast Asian Studies.
Durlauf, S., and P.A. Johnson. 1995. “Multiple regimes and cross-country growth behaviour.” Journal of Applied Econometrics 10(4): 365-384.
Gylfason, T. 2001. “Natural resources, education, and economic development.” European Economic Review 45: 847-859
Hausmann, R., and R. Rigobon. 2002. “An alternative interpretation of the ‘resource curse’: theory and policy implications.” NBER Working Papers No. 9424.
Hill, H. 2002. “…” Bulletin of Indonesian Economic Studies. Hugo, G. 2000. “”The impact of the crisis on internal population movement in Indonesia.”
Bulletin of Indonesian Economic Studies 36 (2), August: 115-38. Ianchovichina, E., and T. Walmsley. 2003. “The impact of China’s WTO accession on East
Asia”. Washington, DC: World Bank Policy research Working Paper No. 3109 (August). Ianchovichina, E.; S. Suthwart-Narueput, and M. Zhao. 2003. “Regional impacts of China’s
WTO accession.” Chapter 2 in Krumm and Kharas op.cit., pp. 57-78. James, W. E.; D. J. Ray, and P. J. Minor. 2003. “Indonesia’s texztiles and apparel: the
challenges ahead.” Bulletin of Indonesian Economic Studies 39 (1), April: 93-103. Kwan, Chi Hung. 2002. The rise of China and Asia’s flying-geese pattern of economic
development: an empirical analysis based on US import statistics”, Nomura Institute, NRI Papers No. 52, August.
Krumm K., and H. Kharas. 2003. East Asia Integrates: A Trade Policy Agenda for Shared Growth (Washington, DC: World Bank).
Leamer, E. E. et al. 1999. "Does natural resource abundance increase Latin American income inequality?" Journal of Development Economics 59: 3-42.
Lewis, W.A. 1968. Some Aspects of Economic Development. Accra: University of Ghana.

14
Lewis, B. 2001. “The new Indonesian equalization transfer”. Bulletin of Indonesian Economic Studies 37 (3), December: 325-43.
Li, Muqun, and I. Coxhead. 2004. “The natural resource curse: an annotated bibliography.” Manuscript, University of Wisconsin-Madison.
Manning, C. 2000. “Labour market adjustment to Indonesia’s economic crisis: context, trends and implications.” Bulletin of Indonesian Economic Studies 36 (1), April: 105-36.
Manzano, O., and R. Rigobon. 2001. “Resource curse or debt overhang?” NBER Working Papers No. 8390.
Ng, F., and A. Yeats. 2003. “Major trade trends in East Asia: What are their implications for regional cooperation and growth?” World Bank Policy Research Working Paper No. 3084, June.
Poffenberger, M. (Ed.). 2000. “Communities and forest management in Southeast Asia: a regional profile of the Working Group on Community Involvement in Forest Management.” IUCN.
Reid, A. 1993. Southeast Asia in the Age of Commerce 1450-1680, vol. 2 (New Haven, CT: Yale University Press.
Rodriguez, F., and D. Rodrik. 1999. “Trade policy and economic growth: A skeptic’s guide to the cross-national evidence”, NBER Working Paper No. 7081.
Rola, Agnes C., and I. Coxhead. 2004. “Development policies, institutions and the environment in the uplands of Southeast Asia”. Invited plenary paper at the biannual Congress of International Association of Agricultural Economists, Durban, SA, August 2003. Forthcoming in IAAE Papers and Proceedings.
Sachs, J., and A. Warner. 1995. “Natural Resource Abundance and Economic Growth.” NBER Working paper No. 5398
Sachs, J., and A. Warner. 2001. “Natural resources and economic development: the curse of natural resources”, European Economic Review 45 (2001) 827-838
Strutt, A., and K. Anderson. 2000. “Will trade liberalization harm the environment? The case of Indonesia to 2020”. Environment and Resource Economics 17: 203-232.
Subramanaian, A. 2003. “…” in D. Rodrik (ed), In Search of Prosperity. Sun, X.; E. Katsigris, and A. White. 2004. "Meeting China's demand for forest products."
Forest Trends, Chinese Center for Agricultural Policy, and CIFOR. www.forest-trends.org
Tachibana, T., T.M. Nguyen, and K. Otsuka. 2001. “Management of state land and privatization in Vietnam”, in K. Otsuka and F. Place, eds: Land Tenure and Natural Resource Management: A Comparative Study of Agrarian Communities in Asia and Africa, Washington, DC: Johns Hopkins for IFPRI, pp. 234-272.
Vincent, J.R.; J. Aden, G. Dore, M. Adriani, V. Rambe, and T. Walton. 2002. “Public environmental expenditures in Indonesia.” Bulletin of Indonesian Economic Studies 38 (1), April: 61-74.

15
Weiss, J., and Gao, S. 2002. “Peoples’Repuiblic of China export threat to ASEAN: competition in the US and Japanese markets.” ADB Institute Discussion Paper No. 2.
World Bank. 2003. “Indonesia: maintaining stability, deepening reforms”. World Bank, Brief No. 25330-IND, Jakarta.

16
Tables and Figures Table 1: Growth of total exports and China’s share, SE Asian countries, 1985-2001 Table 2: Southeast Asian competition with China in the US market (per cent overlap in product categories) Table 3: Correlation coefficients of RCA measures between China and Southeast Asian economies Table 4: China: timber product imports from Indonesia, 1997-2002 (Million m3 RWE) Table 5: Changes in sectoral output levels in Indonesia following Uruguay Round trade reforms (cumulative %, 2001 to 2010) Figure 1: Economic growth and natural resource dependence: the Sachs-Warner data Figures 2-7: Revealed comparative advantage trends in China and SE Asian countries Figures 8-12: Relative RCA trends for SE Asian countries and China Figure 13: China’s forest product imports 1997-2003

17
Table 1: Growth of total exports and China’s share, SE Asian countries, 1985-2001 Change from previous period
Country Year Total exports
($m) China share
(%) Total exports
(%) China share
(%)
Indonesia 1985 19,684 1.7 – – 1995 47,885 4.3 143 153 2001 63,149 6.2 32 44
Malaysia 1985 17,947 1.1 – – 1995 86,288 2.4 381 118 2001 111,429 5.6 29 133
Philippines 1985 6,112 1.6 – – 1995 19,780 1.4 224 -13 2001 42,870 4.5 117 221
Singapore 1985 17,199 1.4 – – 1995 88,629 3.8 415 171 2001 9,268 5.5 5 45
Thailand 1985 7,787 3.4 – – 1995 54,387 2.9 598 -15 2001 72,746 6.5 34 124
Vietnam 1985 407 0 – – 1995 6,222 5.3 1429 – 2001 14,894 6.8 139 28 Source: Ng and Yeats 2003, Table 2.1 Table 2: Southeast Asian competition with China in the US market (per cent overlap in product categories)
Country 1990 1995 2000
Singapore 14.8 19.2 35.8
Indonesia 85.3 85.5 82.8
Malaysia 37.1 38.9 48.7
Philippines 46.3 47.8 46.1
Thailand 42.2 56.3 65.4 Source: Kwan (2002), Table 2.
18
Table 3: Correlation coefficients of RCA measures between China and Southeast Asian economies
Country 1989/94 1995/99 2000/03
Indonesia 0.042 -0.013 -0.057
Malaysia -0.097 -0.149 -0.131
Philippines 0.036 0.187 0.097
Thailand 0.233 -0.006 -0.018
Vietnam 0.296 0.293 Source: Author’s computations from Comtrade data. Table 4: China: Timber product imports from Indonesia, 1997-2002 (Million m3 RWE)
Product 1997 1998 1999 2000 2001 2002
Logs 0.031 0.097 0.386 0.6092 1.14 0.251
Lumber 0.355 0.456 0.845 1.40 1.74 2.03
Plywood 1.80 2.30 1.47 1.50 1.07 1.13
Veneer 0.0133 0.0433 0.0372 0.0319 0.0320 0.0298
Wood chips 0.0010 0.0003 0.0009 0.0008 0.0014 0.0003
Other 0.256 0.342 0.314 0.248 0.265 0.272
Timber products 2.46 3.24 3.05 3.78 4.25 3.71 Source: Chinese import data (Sun, Katsigris and White 2004)

19
Table 5: Changes in sectoral output levels in Indonesia following Uruguay Round trade reforms (cumulative %, 2001 to 2010)
Uruguay Round (Without China)
2010
Uruguay Round (With China)
2010 Difference
Paddy rice -0.60 -0.30 0.30
Other grains 3.20 4.70 1.50
Non-grain crops -5.10 -4.60 0.50
Livestock -0.20 0.10 0.30
Forestry -3.40 -1.10 2.30
Fisheries -1.10 -0.70 0.40
Coal -12.10 -7.10 5.00
Oil -5.40 -3.30 2.10
Gas -5.40 -3.40 2.00
Other minerals -8.10 -5.20 2.90
Food processing -0.60 -0.30 0.30
Textiles, clothing, leather 61.90 38.50 -23.40
Wood products -6.90 -2.40 4.50
Paper products -7.80 -3.70 4.10
Petroleum & coal products 0.90 0.50 -0.40
Chemicals, rubber & plastics 1.10 2.50 1.40
Non-metallic mineral products -7.50 -4.40 3.10
Other manufactured products -19.60 -12.30 7.30
Electricity, water & gas 2.50 1.50 -1.00
Construction 0.50 -0.10 -0.60
Trade & transport -2.40 -1.30 1.10
Other private services -2.00 -1.40 0.60
Other public services -0.60 -0.50 0.10
Real GDP growth 1.90 1.40 -0.50 Source: Strutt and Anderson 2000, and author’s calculations

20
Figure 1: Economic growth and natural resource dependence: the Sachs-Warner data
21
Figure 2: Indonesia: Revealed comparative advantage for 1989/94, 1995-99 and 2000-03 (Source: Author’s computations from Comtrade data)
Figure 3: Malaysia: Revealed comparative advantage for 1989/94, 1995-99 and 2000-03 (Source: Author’s computations from Comtrade data)

22
Figure 4: Philippines: Revealed comparative advantage for 1989/94, 1995-99 and 2000-03 (Source: Author’s computations from Comtrade data)
Figure 5: Thailand: Revealed comparative advantage for 1989/94, 1995-99 and 2000-03 (Source: Author’s computations from Comtrade data)

23
Figure 6: Vietnam: Revealed comparative advantage for 1989/94, 1995-99 and 2000-03 (Source: Author’s computations from Comtrade data)
Figure 7: China: Revealed comparative advantage for 1989/94, 1995-99 and 2000-03 (Source: Author’s computations from Comtrade data)

24
Figure 8: RCA differences, Indonesia minus China (Source: author’s computations from Comtrade data)
Figure 9: RCA differences, Malaysia minus China (Source: author’s computations from Comtrade data)

25
Figure 10: RCA differences, Philippines minus China (Source: author’s computations from Comtrade data)
Figure 11: RCA differences, Thailand minus China (Source: author’s computations from Comtrade data)

26
Figure 12: RCA differences, Vietnam minus China (Source: author’s computations from Comtrade data)
27
Figure 13: China’s forest product imports 1997-2003 (Source: Sun et al 2004).

28
Appendix Table A-1: SITC codes and definitions (2-digit) Commodity Code Description 00 Live animals other than animals of division 03 01 Meat and meat preparations 02 Dairy products and birds' eggs 03 Fish (not marine mammals), crustaceans, molluscs and aquatic invertebrates, and
preparations thereof 04 Cereals and cereal preparations 05 Vegetables and fruit 06 Sugars, sugar preparations and honey 07 Coffee, tea, cocoa, spices, and manufactures thereof 08 Feeding stuff for animals (not including unmilled cereals) 09 Miscellaneous edible products and preparations 11 Beverages 12 Tobacco and tobacco manufactures 21 Hides, skins and furskins, raw 22 Oil-seeds and oleaginous fruits 23 Crude rubber (including synthetic and reclaimed) 24 Cork and wood 25 Pulp and waste paper 26 Textile fibres (other than wool tops and other combed wool) and their wastes (not
manufactured into yarn or fabric) 27 Crude fertilizers, other than those of division 56, and crude minerals (excluding coal,
petroleum and precious stones) 28 Metalliferous ores and metal scrap 29 Crude animal and vegetable materials, n.e.s. 32 Coal, coke and briquettes 33 Petroleum, petroleum products and related materials 34 Gas, natural and manufactured 35 Electric current 41 Animal oils and fats 42 Fixed vegetable fats and oils, crude, refined or fractionated 43 Animal or vegetable fats and oils, processed; waxes of animal or vegetable origin;
inedible mixtures or preparations of animal or vegetable fats or oils, n.e.s. 51 Organic chemicals 52 Inorganic chemicals 53 Dyeing, tanning and colouring materials 54 Medicinal and pharmaceutical products 55 Essential oils and resinoids and perfume materials; toilet, polishing and cleansing
preparations 56 Fertilizers (other than those of group 272) 57 Plastics in primary forms 58 Plastics in non-primary forms 59 Chemical materials and products, n.e.s. 61 Leather, leather manufactures, n.e.s., and dressed furskins 62 Rubber manufactures, n.e.s. 63 Cork and wood manufactures (excluding furniture) 64 Paper, paperboard and articles of paper pulp, of paper or of paperboard 65 Textile yarn, fabrics, made-up articles, n.e.s., and related products 66 Non-metallic mineral manufactures, n.e.s. 67 Iron and steel 68 Non-ferrous metals 69 Manufactures of metals, n.e.s.

29
Commodity code Description 71 Power-generating machinery and equipment 72 Machinery specialized for particular industries 73 Metalworking machinery 74 General industrial machinery and equipment, n.e.s., and machine parts, n.e.s. 75 Office machines and automatic data-processing machines 76 Telecommunications and sound-recording and reproducing apparatus and equipment 77 Electrical machinery, apparatus and appliances, n.e.s., and electrical parts thereof
(including non-electrical counterparts, n.e.s., of electrical household-type equipment) 78 Road vehicles (including air-cushion vehicles) 79 Other transport equipment 81 Prefabricated buildings; sanitary, plumbing, heating and lighting fixtures and fittings,
n.e.s. 82 Furniture, and parts thereof; bedding, mattresses, mattress supports, cushions and
similar stuffed furnishings 83 Travel goods, handbags and similar containers 84 Articles of apparel and clothing accessories 85 Footwear 87 Professional, scientific and controlling instruments and apparatus, n.e.s. 88 Photographic apparatus, equipment and supplies and optical goods, n.e.s.; watches and
clocks 89 Miscellaneous manufactured articles, n.e.s. 93 Special transactions and commodities not classified according to kind 96 Coin (other than gold coin), not being legal tender 97 Gold, non-monetary (excluding gold ores and concentrates) Source: Comtrade.

30
Appendix Table A.2: Impact of China’s WTO accession, SE Asia
(Source: Ianchovichina and Walmsley 2003) Note: 2001 export values (in million US dollars) and shares in total value of non-oil exports (%): apparel $4,134 (9.6%); textiles $3,040 (7%); plywood, timber, pulp and paper $4,298 (9.9%); electronics $5,843 (13.5%). Source of basic data: World Bank 2003.