poland`s investment development path and industry
TRANSCRIPT

Full Terms & Conditions of access and use can be found athttp://www.tandfonline.com/action/journalInformation?journalCode=wjeb20
Download by: [Akademia Ekonomiczna] Date: 03 January 2018, At: 05:53
Journal of East-West Business
ISSN: 1066-9868 (Print) 1528-6959 (Online) Journal homepage: http://www.tandfonline.com/loi/wjeb20
Poland's Investment Development Path andIndustry Structure of FDI Inflows and Outflows
Marian Gorynia , Jan Nowak & Radoslaw Wolniak
To cite this article: Marian Gorynia , Jan Nowak & Radoslaw Wolniak (2008) Poland's InvestmentDevelopment Path and Industry Structure of FDI Inflows and Outflows, Journal of East-WestBusiness, 14:2, 189-212, DOI: 10.1080/10669860802050318
To link to this article: https://doi.org/10.1080/10669860802050318
Published online: 11 Oct 2008.
Submit your article to this journal
Article views: 159
View related articles
Citing articles: 5 View citing articles

Poland’s Investment DevelopmentPath and Industry Structure of
FDI Inflows and Outflows
Marian GoryniaJan Nowak
Radoslaw Wolniak
ABSTRACT. This study explores changes in industry compositionof FDI inflows to and outflows from Poland, using the conceptualframework of J. Dunning’s model of the investment development path(IDP). The data time frame used (from 1996 to 2005) allows for identi-fication of significant changes in FDI structure as Poland movesthrough stage 2 of her IDP. The leading position of the manufacturingsector in both FDI inflows and outflows is replaced by services(especially financial and trade). The last section presents policy impli-cations focused on measures designed to redress the imbalancebetween the still much larger inflows than outflows of FDI.
KEYWORDS. Investment development path (IDP), Poland, sectorand industry composition of FDI inflows and outflows
Address correspondence to Marian Gorynia, Poznan University ofEconomics, al. Niepodleglosci 10, 60-967 Poznan, Poland. E-mail:[email protected]
Jan Nowak, Central European University Business School, 1023Budapest, Frankel Le�oo ut 30-34, Hungary.
Radoslaw Wolniak, Faculty of Economics, Warsaw University, ul. Dluga44/50, 00-241 Warsaw, Poland.
Journal of East-West Business, Vol. 14(2) 2008Available online at http://jeb.haworthpress.com
# 2008 by The Haworth Press. All rights reserved.doi: 10.1080/10669860802050318 189
Dow
nloa
ded
by [
Aka
dem
ia E
kono
mic
zna]
at 0
5:53
03
Janu
ary
2018

The present study is a continuation of the authors’ previous work onPoland’s investment development path (IDP) and its geographic pat-terns (Gorynia, Nowak and Wolniak, 2005b and 2006). This time, theauthors undertake a dynamic analysis of the sector and industrystructure of Poland’s inward and outward FDI in reference to J.Dunning’s IDP model. The purpose of the study is to identify pat-terns of changes in that sector and industry structure over the periodduring which Poland was in stage 2 and moving towards stage 3 ofher IDP, and to confront the observed patterns with the hypothesesor predictions derived from Dunning’s model.
The data sets used in this study have been compiled from the data-base of the National Bank of Poland, which in 1997 started to collectFDI inflow and outflow information broken-down by sectors andindustries (earlier only aggregate FDI information was collected bythe Bank). This in turn determined the period covered by the presentstudy: the years from 1996 to 2005. Although the authors’ previousstudy of Poland’s IDP covered a period starting from 1990, a con-venient coincidence is that, according to the said study, 1996 marksPoland’s transition to stage 2 of her IDP. Thus the present studyfocuses on stage 2 and supplements the previously delineated overallcharacteristics of stage 2 with a comprehensive analysis of the shiftsin sector and industry composition of both inward and outward FDI.
The paper starts with a literature review, in which the authors referto those publications that have contributed to the development andrefinement of the IDP model used here as a theoretical framework.In addition, a number of relevant studies that deal with the issue ofsectoral and=or industrial composition of FDI in the context of IDPare reviewed. The literature review section is followed by an analysisof the structure of FDI inflows into Poland and FDI outflows fromPoland in the period of 1996–2005. The two last sections of the paperpresent conclusions and policy implications respectively.
LITERATURE REVIEW ANDMETHODOLOGICAL FOUNDATIONS
The concept of IDP was first proposed by J. Dunning in the earlyeighties (Dunning, 1981). Since then it has been refined and extendedseveral times, with most significant modifications contained inDunning (1986), and Dunning and Narula (1994, 1996 and 2002).Several other authors have made contributions to the development
190 JOURNAL OF EAST-WEST BUSINESS
Dow
nloa
ded
by [
Aka
dem
ia E
kono
mic
zna]
at 0
5:53
03
Janu
ary
2018
of this concept, including Lall (1996), and Dur�aan and Ubeda (2001and 2005).
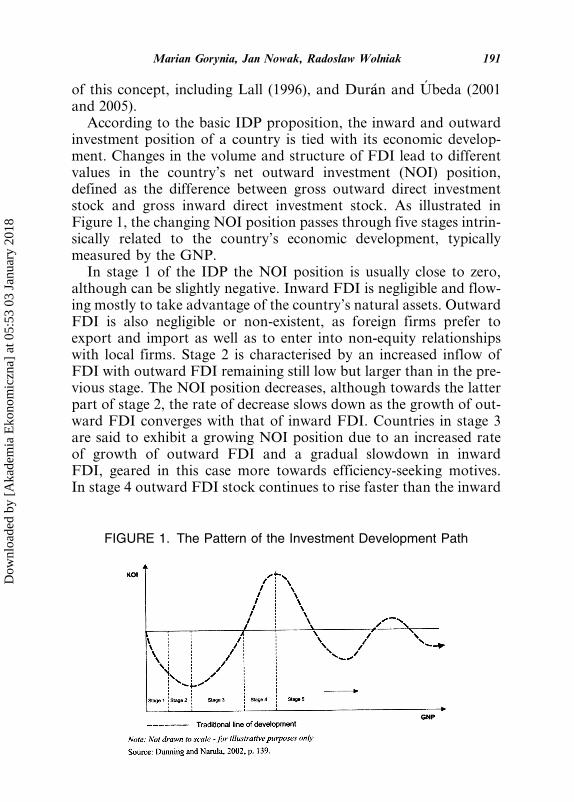
According to the basic IDP proposition, the inward and outwardinvestment position of a country is tied with its economic develop-ment. Changes in the volume and structure of FDI lead to differentvalues in the country’s net outward investment (NOI) position,defined as the difference between gross outward direct investmentstock and gross inward direct investment stock. As illustrated inFigure 1, the changing NOI position passes through five stages intrin-sically related to the country’s economic development, typicallymeasured by the GNP.
In stage 1 of the IDP the NOI position is usually close to zero,although can be slightly negative. Inward FDI is negligible and flow-ing mostly to take advantage of the country’s natural assets. OutwardFDI is also negligible or non-existent, as foreign firms prefer toexport and import as well as to enter into non-equity relationshipswith local firms. Stage 2 is characterised by an increased inflow ofFDI with outward FDI remaining still low but larger than in the pre-vious stage. The NOI position decreases, although towards the latterpart of stage 2, the rate of decrease slows down as the growth of out-ward FDI converges with that of inward FDI. Countries in stage 3are said to exhibit a growing NOI position due to an increased rateof growth of outward FDI and a gradual slowdown in inwardFDI, geared in this case more towards efficiency-seeking motives.In stage 4 outward FDI stock continues to rise faster than the inward
FIGURE 1. The Pattern of the Investment Development Path
Marian Gorynia, Jan Nowak, Radoslaw Wolniak 191
Dow
nloa
ded
by [
Aka
dem
ia E
kono
mic
zna]
at 0
5:53
03
Janu
ary
2018
one and the country’s NOI position crosses the 0 level and becomespositive. Country location advantages are now mostly derived fromcreated assets. This stage, as well as the last (5th) one, is typical ofthe most developed countries. In stage 5 the NOI position first fallsand thereafter demonstrates a tendency to fluctuate around the 0 levelbut usually with both inward and outward FDI increasing.
Although, as Barry, Goerg and McDowell (2003) note, the IDPmodel is largely silent on the sectoral destinations of FDI inflowsand outflows (ibid., p. 347), general predictions re: the shifts in sector=industry composition and nature of FDI parallel to the IDP stagescan be derived from Dunning (1997) and Dunning and Narula (2002).
In stage 1, inflows of FDI are directed towards labour-intensivemanufacturing and the primary product sectors, such as miningand agriculture. Outward FDI is negligible or non-existent because‘‘the O-specific advantages of domestic firms are few and farbetween’’ (Dunning and Narula, 2002, p. 140).1 In stage 2, inwardFDI is predicted to remain largely in natural-resource-intensive sec-tors. However, it is supplemented by forward vertical integration intolabour-intensive production in light, relatively low-technology manu-facturing. Outward FDI, fuelled by the newly-acquired O-specificadvantages of domestic firms mostly in the production of semi-skilledand moderately knowledge-intensive consumer goods, will be eitherof a market-seeking or trade-related type, undertaken in adjacent ter-ritories, especially those further back in their IDP position, or of astrategic asset-seeking type, directed to developed countries. In stage3, the comparative advantage of labour-intensive production willdeteriorate as a result of an increase in domestic wages. This, in turn,will stimulate inward FDI to flow to technology-intensive manufac-turing and other industries capable of delivering higher value addedlocally. Motives for such inward FDI will shift towards efficiencyseeking production and, to some extent, towards strategic-asset acqui-sition. Outbound FDI will be driven by market-seeking strategies(directed more to countries at lower stages in their IDP) and strategicasset pursuit in other stage 3 or stage 4 countries to protect or upgradeadvantages of domestic (investing) firms. In a country enteringstage 4, production processes and products will be state of the artand foreign investment will be made in capital–rather than labour-intensive production by firms seeking strategic assets and rationalisingtheir value-adding activities across national borders. Accordingly, thiscountry’s L-specific advantages2 will be mostly or entirely based on
192 JOURNAL OF EAST-WEST BUSINESS
Dow
nloa
ded
by [
Aka
dem
ia E
kono
mic
zna]
at 0
5:53
03
Janu
ary
2018
created assets. Outward FDI will be motivated by the necessity tomaintain firms’ competitive advantage by moving operations losingcompetitiveness to countries in lower stages of their IDP. Finally, instage 5, which attracts most of Dunning’s (1997) and Dunning andNarula’s (2002) attention and analysis, indications of industry or sec-tor preferences of inbound or outbound FDI are mostly concealed inassertions that stage 5 highly developed, Triad countries show amarked convergence of their economic structures and that FDI inboth directions is increasingly of created asset- and efficiency-seekingnature, with greater emphasis on growth via strategic alliances as wellas mergers and acquisitions.
Parallel to its conceptual development, numerous empirical studieshave been undertaken to test the validity of the IDP model. Theliterature review reveals two main strands in these empirical studies.One strand represents multi-country studies using cross-sectionanalysis. The other strand of studies focuses on one country’s NOIposition either vis-a-vis all countries of the world or countries (worldregions) that represent the main destinations for FDI as well as themain source of FDI. The latter studies are longitudinal in nature(see Gorynia, Nowak and Wolniak, 2006 for a succinct review ofthe two strands of IDP studies).
Dunning and Narula (1996, p. 22 and 24–25) argue that a cross-sectional analysis across countries has severe limitations and can onlybe treated as a surrogate for longitudinal studies. As the IDP is essen-tially a dynamic concept, and every IDP is idiosyncratic and countryspecific, it can be best analysed on a country-by-country basis. Thisview is echoed by Dur�aan and Ubeda (2001). They argue that ‘‘thespeed and direction of movements along the various phases of IDPdepend on a set of factors that influence the economic structure ofa country and the type of investment it makes and receives’’ (ibid,p. 9). These factors include: presence of natural resources; geographicand cultural distance; size of a country; its economic system or devel-opment model, and its government policy. Furthermore, the use ofGDP as a proxy for development does not take into account thechanges of the economic structure of a country that progressesthrough the consecutive stages of the IDP. In particular, the IDPmodel implies systematic changes in the industry structure that paral-lel the changes in the net outward investment position. And yet, inboth the conceptual and empirical studies, the issue of the industrystructure of FDI that evolves when a country moves from one stage
Marian Gorynia, Jan Nowak, Radoslaw Wolniak 193
Dow
nloa
ded
by [
Aka
dem
ia E
kono
mic
zna]
at 0
5:53
03
Janu
ary
2018

of the IDP to another is rarely investigated, and even in these rarecases the sector=industry structure analysis is only supplementaryto the main topic. The authors of this paper were able to identify onlya handful of studies that devote more than cursory attention to theevolving industrial=sectoral structure of FDI in the context of IDP.Several of them are contained in the book edited by Dunning andNarula (eds.,1996), including contributions by:
. Clegg (1996) examining the UK’s IDP and looking at the country’sIDP position in three industry groups;
. Graham (1996) focusing on the 5th stage of the US IDP;
. Akoorie (1996) investigating the sectoral patterns of inward andoutward FDI in New Zealand;
. Calder�oon, Mortimore and Peres (1996) analysing, among otherthings, the impact of FDI on the production structure of theMexican economy;
. van Hoesel (1996) investigating Taiwan’s FDI and its impact onthe country’s industrialisation;
. Kumar, (1996) analysing India’s industrialisation, liberalisation aswell as inward and outward FDI during this country’s distinctdevelopment stages related to FDI;
. Zhang and Van Den Bulcke (1996) examining the IDP of Chinaand focusing on the changing government policy during the coun-try’s 15 years of transition to a market economy.
Also the studies by Twomey (2000) of the Canadian experiencewith the IDP, by Bellak (2001) of Austria’s IDP and by Barry, Georgand McDowell (2003) of the Irish IDP contain some sectoral analysisof inbound and outbound FDI. Twomey’s study is noteworthy, asit takes a very long-term view, investigating Canada’s IDP overthe twentieth century, and compares the Canadian experience withthat of several other countries, both developed and developing.
There are also studies that, although not using the IDP concept,investigate the effects of FDI on industry structure. Noteworthy inthis respect are studies of Barry (1999), and Barry and Kearney(2006). The former investigates the FDI and industry structure inIreland in comparison to Spain, Portugal and the UK, and findsimportant differences in the effects of FDI on industry structurebetween these countries, whereas the latter focuses on the role ofFDI in fostering the phenomenal growth of Ireland’s high-tech sectors.
194 JOURNAL OF EAST-WEST BUSINESS
Dow
nloa
ded
by [
Aka
dem
ia E
kono
mic
zna]
at 0
5:53
03
Janu
ary
2018

Among the very few studies that investigate IDPs of Central andEastern European countries, the work of Antal�ooczy and Eltet}oo(2003) on Hungary’s FDI provides an interesting point of compari-son due to the two countries, Hungary and Poland, being at a similarstage of their IDPs (although Hungary is positioned slightly ahead ofPoland in this respect). However, the Hungarian study focuses onoutward FDI and captures only two years (1999 and 2000) when itcomes to sectoral distribution of OFDI and, therefore, has a limitedcomparative value. Nevertheless, it reveals the dominance of manu-facturing, which accounts for over 60% of Hungary’s OFDI, withrefined petroleum being the most important investing industry (lar-gely due to MOL’s investments). Among the service sector’s indus-tries, trade and repairs represent the most important destination ofHungary’s outward investment.
Summing up, the empirical studies mentioned above point to cer-tain important shifts in sector and industry composition of bothinward and outward investment taking place when a country pro-gresses from one stage of the IDP to another. However, it is evidentthat these shifts are far from being uniform across countries. Clearlycountry-specific factors (idiosyncrasies) play an important role inshaping the sectoral and industrial patterns of FDI. For example,in the case of New Zealand the historic reforms initiated by thegovernment in 1984 led to a dramatic increase in the inflows of non-resource based FDI, particularly into the banking sector (Akoorie,1996). Likewise, India’s and China’s economic liberalisation policiesinduced the changing structure of inward and outward FDI (Kumar,1996; Zhang and Van Den Bulcke, 1996). And Taiwan’s dramaticallychanging sectoral distribution of inward and outward FDI can belinked to the country’s rapid industrialisation (van Hoesel, 1996).Some studies point even to paradoxes, such as the ‘‘renaissance’’ ofthe manufacturing sector as an FDI destination in the US observedby Graham (1996, p. 91). Similarly, the Canadian IDP study revealsthe dominance of manufacturing in the sectoral distribution ofIFDI over the most part of the last century, in spite of the growingimportance of the service sector. It can therefore be argued thatDunning’s predictions regarding sectoral investment patterns inrelation to a country’s IDP may not always find full confirmationin the referenced empirical studies.
In the following sections, the idiosyncrasies of Poland’s sectorand industry composition of FDI inflows and outflows are analysed
Marian Gorynia, Jan Nowak, Radoslaw Wolniak 195
Dow
nloa
ded
by [
Aka
dem
ia E
kono
mic
zna]
at 0
5:53
03
Janu
ary
2018

in the context of her IDP. In contrast to the empirical studiesreviewed, in which the issue of sector=industry structure of FDIinflows and outflows is basically viewed as supplementary to themain topic of a country’s IDP, the present paper is entirely devotedto the analysis of such structure and its policy implications.
FDI INFLOWS
Since the whole period under investigation in the present study(1996–2005) has been identified in previous research as representingstage 2 of Poland’s IDP, the sector=industry analysis of FDI inflowsand outflows which follows, reflects the degree of their concurrencewith that stage in J. Dunning’s original IDP model.
The data breakdown of the Polish economy made by the NationalBank of Poland and considered by the authors as the most reliablesource creates nonetheless a certain problem relating to the termin-ology and level of aggregation employed. Nominally the country’seconomic potential and in this case the target of FDI inflows is splitinto sectors (kinds of economic activities). However with the excep-tion of one entry, that of ‘‘manufacturing’’, which does indeed rep-resent a full fledged sector and (as the sole entry) is thus brokendown into its constituent components: different industries. Suchapproach complicates economic analysis and drawing conclusionssince the units of analysis are of unequal content and compositionand therefore may be difficult to compare. This reservation thenshould be taken into account in interpreting the results that follow.
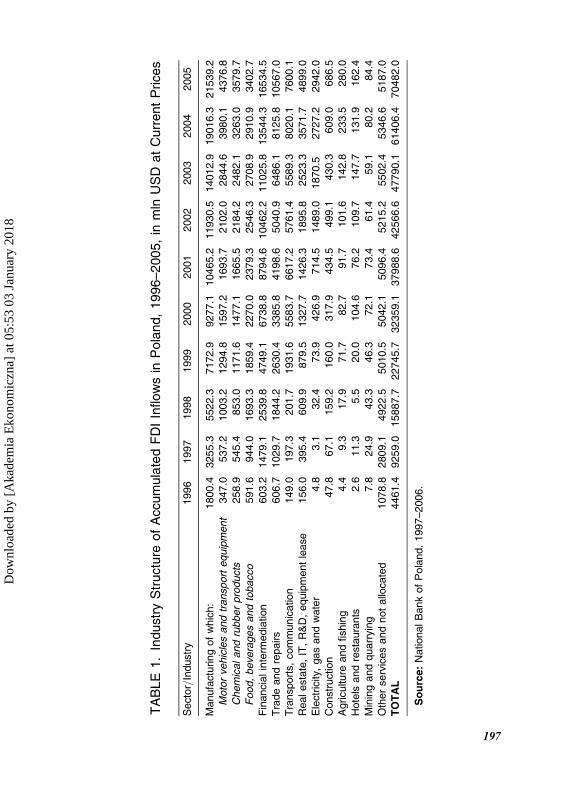
As shown in Tables 1 and 2, out of the ten sectors of the Polisheconomy having been the object of significant FDI inflows fromabroad, i.e. having received at least 0.1% of the cumulative totalFDI in 2005, only three (manufacturing, construction plus miningand quarrying) have revealed a diminishing absorption pattern inthe studied time period. The greatest decrease was observed inmanufacturing, from 40.4% in 1996 to 30.6% in 2005, with a markedsub-period of decline to 27.5% in 2001 and then of growth up to 31%in 2004. But in absolute terms FDI in manufacturing grew uninter-ruptedly almost 12 times from over 1.8 billion USD in 1996 to morethan 21.5 billion USD in 2005.
Available data allow for a deeper probe into the industry com-ponents of manufacturing. The sharpest drop, from 13.3% in 1996
196 JOURNAL OF EAST-WEST BUSINESS
Dow
nloa
ded
by [
Aka
dem
ia E
kono
mic
zna]
at 0
5:53
03
Janu
ary
2018
TA
BLE
1.
Industr
yS
tructu
reof
Accum
ula
ted
FD
IIn
flow
sin
Pola
nd,
1996–2005,
inm
lnU
SD
at
Curr
ent
Prices
Secto
r=In
dustr
y1996
1997
1998
1999
2000
2001
2002
2003
2004
2005
Manufa
ctu
ring
of
whic
h:
1800.4
3255.3
5522.3
7172.9
9277.1
10465.2
11930.5
14012.9
19016.3
21539.2
Moto
rvehic
les
and
transport
equip
ment
347.0
537.2
1003.2
1294.8
1597.2
1693.7
2102.0
2844.6
3980.1
4376.8
Chem
icaland
rubber
pro
ducts
258.9
545.4
853.0
1171.6
1477.1
1665.5
2184.2
2482.1
3263.0
3579.7
Food,
bevera
ges
and
tobacco
591.6
944.0
1693.3
1859.4
2270.0
2379.3
2546.3
2708.9
2910.9
3402.7
Fin
anci
alin
term
edia
tion
603.2
1479.1
2539.8
4749.1
6738.8
8794.6
10462.2
11025.8
13544.3
16534.5
Tra
de
and
repairs
606.7
1029.7
1844.2
2630.4
3385.8
4198.6
5040.9
6486.1
8125.8
10567.0
Tra
nsport
s,
com
munic
atio
n149.0
197.3
201.7
1931.6
5583.7
6617.2
5761.4
5589.3
8020.1
7600.1
Realesta
te,
IT,
R&
D,
equip
ment
lease
156.0
395.4
609.9
879.5
1327.7
1426.3
1895.8
2523.3
3571.7
4899.0
Ele
ctr
icity
,gas
and
wate
r4.8
3.1
32.4
73.9
426.9
714.5
1489.0
1870.5
2727.2
2942.0
Constr
uction
47.8
67.1
159.2
160.0
317.9
434.5
499.1
430.3
609.0
686.5
Agricultu
reand
fishin
g4.4
9.3
17.9
71.7
82.7
91.7
101.6
142.8
233.5
280.0
Hote
lsand
resta
ura
nts
2.6�
11.3
�5.5
20.0
104.6
76.2
109.7
147.7
131.9
162.4
Min
ing
and
quarr
yin
g7.8
24.9
43.3
46.3
72.1
73.4
61.4
59.1
80.2
84.4
Oth
er
serv
ices
and
not
allo
cate
d1078.8
2809.1
4922.5
5010.5
5042.1
5096.4
5215.2
5502.4
5346.6
5187.0
TO
TA
L4461.4
9259.0
15887.7
22745.7
32359.1
37988.6
42566.6
47790.1
61406.4
70482.0
So
urc
e:
NationalB
ank
of
Pola
nd.
1997–2006.
197
Dow
nloa
ded
by [
Aka
dem
ia E
kono
mic
zna]
at 0
5:53
03
Janu
ary
2018

TA
BLE
2.
Industr
yS
tructu
reof
Accum
ula
ted
Perc
enta
ge
Share
sof
FD
IIn
flow
sin
Pola
nd,
1996–2005
Secto
r=In
dustr
y1996
1997
1998
1999
2000
2001
2002
2003
2004
2005
Manufa
ctu
ring,
of
whic
h:
40.4
35.2
34.8
31.5
28.7
27.5
28.0
29.3
31.0
30.6
Moto
rvehic
les
&T
ransport
equip
em
ent
7.8
5.8
6.3
5.7
4.9
4.5
4.9
6.0
6.5
6.2
Chem
icaland
rubber
pro
ducts
5.8
5.9
5.3
5.2
4.6
4.4
5.2
5.1
5.3
5.1
Food,
bevera
ges
and
tobacco
13.3
10.2
10.7
8.2
7.0
6.3
6.0
5.7
4.7
4.8
Fin
anci
alin
term
edia
tion
13.5
16.0
16.0
20.9
20.8
23.2
24.6
23.1
22.1
23.5
Tra
de
and
repairs
13.6
11.1
11.6
11.6
10.5
11.1
11.8
13.6
13.2
15.0
Tra
nsport
s,
com
munic
atio
n3.3
2.1
1.3
8.5
17.3
17.4
13.5
11.7
13.1
10.8
Realesta
te,
IT,
R&
D,
equip
ment
lease
3.5
4.3
3.8
3.9
4.1
3.8
4.5
5.3
5.8
7.0
Ele
ctr
icity
,gas
and
wate
r0.1
0.0
0.2
0.3
1.3
1.9
3.5
3.9
4.4
4.2
Constr
uction
1.1
0.7
1.0
0.7
1.0
1.1
1.2
0.9
1.0
1.0
Agricultu
reand
fishin
g0.1
0.1
0.1
0.3
0.3
0.2
0.2
0.3
0.4
0.4
Hote
lsand
resta
ura
nts
0.1
�0.1
�0.0
0.1
0.3
0.2
0.3
0.3
0.2
0.2
Min
ing
and
quarr
yin
g0.2
0.3
0.3
0.2
0.2
0.2
0.1
0.1
0.1
0.1
Oth
er
serv
ices
and
not
allo
cate
d24.2
30.3
31.0
22.1
15.5
13.4
12.3
11.5
8.7
7.3
TO
TA
L100.0
100.0
100.0
100.0
100.0
100.0
100.0
100.0
100.0
100.0
No
te:
Min
us
(�)
sig
nsig
nifie
sdis
investm
ent=
withdra
walof
capitalto
investo
r’s
hom
ecountr
y.
Perc
enta
ge
share
sm
ay
not
add
up
to100
because
of
roundin
g.
So
urc
e:
NationalB
ank
of
Pola
nd.
1997–2006.
198
Dow
nloa
ded
by [
Aka
dem
ia E
kono
mic
zna]
at 0
5:53
03
Janu
ary
2018

to 4.8% in 2005, occurred in food, beverages and tobacco industriescombined, followed by much smaller decreases in motor vehicles andtransport equipment (from 7.8% in 1996 to 6.2% in 2005) and chemi-cal and rubber products (from 5.8% to 5.1% respectively). Howeverthere was one industry pool on the rise (wood, paper, publishing andprinting), starting with only a 0.2% share of the total in 1996 andreaching 3% in 2005. In nominal terms and at current prices all thoseindustries showed dramatic increases during the studied decade: thelargest (over 56.5 times) observed in wood, paper, publishing andprinting, followed by chemical and rubber products (13.8 times),the motor industry (12.6 times) and finally food, beverages andtobacco (‘‘only’’ 5.8 times).
Dunning (1997, p. 237) indicates that at the beginning of stage 2FDI inflows are attracted by the manufacturing industries withadvantage of foreign investors residing in technology, trademarksand managerial skills. In the case of Poland the order of importanceof the said advantage was first and foremost in branding (trade-marks), then in superior managerial competencies and lastly in tech-nology, though usually not of the state of the art category. Thissequence reflected the development gap separating domestic Polishfirms from their foreign competitors which was perceived by the latteras evidence of weak domestic competition thus allowing the exploi-tation of advantages related in the first place to strong internationalbrands and managerial know how and only secondarily to technologywhich was standard and moving towards becoming obsolete.
In 1996 and at the beginning of IDP stage 2 there was a clear domi-nance of light, relatively low-technology manufacturing of mass con-sumer goods (food, beverages and tobacco) with an FDI value of591.6 million USD. This fact supported the leading role in thoseindustries of foreign brands and managerial expertise, specifiedabove, as key determinants of FDI inflows. Then followed a 5.5 per-centage point gap separating these industries from motor vehicles andtransport equipment (also with a consumer, non-industrial focus),receiving 347 million USD in foreign investment. The industrialgoods sector was represented by a sizable share of technology inten-sive chemical and rubber industries (258.9 million USD).
In 2005, at the projected ending phase of stage 2 of Poland’s IDP,the industry ranking had changed radically. The motor industrybecame the leader with over 4.4 billion USD in FDI, followed closelyby chemicals and rubber (3.6 billion USD). Thereafter came the
Marian Gorynia, Jan Nowak, Radoslaw Wolniak 199
Dow
nloa
ded
by [
Aka
dem
ia E
kono
mic
zna]
at 0
5:53
03
Janu
ary
2018

losing industries of food, beverages and tobacco with 3.4 billion USDplus the gaining industries of wood, paper, publishing and printing(2.3 billion USD). The overall tendency was to move towards moretechnology intensive manufacturing and higher value added locallywhich Dunning characterised as the starting profile of stage 3 FDIinflows (Dunning, 1997, p. 237).
Besides manufacturing, the other two declining sectors were con-struction plus location bound, resource based mining and quarrying.Both showed throughout the analysed time period relatively smallfluctuations of their shares in total FDI inflows with the end resultsbeing only slightly worse than at the beginning and both their shares(but especially that of mining and quarrying) indicating a verymarginal role in the said inflows. However, in nominal USD FDIin construction rose 14.4 times to a level of 686.5 million USD andin mining and quarrying 10.8 times to 84.4 million USD.
The seven FDI growth oriented inflow sectors of the Polish econ-omy were led by financial intermediation, a term which covers bank-ing, insurance and investment services. This sector’s share rose by astartling 10 percentage points to reach the level of 23.5% in 2005,and an FDI investment level of over 16.5 billion USD, 27.4 times lar-ger than in 1996. The next fast growth sector was transports and com-munication, going up from 3.3% to 10.8% and from 149 millionUSD to 7.6 billion USD between 1996 and 2005, and the utilities-electricity, gas and water-rising from a mere 0.1% (4.8 millionUSD) to 4.2% (over 2.9 billion USD), giving an increase of 613times) over the studied period. In the former sector the key role couldbe attributed to international logistics firms and foreign telecom com-panies. A smaller growth rate was observed for the combination ofreal estate, IT, R&D and equipment lease (from 3.5% to 7%) butin absolute numbers growth reached 31.4 times the initial value of156 million USD going up to 4.9 billion USD in 2005. A still smallerincrease occurred in trade and repairs: from 13.6% to only 15% andfrom 606.7 million USD to 10.6 billion USD between 1996 and 2005(up 17.4 times).
If the three leading share sectors in 2005 for inflowing FDI (i.e.financial intermediation plus trade and repairs plus transports andcommunication) are added up and treated as one service sector(which includes of course also other industries, such as hotels andrestaurants) its cumulative share (49.3%) and FDI of over 34.7 bil-lion USD elevates it to the most important sector for FDI inflows.
200 JOURNAL OF EAST-WEST BUSINESS
Dow
nloa
ded
by [
Aka
dem
ia E
kono
mic
zna]
at 0
5:53
03
Janu
ary
2018
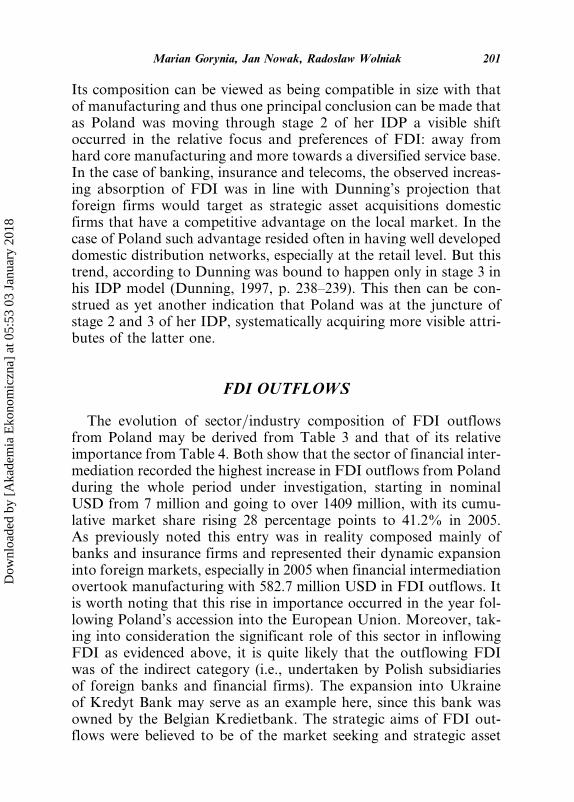
Its composition can be viewed as being compatible in size with thatof manufacturing and thus one principal conclusion can be made thatas Poland was moving through stage 2 of her IDP a visible shiftoccurred in the relative focus and preferences of FDI: away fromhard core manufacturing and more towards a diversified service base.In the case of banking, insurance and telecoms, the observed increas-ing absorption of FDI was in line with Dunning’s projection thatforeign firms would target as strategic asset acquisitions domesticfirms that have a competitive advantage on the local market. In thecase of Poland such advantage resided often in having well developeddomestic distribution networks, especially at the retail level. But thistrend, according to Dunning was bound to happen only in stage 3 inhis IDP model (Dunning, 1997, p. 238–239). This then can be con-strued as yet another indication that Poland was at the juncture ofstage 2 and 3 of her IDP, systematically acquiring more visible attri-butes of the latter one.
FDI OUTFLOWS
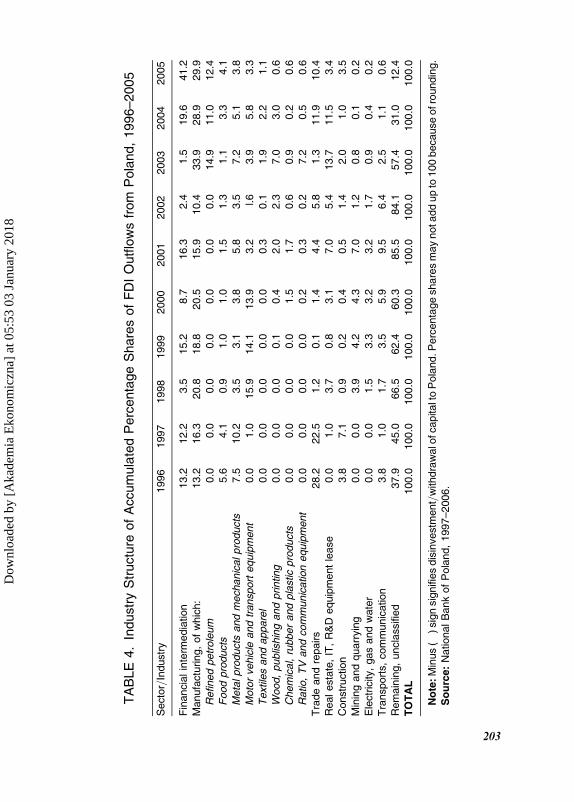
The evolution of sector=industry composition of FDI outflowsfrom Poland may be derived from Table 3 and that of its relativeimportance from Table 4. Both show that the sector of financial inter-mediation recorded the highest increase in FDI outflows from Polandduring the whole period under investigation, starting in nominalUSD from 7 million and going to over 1409 million, with its cumu-lative market share rising 28 percentage points to 41.2% in 2005.As previously noted this entry was in reality composed mainly ofbanks and insurance firms and represented their dynamic expansioninto foreign markets, especially in 2005 when financial intermediationovertook manufacturing with 582.7 million USD in FDI outflows. Itis worth noting that this rise in importance occurred in the year fol-lowing Poland’s accession into the European Union. Moreover, tak-ing into consideration the significant role of this sector in inflowingFDI as evidenced above, it is quite likely that the outflowing FDIwas of the indirect category (i.e., undertaken by Polish subsidiariesof foreign banks and financial firms). The expansion into Ukraineof Kredyt Bank may serve as an example here, since this bank wasowned by the Belgian Kredietbank. The strategic aims of FDI out-flows were believed to be of the market seeking and strategic asset
Marian Gorynia, Jan Nowak, Radoslaw Wolniak 201
Dow
nloa
ded
by [
Aka
dem
ia E
kono
mic
zna]
at 0
5:53
03
Janu
ary
2018

TA
BLE
3.
Industr
yS
tructu
reof
Accum
ula
ted
FD
IO
utflo
ws
from
Pola
nd,
1996–2005,
inm
lnU
SD
at
Curr
ent
Prices
Secto
r=In
dustr
y1996
1997
1998
1999
2000
2001
2002
2003
2004
2005
Fin
anci
alin
term
edia
tion
7.0
11.8
15.0
69.0
41.1
�62.8
15.3
14.2
353.1
1941.3
Manufa
ctu
ring
of
whic
h:
7.0
15.8
88.7
85.4
97.0
61.6
65.0
321.0
520.3
1409.9
Refined
petr
ole
um
0.0
0.0
0.0
0.0
0.0
0.0
0.0
141.1
197.6
582.7
Food
pro
ducts
3.0
4.0
4.0
4.4
4.6
5.9
8.0
10.3
59.1
195.0
Meta
land
mech
anic
alpro
ducts
4.0
9.8
15.1
14.0
18.0
22.5
22.2
67.9
92.0
178.8
Moto
rvehic
leand
transport
equip
ment
0.0
1.0
67.7
64.4
65.6
12.4
10.3
37.3
104.8
154.4
Textile
and
appare
l0.0
0.0
0.0
0.2
0.2
1.3
0.3
18.3
39.3
53.5
Wood,
publis
hin
gand
printin
g0.0
0.0
0.0
0.6
1.9
7.6
14.3
�66.5
�54.0
29.7
Chem
ical,
rubber
and
pla
stic
pro
ducts
0.0
0.0
0.0
0.0
7.2
6.4
3.6
�8.6
�3.5
30.6
Radio
,T
Vand
com
munic
ation
equip
ment
0.0
0.0
0.0
0.0
�1.0
�1.0
�1.0
68.0
�8.9
28.6
Tra
nsport
s,
and
repairs
14.9
21.8
5.1
0.3
6.7
�17.1
�36.4
�11.9
214.2
489.2
Realesta
te,
IT,
R&
D,
equip
ment
lease
0.0
1.0
15.6
3.8
14.6
27.2
33.9
129.7
206.6
159.0
Constr
uction
2.0
6.8
3.7
�0.9
1.9
2.0
�8.9
�18.8
�17.7
167.0
Min
ing
and
quarr
yin
g0.0
0.0
16.7
19.2
20.1
27.2
7.7
8.0
�1.8
10.7
Ele
ctr
icity
,gas
and
wate
r0.0
0.0
�6.3
�15.1
�15.1
�12.4
�10.8
�8.8
�7.5
�7.5
Tra
nsport
s,
com
munic
atio
n2.0
�1.0
7.3
15.8
27.7
36.6
40.1
�23.2
�20.6
�30.2
Rem
ain
ing,
uncla
ssifie
d20.0
43.5
283.2
284.3
284.6
330.6
526.1
543.0
557.1
584.8
TO
TA
L52.8
96.7
425.9
455.1
472.2
386.2
625.4
946.0
1797.3
4714.2
No
te:
Min
us
(�)
sig
nsig
nifi
es
dis
investm
ents=w
ithdra
walof
capitalto
Pola
nd.
So
urc
e:
NationalB
ank
of
Pola
nd,
1997–2006.
202
Dow
nloa
ded
by [
Aka
dem
ia E
kono
mic
zna]
at 0
5:53
03
Janu
ary
2018
TA
BLE
4.
Industr
yS
tructu
reof
Accum
ula
ted
Perc
enta
ge
Share
sof
FD
IO
utflo
ws
from
Pola
nd,
1996–2005
Secto
r=In
dustr
y1996
1997
1998
1999
2000
2001
2002
2003
2004
2005
Fin
anci
alin
term
edia
tion
13.2
12.2
3.5
15.2
8.7
�16.3
2.4
1.5
19.6
41.2
Manufa
ctu
ring,
of
whic
h:
13.2
16.3
20.8
18.8
20.5
15.9
10.4
33.9
28.9
29.9
Refined
petr
ole
um
0.0
0.0
0.0
0.0
0.0
0.0
0.0
14.9
11.0
12.4
Food
pro
ducts
5.6
4.1
0.9
1.0
1.0
1.5
1.3
1.1
3.3
4.1
Meta
lpro
ducts
and
mech
anic
alpro
ducts
7.5
10.2
3.5
3.1
3.8
5.8
3.5
7.2
5.1
3.8
Moto
rvehic
leand
transport
equip
ment
0.0
1.0
15.9
14.1
13.9
3.2
l.6
3.9
5.8
3.3
Textile
sand
appare
l0.0
0.0
0.0
0.0
0.0
0.3
�0.1
1.9
2.2
1.1
Wood,
publis
hin
gand
printin
g0.0
0.0
0.0
0.1
0.4
2.0
2.3
�7.0
�3.0
0.6
Chem
ical,
rubber
and
pla
stic
pro
ducts
0.0
0.0
0.0
0.0
1.5
1.7
0.6
�0.9
�0.2
0.6
Ratio,
TV
and
com
munic
ation
equip
ment
0.0
0.0
0.0
0.0
�0.2
�0.3
�0.2
7.2
�0.5
0.6
Tra
de
and
repairs
28.2
22.5
1.2
0.1
1.4
�4.4
�5.8
�1.3
11.9
10.4
Realesta
te,
IT,
R&
Dequip
ment
lease
0.0
1.0
3.7
0.8
3.1
7.0
5.4
13.7
11.5
3.4
Constr
uction
3.8
7.1
0.9
�0.2
0.4
0.5
�1.4
�2.0
�1.0
3.5
Min
ing
and
quarr
yin
g0.0
0.0
3.9
4.2
4.3
7.0
1.2
0.8
�0.1
0.2
Ele
ctr
icity
,gas
and
wate
r0.0
0.0
�1.5
�3.3
�3.2
�3.2
�1.7
�0.9
�0.4
�0.2
Tra
nsport
s,
com
munic
atio
n3.8
�1.0
1.7
3.5
5.9
9.5
6.4
�2.5
�1.1
�0.6
Rem
ain
ing,
uncla
ssifie
d37.9
45.0
66.5
62.4
60.3
85.5
84.1
57.4
31.0
12.4
TO
TA
L100.0
100.0
100.0
100.0
100.0
100.0
100.0
100.0
100.0
100.0
No
te:M
inus
(�)sig
nsig
nifie
sdis
investm
ent=
withdra
walo
fcapita
lto
Pola
nd.P
erc
enta
ge
share
sm
ay
notadd
up
to100
because
ofro
undin
g.
So
urc
e:
NationalB
ank
of
Pola
nd,
1997–2006.
203
Dow
nloa
ded
by [
Aka
dem
ia E
kono
mic
zna]
at 0
5:53
03
Janu
ary
2018
seeking type, in line with Dunning’s general predictions in stage 2 ofhis IDP model (Dunning, 1997). It is also worth noting that there wasa steep fall in the relative share of this branch in 2001 reflecting thelargest general slowdown in the annual FDI inflows and outflowsregistered so far.
Manufacturing was second in importance in FDI outflows, risingalmost 17 percentage points in its total accumulated share and alsoexhibiting considerable fluctuations in this share throughout the stud-ied time period. If its component industries are examined it appearsthat petroleum had the largest influence starting from 2003 with aFDI value of 141.1 million USD, being curiously absent in all the pre-vious years and moving up to 582.7 million USD in 2005. Food pro-ducts moved from 3 million USD and a 5.6% share in 1996 to a lowof 0.9% in 1998 (but reaching 4 million USD) and then fluctuatingsomewhat, slowly climbed back to 4.1% and 195 million USD in2005. The share of metal and mechanical products also declined, fluc-tuating from 7.5% to 3.8%, but rose in absolute terms from 4 to178.8 million in 2005. Motor vehicles and transport equipmentshowed larger fluctuations and, as the net result, fell to a modest3.3% in 2005 with a value of 154.4 million USD.
Trade and repairs showed an overall declining trend from 28.2% to10.4%, countered only by three annual periods when their share hadimproved. This still gave the sector a firm third place behind manu-facturing in the share of FDI outflows with investment for 489.2 mil-lion USD in 2005, reflecting either the competitive advantage of lowtechnology, labour intensive Polish service firms or the preference ofsuch firms to use exports as the main venue of expanding into foreignmarkets.
The somewhat strange grouping of real estate, IT, R&D plusequipment lease started with a 1% share and 1 million in FDI, in1997, rising with fluctuations to a peak of 13.7% in 2003 to settledown on a low 3.4%, being equivalent however to 159 millionUSD in 2005. These sectors generally required from Polish firms highcapital inputs and competitive, advanced technological capacities andcompetences indicating a desired, increased generation of theseownership advantages for use in foreign markets.
Construction can be associated with Polish firms abroad as a rela-tively labour intensive sector and as such did not change much itsshare in the period under study, going down from 3.8% in 1996 to3.5% in 2005 but at the same time going up from 2 to 167 million
204 JOURNAL OF EAST-WEST BUSINESS
Dow
nloa
ded
by [
Aka
dem
ia E
kono
mic
zna]
at 0
5:53
03
Janu
ary
2018

USD. However in between it had four years of disinvestments asso-ciated most likely with the fact that it was primarily market seekingand that the targeted foreign markets showed considerable volatilityof demand.
Among the remaining sectors of some significance in outward FDIwere, in the material goods category, mining and quarrying and, inservices, transports and communication. Although the former hada share of only 0.2% and 10.7 million USD of FDI in 2005 it experi-enced a period of growth from 3.9% in 1998 to 7% in 2001 reaching apeak of 27.2 million USD. In case of the latter, growth occurred inthe same years but was stronger (from 1.7% or 7.3 million USD to9.5% or 36.6 million USD) but then decreased more dramatically,ending with a disinvestment of 1.1% in 2004 and 0.6% (�30.2 mil-lion USD) in 2005.
The last three sectors for which data are available, i.e. hotels andrestaurants, agriculture and fishing, and electricity, gas and water,showed throughout the whole time period disinvestments and thusindicated that Polish firms in these areas of economic activity wereeither too weak financially or did not have sufficient competitiveadvantage to enter foreign markets via FDI. It is also worth notingthat these sectors were generally characterised by relatively lowcapital intensity and technology absorption and thus, contrary toreported data, could have been conceived as offering more opportu-nities and easier access to the said competitive advantage for firmsfrom an emerging market such as Poland.
The final entry for accumulated FDI outflows bears the rathermysterious label ‘‘remaining and unclassified’’. One could aptly quotein this case the cliche expression: ‘‘last but not least’’, since, except theyear 2005, the FDI shares in this case have been the largest (reaching557.1 million USD in 2004) and exceeded those for financial interme-diation (353.1 million USD in 2004) or manufacturing (520 millionUSD in 2004). From 1998 to 2003 the cumulative shares in this cate-gory surpassed 50% of total FDI reaching, in 2001, the level of85.5% or 330 million USD. What is hidden behind those surprisinglyhigh percentages and absolute values is unclear. One possible expla-nation is that taking into account for example the geographic struc-ture of FDI outflows from Poland for the year 2004, where twocountries, Switzerland and Holland, dominate with a combined shareof 53.2% (Wolniak, 2006), the motive might have been capital flightand subsequent formation in those two locations of financial entities
Marian Gorynia, Jan Nowak, Radoslaw Wolniak 205
Dow
nloa
ded
by [
Aka
dem
ia E
kono
mic
zna]
at 0
5:53
03
Janu
ary
2018

for further FDI without Polish identity and various accompanying‘‘cumbersome’’ obligations (for example in the sphere of reportingor taxation).
CONCLUSIONS
Departing from the assumption that Poland is a mature transitioneconomy, the following observations can be made regarding the sec-tor=industry cross section of inflowing FDI, as the country movedthrough stage 2 of its IDP:
1. Throughout the decade under investigation the accumulated valueof FDI outflows was by far smaller than that of FDI inflows, ran-ging from 1.2% (the share of accumulated FDI outflows in accu-mulated FDI inflows) in 1996 to 6.7% in 2005. This asymmetryreflected the continuing, albeit decreasing, disparity between theoverall competitiveness of domestic Polish firms and their foreign=multinational rivals.3
2. From 1996 to 2005 accumulated FDI inflows rose 15.8 timesreaching the value of over 70.5 billion USD, indicating thatPoland, with her large internal market and a growing pool of cre-ated assets, offered attractive investment opportunities.
3. In FDI inflows the dominance of manufacturing was systemati-cally eroded by growth of the service sector, led by such industriesas banking, trade, transport and communications. In trade themost prominent and visible role was attributed to large, inter-national, especially French and German retail distribution chainssuch as Carrefour, Auchan and Lidl.
4. Starting from 1999, the entire service sector became the new leaderin absorbing incoming FDI, replicating a similar trend in moredeveloped countries.
5. Managing to defend their positions with relatively small losses inthe share of FDI inflows were those industries within manufactur-ing that are technology and capital intensive, focused both on con-sumer and industrial markets. Best examples in the Polish casehave been motor vehicles (with investing firms such as GeneralMotors, Volkswagen, Toyota and Fiat) and chemical as well asrubber products, illustrated by the increasing presence of firms like
206 JOURNAL OF EAST-WEST BUSINESS
Dow
nloa
ded
by [
Aka
dem
ia E
kono
mic
zna]
at 0
5:53
03
Janu
ary
2018

Procter & Gamble, Henkel and Benckiser, as well as Bridgestone,Michelin and Goodyear.
6. A change occurred within the light manufacturing sector: the gapleft by the demise of food, beverages and tobacco was filled bywood, paper, publishing and printing. Or looking from a beha-vioural=needs perspective: once basic needs had been satisfied bythe food et al group of industries they were substituted by themore sophisticated ones, catered to by companies from the printmedia industry, such as the German Bauer und Jahr or the SwissMediapresse.
7. The market seeking motive was prevalent in the growth of realestate and the utilities, whereas the drive to improve efficiencywas visible in FDI in IT as well as R&D activities.
8. The remaining sectors, consisting of a wide assortment ragingfrom agriculture and fishing, through construction to services likehotels and restaurants and ending with the extractive sector,played a negligible role, mainly due to lack of sufficient locationadvantages and local assets, both natural and created.
As for outflowing FDI the following tendencies emerged in stage 2of Poland’s IDP:
1. During the studied period, the accumulated FDI outflows rose89.3 times, growing much faster than FDI inflows, and reachedthe value of over 4.7 billion USD in 2005.
2. Throughout the studied period, but only up to the end of 2003,manufacturing appeared as the leading sector for FDI flowingout of Poland. Thereafter the service sector took over, dominatedby banks and other financial institutions (financial intermediation)plus trade and repairs. The coincidence here with Poland’saccession to the EU as full member in 2004 may offer an expla-nation to this change in leadership. In these services market andstrategic asset seeking motives seem to be the prevailing ones. Thusa similar trend has been observed in FDI inflows and outflows withthe difference lying in the definite, dominating foreign provenanceof firms investing in Poland and the unknown real proportions ofthe origin of firms investing out of Poland, i.e. whether they werePolish owned or MNC subsidiaries operating in Poland.
3. Within manufacturing, capital intensive and technology orientedindustries such as metal and mechanical products, plus the motor
Marian Gorynia, Jan Nowak, Radoslaw Wolniak 207
Dow
nloa
ded
by [
Aka
dem
ia E
kono
mic
zna]
at 0
5:53
03
Janu
ary
2018

industry, were observed as being in the lead until 2003 but thengiving in to petroleum as the new leader. In the case of the latter,FDI can be practically traced to expansion, via acquisitions ofstrategic assets, of Orlen, Poland’s largest petroleum companyby annual revenue. A similar situation was reported earlier withrespect to the Hungarian petroleum giant–MOL.
4. The meaningful share of construction was mainly related to theownership advantages of Polish firms, stemming from the pos-session of highly skilled and relatively cheap workers and engi-neers, while the observed (share) fluctuations could be partlyexplained by the sector’s sensitivity to changes in the businesscycles in the foreign markets.
5. Thus it can be observed that in stage 2 of the IDP there has been avery limited spread=profile of sectors=industries generating FDIout of Poland, reflecting mainly Polish firms’ still relatively weakcompetitive advantages and=or their embedded preference to stillconsider exporting as the ultimate method of sustaining marketpresence abroad (Gorynia and Wolniak, 2003).
The dynamics and sector=industry distribution of FDI inflows andoutflows seem to be pointing to an evolving structure of the Polisheconomy which to a high degree reflects and replicates such structuralchange which the highly developed countries have already gonethrough in the past. Thus far the general assumptions of the originalDunning IDP model seem to be holding quite well. But there is alsothe idiosyncratic aspect of this model in its ‘‘Polish edition’’ which isseen in the extended length (time wise) of stage 2. The match of thesucceeding stages of Poland’s IDP with Dunning’s model is yet tobe seen and investigated. This then sets out the key avenues for futureresearch in both the geographical and industry composition ofPoland’s IDP. Comparative studies with other economies of similarpotential (e.g. Spain) or similar positioning on the IDP in other tran-sition countries (e.g. Hungary) should also yield more insight, under-standing and applicability of the IDP concept.
POLICY IMPLICATIONS
Policy recommendations offered by Dunning in his IDP modelare rather scant (Dunning 1997, p. 237–238). In stage 1 government
208 JOURNAL OF EAST-WEST BUSINESS
Dow
nloa
ded
by [
Aka
dem
ia E
kono
mic
zna]
at 0
5:53
03
Janu
ary
2018
intervention, in order to stimulate FDI inflows, takes the form ofproviding basic infrastructure and upgrading human capital via edu-cation and training. Economic policies are supposed to focus onimport protection via domestic content regulations and export sub-sidies. There is also limited government involvement in upgradingdomestic created assets via innovatory capacity stimulation(Dunning, ibid.).
In stage 2 of the ideal IDP, the main trends of government policytoward inflowing FDI do not differ from those identified in stage 1.Import protection embraces now also tariff and non-tariff barriersand stress is on development of domestic firms’ technological capa-bilities. Outward FDI is influenced by government-induced push fac-tors, very similar to those recommended for FDI inflows: exportsubsidies and technology development or acquisition (Dunning,ibid.).
Poland has only partially followed those prescriptions in her econ-omic policies so far. Extensive import protection measures wereapplied in stage 1, but were falling in stage 2, especially in trade withthe EU countries as the 2004 entry into the EU drew closer. Infra-structure development, both in stage 1 and 2, has been quite visiblebut still much lies ahead, especially in creating a network of motor-ways compatible with EU standards. The most visible advances sofar have been in telecommunications, education and training.
A redirection of attention is necessary to focus more on outwardrather than on inward FDI. In strengthening competition of Polishvis-a-vis foreign firms, and in stimulating outward FDI, the weakestpoint however has been the practical absence of a comprehensive andcoherent government program of technological upgrading and devel-opment oriented towards domestic firms. This weakness is turninggradually into a pressing need as Poland attempts to pass into stage3 of her IDP and Polish firms are beset by this technological gapwhich hinders their competitiveness in foreign markets, especially incountries positioned in more advanced stages of their IDP.
An alternative solution lies of course in providing those firms withfunds for which they could develop or secure access to new technol-ogies and products without or with minimal direct government assist-ance. Such support could take the form of government inducedfinancial and fiscal measures as well as fostering and promoting mer-gers and acquisitions or business alliance formation, the notion ofwhich is still quite alien to most small and medium sized Polish firms.
Marian Gorynia, Jan Nowak, Radoslaw Wolniak 209
Dow
nloa
ded
by [
Aka
dem
ia E
kono
mic
zna]
at 0
5:53
03
Janu
ary
2018

The market alternative for funding technology development shouldinclude state encouragement of venture capital and=or private equityinvestments via privatisation of state holdings in large companies inR&D intensive industries.
Also in order to reinforce the identified trend of the growth inimportance of the service industries, the above measures should havesuch sectoral focus clearly delineated. Nevertheless the manufactur-ing sector requires more technology upgrading as well, directedtowards the identified industry leaders: mechanical and metal pro-ducts, the motor industry and petroleum. And lastly, more efforton the part of government promotion programs is needed to investi-gate and change the negative country image effects afflicting sales ofPolish products abroad, especially in the services and industrialproduct categories, attempting to compete with local and globalplayers with well known and established brands.
END NOTES
1. O-specific advantages denote ownership advantages of firms, such as brand name,
ownership of proprietary technology, or lower costs due to economies of scale.
2. L-specific advantages denote a country’s advantages as a locus for investment vis-a-vis
other countries. Such advantages may include large markets, low input costs, tax and financial
incentives, or strategic geographic location.
3. For a comprehensive analysis of Poland’s competitiveness, see Weresa (2007).
REFERENCES
Antal�ooczy, Katalin and Eltet}oo, Andrea (2003). Outward Foreign Direct Investmentin Hungary. Motivation and Effects. In Marjan Svetlicic, and Matija Rojec (Eds.),Facilitating Transition by Internationalization: Outward Direct Investment fromCentral European Economies in Transition. Aldershot: Ashgate, 155–174.
Akoorie, M. (1996). New Zealand: The Development of a Resource-rich Economy.In J.H. Dunning, and R. Narula (Eds.), Foreign Direct Investment and Govern-ments. London and New York: Routledge, 174–206.
Barry, F. (1999). FDI and Industrial Structure in Ireland, Spain, Portugal and theUK: Some Preliminary Results. Annual Conference on the European Economy.ISEG, Lisbon, Portugal, December.
Barry, F., Goerg, H. and McDowell, A. (2003). Outward FDI and the investmentdevelopment path of a late-industrializing economy: Evidence from ireland.Regional Studies, 37(4), 341–349.
210 JOURNAL OF EAST-WEST BUSINESS
Dow
nloa
ded
by [
Aka
dem
ia E
kono
mic
zna]
at 0
5:53
03
Janu
ary
2018

Barry, F. and Kearney, C. (2006). MNEs and Industrial Structure in Host Countries:A Portfolio Analysis of Irish Manufacturing. Journal of International BusinessStudies, 37(3), 392–406.
Bellak, C. (2001). The Austrian Investment Development Path. TransnationalCorporations, 10(2), 68–107.
Calder�oon, A., Mortimore, M. and Peres, W. (1996). Mexico: Foreign Investment as aSource of International Competitiveness. In J. H. Dunning and R. Narula (Eds.),Foreign Direct Investment and Governments. London and New York: Routledge,240-279.
Clegg, J. (1996). The United Kingdom: A Par Excellence Two-Way Direct Investor.In J.H. Dunning, and R. Narula (Eds.), Foreign Direct Investment and Govern-ments. London and New York: Routledge, 42–77.
Dunning, J.H. (1981). Explaining the International Direct Investment Position ofCountries: Towards a Dynamic or Developmental Approach. WeltwirtschaftlichesArchiv, 117, 30–64.
Dunning, J.H. (1986). The Investment Development Cycle Revisited. Weltwirtschaf-tliches Archiv, 122, 667–677.
Dunning, J.H. (1997). Alliance Capitalism and Global Business. London and NewYork: Routledge.
Dunning, J.H. and Narula, R. (1994). Transpacific Direct Investment and the Invest-ment Development Path: The Record Assessed. Essays in International Business,10, 1–69.
Dunning, J.H. and Narula, R. (1996). The Investment Development Path Revisited:Some Merging Issues. In J.H. Dunning and R. Narula (Eds.), Foreign DirectInvestment and Governments: Catalysts for Economic Restructuring. London andNew York: Routledge, 1–41.
Dunning, J. H. and Narula, R. (Eds.) (1996). Foreign Direct Investment andGovernments: Catalysts for Economic Restructuring. London and New York:Routledge.
Dunning, J.H., and Narula, R. (2002). The Investment Development Path Revisited.In J. H. Dunning (Ed.), Theories and Paradigms of International Business Activity.The Selected Essays of John H. Dunning, Volume 1. Cheltenham, UK andNorthhampton, MA: Edward Elgar, 138–172.
Dur�aan, J.J. and Ubeda, F. (2001). The Investment Development Path: a NewEmpirical Approach. Transnational Corporations, 10(2), 1–34.
Dur�aan, J.J. and Ubeda, F. (2005). The Investment Development Path of NewlyDeveloped Countries. International Journal of the Economics of Business, 12(1),123–137.
Gorynia, M. and Wolniak, R. (2003). Polish firms in the european union. Theirinternationalization projections and perspectives. Economic Studies, 1–2, 31–44.
Gorynia, M., Nowak, J., and Wolniak, R. (2005a). Fostering Competitiveness ofPolish Firms: Some Musings on Economic Policy and Spatial Expansion. InE. Kaynak and T.D. Harcar (Eds.), Global Business: the Challenges and Responsi-bilities in a World of Shifting Alliances. Advances in Global Management Develop-ment. Vol. XIV.
Marian Gorynia, Jan Nowak, Radoslaw Wolniak 211
Dow
nloa
ded
by [
Aka
dem
ia E
kono
mic
zna]
at 0
5:53
03
Janu
ary
2018

Gorynia, M., Nowak, J., and Wolniak, R. (2005b), Poland and its Investment Devel-opment Path. Proceedings of the 31st EIBA Conference in Oslo, Norway, December10–14.
Gorynia, M., Nowak, J., and Wolniak, S. (2006). The Investment Development Pathof Poland Re-visited: A Geographic Analysis. Proceedings of the 32nd AnnualEIBA Conference, Fribourg, December 7–9.
Graham, E. M. (1996). The United States: Some Musings on Its Investment Devel-opment Path. In J.H. Dunning and R. Narula (Eds.), Foreign Direct Investmentand Governments: Catalysts for Economic Restructuring. London and New York:Routledge, 78-100.
Kumar, N. (1996). India: Industrialization, Liberalization, and Inward and OutwardForeign Direct Investment. In J.H. Dunning and R. Narula (Eds.), Foreign DirectInvestment and Governments. London and New York: Routledge, 348–379.
Lall, S. (1996). The Investment Development Path: Some Conclusions. InJ.H. Dunning and R. Narula (Eds.), Foreign Direct Investment and Governments:Catalysts for Economic Restructuring. London and New York: Routledge,423–441.
National Bank of Poland (2000, 2001, 2002, 2003, 2004 and 2005). Inflows and Out-flows of FDI by Country and Sector, Warsaw, Poland.
Twomey., M. (2000). The canadian experience with the investment developmentpath. Canadian Economic History Conference, Stratfort, Ontario, 20–22 October.
Van Hoesel, R. (1996). Taiwan: Foreign Direct Investment and the Transformationof the Economy. In J.H. Dunning, and R. Narula (Eds.), Foreign Direct Invest-ment and Governments. London and New York: Routledge, 280–315.
Weresa, M.A. (Ed.) (2007). Poland Competitiveness Report 2007. The Role of ForeignDirect Investment. Warsaw: Warsaw School of Economics-Publishing.
Wolniak, R. (2006). Outward FDI from Poland. Presentation at the 32nd AnnualEIBA Conference, Fribourg, Switzerland, December 7–9.
Zhang, H.-Y. and Van Den Bulcke, D. (1996). China: Rapid Changes in the Invest-ment Development Path. In J.H. Dunning and R. Narula (Eds.), Foreign DirectInvestment and Governments. London and New York: Routledge, 380–422.
SUBMITTED: July 2007FIRST REVISION: September 2007
SECOND REVISION: November 2007ACCEPTED: December 2007
212 JOURNAL OF EAST-WEST BUSINESS
Dow
nloa
ded
by [
Aka
dem
ia E
kono
mic
zna]
at 0
5:53
03
Janu
ary
2018