poland’s long-term macroeconomic performance and recent
TRANSCRIPT
CESifo Forum 1/2013 (March)41
Focus
POLAND’S LONG-TERM
MACROECONOMIC PERFORM -ANCE AND RECENT TRENDS:A COMPARATIVE ANALYSIS
TADEUSZ KOWALSKI*
The aim of this study is twofold.1 The first is anempirical evaluation and comparison of Poland’s eco-nomic transformation from 1990–2012 against theresults achieved in the same period by Hungary, theCzech Republic, the Slovak Republic and Ukraine.The second aim is to assess the economic performanceof these five countries during the severe test of the2008–2009 global financial crisis. The study focuseson major economic aspects of the market transforma-tion. Consequently, the empirical analyses center onthe initial macroeconomic stabilization frameworksand then on the general growth mechanisms becausethey are embedded in the standard descriptive growthmodel.
The paper consists of five sections and conclusions.The first three are devoted to the long-term perspec-tive covering 1990–2012. The first section explainsthe selection of countries compared with Poland andbriefly outlines the macroeconomic transformationcontext. A conceptual framework of the convention-al production function is used to focus attention onthe main determinants of economic performance.The second section discusses the initial conditions ofthe transition in Poland and the other countriesunder examination. Special attention is paid tomajor structural and macroeconomic conditions onthe threshold of transformation. The third section isdevoted to the assessment of selected growth factorsand impediments to growth. The fourth section dealswith the reactions of the Polish and other economiesstudied to the global financial crisis. It shows the
economic performance of the five countries in the2008–2009 global financial crises and beyond. Thefifth section focuses on the general outcomes oftransformation in terms of GDP per capita and onthe international competiveness rankings of WorldEconomic Forum. The analysis is summarized inconclusions.
Analytical background of comparative analysis oftransformation
The selection of Hungary, Czech Republic, SlovakRepublic and Ukraine as countries for the compara-tive analysis with Poland was based on the followinggrounds. Hungary has been reforming and trans-forming its economy since the end of the 1960s. Anexamination of Hungary allows a comparisonbetween the results of gradual reforms and theresults of the radical alternative of the quick pro-market shift implemented in Poland (Kowalski,Wihlborg and Vensel 2007). A comparison withCzechoslovakia,2 which had considerably higher eco-nomic development, a relatively good initial macro-economic situation and where reforms were intro-duced one year later than in Poland, should allow theassessment of the significance of initial structuraldifferences and the specific premium resulting fromthe possibility of watching Polish pioneer experi-ences during the first months of transformation.Ukraine at the outset of transformation, used to beara rather significant structural similarity to Poland,i.e. in the major importance of agriculture and nat-ural resources to the economy. Moreover theUkrainian GDP per capita level in 1990 was the sameas in Poland. Furthermore, Ukraine, as a post-sovieteconomy, should shed some light on the soviet type-institutional and social heritage and its impact onbusiness and macroeconomic performance. In -corporation of Ukraine into the analysis makes itpossible to verify whether this country took advan-tage of a delay premium, since it had started thepolitical emancipation process in August 1991. As aresult, Ukraine had an opportunity to launch full
* Poznan University of Economics.1 This paper draws on and develops my earlier publication
(Kowalski 2010). I am grateful for the language and editorial assis-tance of Peter Wingrow and Anna Bogajewska and for the statisti-cal assistance of Aleksandra Wojciechowska.
2 On 1 January 1993 Czechoslovakia ceased to exist. It was replacedby the Czech Republic and the Slovak Republic.
market transformation as the independent country
and to base its actions on the experience of Hungary,
the then Czechoslovakia and Poland.
Any evaluation of the economic consequences of
the transition process of 1990–2012 requires a
coherent theoretical and methodological context.
For this reason, the transformation process is seen
as being composed of two major stages in this
paper: a stage of macroeconomic stabilization and
the implementation of fundamental institutional
changes, and a subsequent stage of growth and
adjustments of initial economic policy measures
according to the specific challenges of a particular
country. Finally, the global financial crisis can be
seen as a specific crash test for all of the countries
studied and demonstrates their differing ability to
adjust to the slowdown that followed in the
European Union economic environment.
The initial macroeconomic conditions were of crucial
importance for the economic reform package
required. In the longer-term perspective, the structur-
al features of a particular economy played a decisive
role. The first stage of economic transformation can
be investigated both in the context of macroeconom-
ic analysis and in the context of the microeconomic
adjustments of companies and households to the new
economic environment (Gorynia and Jankowska
2005; Kowalski and Janc 1999). An important analyt-
ical context, useful for describing both phases, is pro-
vided by the new institutional economics (Williamson
2000; Paldam and Grundlach 2008).
In the second phase of transition, qualitative factors
and conditions started to prevail. The most impor-
tant were: consistency and determination in the
process of reforms, flexibility, privatization of the
economy, the ability to improve business environ-
ment quality and innovation potential. With the
exception of Ukraine, consistent implementation of
the European Union’s acquis communautaire, stem-
ming from EU membership aspirations, also played
an important regulatory and modernization role in
the economic development of the studied countries.
Those conditions and factors, together with objec-
tive structural constraints, have influenced economic
growth and the scale of improvements in living stan-
dards. It is useful to analyse long-term aspects of
transformation in the context of growth theory and
shifts in international competitiveness. This second
framework will be used in section four to assess the
countries’ reactions to the crisis.
Macroeconomics and institutional conditions in the
stabilization phase
At the end of the 1980s, there was no normative the-ory for the transformation of a centrally plannedeconomy into the market-driven economy based onprivate ownership. At the time, the source of inspira-tion could have been experiences relating to the con-secutive failures of the stabilizing programs imple-mented under the auspices of the InternationalMonetary Fund in South American economies.J. Williamson’s ‘Washington Consensus’ became a gen-eral recipe containing conditions for effective marketreforms (Williamson 1990). The Washington Con -sensus was developed in a context that differed great-ly from the transition economies in Central Europe.The South American countries were basically marketeconomies, but with deficient regulatory and politicalinstitutions (Wojtyna 2008).
In Poland in 1989, the general conviction regardingthe necessity of deep institutional reform was accom-panied by an awareness of the geopolitical barriers ofthe time. The basic problem was designing a macro-economic stabilization framework. The scale of theproblem stemmed from deep domestic and externaldisequilibria, a spread between the official and themarket currency exchange rate, flight from the zloty,hyperinflation, biased price structure, an entirelymonetized budget deficit, a near lack of a commercialbanking sector, a ‘tradition’ of a negative real interestrate, and administrative credit regulations.3
In the case of each particular country, macroeconom-ic stabilization and constitutional reforms requireddesigning and implementing a new institutional envi-ronment (qualitative policy). At the same time, thenew authorities had to design and implement specificinstruments of quantitative policy. All of this had tobe accomplished under fragile new social and politicalconditions.
Transformation vs. growth theory and competitiveness
The second stage of the transformation can bedescribed in the context of the growth theory.4 Dueto the importance of broadly understood institu-tions for an efficient transformation to a market-led
CESifo Forum 1/2013 (March) 42
Focus
3 At the end of 1989 the free market exchange rate (at ‘bureau dechange’) was four times higher than the official rate of the NBP,and about 80 percent of household cash holdings were kept in USdollars and German Marks (Kowalski and Stawarska 1999).
4 See Campos and Coricelli (2002); Malaga (2004); Gylfason andHochreiter (2009 and 2010).
CESifo Forum 1/2013 (March)43
Focus
economy, the basic framework of the growth theoryis enriched with institutional aspects and economicgovernance and management quality issues.5
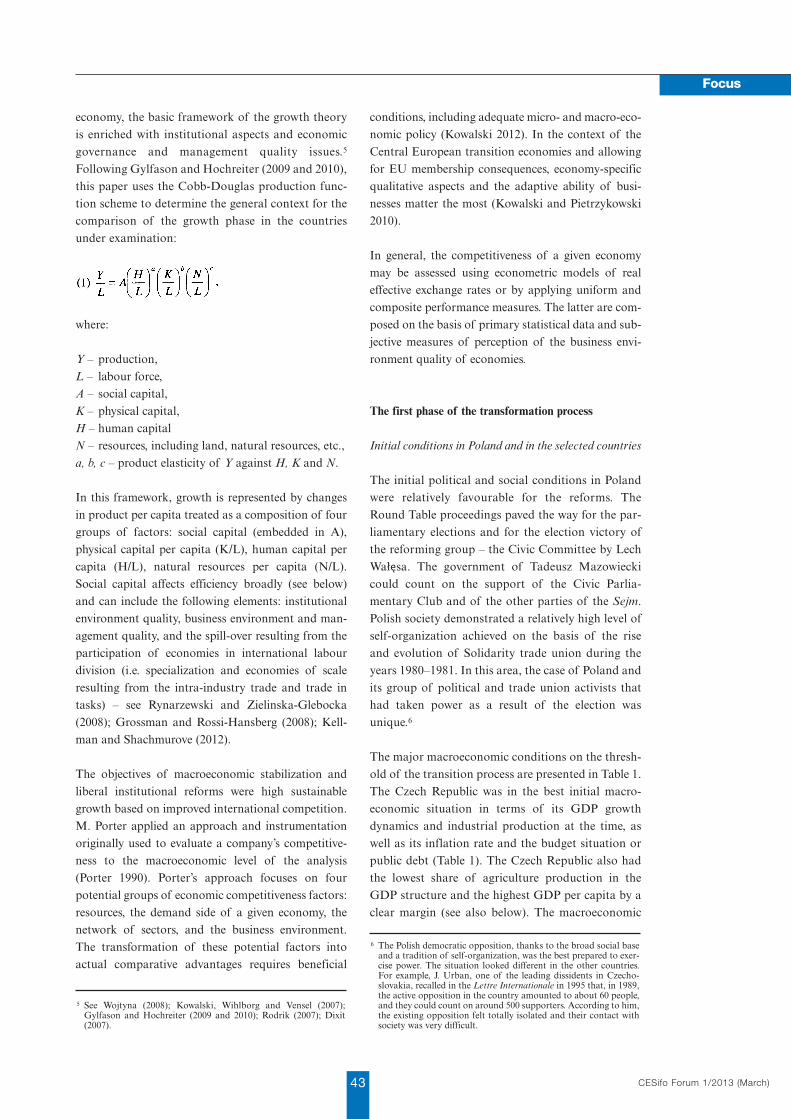
Following Gylfason and Hochreiter (2009 and 2010),this paper uses the Cobb-Douglas production func-tion scheme to determine the general context for thecomparison of the growth phase in the countriesunder examination:
where:
Y – production,L – labour force,A – social capital,K – physical capital,H – human capitalN – resources, including land, natural resources, etc.,a, b, c – product elasticity of Y against H, K and N.
In this framework, growth is represented by changesin product per capita treated as a composition of fourgroups of factors: social capital (embedded in A),physical capital per capita (K/L), human capital percapita (H/L), natural resources per capita (N/L).Social capital affects efficiency broadly (see below)and can include the following elements: institutionalenvironment quality, business environment and man-agement quality, and the spill-over resulting from theparticipation of economies in international labourdivision (i.e. specialization and economies of scaleresulting from the intra-industry trade and trade intasks) – see Rynarzewski and Zielinska-Glebocka(2008); Grossman and Rossi-Hansberg (2008); Kell -man and Shachmurove (2012).
The objectives of macroeconomic stabilization andliberal institutional reforms were high sustainablegrowth based on improved international competition.M. Porter applied an approach and instrumentationoriginally used to evaluate a company’s competitive-ness to the macroeconomic level of the analysis(Porter 1990). Porter’s approach focuses on fourpotential groups of economic competitiveness factors:resources, the demand side of a given economy, thenetwork of sectors, and the business environment.The transformation of these potential factors intoactual comparative advantages requires beneficial
conditions, including adequate micro- and macro-eco-nomic policy (Kowalski 2012). In the context of theCentral European transition economies and allowingfor EU membership consequences, economy-specificqualitative aspects and the adaptive ability of busi-nesses matter the most (Kowalski and Pietrzykowski2010).
In general, the competitiveness of a given economymay be assessed using econometric models of realeffective exchange rates or by applying uniform andcomposite performance measures. The latter are com-posed on the basis of primary statistical data and sub-jective measures of perception of the business envi-ronment quality of economies.
The first phase of the transformation process
Initial conditions in Poland and in the selected countries
The initial political and social conditions in Polandwere relatively favourable for the reforms. TheRound Table proceedings paved the way for the par-liamentary elections and for the election victory ofthe reforming group – the Civic Committee by LechWałęsa. The government of Tadeusz Mazowieckicould count on the support of the Civic Parlia -mentary Club and of the other parties of the Sejm.Polish society demonstrated a relatively high level ofself-organization achieved on the basis of the riseand evolution of Solidarity trade union during theyears 1980–1981. In this area, the case of Poland andits group of political and trade union activists thathad taken power as a result of the election wasunique.6
The major macroeconomic conditions on the thresh-old of the transition process are presented in Table 1.The Czech Republic was in the best initial macro-economic situation in terms of its GDP growthdynamics and industrial production at the time, aswell as its inflation rate and the budget situation orpublic debt (Table 1). The Czech Republic also hadthe lowest share of agriculture production in theGDP structure and the highest GDP per capita by aclear margin (see also below). The macroeconomic
5 See Wojtyna (2008); Kowalski, Wihlborg and Vensel (2007);Gylfason and Hochreiter (2009 and 2010); Rodrik (2007); Dixit(2007).
6 The Polish democratic opposition, thanks to the broad social baseand a tradition of self-organization, was the best prepared to exer-cise power. The situation looked different in the other countries.For example, J. Urban, one of the leading dissidents in Czecho -slovakia, recalled in the Lettre Internationale in 1995 that, in 1989,the active opposition in the country amounted to about 60 people,and they could count on around 500 supporters. According to him,the existing opposition felt totally isolated and their contact withsociety was very difficult.
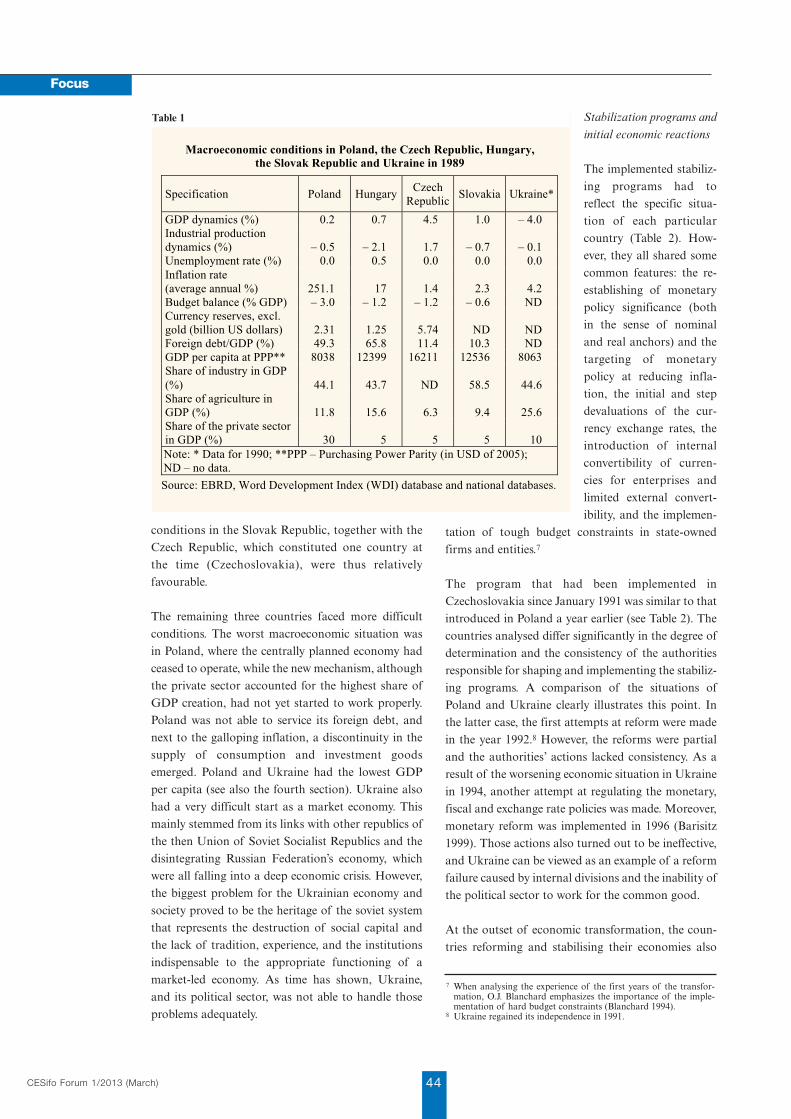
conditions in the Slovak Republic, together with theCzech Republic, which constituted one country atthe time (Czecho slovakia), were thus relativelyfavourable.
The remaining three countries faced more difficultconditions. The worst macroeconomic situation wasin Poland, where the centrally planned economy hadceased to operate, while the new mechanism, althoughthe private sector accounted for the highest share ofGDP creation, had not yet started to work properly.Poland was not able to service its foreign debt, andnext to the galloping inflation, a discontinuity in thesupply of consumption and investment goodsemerged. Poland and Ukraine had the lowest GDPper capita (see also the fourth section). Ukraine alsohad a very difficult start as a market economy. Thismainly stemmed from its links with other republics ofthe then Union of Soviet Socialist Republics and thedisintegrating Russian Federation’s economy, whichwere all falling into a deep economic crisis. However,the biggest problem for the Ukrainian economy andsociety proved to be the heritage of the soviet systemthat represents the destruction of social capital andthe lack of tradition, experience, and the institutionsindispensable to the appropriate functioning of amarket-led economy. As time has shown, Ukraine,and its political sector, was not able to handle thoseproblems adequately.
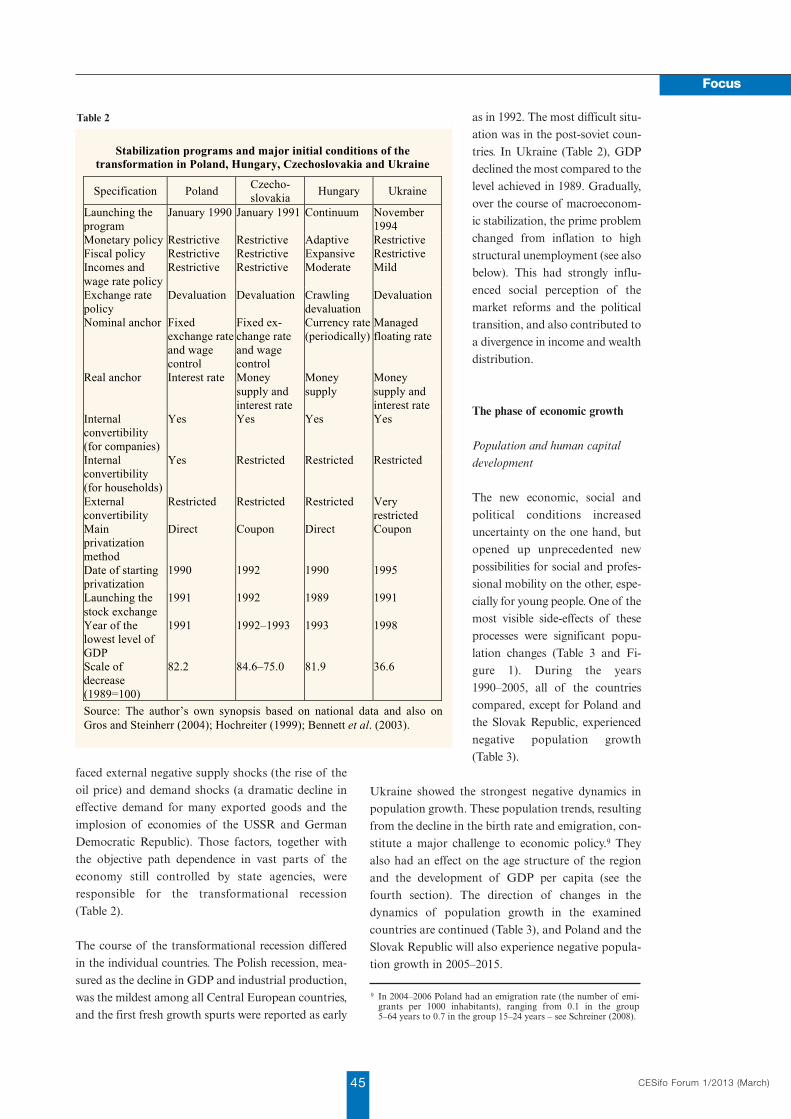
Stabilization programs and
initial economic reactions
The implemented stabiliz-ing programs had toreflect the specific situa-tion of each particularcountry (Table 2). How -ever, they all shared somecommon features: the re-establishing of monetarypolicy significance (bothin the sense of nominaland real anchors) and thetargeting of monetarypolicy at reducing infla-tion, the initial and stepdevaluations of the cur-rency exchange rates, theintroduction of internalconvertibility of curren-cies for enterprises andlimited external convert-ibility, and the implemen-
tation of tough budget constraints in state-ownedfirms and entities.7
The program that had been implemented inCzechoslovakia since January 1991 was similar to thatintroduced in Poland a year earlier (see Table 2). Thecountries analysed differ significantly in the degree ofdetermination and the consistency of the authoritiesresponsible for shaping and implementing the stabiliz-ing programs. A comparison of the situations ofPoland and Ukraine clearly illustrates this point. Inthe latter case, the first attempts at reform were madein the year 1992.8 However, the reforms were partialand the authorities’ actions lacked consistency. As aresult of the worsening economic situation in Ukrainein 1994, another attempt at regulating the monetary,fiscal and exchange rate policies was made. Moreover,monetary reform was implemented in 1996 (Barisitz1999). Those actions also turned out to be ineffective,and Ukraine can be viewed as an example of a reformfailure caused by internal divisions and the inability ofthe political sector to work for the common good.
At the outset of economic transformation, the coun-tries reforming and stabilising their economies also
CESifo Forum 1/2013 (March) 44
Focus
Macroeconomic conditions in Poland, the Czech Republic, Hungary, the Slovak Republic and Ukraine in 1989
Specification Poland Hungary Czech
Republic Slovakia Ukraine*
GDP dynamics (%) 0.2 0.7 4.5 1.0 – 4.0 Industrial production dynamics (%) – 0.5 – 2.1 1.7 – 0.7 – 0.1 Unemployment rate (%) 0.0 0.5 0.0 0.0 0.0 Inflation rate (average annual %) 251.1 17 1.4 2.3 4.2 Budget balance (% GDP) – 3.0 – 1.2 – 1.2 – 0.6 ND Currency reserves, excl. gold (billion US dollars) 2.31 1.25 5.74 ND ND Foreign debt/GDP (%) 49.3 65.8 11.4 10.3 ND GDP per capita at PPP** 8038 12399 16211 12536 8063 Share of industry in GDP (%) 44.1 43.7 ND 58.5 44.6 Share of agriculture in GDP (%) 11.8 15.6 6.3 9.4 25.6 Share of the private sector in GDP (%) 30 5 5 5 10 Note: * Data for 1990; **PPP – Purchasing Power Parity (in USD of 2005); ND – no data.
Source: EBRD, Word Development Index (WDI) database and national databases.
Table 1
7 When analysing the experience of the first years of the transfor-mation, O.J. Blanchard emphasizes the importance of the imple-mentation of hard budget constraints (Blanchard 1994).
8 Ukraine regained its independence in 1991.
CESifo Forum 1/2013 (March)45
Focus
faced external negative supply shocks (the rise of theoil price) and demand shocks (a dramatic decline ineffective demand for many exported goods and theimplosion of economies of the USSR and GermanDemocratic Republic). Those factors, together withthe objective path dependence in vast parts of theeconomy still controlled by state agencies, wereresponsible for the transformational recession(Table 2).
The course of the transformational recession differedin the individual countries. The Polish recession, mea-sured as the decline in GDP and industrial production,was the mildest among all Central European countries,and the first fresh growth spurts were reported as early
as in 1992. The most difficult situ-ation was in the post-soviet coun-tries. In Ukraine (Table 2), GDPdeclined the most compared to thelevel achieved in 1989. Grad ually,over the course of macroeconom-ic stabilization, the prime problemchanged from inflation to highstructural unemployment (see alsobelow). This had strongly influ-enced social perception of themarket reforms and the politicaltransition, and also contributed toa divergence in in come and wealthdistri bution.
The phase of economic growth
Population and human capital
development
The new economic, social andpolitical conditions increaseduncertainty on the one hand, butopened up unprecedented newpossibilities for social and profes-sional mobility on the other, espe-cially for young people. One of themost visible side-effects of theseprocesses were significant popu -lation changes (Table 3 and Fi -gure 1). During the years1990–2005, all of the countriescompared, except for Poland andthe Slovak Republic, experiencednegative population growth(Table 3).
Ukraine showed the strongest negative dynamics inpopulation growth. These population trends, resultingfrom the decline in the birth rate and emigration, con-stitute a major challenge to economic policy.9 Theyalso had an effect on the age structure of the regionand the development of GDP per capita (see thefourth section). The direction of changes in thedynamics of population growth in the examinedcountries are continued (Table 3), and Poland and theSlovak Republic will also experience negative popula-tion growth in 2005–2015.
Stabilization programs and major initial conditions of the transformation in Poland, Hungary, Czechoslovakia and Ukraine
Specification Poland Czecho- slovakia
Hungary Ukraine
Launching the program
January 1990 January 1991 Continuum November 1994
Monetary policy Restrictive Restrictive Adaptive Restrictive Fiscal policy Restrictive Restrictive Expansive Restrictive Incomes and wage rate policy
Restrictive Restrictive Moderate Mild
Exchange rate policy
Devaluation Devaluation Crawling devaluation
Devaluation
Nominal anchor Fixed exchange rate and wage control
Fixed ex-change rate and wage control
Currency rate (periodically)
Managed floating rate
Real anchor Interest rate Money supply and interest rate
Money supply
Money supply and interest rate
Internal convertibility (for companies)
Yes Yes Yes Yes
Internal convertibility (for households)
Yes Restricted Restricted Restricted
External convertibility
Restricted Restricted Restricted Very restricted
Main privatization method
Direct Coupon Direct Coupon
Date of starting privatization
1990 1992 1990 1995
Launching the stock exchange
1991 1992 1989 1991
Year of the lowest level of GDP
1991 1992–1993 1993 1998
Scale of decrease (1989=100)
82.2 84.6–75.0 81.9 36.6
Source: The author’s own synopsis based on national data and also on Gros and Steinherr (2004); Hochreiter (1999); Bennett et al. (2003).
Table 2
9 In 2004–2006 Poland had an emigration rate (the number of emi-grants per 1000 inhabitants), ranging from 0.1 in the group5–64 years to 0.7 in the group 15–24 years – see Schreiner (2008).
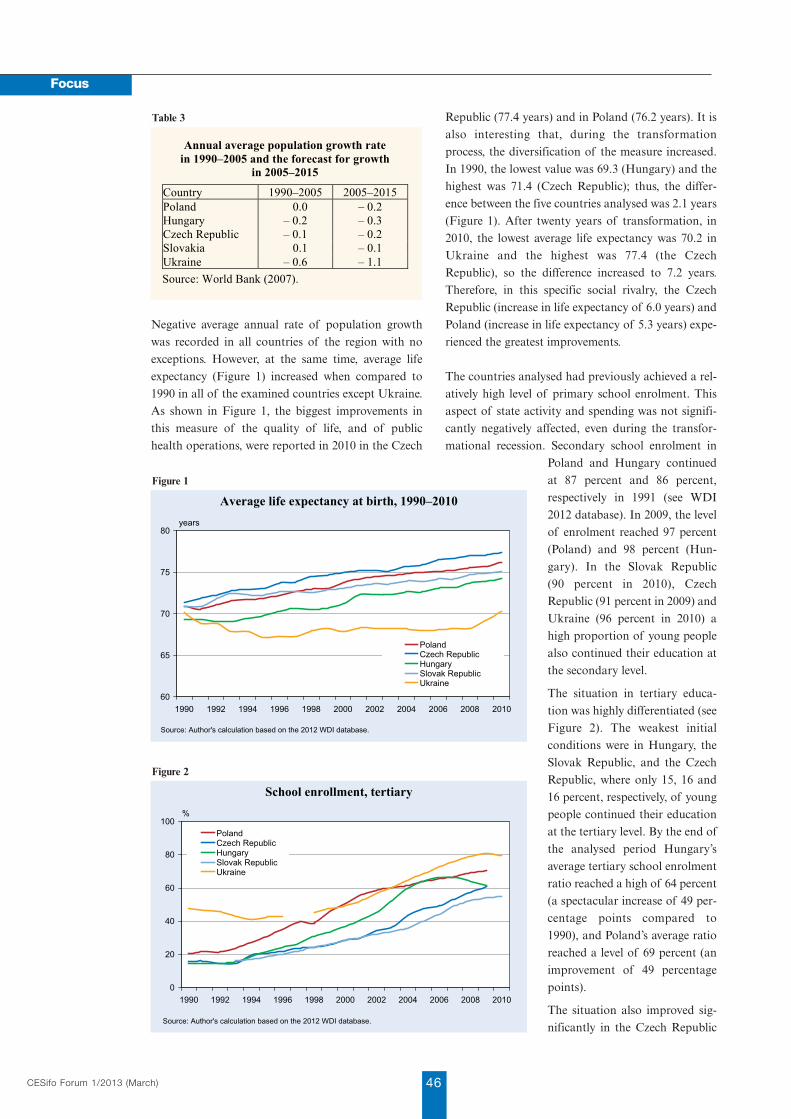
Negative average annual rate of population growthwas recorded in all countries of the region with noexceptions. However, at the same time, average lifeexpectancy (Figure 1) increased when compared to1990 in all of the examined countries except Ukraine.As shown in Figure 1, the biggest improvements inthis measure of the quality of life, and of publichealth operations, were reported in 2010 in the Czech
Republic (77.4 years) and in Poland (76.2 years). It isalso interesting that, during the transformationprocess, the diversification of the measure increased.In 1990, the lowest value was 69.3 (Hungary) and thehighest was 71.4 (Czech Republic); thus, the differ-ence between the five countries analysed was 2.1 years(Figure 1). After twenty years of transformation, in2010, the lowest average life expectancy was 70.2 inUkraine and the highest was 77.4 (the CzechRepublic), so the difference increased to 7.2 years.Therefore, in this specific social rivalry, the CzechRepublic (increase in life expectancy of 6.0 years) andPoland (increase in life expectancy of 5.3 years) expe-rienced the greatest improvements.
The countries analysed had previously achieved a rel-atively high level of primary school enrolment. Thisaspect of state activity and spending was not signifi-cantly negatively affected, even during the transfor-mational recession. Secondary school enrolment in
Poland and Hungary continuedat 87 percent and 86 percent,respectively in 1991 (see WDI2012 database). In 2009, the levelof enrolment reached 97 percent(Poland) and 98 percent (Hun -gary). In the Slovak Republic(90 percent in 2010), CzechRepublic (91 percent in 2009) andUkraine (96 percent in 2010) ahigh proportion of young peoplealso continued their education atthe secondary level.
The situation in tertiary educa-tion was highly differentiated (seeFigure 2). The weakest initialconditions were in Hungary, theSlovak Republic, and the CzechRepublic, where only 15, 16 and16 percent, respectively, of youngpeople continued their educationat the tertiary level. By the end ofthe analysed period Hungary’saverage tertiary school enrolmentratio reached a high of 64 percent(a spectacular increase of 49 per-centage points compared to1990), and Poland’s average ratioreached a level of 69 percent (anim provement of 49 percentagepoints).
The situation also improved sig-nificantly in the Czech Republic
CESifo Forum 1/2013 (March) 46
Focus
Annual average population growth rate in 1990–2005 and the forecast for growth
in 2005–2015
Country 1990–2005 2005–2015 Poland 0.0 – 0.2 Hungary – 0.2 – 0.3 Czech Republic – 0.1 – 0.2 Slovakia 0.1 – 0.1 Ukraine – 0.6 – 1.1
Source: World Bank (2007).
Table 3
60
65
70
75
80
1990 1992 1994 1996 1998 2000 2002 2004 2006 2008 2010
PolandCzech RepublicHungarySlovak RepublicUkraine
Average life expectancy at birth, 1990–2010years
Source: Author's calculation based on the 2012 WDI database.
Figure 1
0
20
40
60
80
100
1990 1992 1994 1996 1998 2000 2002 2004 2006 2008 2010
PolandCzech RepublicHungarySlovak RepublicUkraine
School enrollment, tertiary%
Source: Author's calculation based on the 2012 WDI database.
Figure 2
CESifo Forum 1/2013 (March)47
Focus
(about 57 percent) and in theSlovak Re public (ca. 54 percent).The highest school enrolmentratios (Figure 2) at the tertiarylevel of education were achievedby Ukraine (average level of93 percent). The countries ana -lysed, and particularly Poland,considerably improved the avail-ability of this level of educationmainly through their develop-ment of private education, focus-ing on the humanities and socialsciences, rather than technicaleducation.
The tertiary school enrolmentratio achieved in Poland and the other countriesunder examination was higher than in countries withmedium-income levels. Moreover, in the cases ofHungary and Poland, the achieved level is similar tothat of countries with the highest income per capita,and in Ukraine it was even higher. The quantitativedata shows that the development of human capitalachieved by the end of the examined period was good.However, rapid growth in the number of students andtheir concentration in the field of humanities andsocial sciences contributed to the mismatch betweenqualification supply and the actual demand for work-force. It also explains the frustration of the younggeneration and their readiness to emigrate in order toseek jobs in better developed European eco nomies.
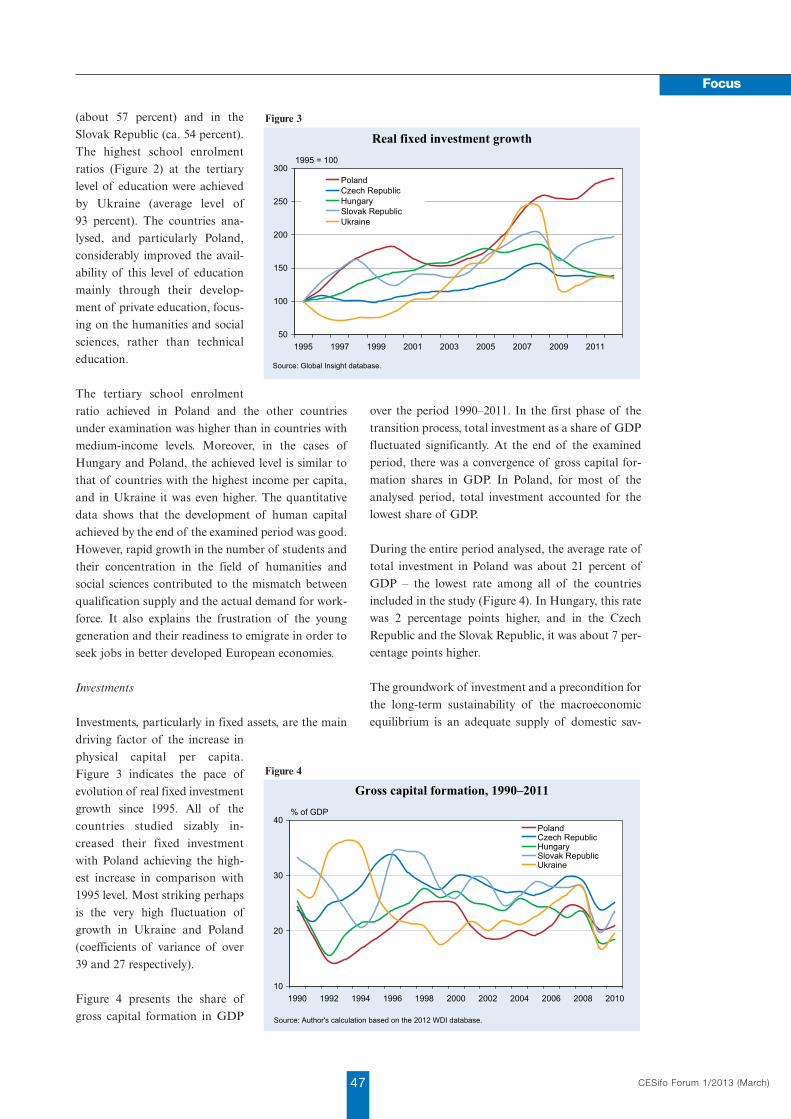
Investments
Investments, particularly in fixed assets, are the maindriving factor of the increase inphysical capital per capita.Figure 3 indicates the pace ofevolution of real fixed investmentgrowth since 1995. All of thecountries studied sizably in -creased their fixed investmentwith Poland achieving the high-est increase in comparison with1995 level. Most striking perhapsis the very high fluctuation ofgrowth in Ukraine and Poland(coefficients of variance of over39 and 27 respectively).
Figure 4 presents the share ofgross capital formation in GDP
over the period 1990–2011. In the first phase of thetransition process, total investment as a share of GDPfluctuated significantly. At the end of the examinedperiod, there was a convergence of gross capital for-mation shares in GDP. In Poland, for most of theanalysed period, total investment accounted for thelowest share of GDP.
During the entire period analysed, the average rate oftotal investment in Poland was about 21 percent ofGDP – the lowest rate among all of the countriesincluded in the study (Figure 4). In Hungary, this ratewas 2 percentage points higher, and in the CzechRepublic and the Slovak Republic, it was about 7 per-centage points higher.
The groundwork of investment and a precondition forthe long-term sustainability of the macroeconomicequilibrium is an adequate supply of domestic sav-
10
20
30
40
1990 1992 1994 1996 1998 2000 2002 2004 2006 2008 2010
PolandCzech RepublicHungarySlovak RepublicUkraine
Gross capital formation, 1990–2011% of GDP
Source: Author's calculation based on the 2012 WDI database.
Figure 4
50
100
150
200
250
300
1995 1997 1999 2001 2003 2005 2007 2009 2011
PolandCzech RepublicHungarySlovak RepublicUkraine
Real fixed investment growth1995 = 100
Source: Global Insight database.
Figure 3

ings. Domestic savings in Polandand the compared countries werelower than internal demand. Thismeant that in the whole periodanalysed (with the temporaryexception of Ukraine) thesecountries were net borrowers.This trend caused a structuralcurrent account deficit.
A supplementary source of fundsand an important element in thereconstruction and moderniza-tion of the economies was theinflow of foreign direct invest-ment (FDI). FDI supplementeddomestic capabilities to invest.According to the World Development Index (WDI)database, the inflow of net foreign direct investment(net FDI) as a percentage of GDP was very high. Thehighest volatility of net FDI was registered inHungary. The Slovak Republic – a country with a sig-nificant inflow of large investments in the automotiveindustry recorded significant fluctuations of net FDI(from 0.6 percent of GDP in 1997 to almost 12 per-cent of GDP in 2002). During the years 1990–2011,the average scale of net FDI in Poland, Ukraine andthe Czech and Slovak Republics was around 3 percentof GDP, and this figure was significantly higher inHungary (6.2 percent). The FDI inflow was a crucialelement in the reintegration of the countries analysed,with the European and global markets affecting boththe supply and demand sides of these transitioneconomies.
Foreign trade liberalization
(a) Openness of the economies
As noted above, the liberalization of foreign trade wasa common aspect of the stabilization programs imple-mented in all of the countries analysed. In economiesalready on the threshold of a market transformation,the importance of exports and imports of goods andservices was diversified. It was largely a function ofdomestic market size, the availability of resources,and the competitive capacity of exports. The structureof foreign trade gradually changed, mainly due to theinfluence of FDI (Kellman and Shachmurove 2012).The ratio of the export value of goods and services toGDP is given in Figure 5. In 1990 in Poland, theSlovak Republic, Ukraine and Hungary, exports ofgoods and services as a share of GDP was at a similar
level of around 30 percent, while the Czech Republicstarted at a level of around 50 percent.
The years of market transformation saw high volatili-ty in exports as a share of GDP. This was due to bothchanges in the value of the exports and the volatilityof GDP dynamics in the countries in transition. Thehighest variation took place in Ukraine (Figure 5). Itresulted from a strenuous search for diversification inthe geographical structure of exports and the limita-tion of the dependence upon the market of the formerSoviet Union.
In the case of Poland and the Czech Republic in 2004,the effect of trade creation appeared as an increase inthe share of exports in the GDP amounting to 4.2 and8.3 percentage points, respectively. In general, all ofthe countries studied significantly increased their ratioof exports to GDP (Figure 5). The increase in exportcapacity can be interpreted as evidence of the abilityof the countries analysed to meet strong competitionin the Single European Market.10 The relatively small-er increase for Ukraine reflects the decline in tradeamong the former Soviet republics.
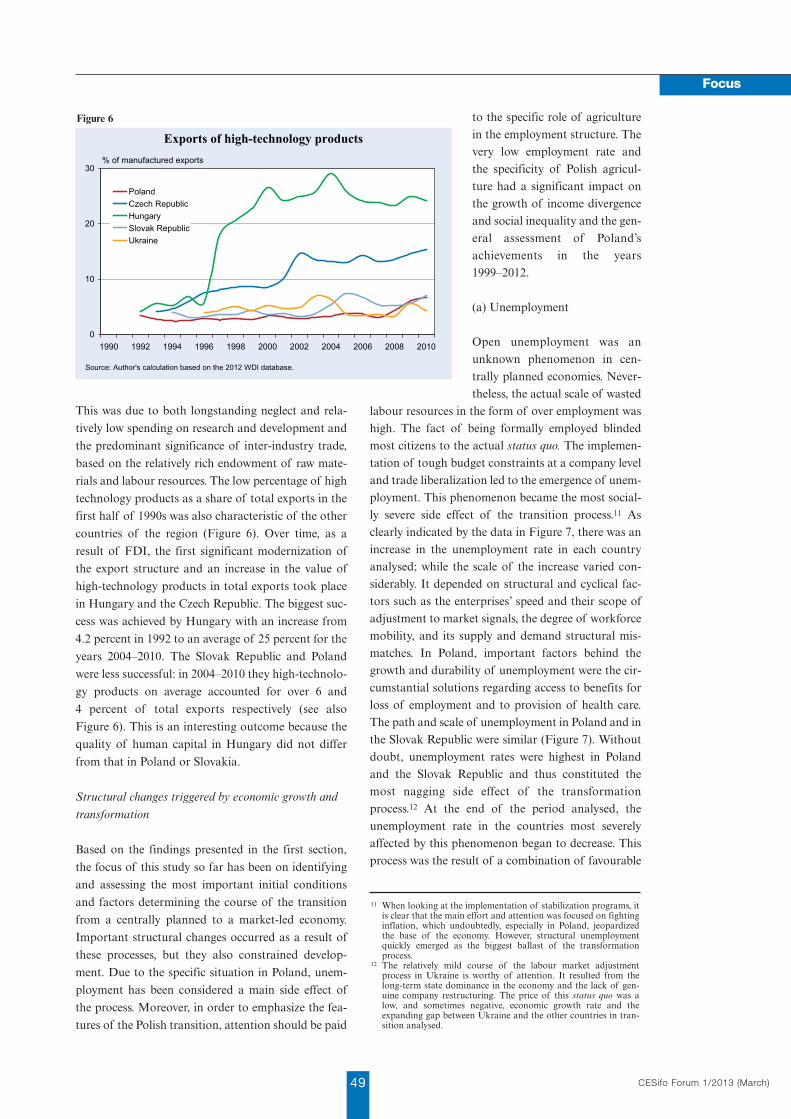
(b) Exports of high-technology products
Typically the share of high-technology products intotal exports is seen as a major indicator ofeconomies’ innovativeness and competitiveness.Figure 6 indicates that the initial situation of Polishexports of high-technology products was disadvan -tageous.
CESifo Forum 1/2013 (March) 48
Focus
0
20
40
60
80
100
1990 1992 1994 1996 1998 2000 2002 2004 2006 2008 2010
PolandCzech RepublicHungarySlovak RepublicUkraine
Exports of goods and services% of GDP
Source: Author's calculation based on the 2012 WDI database.
Figure 5
10 The analyzed countries (with the exception of Ukraine) exportover 65 percent of their goods and service exports to the marketof the EU27.
CESifo Forum 1/2013 (March)49
Focus
This was due to both longstanding neglect and rela-
tively low spending on research and development and
the predominant significance of inter-industry trade,
based on the relatively rich endowment of raw mate-
rials and labour resources. The low percentage of high
technology products as a share of total exports in the
first half of 1990s was also characteristic of the other
countries of the region (Figure 6). Over time, as a
result of FDI, the first significant modernization of
the export structure and an increase in the value of
high-technology products in total exports took place
in Hungary and the Czech Republic. The biggest suc-
cess was achieved by Hungary with an increase from
4.2 percent in 1992 to an average of 25 percent for the
years 2004–2010. The Slovak Republic and Poland
were less successful: in 2004–2010 they high-technolo-
gy products on average accounted for over 6 and
4 percent of total exports respectively (see also
Figure 6). This is an interesting outcome because the
quality of human capital in Hungary did not differ
from that in Poland or Slovakia.
Structural changes triggered by economic growth and
transformation
Based on the findings presented in the first section,
the focus of this study so far has been on identifying
and assessing the most important initial conditions
and factors determining the course of the transition
from a centrally planned to a market-led economy.
Important structural changes occurred as a result of
these processes, but they also constrained develop-
ment. Due to the specific situation in Poland, unem-
ployment has been considered a main side effect of
the process. Moreover, in order to emphasize the fea-
tures of the Polish transition, attention should be paid
to the specific role of agriculturein the employment structure. Thevery low employment rate andthe specificity of Polish agricul-ture had a significant impact onthe growth of income divergenceand social inequality and the gen-eral assessment of Poland’sachievements in the years1999–2012.
(a) Unemployment
Open unemployment was anunknown phenomenon in cen-trally planned economies. Never -theless, the actual scale of wasted
labour resources in the form of over employment washigh. The fact of being formally employed blindedmost citizens to the actual status quo. The implemen-tation of tough budget constraints at a company leveland trade liberalization led to the emergence of unem-ployment. This phenomenon became the most social-ly severe side effect of the transition process.11 Asclearly indicated by the data in Figure 7, there was anincrease in the unemployment rate in each countryanalysed; while the scale of the increase varied con-siderably. It depended on structural and cyclical fac-tors such as the enterprises’ speed and their scope ofadjustment to market signals, the degree of workforcemobility, and its supply and demand structural mis-matches. In Poland, important factors behind thegrowth and durability of unemployment were the cir-cumstantial solutions regarding access to benefits forloss of employment and to provision of health care.The path and scale of unemployment in Poland and inthe Slovak Republic were similar (Figure 7). Withoutdoubt, unemployment rates were highest in Polandand the Slovak Republic and thus constituted themost nagging side effect of the transformationprocess.12 At the end of the period analysed, theunemployment rate in the countries most severelyaffected by this phenomenon began to decrease. Thisprocess was the result of a combination of favourable
0
10
20
30
1990 1992 1994 1996 1998 2000 2002 2004 2006 2008 2010
PolandCzech RepublicHungarySlovak RepublicUkraine
Exports of high-technology products% of manufactured exports
Source: Author's calculation based on the 2012 WDI database.
Figure 6
11 When looking at the implementation of stabilization programs, itis clear that the main effort and attention was focused on fightinginflation, which undoubtedly, especially in Poland, jeopardizedthe base of the economy. However, structural unemploymentquickly emerged as the biggest ballast of the transformationprocess.
12 The relatively mild course of the labour market adjustmentprocess in Ukraine is worthy of attention. It resulted from thelong-term state dominance in the economy and the lack of gen-uine company restructuring. The price of this status quo was alow, and sometimes negative, economic growth rate and theexpanding gap between Ukraine and the other countries in tran-sition analysed.
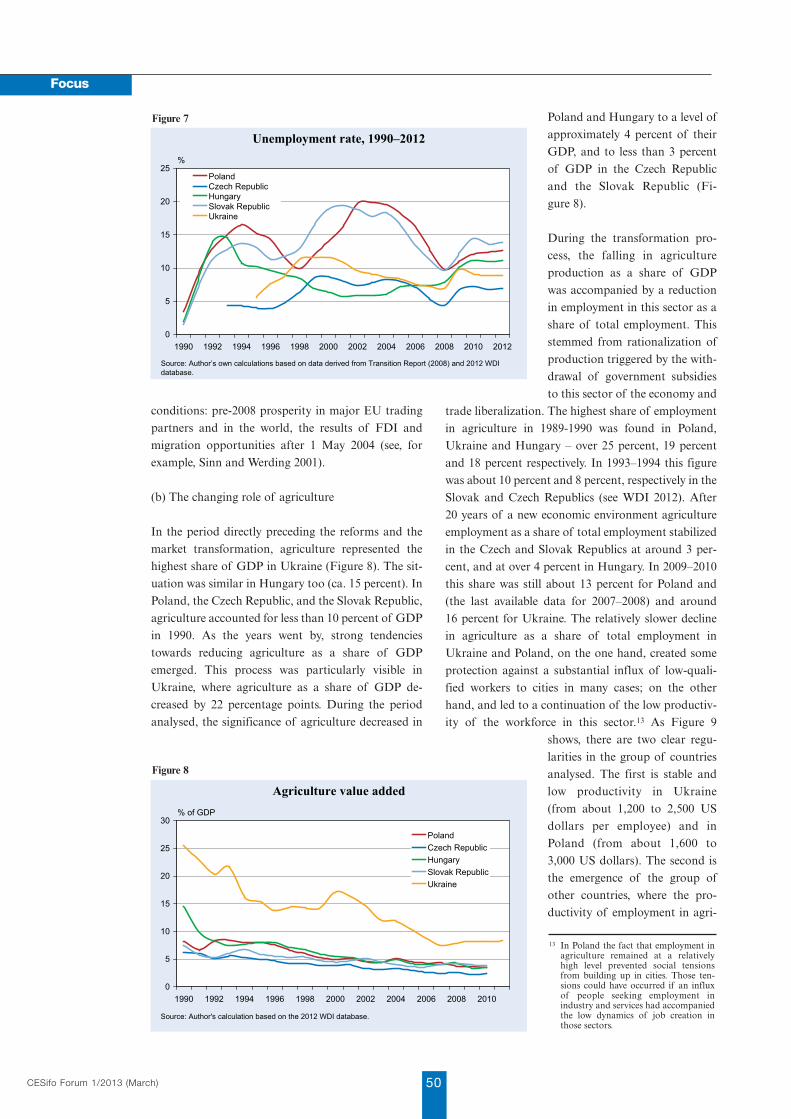
conditions: pre-2008 prosperity in major EU tradingpartners and in the world, the results of FDI andmigration opportunities after 1 May 2004 (see, forexample, Sinn and Werding 2001).
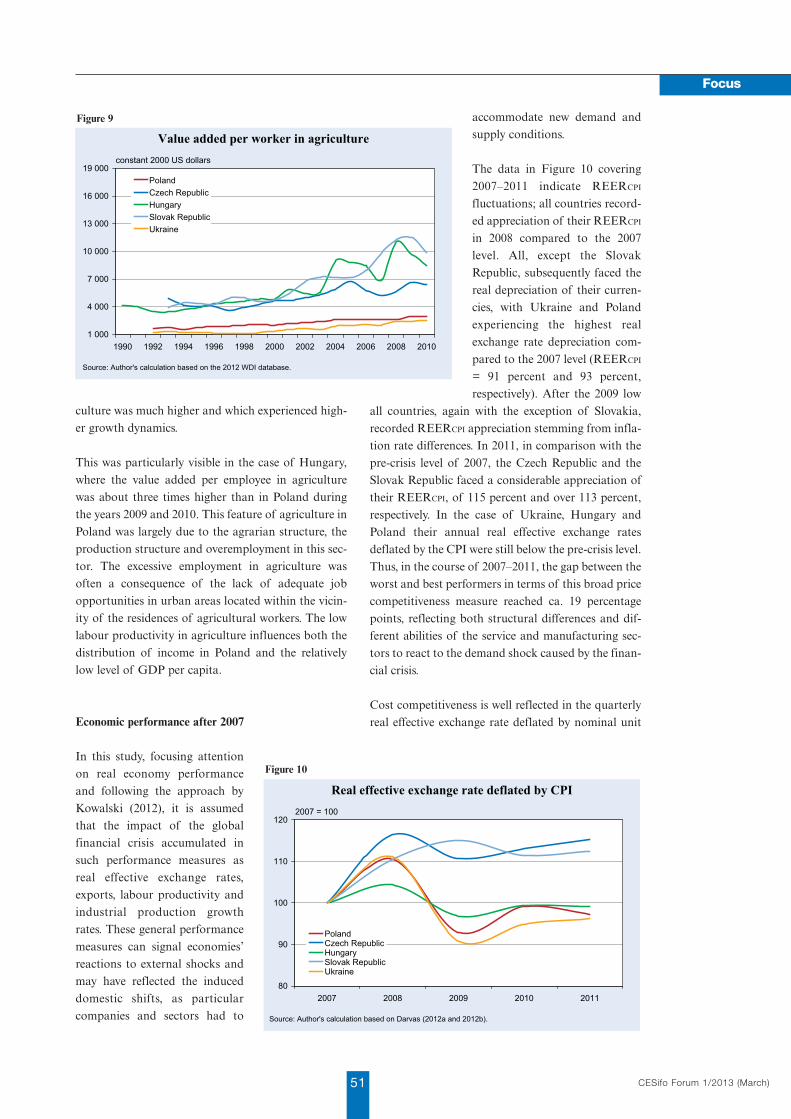
(b) The changing role of agriculture
In the period directly preceding the reforms and themarket transformation, agriculture represented thehighest share of GDP in Ukraine (Figure 8). The sit-uation was similar in Hungary too (ca. 15 percent). InPoland, the Czech Republic, and the Slovak Republic,agriculture accounted for less than 10 percent of GDPin 1990. As the years went by, strong tendenciestowards reducing agriculture as a share of GDPemerged. This process was particularly visible inUkraine, where agriculture as a share of GDP de -creased by 22 percentage points. During the periodanalysed, the significance of agriculture decreased in
Poland and Hungary to a level ofapproximately 4 percent of theirGDP, and to less than 3 percentof GDP in the Czech Republicand the Slovak Republic (Fi -gure 8).
During the transformation pro -cess, the falling in agricultureproduction as a share of GDPwas accompanied by a reductionin employment in this sector as ashare of total employment. Thisstemmed from rationalization ofproduction triggered by the with-drawal of government subsidiesto this sector of the economy and
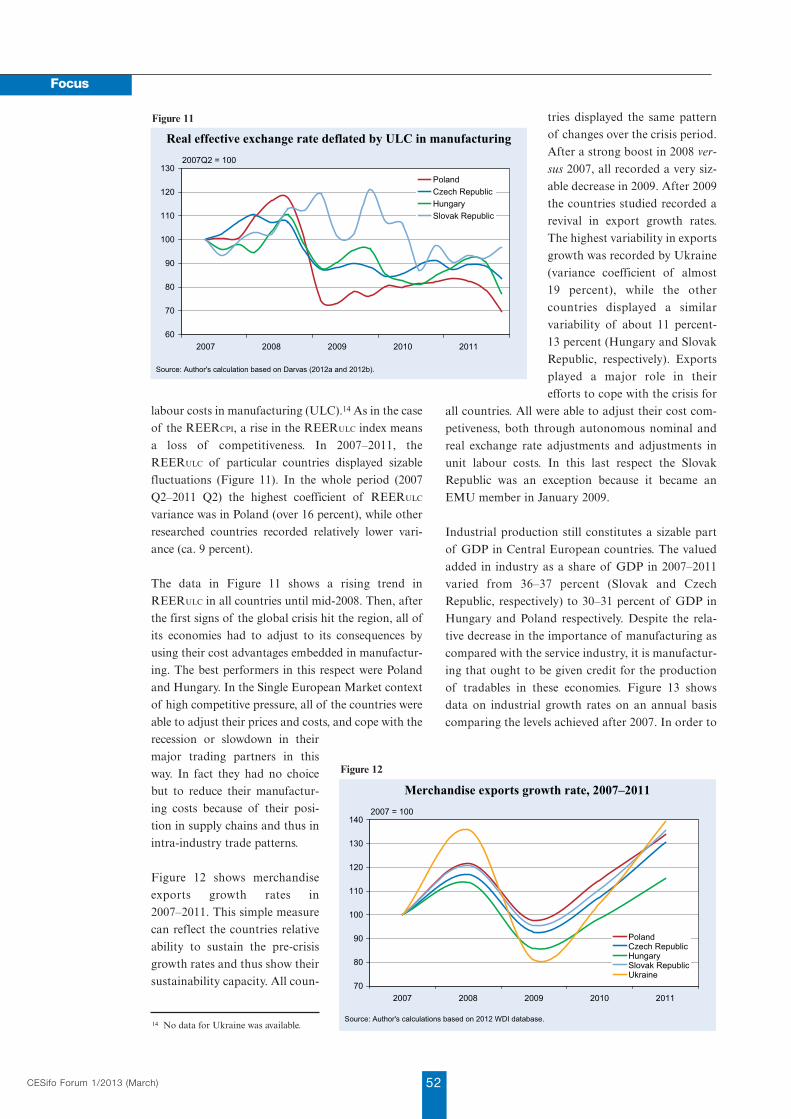
trade liberalization. The highest share of employmentin agriculture in 1989-1990 was found in Poland,Ukraine and Hungary – over 25 percent, 19 percentand 18 percent respectively. In 1993–1994 this figurewas about 10 percent and 8 percent, respectively in theSlovak and Czech Republics (see WDI 2012). After20 years of a new economic environment agricultureemployment as a share of total employment stabilizedin the Czech and Slovak Republics at around 3 per-cent, and at over 4 percent in Hungary. In 2009–2010this share was still about 13 percent for Poland and(the last available data for 2007–2008) and around16 percent for Ukraine. The relatively slower declinein agriculture as a share of total employment inUkraine and Poland, on the one hand, created someprotection against a substantial influx of low-quali-fied workers to cities in many cases; on the otherhand, and led to a continuation of the low productiv-ity of the workforce in this sector.13 As Figure 9
shows, there are two clear regu-larities in the group of countriesanalysed. The first is stable andlow productivity in Ukraine(from about 1,200 to 2,500 USdollars per employee) and inPoland (from about 1,600 to3,000 US dollars). The second isthe emergence of the group ofother countries, where the pro-ductivity of employment in agri-
CESifo Forum 1/2013 (March) 50
Focus
0
5
10
15
20
25
1990 1992 1994 1996 1998 2000 2002 2004 2006 2008 2010 2012
PolandCzech RepublicHungarySlovak RepublicUkraine
Unemployment rate, 1990–2012%
Source: Author’s own calculations based on data derived from Transition Report (2008) and 2012 WDI database.
Figure 7
0
5
10
15
20
25
30
1990 1992 1994 1996 1998 2000 2002 2004 2006 2008 2010
PolandCzech RepublicHungarySlovak RepublicUkraine
Agriculture value added% of GDP
Source: Author's calculation based on the 2012 WDI database.
Figure 8
13 In Poland the fact that employment inagriculture remained at a relativelyhigh level prevented social tensionsfrom building up in cities. Those ten-sions could have occurred if an influxof people seeking employment inindustry and services had accompaniedthe low dynamics of job creation inthose sectors.
CESifo Forum 1/2013 (March)51
Focus
culture was much higher and which experienced high-er growth dynamics.
This was particularly visible in the case of Hungary,where the value added per employee in agriculturewas about three times higher than in Poland duringthe years 2009 and 2010. This feature of agriculture inPoland was largely due to the agrarian structure, theproduction structure and overemployment in this sec-tor. The excessive employment in agriculture wasoften a consequence of the lack of adequate jobopportunities in urban areas located within the vicin-ity of the residences of agricultural workers. The lowlabour productivity in agriculture influences both thedistribution of income in Poland and the relativelylow level of GDP per capita.
Economic performance after 2007
In this study, focusing attentionon real economy performanceand following the approach byKowalski (2012), it is assumedthat the impact of the globalfinancial crisis accumulated insuch performance measures asreal effective exchange rates,exports, labour productivity andindustrial production growthrates. These general performancemeasures can signal economies’reactions to external shocks andmay have reflected the induceddomestic shifts, as particularcompanies and sectors had to
accommodate new demand andsupply conditions.
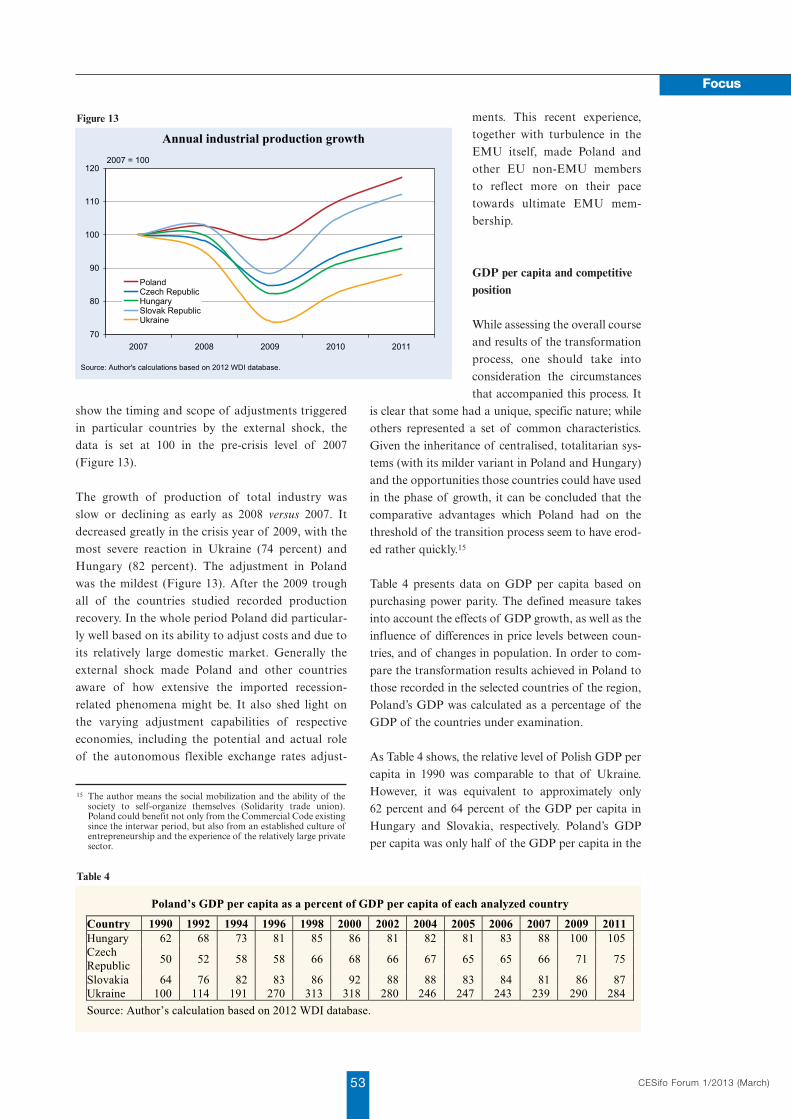
The data in Figure 10 covering2007–2011 indicate REERCPI
fluctuations; all countries record-ed appreciation of their REERCPI
in 2008 compared to the 2007level. All, except the SlovakRepublic, subsequently faced thereal depreciation of their curren-cies, with Ukraine and Polandexperiencing the highest realexchange rate depreciation com-pared to the 2007 level (REERCPI
= 91 percent and 93 percent,respectively). After the 2009 low
all countries, again with the exception of Slovakia,recorded REERCPI appreciation stemming from infla-tion rate differences. In 2011, in comparison with thepre-crisis level of 2007, the Czech Republic and theSlovak Republic faced a considerable appreciation oftheir REERCPI, of 115 percent and over 113 percent,respectively. In the case of Ukraine, Hungary andPoland their annual real effective exchange ratesdeflated by the CPI were still below the pre-crisis level.Thus, in the course of 2007–2011, the gap between theworst and best performers in terms of this broad pricecompetitiveness measure reached ca. 19 percentagepoints, reflecting both structural differences and dif-ferent abilities of the service and manufacturing sec-tors to react to the demand shock caused by the finan-cial crisis.
Cost competitiveness is well reflected in the quarterlyreal effective exchange rate deflated by nominal unit
1 000
4 000
7 000
10 000
13 000
16 000
19 000
1990 1992 1994 1996 1998 2000 2002 2004 2006 2008 2010
PolandCzech RepublicHungarySlovak RepublicUkraine
Value added per worker in agricultureconstant 2000 US dollars
Source: Author's calculation based on the 2012 WDI database.
Figure 9
80
90
100
110
120
2007 2008 2009 2010 2011
PolandCzech RepublicHungarySlovak RepublicUkraine
Real effective exchange rate deflated by CPI2007 = 100
Source: Author's calculation based on Darvas (2012a and 2012b).
Figure 10
labour costs in manufacturing (ULC).14 As in the caseof the REERCPI, a rise in the REERULC index meansa loss of competitiveness. In 2007–2011, theREERULC of particular countries displayed sizablefluctuations (Figure 11). In the whole period (2007Q2–2011 Q2) the highest coefficient of REERULC
variance was in Poland (over 16 percent), while otherresearched countries recorded relatively lower vari-ance (ca. 9 percent).
The data in Figure 11 shows a rising trend inREERULC in all countries until mid-2008. Then, afterthe first signs of the global crisis hit the region, all ofits economies had to adjust to its consequences byusing their cost advantages embedded in manufactur-ing. The best performers in this respect were Polandand Hungary. In the Single European Market contextof high competitive pressure, all of the countries wereable to adjust their prices and costs, and cope with therecession or slowdown in theirmajor trading partners in thisway. In fact they had no choicebut to reduce their manufactur-ing costs because of their posi-tion in supply chains and thus inintra-industry trade patterns.
Figure 12 shows merchandiseexports growth rates in2007–2011. This simple measurecan reflect the countries relativeability to sustain the pre-crisisgrowth rates and thus show theirsustainability capacity. All coun-
tries displayed the same patternof changes over the crisis period.After a strong boost in 2008 ver-
sus 2007, all recorded a very siz-able decrease in 2009. After 2009the countries studied recorded arevival in export growth rates.The highest variability in exportsgrowth was recorded by Ukraine(variance coefficient of almost19 percent), while the othercountries displayed a similarvariability of about 11 percent-13 percent (Hungary and SlovakRepublic, respectively). Exportsplayed a major role in theirefforts to cope with the crisis for
all countries. All were able to adjust their cost com-petiveness, both through autonomous nominal andreal exchange rate adjustments and adjustments inunit labour costs. In this last respect the SlovakRepublic was an exception because it became anEMU member in January 2009.
Industrial production still constitutes a sizable partof GDP in Central European countries. The valuedadded in industry as a share of GDP in 2007–2011varied from 36–37 percent (Slovak and CzechRepublic, respectively) to 30–31 percent of GDP inHungary and Poland respectively. Despite the rela-tive decrease in the importance of manufacturing ascompared with the service industry, it is manufactur-ing that ought to be given credit for the productionof tradables in these economies. Figure 13 showsdata on industrial growth rates on an annual basiscomparing the levels achieved after 2007. In order to
CESifo Forum 1/2013 (March) 52
Focus
60
70
80
90
100
110
120
130
2007 2008 2009 2010 2011
PolandCzech RepublicHungarySlovak Republic
Real effective exchange rate deflated by ULC in manufacturing2007Q2 = 100
Source: Author's calculation based on Darvas (2012a and 2012b).
Figure 11
70
80
90
100
110
120
130
140
2007 2008 2009 2010 2011
PolandCzech RepublicHungarySlovak RepublicUkraine
Merchandise exports growth rate, 2007–20112007 = 100
Source: Author's calculations based on 2012 WDI database.
Figure 12
14 No data for Ukraine was available.
CESifo Forum 1/2013 (March)53
Focus
show the timing and scope of adjustments triggeredin particular countries by the external shock, thedata is set at 100 in the pre-crisis level of 2007(Figure 13).
The growth of production of total industry wasslow or declining as early as 2008 versus 2007. Itdecreased greatly in the crisis year of 2009, with themost severe reaction in Ukraine (74 percent) andHungary (82 percent). The adjustment in Polandwas the mildest (Figure 13). After the 2009 troughall of the countries studied recorded productionrecovery. In the whole period Poland did particular-ly well based on its ability to adjust costs and due toits relatively large domestic market. Generally theexternal shock made Poland and other countriesaware of how extensive the imported recession-related phenomena might be. It also shed light onthe varying adjustment capabilities of respectiveeconomies, including the potential and actual roleof the autonomous flexible exchange rates adjust-
ments. This recent experience,together with turbulence in theEMU itself, made Poland andother EU non-EMU membersto reflect more on their pacetowards ultimate EMU mem-bership.
GDP per capita and competitiveposition
While assessing the overall courseand results of the transformationprocess, one should take intoconsideration the circumstancesthat accompanied this process. It
is clear that some had a unique, specific nature; whileothers represented a set of common characteristics.Given the inheritance of centralised, totalitarian sys-tems (with its milder variant in Poland and Hungary)and the opportunities those countries could have usedin the phase of growth, it can be concluded that thecomparative advantages which Poland had on thethreshold of the transition process seem to have erod-ed rather quickly.15
Table 4 presents data on GDP per capita based onpurchasing power parity. The defined measure takesinto account the effects of GDP growth, as well as theinfluence of differences in price levels between coun-tries, and of changes in population. In order to com-pare the transformation results achieved in Poland tothose recorded in the selected countries of the region,Poland’s GDP was calculated as a percentage of theGDP of the countries under examination.
As Table 4 shows, the relative level of Polish GDP percapita in 1990 was comparable to that of Ukraine.However, it was equivalent to approximately only62 percent and 64 percent of the GDP per capita inHungary and Slovakia, respectively. Poland’s GDPper capita was only half of the GDP per capita in the
70
80
90
100
110
120
2007 2008 2009 2010 2011
PolandCzech RepublicHungarySlovak RepublicUkraine
Annual industrial production growth 2007 = 100
Source: Author's calculations based on 2012 WDI database.
Figure 13
Poland’s GDP per capita as a percent of GDP per capita of each analyzed country
Country 1990 1992 1994 1996 1998 2000 2002 2004 2005 2006 2007 2009 2011 Hungary 62 68 73 81 85 86 81 82 81 83 88 100 105 Czech Republic
50 52 58 58 66 68 66 67 65 65 66 71 75
Slovakia 64 76 82 83 86 92 88 88 83 84 81 86 87 Ukraine 100 114 191 270 313 318 280 246 247 243 239 290 284
Source: Author’s calculation based on 2012 WDI database.
Table 4
15 The author means the social mobilization and the ability of thesociety to self-organize themselves (Solidarity trade union).Poland could benefit not only from the Commercial Code existingsince the interwar period, but also from an established culture ofentrepreneurship and the experience of the relatively large privatesector.

Czech Republic. These figures clearly show the size ofthe initial economic gap between Poland, the thenCzechoslovakia and Hungary.
During the first years of the transformation inPoland, its GDP per capita was growing faster thanin the neighbouring countries. In 2000, the gap inrelation to Hungary and the Czech Republicdecreased by about 20 percentage points and in rela-tion to Slovakia by about 28 percentage points.Interestingly, Polish GDP per capita at PPP in -creased more than threefold compared to Ukraine.After the years 1999–2000, the relative levels of thePolish GDP per capita deteriorated (i.e. the SlovakRepublic started to develop faster than Poland). Theglobal financial crisis of 2008–2009 unveiledPoland’s comparative strength. This was reflected bya faster narrowing of GDP per capita gap (seeTable 4). Comparing the relative levels of this mea-sure achieved in Poland in 2011 with the initial val-ues recorded in 1990, the scale of progress is clearlyvisible. However, structural constraints and un-seized development opportunities arising from insuf-ficient determination of consecutive Polish govern-ments to implement further economic and institu-tional reforms prevented even higher growth.16
The World Economic Forum provides detailed mea-sures of countries’ competitiveness positions. In2005–2012, the Czech Republic consistently achievedthe best position amongst the countries analysed(Table 5). Earlier the relative leading position wasoccupied by Hungary. Between 2001–2007 Poland’srelative competitive position was seen as rather low,and only Ukraine was perceived as having lower thanPoland competitiveness. In 2008, the relative positionof Poland within the group had improved and since2009 it has been ranked second in the group of coun-tries analysed.
The following observations are also worthy of atten-tion: the stable and relatively high position of theCzech Republic, the improvement of the SlovakRepublic, and the worsening position of Hungary(Table 5). Hungary is an example of a country thatwas a leader in implementing reforms for many years,but which lost this position due to the lack of its willand ability to solve difficult fiscal policy problems. Itwas also perceived as an economy with a deterioratingquality of the institutional environment.
Throughout the period, Ukraine was ranked lowestamong the countries investigated, and the gapbetween it and the leaders of the group had beenincreasing. Ukraine is a country that has not beenable to seize the opportunities that opened for all thecountries of the region after 1989 (see also Tiffin2006).
Competitiveness ratings are sometimes criticized fortheir simplifications and diagrammatic view ofeconomies. However, the assessments derived fromthe GCR are rather consistent with the general pictureof transformation that emerges from our analyses.The methodology used in the rankings shed light onthe course of the transformation processes and enableidentification of problem areas inhibiting the processof catching-up with the developed countries.
Conclusions
In Poland, public disputes and controversies concern-ing the transformation process and its economic con-sequences are burdened with a high degree of subjec-tivity and ignorance about the specific initial condi-tions and the structural limitations accompanying themarket reforms. In Poland, as in the other countries ofthe region, very recent economic history continues toproduce emotions. Moreover, it is instrumentallyused, in particular by populist parties to attack theauthors of the reforms and those who took the risk of
CESifo Forum 1/2013 (March) 54
Focus
Relative position of Poland and the countries analysed in global competitiveness reports in 2001–2012
2001 2002 2003 2004 2005 2006 2007 2008 2009 2010 2011 2012 Hungary Hungary Hungary Hungary Czech R. Czech R. Czech R. Czech R. Czech R. Czech R. Czech R. Czech R. Czech R. Czech R. Czech R. Czech R. Hungary Slovak R. Slovak R. Slovak R. Poland Poland Poland Poland Slovak R. Slovak R. Slovak R. Slovak R. Slovak R. Hungary Hungary Poland Slovak R. Slovak R. Hungary Hungary Poland Poland Poland Poland Poland Poland Poland Hungary Hungary Hungary Slovak R. Slovak R. Ukraine Ukraine Ukraine Ukraine Ukraine Ukraine Ukraine Ukraine Ukraine Ukraine Ukraine Ukraine
Source: Author’s own synopsis based on Global Competitiveness Reports.
Table 5
16 During the period analysed, Poland had the lowest rate ofemployment among the EU-25 (Gorynia and Kowalski 2008).
CESifo Forum 1/2013 (March)55
Focus
managing the process of the institutional and market
reconstruction. In the light of the presented analysis,
it can be claimed that Poland and Hungary were the
best prepared for the transition from a centralized
economy to a market-led economy in terms of social
capital. In the case of Poland, this was the result of a
strong tradition of social self-organisation and the
existence, even in a period of dominance of a central-
ized system, of alternative pathways of social capital
development. However, it is often forgotten that the
initial economic situation of Poland was very
unfavourable. This refers to the stagnation of the
1980s and above all, to the structural characteristics
of the Polish economy.
The relative abundance of natural resources and a
centralized system of allocation formed the structure
of the production capacity. During the transition
process, this biased production capacity thwarted
the comparative advantage of the economy. In addi-
tion, the low ability to generate domestic savings,
and consequent relatively low investment level,
together with high employment in agriculture led to
a low level of capital-labour ratio and, more gener-
ally, to relatively low productivity. This feature of the
Polish economy, combined with a low employment
rate hampered progress in realization of social aspi-
rations.
Despite the limitations mainly arising from the struc-
tural specificity of the Polish economy, in comparison
to other countries, the results achieved after the insti-
tutional breakthrough of the years 1989–1990 should
be highly evaluated. Poland has improved its position,
measured by the most synthetic measure – the gross
domestic product per capita, against all the countries
analysed in the region.
While highly evaluating Poland’s transformation
process, the analyses also show many opportunities
for an even more rapid reduction of the economic and
social development gap that have not been seized. The
most important of them are nonsufficient economic
policy responses to one of the lowest employment rate
in Europe, failure to bringing the privatization process
to a conclusion, reform fatigue and a slowdown in fis-
cal reforms that could facilitate the ability of the
Polish economy to meet the requirements of euro area
membership and allow Poland to further improve its
competitive position.
An important test for the durability of the economic
results achieved and the adaptability of the countries
analysed was the way they responded to the globalfinancial crisis. To date Poland has best proven itsability to withstand this particular crash test. Thissuccess should not conceal Poland’s need to increaseits domestic savings supply and investment rate, andto carry out structural adjustments and release thereserves of efficiency and competitiveness inherent inthe improvement of its institutional framework.
References
Barisitz, S. (1999), “Ukraine: Macroeconomic Development andEconomic Policy in the First Eight Years of Independence”, Focus onTransition 2, 70–80.
Blanchard, O. J. (1994), “Transition in Poland”, The EconomicJournal 104, 1169–1177.
Campos, N.F. and F. Coricelli (2002), “Growth in Transition: WhatWe Know, What We Don’t, and What We Should”, Journal ofEconomic Literature 40, 1–75.
Darvas, Z., (2012a), Real Effective Exchange Rates for 178 Countries:A New Database, Bruegel Working Paper 2012/06.
Darvas, Z., (2012b), Compositional Effects on Productivity, LabourCost and Export Adjustment, Bruegel Policy Contribution 2012/11.
Dixit, A.K. (2007), Economics with and without the Law, in: Law -lessness and Economics: Alternative Modes of Governance, Princeton:Princeton University Press.
Gorynia, M. (2007), Studia nad transformacją i internacjonalizacjągospodarki polskiej, Difin, Warsaw.
Gorynia, M. and B. Jankowska (2005), „Rekomendacje dla strategiifirm polskich wobec ekspansji inwestorów zagranicznych”, RuchPrawniczy, Ekonomiczny i Socjologiczny LXVII(4), 223–237.
Gorynia, M. and T. Kowalski (2008), “Globalne i krajowe uwarunk-owania funkcjonowania polskich przedsiębiorstw”, Ekonomista 1,51–76.
Grossman, G.M. and E. Rossi-Hansberg (2008), “Trading in Tasks:A Simple Theory of Offshoring”, American Economic Review 98,1978–1997.
Gylfason, T. and E. Hochreiter (2009), “Growing Apart? A Tale ofTwo Republics: Estonia and Georgia”, European Journal of PoliticalEconomy 25, 355–370.
Gylfason, T. and E. Hochreiter (2010), Growing Together: Croatia andLatvia, CESifo Working Paper 3202.
Kellman, M.H. and Y. Shachmurove (2012), “EvolvingSophistication of Trade Patterns in a Transition Economy –Machinery Exports of Poland 1980–2009”, Poznan University ofEconomics Review 12(3), 9–38.
Kornai, J. (1985), Niedobór w gospodarce, PWE, Warsaw.
Kowalski, T. (2010), “Comparative Analysis of EconomicTransformation in Poland and Selected central European Countries”,in: Kowalski, T., S. Letza, and C. Wihlborg (eds.), InstitutionalChange in the European Transition Economies. The Case of Poland,Poznan: Wydawnictwo Uniwersytetu Ekonomicznego w Poznaniu,30–64.
Kowalski, T. (2012), “The Economic and Monetary Union Countriesvs. the Global Crisis”, Poznan University of Economics Review 12(2),19–46.
Kowalski, T. and A. Janc (1999), “Financial Contracts and Relationsin the Small and Medium Sized Enterprises Sector in Poland”, in:Green, Ch. and A. Mullineux (eds.), Economic Performance andFinancial Sector Reform in Central and Eastern Europe: CapitalFlows, Bank and Enterprise Restructuring, Cheltenham: EdwardElgar, 74–79.
Kowalski, T. and R. Stawarska (1999), “Poland’s Exchange RatePolicy in the 1990s”, in: Sweeney, R. J., Wihlborg, C. and T. D. Willett(eds.), Exchange Rate Policies for Emerging Market Economies,Boulder, CO: Westview Press, 351–374.
Kowalski, T., Wihlborg, C. and V. Vensel (2007), “Rozwój�rodowiska instytucjonalnego w nowych krajach Unii Europejskiej.Przypadek Estonii i Polski”, Ruch Prawniczy Ekonomiczny iSocjologiczny LXIX(1), 155–156.
Krugman, P. and M. Obstfeld, M. (2006), International Economics:Theory and Policy, Addison-Wesley: Pearson.
Malaga, K. (2004), Konwergencja gospodarcza w krajach OECD wświetle zagregowanych modeli wzrostu, Poznan: WydawnictwoAkademii Ekonomicznej w Poznaniu.
Paldam, M. and E. Gundlach (2008), “Two Views on Institutions andDevelopment: The Grand Transition vs. Primacy of Institutions”,Kyklos 61, 65–100.
Rodrik, D. (2007), One Economics, Many Recipes: Globalization,Institutions, and Economic Growth, Princeton and Oxford: PrincetonUniversity Press.
Rynarzewski, T. and A. Zielińska-Głębocka (2006), Międzynarodowestosunki gospodarcze: Teoria wymiany i polityki handlu zagranicznego,Warsaw: PWN.
Schreiner, J. (2008), “Labor Markets in Central, Eastern and South-Eastern European EU Member States: General Trends and Migra -tion Effects”, Focus on European Economic Integration 1, 82–99.
Sinn, H.W. and M. Werding (2001), “Immigration Following EUEastern Enlargement”, CESifo Forum 2(2), 40–47.
Tiffin, A. (2006), Ukraine: The Cost of Weak Institutions, IMFWorking Paper 167.
Wilczyński, W. (1985), Die polnische Wirtschaftsreform und diebetriebliche Selbstverwaltung 1982–1985, Poznan: WydawnictwoAkademii Ekonomicznej w Poznaniu.
Wilczyński, W. (1991), Od gospodarki scentralizowanej do gospodarkirynkowej (Polska 1990–1991): dylematy, przeszkody, rozwiązania,Poznan: PTE.
Williamson, J. (1990), “What Washington Means by Policy Reform”,in: Williamson, J (ed.), Latin American Adjustment: How Much HasHappened?, Washington DC: Institute for International Economics,5–20.
Williamson, O.E. (2000), “The New Institutional Economics: TakingStock, Looking Ahead”, Journal of Economic Literature 38, 595–613.
Wojtyna, A. (ed. 2008), Instytucje a polityka ekonomiczna w krajachna średnim poziomie rozwoju, Warsaw: PWE.
CESifo Forum 1/2013 (March) 56
Focus