polaris investor presentation...
TRANSCRIPT

MOMENTUM
March 3, 2008

1
MOMENTUM
Victory Motorcycles
6%
PG&A17%
ATV andSide-by-Side
Vehicles67%
Snowmobiles10%
Polaris Overview• Founded in 1954
• Manufacturer of a diversified mix of high-quality, high-performance motorized products for recreational and utility use
• Manufacturing and distribution facilities located in Minnesota, Wisconsin, Iowa and South Dakota
• Highly productive non-union workforce –3,200 strong
• Product innovation key to success
• National and international distribution system – 1,600 dealers in North America and 43 distributors and 6 subsidiaries in 130 countries
Percentage of 2007 SalesBy Product Line

2
MOMENTUMIndustry Overview
• 454,000 units (United States)
• Down 5%
• 165,000 units (season-end 3/31/07)
• Flat
• 280,000 units• up 15%
• 970,000 units • Down 11%
Worldwide Market Size and
% change2007 vs. 2006
• Hardest working, smoothest riding, easy customization
• Recreational RZR model
• New Customers• New products• New segments
• John Deere• Yamaha• Kawasaki
Side-by-SideVehicles
• Unique designs• Highest quality• American made
• 53 years of experience
• Strong brand recognition
• Industry-leading performance and features; full line of products
Polaris Competitive Advantage
Motorcycles (Cruisers and Touring)
Snowmobiles
ATVs
• Overall economic conditions
• New products• Demographic
trends
• Harley Davidson• Honda• Yamaha
• Weather dependent
• Mature market
• BRP• Arctic Cat• Yamaha
• Overall economic conditions
• New products
• Honda• Yamaha• Suzuki
Industry DriversTop ThreeCompetitors

3
MOMENTUM
$3.10$2.72
$3.15$2.97
$2.58$2.28
$1.99$1.81
$1.64$1.48
1998 1999 2000 2001 2002 2003 2004 2005 2006 2007 2008Guidance
Consistent FinancialPerformance
$1,657 $1,780$1,870$1,773$1,552$1,468$1,427
$1,327$1,245
$1,106
1998 1999 2000 2001 2002 2003 2004 2005 2006 2007 2008Guidance
Dollars(in millions)
Net Income Per Share from Continuing Operations1998-2007
$3.28 to$3.40
Up 6% to 10%
Sales from Continuing Operations1998-2007
Up 3% to 5%
* A reconciliation of the Company’s calculation of cash flow provided to the most directly comparable cash flow measure, as required by Regulation G, appears in the appendix of this presentation.
Per Diluted Share
66%
41%37%38%38%41%42%46%50%47%
1998 1999 2000 2001 2002 2003 2004 2005 2006 2007
Return on Shareholders’ Equity from Continuing Operations 1998-2007 - Industry-Leading
$189$178
$211$202$179$177
$151$130$120
$110
1998 1999 2000 2001 2002 2003 2004 2005 2006 2007Before Changes in Current Operating Items and Deferred Taxes
Cash Flow from Continuing Operations*1998-2007
Dollars(in millions)

4
MOMENTUM
$64
$53
$90
$57 $61 $62$53 $52
$59
$89
1998 1999 2000 2001 2002 2003 2004 2005 2006 2007 2008
$ In
Millio
ns
$14$40 $38 $52 $40 $49
$76 $73 $67
$132$103
$308
1996 1997 1998 1999 2000 2001 2002 2003 2004 2005 2006 2007
$0.36 $0.40 $0.44 $0.50 $0.56 $0.62
$0.92
$1.12$1.24
$1.36$1.52
1998 1999 2000 2001 2002 2003 2004 2005 2006 2007 2008
1.0
3.02.2
3.02.4 2.2 2.4 2.4
1.4
2.4
6.9
1.9
1996 1997 1998 1999 2000 2001 2002 2003 2004 2005 2006 2007
Consistent Financial Performance: Cash Flow Used to Fund…
Capital Investments for Continuing Operations
Shares RepurchasedCumulatively the Company has repurchased 31.1 million of 37.5 million authorized at an average price of $31.88 per share thru 12/31/07
Dividends
In M
illio
ns
Shares repurchased
$ In
Mill
ions
$65 - $70
Cash spent
+12%
Guidance Guidance
(Per Share)
5
MOMENTUM
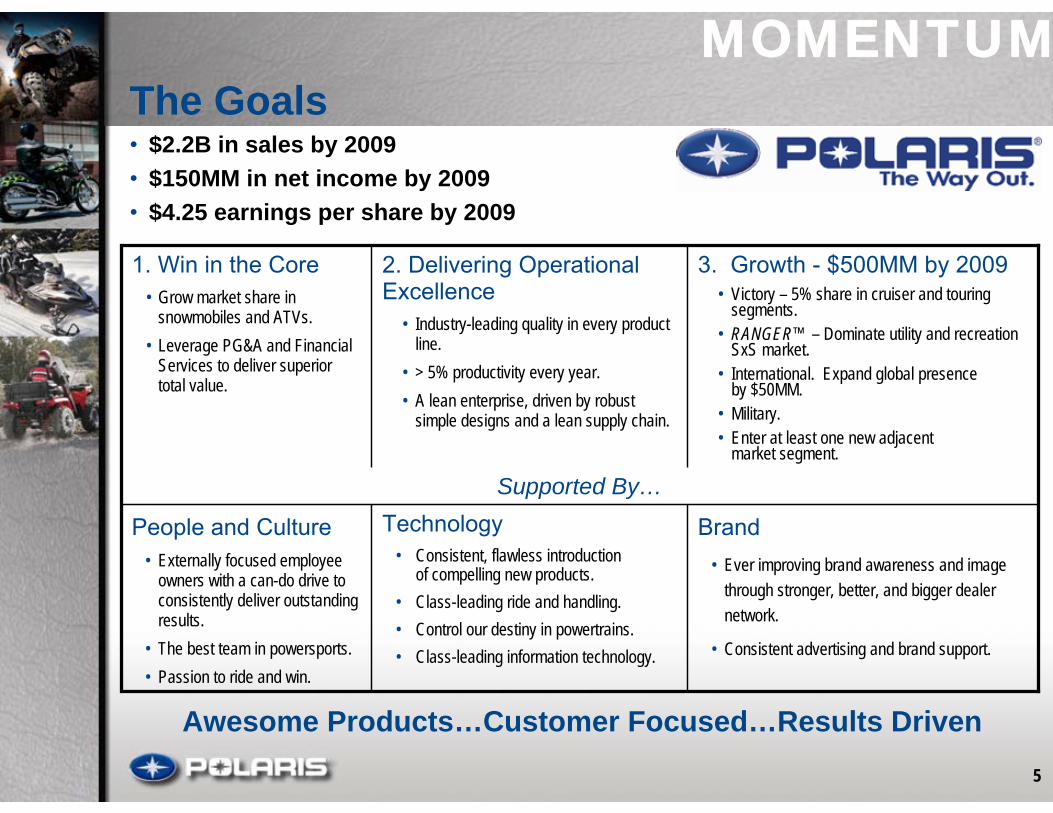
Awesome Products…Customer Focused…Results Driven
Supported By…
Brand• Ever improving brand awareness and image
through stronger, better, and bigger dealer network.
• Consistent advertising and brand support.
Technology• Consistent, flawless introduction
of compelling new products.• Class-leading ride and handling.• Control our destiny in powertrains.• Class-leading information technology.
People and Culture• Externally focused employee
owners with a can-do drive to consistently deliver outstanding results.
• The best team in powersports.• Passion to ride and win.
3. Growth - $500MM by 2009• Victory – 5% share in cruiser and touring
segments.• RANGER™ – Dominate utility and recreation
SxS market.• International. Expand global presence
by $50MM.• Military.• Enter at least one new adjacent
market segment.
2. Delivering Operational Excellence
• Industry-leading quality in every product line.
• > 5% productivity every year.• A lean enterprise, driven by robust
simple designs and a lean supply chain.
1. Win in the Core• Grow market share in
snowmobiles and ATVs.• Leverage PG&A and Financial
Services to deliver superior total value.
The Goals• $2.2B in sales by 2009• $150MM in net income by 2009• $4.25 earnings per share by 2009

6
MOMENTUM1. Win in the Core…Improving Our ATV and Snowmobile Businesses2007 Results:• Gained market share in all our
businesses including core ATVs and snowmobiles
• Core ATVs and snowmobile dealer inventory was lower at yearend 2007 compared to 2006
• More aggressive with advertising and sales promotions in 2007 to remain competitive in ATVs and snowmobiles
• Introduced innovative new products
2008 Objectives:• Further reduce dealer inventory• Industry leading Quality• Successfully launch innovative model
year 2009 new products
$1,240$1,117 $1,195
2005 2006 2007 2008
ATV Sales(Includes Side-by-Side vehicles)
(millions)
$257
$157 $179
2005 2006 2007 2008
Snowmobile Sales (millions)
We Expect to Win in 2008 and Beyond
Guidance
Guidance
Up 3% to 5%
Up single digits percent+14%
+7%

7
MOMENTUM
Accessorized RANGER RZRIncludes:
Sport RoofHalf WindshieldFront & Back BrushguardsLock n’ Ride RacksCargo Box
Parts Garments & Accessories• Highest margin product line (40+% gross margins)• Leveraging installed base• Focused on hot new products
– Victory Vision™• Introduced 100 Victory Vision accessories in 2007
– RANGER RZR™• Introduced 75 RANGER RZR accessories in 2007
– Military• Growth through innovation
PG&A SalesYear ended December 31
67% ATV andSide-by-Side
Vehicles
19%Snowmobile
PG&A Sales by Business Line - 2007
6% Victory
8% GeneralMerchandise
1. Win in the Core…Leverage PG&A
$293
$270$274
2005 2006 2007 2008Guidance
Up 3% to 5%Dollars (in Millions) +9%

8
MOMENTUM
Wholesale credit31%
Other Activities
7%
RetailFinancing
(HSBC & GE Bank) 62%
Financial Services Incomeby Category - 2007
67% ATV
1. Win in the Core…Financial ServicesFinancial Services Income
consists of wholesale floorplanfinancing income; retail credit volume-based fee income; insurance and extended service contracts fee income
– Generated $45.3 million of income in 2007 from all financial services sources
Wholesale Financing• 50/50 Joint Venture with GE• Provides floorplan financing to Polaris
dealers in the United States• Wholesale portfolio losses are within industry
norms• Expect lower income again in 2008 as dealer
inventories and interest rates decline
$723$747$797
2005 2006 2007
Wholesale Portfolio – Polaris Acceptance(millions)
Receivable Portfolio
$13.9
$17.1
$14.2
2005 2006 2007Income from PA

9
MOMENTUM
$22.2
$27.1$28.2
2005 2006 2007 2008
Income from HSBC and GE Bank Retail Credit Agreements
(millions)
1. Win in the Core…Financial Services – Retail Credit FinancingPolaris has two providers for Retail Credit in the United
States:• GE Money Bank provides close-end installment consumer and commercial
credit to customers for both Polaris and non-Polaris products.• HSBC provides revolving retail credit financing under the Polaris StarCard
private label credit card program.HSBC arrangement expected to change in 2008• HSBC recently informed Polaris that it wants to make changes to a 2005
contractual arrangement currently in place to provide revolving retail credit financing for Polaris products.
• Polaris and HSBC are currently in discussions regarding the financing arrangement and at the present time management believes it is likely that it will be necessary for Polaris to forgo its volume-based fee income and/or absorb increased promotional support costs after March 1, 2008 in order to ensure that retail credit alternatives continue to be available for Polaris customers through HSBC.
2008 Retail Credit Income Guidance:• The less favorable terms imposed by HSBC after March 1, 2008,
combined with HSBC discontinuing the financing of non-Polaris products in July 2007 will likely result in a significantly lower income generated from the HSBC and GE Bank retail credit agreements for calendar 2008 in the range of $5 to $10 million compared to $28 million in 2007.
$5 to $10million
Guidance

10
MOMENTUM2. Delivering Operational Excellence…Strengthen Our Lean Cost Competitive Edge• Striving for a “Toyota-like” level of
operational excellence through three principles: Quality, Cost and Speed
• 2010 Goals: – Quality: Improve consumer satisfaction by 50% by 2010– Cost: Reduce system-wide cost by over 20% by 2010– Speed: Improve speed to the consumer by 50% by 2010
• Currently realizing results from initial efforts:
– 10% improvement in Quality for 2007– 3% reduction in system-wide cost for 2007– 15%+ improvement in speed to consumer for
2007
• For 2008 we expect to improve even more• Over time, Operational Excellence will
transform our competitive position
2008 RANGER Crew™The RANGER Crew which was brought to market in the fourth quarter 2007 was completed several months faster than would have been possible even a year ago. Speed will become a competitive weapon for Polaris going forward.

11
MOMENTUM3. Grow $500 Million in our Growth Businesses by 2009 – Victory Motorcycles
$99 $113 $113
2005 2006 2007 2008
Victory Sales
2007 Results:• Entered new attractive segment – Luxury
Touring - with two all new Vision models2008 Objectives:• Grow market share• Penetrate the luxury touring market
segment with a full year of Vision models
Guidance
Up single digits percent
CustomCruiser - Vegas
ClassicCruiser - Kingpin
MuscleCruiser - Hammer
ExtremeCustom - Jackpot
Touring (Soft) - KP Tour
Touring(Hard)
LuxuryTourer
Opportunity
Vision Tour™
Vision Street™

12
MOMENTUM
Industry Leading Side-by-Side Vehicles
3. Grow $500 Million in our Growth Businesses by 2009 – Side-by-Side Vehicles
Dominant SxS Line-UpDominant SxS LineDominant SxS Line--UpUp
RANGERRANGER
RZRRZR
CREWCREW
2007 Results:• Aggressively Expanded RANGER™ in Utility Segment
with the introduction of RANGER Crew™• Entered Emerging Recreation Segment with RANGER
RZR™• #1 Quality Side-By-Side Vehicle• Now represents 40% of total ATV $ sales
2008 Objectives:• Dominate the side-by-side business• Grow market share• Successfully introduce innovative model year 2009
side-by-sides
2005 2006 2007 2008
Side-by-Side Sales(included in reported ATV sales)
3 Year CAGR - 31%
(millions)
Guidance
Up double digits percent

13
MOMENTUM
Polaris Estimate
2007 Market - $1.9 BillionEstimated Market Size For Polaris Products
Polaris Subsidiaries
France
Australia/NZ
UK
Sweden/Norway
FinlandRussia GermanyItaly
Spain
Portugal
Others
Japan
2005 2006 2007 2008
International Sales
$233
Expand Global Presence by $50 Million by 2009
3. Grow $500 Million in our Growth Businesses by 2009 - International
International Revenue Mix
Percent of 2007 Sales from Continuing Operations
Victory 1%
ATV/RANGER66%
Snowmobile17%
PG&A16%
$258$233Growth Opportunities Internationally Include:
−market share growth− enter into additional markets and countries − expand product offerings, like RANGER
RZR™ in 2008
Dollars (in Millions)
Guidance
Continued Growth+11%
14
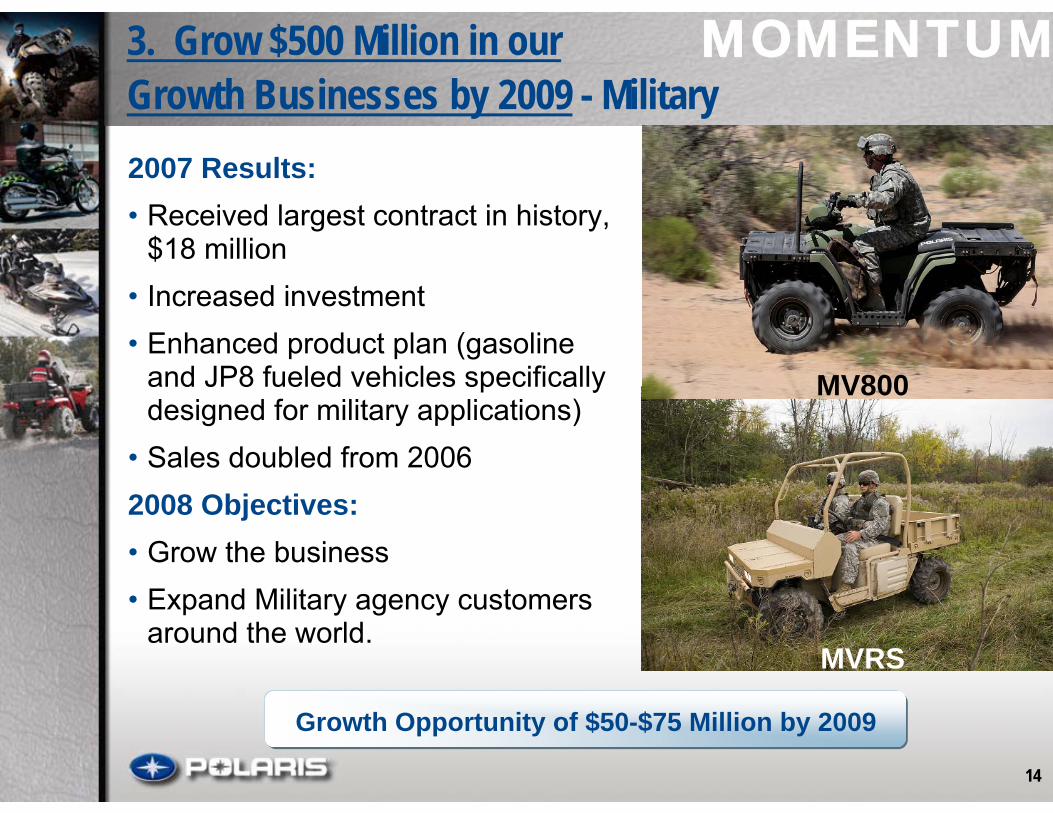
MOMENTUM3. Grow $500 Million in our Growth Businesses by 2009 - Military2007 Results:• Received largest contract in history,
$18 million• Increased investment • Enhanced product plan (gasoline
and JP8 fueled vehicles specifically designed for military applications)
• Sales doubled from 20062008 Objectives:• Grow the business• Expand Military agency customers
around the world.
Growth Opportunity of $50-$75 Million by 2009
MV800
MVRS

15
MOMENTUM
Adjacent Markets• Profitable Top Line Growth• Migrate Polaris into at least
one Adjacent Market– Prefer new customer base– Prefer new distribution
channel
• Growth could come in the following way(s):– Organic– Strategic Alliance– Acquisition
• Expect to announce opportunity later in 2008
3. Grow $500 Million in our Growth Businesses by 2009 – Businesses by 2009
?? ? ?? ?Polaris
Traditional MarketsSnowmobiles
ATVsPWC
WorkRANGER
Widetrack Snowmobiles
Fun/LifestyleVictory
QuadricyclesSport ATVs
RANGER RZR™
MilitaryMV
Ranger
Profitable Growth!
?? ?
Adjacent Market Growth Opportunities

16
MOMENTUM2008 Year GuidanceFull Year 2008Full Year 2008
• Full year 2008 earnings from continuing operations is expected to be in the range of $3.28 to $3.40 per diluted share, up 6% to 10% from $3.10 in 2007.
• Sales growth for full year 2008 is expected to be in a range of up 3% to 5% from 2007 sales of $1.78 billion.
•Sale guidance by business: •ATVs, including RANGER™ – Up 3% to 5%•Snowmobiles – Up single digits percent•Victory motorcycles – Up in the single digits percent range•PG&A – Grow at a similar pace as overall Company
• Gross margins expected to expand up to 100 basis points
First Quarter 2008First Quarter 2008
• First quarter 2008 earnings from continuing operations guidance range is $0.44 to $0.49 per diluted share up from Q1 2007 earnings of $0.34 per share.
• Sales in first quarter 2008 are expected to be up 15% to 18% from Q1 2007 due to higher ATV sales resulting primarily from continued growth from the RANGER side-by-side vehicle business, including the very successful RANGER RZR™ and PG&A sales growth resulting from the good snowfall in North America.

17
MOMENTUMAppendix
Our presentation and responses to your questions may contain certain statements which may be considered forward looking for the purposes of the Private Securities Litigation Reform Act of 1995. We caution you that actual results could differ materially from those projected in a forward looking statement which by their nature involve risk that results may differ from those anticipated. Additional information concerning the factors that could cause results to differ materially from thoseanticipated may be found in Polaris’ annual report, 10-K, 8-K, 10-Q and form S-3 registration statements.
Regulation G Reconciliation
Private Securities Litigation Reform Act of 1995 -Polaris Industries Inc. Disclosure Litigation Statement
YearCash FlowProvided
Deferred income taxes
Changes in current operating items
One-time provisionfor litigationloss, net (1)
Net cash provided by operating
activities1998 $109.5 $4.4 $50.4 ($39.6) $124.71999 119.8 2.8 11.9 - 134.52000 129.7 1.3 (25.9) - 105.12001 150.8 (10.6) 51.8 - 192.02002 176.9 4.3 14.6 - 195.82003 179.1 (8.7) (7.9) - 162.52004 202.3 (1.5) 36.3 - 237.12005 211.4 1.6 (50.5) - 162.52006 177.8 1.3 (26.3) - 152.82007 189.1 (10.3) 34.4 - 213.2
Cash Flow Provided to Net cash provided by operating activities from continuing operations (dollars in millions)
(1) In 1998, Polaris entered into a settlement agreement related to a trade secret infringement claim brought by Injection Research Specialists, Inc. The one-time provision for litigation loss amounted to $61.4 million pretax or $0.77 per diluted share in 1998.