police department - city hall wichita, kansas measures/police.pdf · 2016 performance measures...
TRANSCRIPT
2016 Performance Measures Report
POLICE DEPARTMENT
Wichita, Kansas
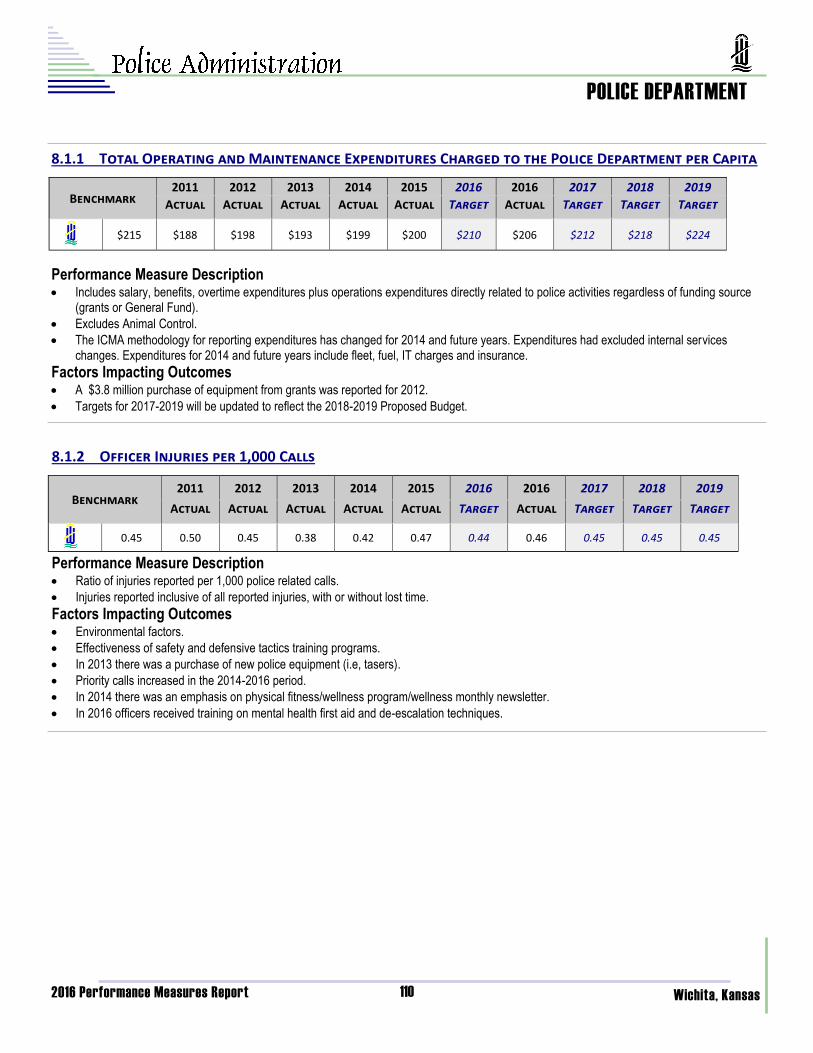
8.1.1 Total Operating and Maintenance Expenditures Charged to the Police Department per Capita
Performance Measure Description Includes salary, benefits, overtime expenditures plus operations expenditures directly related to police activities regardless of funding source
(grants or General Fund).
Excludes Animal Control.
The ICMA methodology for reporting expenditures has changed for 2014 and future years. Expenditures had excluded internal services changes. Expenditures for 2014 and future years include fleet, fuel, IT charges and insurance.
Factors Impacting Outcomes A $3.8 million purchase of equipment from grants was reported for 2012.
Targets for 2017-2019 will be updated to reflect the 2018-2019 Proposed Budget.
8.1.2 Officer Injuries per 1,000 Calls
Performance Measure Description Ratio of injuries reported per 1,000 police related calls.
Injuries reported inclusive of all reported injuries, with or without lost time.
Factors Impacting Outcomes Environmental factors.
Effectiveness of safety and defensive tactics training programs.
In 2013 there was a purchase of new police equipment (i.e, tasers).
Priority calls increased in the 2014-2016 period.
In 2014 there was an emphasis on physical fitness/wellness program/wellness monthly newsletter.
In 2016 officers received training on mental health first aid and de-escalation techniques.
Benchmark 2011 2012 2013 2014 2015 2016 2017 2018 2016 2019
Actual Actual Actual Actual Actual Target Target Target Actual Target
$215 $188 $198 $193 $199 $200 $210 $212 $218 $206 $224
Benchmark 2011 2012 2013 2014 2015 2016 2017 2018 2016 2019
Actual Actual Actual Actual Actual Target Target Target Actual Target
0.45 0.50 0.45 0.38 0.42 0.47 0.44 0.45 0.45 0.46 0.45
110
2016 Performance Measures Report
POLICE DEPARTMENT
Wichita, Kansas
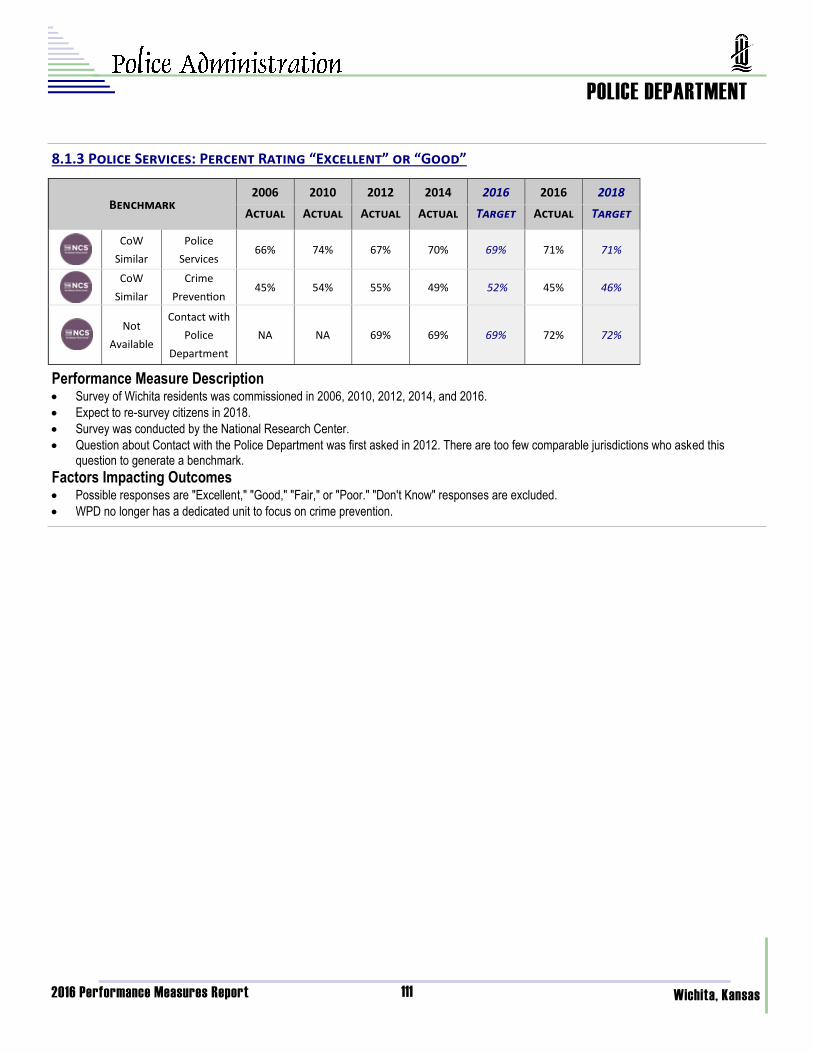
8.1.3 Police Services: Percent Rating “Excellent” or “Good”
Performance Measure Description Survey of Wichita residents was commissioned in 2006, 2010, 2012, 2014, and 2016.
Expect to re-survey citizens in 2018.
Survey was conducted by the National Research Center.
Question about Contact with the Police Department was first asked in 2012. There are too few comparable jurisdictions who asked this question to generate a benchmark.
Factors Impacting Outcomes Possible responses are "Excellent," "Good," "Fair," or "Poor." "Don't Know" responses are excluded.
WPD no longer has a dedicated unit to focus on crime prevention.
Benchmark 2006 2010 2012 2014 2016 2016 2018
Actual Actual Actual Actual Target Actual Target
CoW
Similar
Police
Services 66% 74% 67% 70% 69% 71% 71%
CoW
Similar
Crime
Prevention 45% 54% 55% 49% 52% 45% 46%
Not
Available
Contact with
Police
Department
NA NA 69% 69% 69% 72% 72%
111

2016 Performance Measures Report
POLICE DEPARTMENT
Wichita, Kansas
8.2.1 Number of External Citizen Complaints
Performance Measure Description Number of complaints from citizens outside of the Wichita Police Department made against members of the Wichita Police Department.
Factors Impacting Outcomes Prior to 2009, there were three complaint categories: Internal, External, and Miscellaneous. In 2009, external and miscellaneous complaint
types were combined.
Public education on external complaint process is a potential factor in the decreased number of complaints in 2014 and the further reduction in 2015.
In 2016 the decrease due to several factors: new Chief of Police who met and interacted with community members, which led to building and fostering relationships with the community, a departmental emphasis on transparency, and the and equipping all field officers with Axon body-worn cameras.
Benchmark 2011 2012 2013 2014 2015 2016 2017 2018 2016 2019
Actual Actual Actual Actual Actual Target Target Target Actual Target
50 88 123 102 83 43 76 50 50 18 50
8.2.2 Number of Internal Complaints
Performance Measure Description Number of complaints from members of the Wichita Police Department made against other members of the Wichita Police Department.
Factors Impacting Outcomes Willingness of employees to file reports.
There was improved communication regarding the complaint process in 2015, which might have been a contributing factor.
In 2016, there was a different approach to internal complaints, and a greater focus was placed on coaching and mentoring.
Benchmark 2011 2012 2013 2014 2015 2016 2017 2018 2016 2019
Actual Actual Actual Actual Actual Target Target Target Actual Target
92 109 119 112 141 96 120 92 92 70 92
112

2016 Performance Measures Report
POLICE DEPARTMENT
Wichita, Kansas
8.3.1 Number of Cases in Schools
Performance Measure Description Based on the number of cases involving SROs.
Factors Impacting Outcomes In 2011 the number of SRO positions was reduced from 11 to 7 and is limited to high schools.
Increases reflect improved reporting, tracking and the use of ATA (Agreement to Appear) instead of arrests.
Benchmark 2011 2012 2013 2014 2015 2016 2017 2018 2016 2019
Actual Actual Actual Actual Actual Target Target Target Actual Target
973 776 929 923 1,125 911 938 973 973 934 973
8.3.2 Number of Truancy Contacts
Performance Measure Description Number of times SROs had contact with students who were truant or attempting to leave campus.
Factors Impacting Outcomes In 2011 the number of SRO positions was reduced from 11 to 7 and is limited to high schools.
In 2013 and 2014, the primary reasons for the increase were SRO efforts and more timely school attendance information.
In 2015 & 2016, SROs focused more on issuing ATAs (Agreements to Appear) in schools and attendances.
In 2016, new Southeast High School relocated to 127th & Pawnee (rural area) where there are no businesses within walking distance.
Benchmark 2011 2012 2013 2014 2015 2016 2017 2018 2016 2019
Actual Actual Actual Actual Actual Target Target Target Actual Target
1,279 846 790 1,317 1,436 1,433 1,244 1,279 1,279 928 1,279
8.3.3 Number of Law-Related Classes Taught
Performance Measure Description Total of all classes taught or facilitated by School Resource Officers throughout the Wichita Public Schools (USD 259).
Factors Impacting Outcomes In 2011 the number of SRO positions was reduced from 11 to 7 and is limited to high schools.
In 2013, time availability based on curriculum requirements; SROs spent most of their time handling juvenile crimes and school issues.
In 2014, the focus was on being more proactive with student and intervene with truancy and other minor violations. Additionally, USD 259 currently has a curriculum on law-related classes and occasionally asks SRO to assist.
In 2015, the SRO at South High School taught classes to educate girls about human trafficking crimes.
In 2016, decrease caused by two factors: USD 259 changed school hours and created a shorter school year calendar 2016/2017; and SRO’s are limited to when they can teach in classrooms.
Benchmark 2011 2012 2013 2014 2015 2016 2017 2018 2016 2019
Actual Actual Actual Actual Actual Target Target Target Actual Target
176 478 361 214 177 164 229 176 176 149 176
113
2016 Performance Measures Report
POLICE DEPARTMENT
Wichita, Kansas
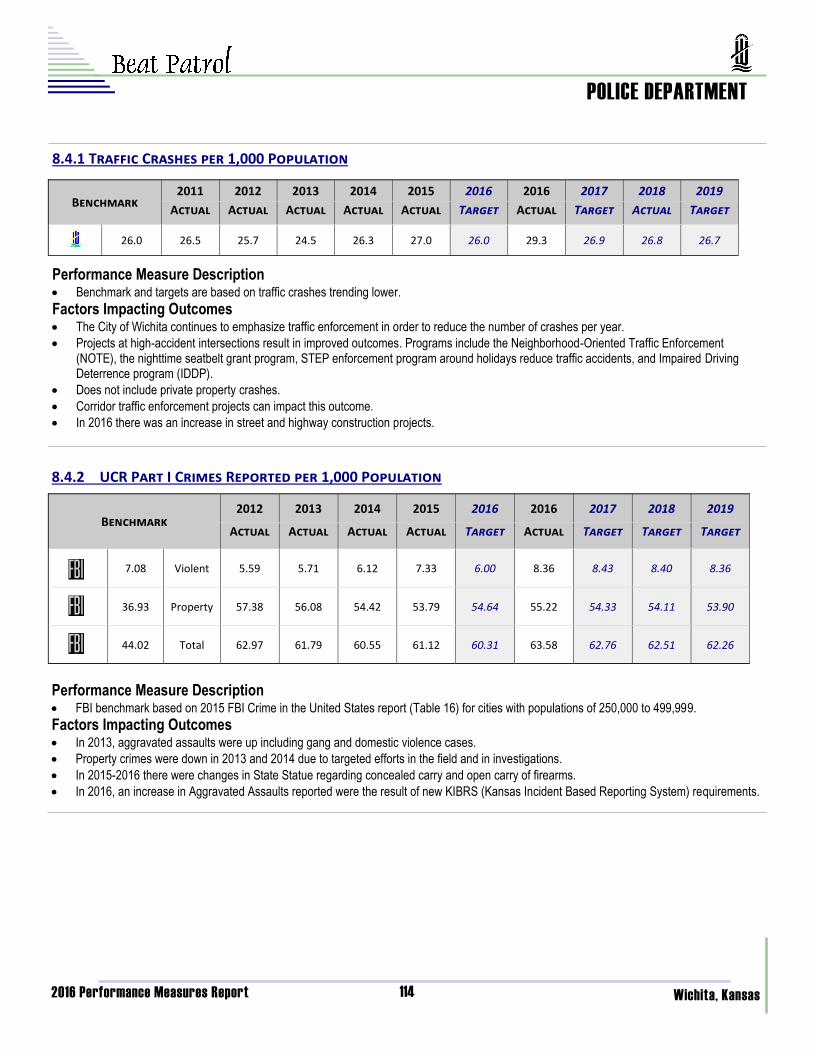
8.4.1 Traffic Crashes per 1,000 Population
Performance Measure Description Benchmark and targets are based on traffic crashes trending lower. Factors Impacting Outcomes The City of Wichita continues to emphasize traffic enforcement in order to reduce the number of crashes per year.
Projects at high-accident intersections result in improved outcomes. Programs include the Neighborhood-Oriented Traffic Enforcement (NOTE), the nighttime seatbelt grant program, STEP enforcement program around holidays reduce traffic accidents, and Impaired Driving Deterrence program (IDDP).
Does not include private property crashes.
Corridor traffic enforcement projects can impact this outcome.
In 2016 there was an increase in street and highway construction projects.
Benchmark 2011 2012 2013 2014 2015 2016 2017 2018 2016 2019
Actual Actual Actual Actual Actual Target Target Actual Actual Target
26.0 26.5 25.7 24.5 26.3 27.0 26.0 26.9 26.8 29.3 26.7
8.4.2 UCR Part I Crimes Reported per 1,000 Population
Performance Measure Description FBI benchmark based on 2015 FBI Crime in the United States report (Table 16) for cities with populations of 250,000 to 499,999.
Factors Impacting Outcomes In 2013, aggravated assaults were up including gang and domestic violence cases.
Property crimes were down in 2013 and 2014 due to targeted efforts in the field and in investigations.
In 2015-2016 there were changes in State Statue regarding concealed carry and open carry of firearms.
In 2016, an increase in Aggravated Assaults reported were the result of new KIBRS (Kansas Incident Based Reporting System) requirements.
Benchmark 2012 2013 2014 2015 2016 2017 2018 2016 2019
Actual Actual Actual Actual Target Target Target Actual Target
7.08 Violent 5.59 5.71 6.12 7.33 6.00 8.43 8.40 8.36 8.36
36.93 Property 57.38 56.08 54.42 53.79 54.64 54.33 54.11 55.22 53.90
44.02 Total 62.97 61.79 60.55 61.12 60.31 62.76 62.51 63.58 62.26
114

2016 Performance Measures Report
POLICE DEPARTMENT
Wichita, Kansas
8.4.3 Average Response Time in Minutes to Top Priority (Emergency) Calls: Dispatch to Arrival
Performance Measure Description
Includes emergency and Priority 1 calls.
Emergency calls are those where a life-threatening situation exists or a serious felony crime is in progress.
Priority 1 calls are defined as urgent calls where a serious crime has just occurred, or is imminent; bodily injury has just occurred, or is imminent; or another agency requires immediate police assistance.
Time listed is from dispatch to arrival.
Factors Impacting Outcomes Current Wichita Police Department policy is to have officers respond with lights and sirens only in cases when officers are in trouble or a
supervisor has authorized that level of response, which is about 2% of emergency calls. In all other cases, officers follow posted speed limits and traffic signals.
The volume and timing of calls impacts the response time. If calls are distributed throughout the day, response times will be faster than if calls are concentrated.
Beat size is based on call load. An officer’s response time can vary based on the size of the beat.
Road construction and repairs, traffic, and weather can impact drive time.
Staffing levels impact response times, so this measure is tied to the measure for recruit officers hired (8.11.2).
Does not include officer-initiated responses to top priority situations.
Benchmark 2011 2012 2013 2014 2015 2016 2017 2018 2016 2019
Actual Actual Actual Actual Actual Target Target Target Actual Target
4.95 5.37 7.34 7.53 7.77 7.94 7.75 7.50 7.50 8.17 7.50
8.4.4 Top Priority (Emergency) Police Calls per 1,000 Population
Performance Measure Description Emergency calls are those where a life-threatening situation exists or a serious felony crime is in progress.
Priority 1 calls are defined as urgent calls where a serious crime has just occurred, or is imminent; bodily injury has just occurred, or is imminent; or another agency requires immediate police assistance.
2012 Actual includes 20,767 Top Priority calls into 911.
2013 Actual includes 21,716 Top Priority calls into 911.
2014 Actual includes 22,938 Top Priority calls into 911.
2015 Actual includes 23,857 Top Priority calls into 911.
2016 Actual includes 24,430 Top Priority calls into 911.
Factors Impacting Outcomes Does not include officer-initiated responses to top priority situations.
Call volume for top priority calls has increased consecutively in the last three years.
Benchmark 2011 2012 2013 2014 2015 2016 2017 2018 2016 2019
Actual Actual Actual Actual Actual Target Target Target Actual Target
97.6 63.8 66.0 56.3 59.3 61.4 66.6 64.4 66.2 62.6 68.0
115
2016 Performance Measures Report
POLICE DEPARTMENT
Wichita, Kansas
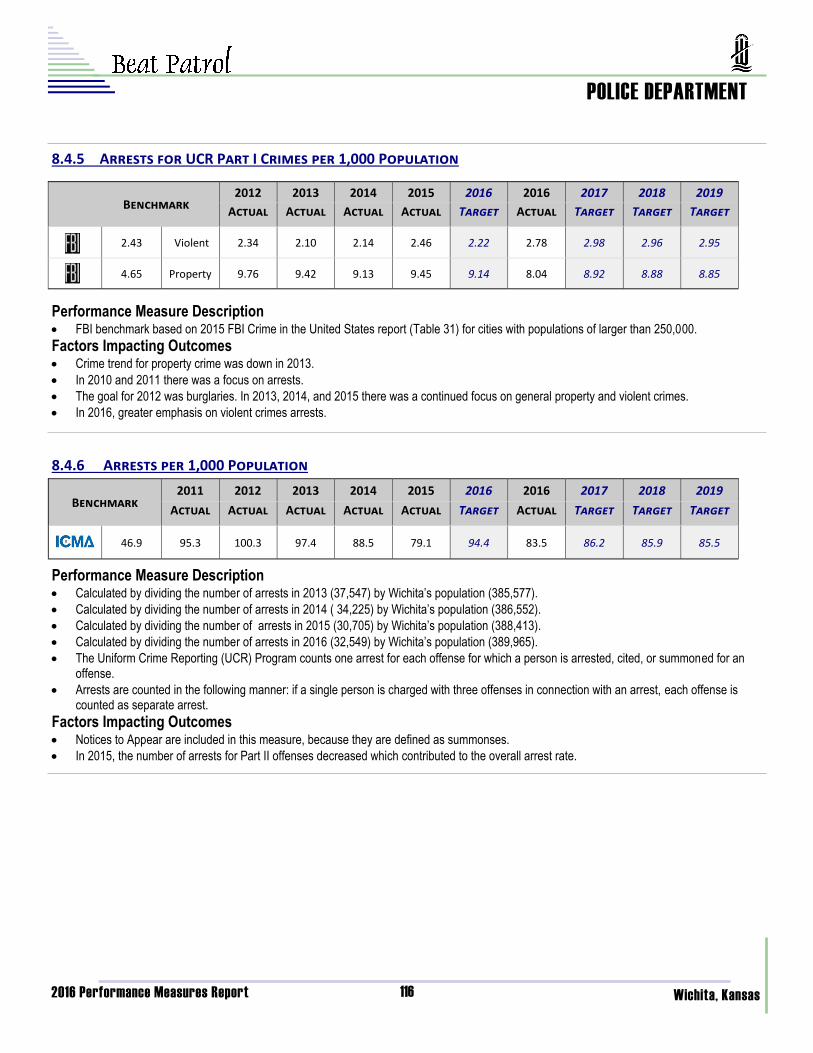
8.4.5 Arrests for UCR Part I Crimes per 1,000 Population
Performance Measure Description FBI benchmark based on 2015 FBI Crime in the United States report (Table 31) for cities with populations of larger than 250,000.
Factors Impacting Outcomes Crime trend for property crime was down in 2013.
In 2010 and 2011 there was a focus on arrests.
The goal for 2012 was burglaries. In 2013, 2014, and 2015 there was a continued focus on general property and violent crimes.
In 2016, greater emphasis on violent crimes arrests.
8.4.6 Arrests per 1,000 Population
Performance Measure Description Calculated by dividing the number of arrests in 2013 (37,547) by Wichita’s population (385,577).
Calculated by dividing the number of arrests in 2014 ( 34,225) by Wichita’s population (386,552).
Calculated by dividing the number of arrests in 2015 (30,705) by Wichita’s population (388,413).
Calculated by dividing the number of arrests in 2016 (32,549) by Wichita’s population (389,965).
The Uniform Crime Reporting (UCR) Program counts one arrest for each offense for which a person is arrested, cited, or summoned for an offense.
Arrests are counted in the following manner: if a single person is charged with three offenses in connection with an arrest, each offense is counted as separate arrest.
Factors Impacting Outcomes Notices to Appear are included in this measure, because they are defined as summonses.
In 2015, the number of arrests for Part II offenses decreased which contributed to the overall arrest rate.
Benchmark 2011 2012 2013 2014 2015 2016 2017 2018 2016 2019
Actual Actual Actual Actual Actual Target Target Target Actual Target
46.9 95.3 100.3 97.4 88.5 79.1 94.4 86.2 85.9 83.5 85.5
Benchmark 2012 2013 2014 2015 2016 2017 2018 2016 2019
Actual Actual Actual Actual Target Target Target Actual Target
2.43 Violent 2.34 2.10 2.14 2.46 2.22 2.98 2.96 2.78 2.95
4.65 Property 9.76 9.42 9.13 9.45 9.14 8.92 8.88 8.04 8.85
116
2016 Performance Measures Report
POLICE DEPARTMENT
Wichita, Kansas
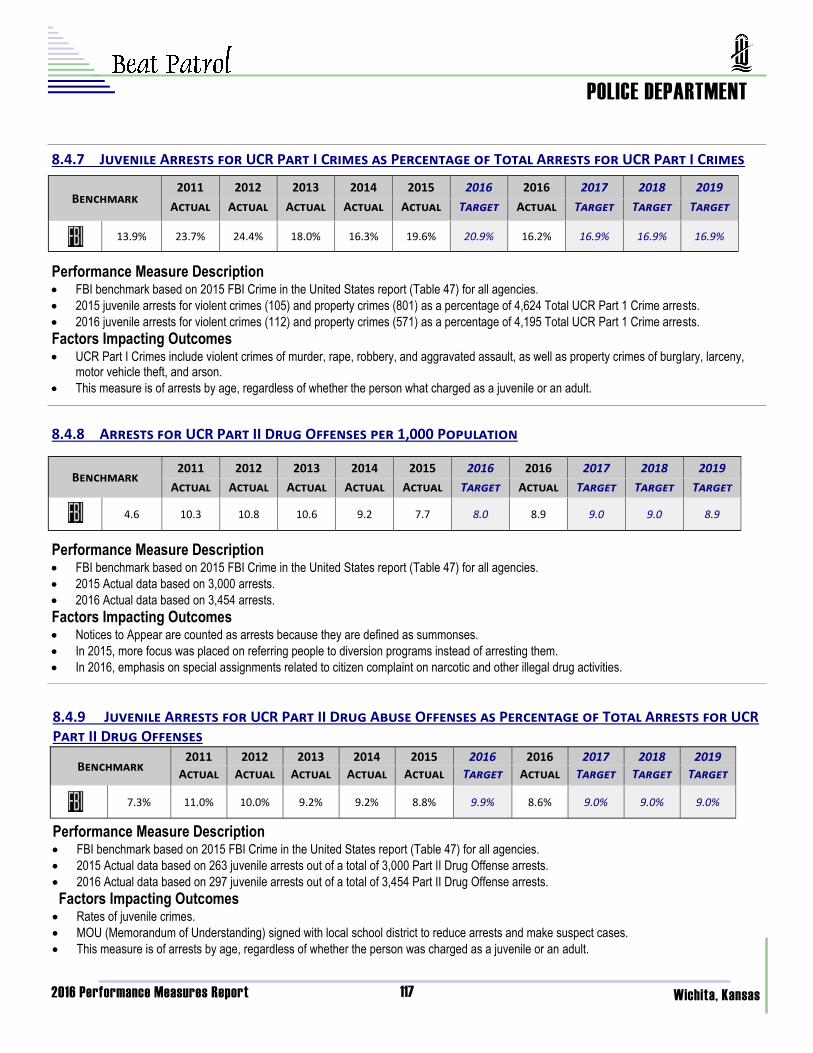
8.4.7 Juvenile Arrests for UCR Part I Crimes as Percentage of Total Arrests for UCR Part I Crimes
Performance Measure Description FBI benchmark based on 2015 FBI Crime in the United States report (Table 47) for all agencies.
2015 juvenile arrests for violent crimes (105) and property crimes (801) as a percentage of 4,624 Total UCR Part 1 Crime arrests.
2016 juvenile arrests for violent crimes (112) and property crimes (571) as a percentage of 4,195 Total UCR Part 1 Crime arrests.
Factors Impacting Outcomes UCR Part I Crimes include violent crimes of murder, rape, robbery, and aggravated assault, as well as property crimes of burglary, larceny,
motor vehicle theft, and arson.
This measure is of arrests by age, regardless of whether the person what charged as a juvenile or an adult.
Benchmark 2011 2012 2013 2014 2015 2016 2017 2018 2016 2019
Actual Actual Actual Actual Actual Target Target Target Actual Target
13.9% 23.7% 24.4% 18.0% 16.3% 19.6% 20.9% 16.9% 16.9% 16.2% 16.9%
8.4.8 Arrests for UCR Part II Drug Offenses per 1,000 Population
Performance Measure Description FBI benchmark based on 2015 FBI Crime in the United States report (Table 47) for all agencies.
2015 Actual data based on 3,000 arrests.
2016 Actual data based on 3,454 arrests. Factors Impacting Outcomes Notices to Appear are counted as arrests because they are defined as summonses.
In 2015, more focus was placed on referring people to diversion programs instead of arresting them.
In 2016, emphasis on special assignments related to citizen complaint on narcotic and other illegal drug activities.
Benchmark 2011 2012 2013 2014 2015 2016 2017 2018 2016 2019
Actual Actual Actual Actual Actual Target Target Target Actual Target
4.6 10.3 10.8 10.6 9.2 7.7 8.0 9.0 9.0 8.9 8.9
8.4.9 Juvenile Arrests for UCR Part II Drug Abuse Offenses as Percentage of Total Arrests for UCR Part II Drug Offenses
Performance Measure Description FBI benchmark based on 2015 FBI Crime in the United States report (Table 47) for all agencies.
2015 Actual data based on 263 juvenile arrests out of a total of 3,000 Part II Drug Offense arrests.
2016 Actual data based on 297 juvenile arrests out of a total of 3,454 Part II Drug Offense arrests. Factors Impacting Outcomes
Rates of juvenile crimes.
MOU (Memorandum of Understanding) signed with local school district to reduce arrests and make suspect cases.
This measure is of arrests by age, regardless of whether the person was charged as a juvenile or an adult.
Benchmark 2011 2012 2013 2014 2015 2016 2017 2018 2016 2019
Actual Actual Actual Actual Actual Target Target Target Actual Target
7.3% 11.0% 10.0% 9.2% 9.2% 8.8% 9.9% 9.0% 9.0% 8.6% 9.0%
117

2016 Performance Measures Report
POLICE DEPARTMENT
Wichita, Kansas
8.4.10 Number of Neighborhood Projects
Performance Measure Description Includes projects that will affect the quality of life, enhance communication and deter crime within neighborhoods, with a focus on enforcement
as well as education.
Factors Impacting Outcomes In 2014, vacancies attributed to promotions, transfers, and alternative/ special assignments.
In 2015, some Community Police Officers were assigned beat officers duties to cover field vacancies.
In 2016, Neighborhood Projects are discretionary upon the Community Policing Officers determination of what needs documented (i.e., how long the complaint will take to resolve).
Benchmark 2011 2012 2013 2014 2015 2016 2017 2018 2016 2019
Actual Actual Actual Actual Actual Target Target Target Actual Target
316 542 442 351 331 277 300 316 316 305 316
8.4.11 Homeless Outreach Team: Persons Placed in Permanent or Transitional Housing
Performance Measure Description Number of individuals that the Homeless Outreach Team placed in permanent or transitional housing.
Does not include housing placement not initiated by the Homeless Outreach Team.
Includes persons who were reunited with a friend or family member as well as people placed in group or independent living arrangements.
Factors Impacting Outcomes Pilot Program began in February 2013, so data for 2013 does not reflect 12 months of activity.
Funding for programs like VASH (Veterans Affairs Supportive Housing), space in the Housing First Program, and willingness of friends or family to house persons directly affects this outcome.
Benchmark 2013 2014 2015 2016 2017 2018 2016 2019
Actual Actual Actual Target Target Target Actual Target
180 128 170 153 149 180 180 269 180
118

2016 Performance Measures Report
POLICE DEPARTMENT
Wichita, Kansas
8.4.12 Homeless Outreach Team: Housing Placement Recidivism Rate
Performance Measure Description Percentage of homeless people return back to homelessness within a 12 month period after being permanently housed by the WPD
Homeless Outreach Team. Measure excludes people who reenter homelessness outside of Wichita, or who are not known to have reentered homelessness by the
Wichita Police Department.
Factors Impacting Outcomes WPD expects this outcome to decline as the program continues. As the program matures, remaining individuals will have been homeless for a
longer period and are expected to face more difficulties in transitioning to a housing placement.
Benchmark 2014 2015 2016 2017 2018 2016 2019
Actual Actual Target Target Target Actual Target
<6% 4% 5% < 6% 3% 3% 1% 3%
8.4.13 Safety by Location and Time of Day: Percent of Citizens Rating “Very Safe” or “Somewhat Safe”
Performance Measure Description Survey of Wichita residents was commissioned in 2006, 2010, 2012, 2014, and 2016.
Expect to re-survey citizens in 2018.
Survey was conducted by the National Research Center.
Factors Impacting Outcomes Possible responses are "Very Safe," "Somewhat Safe," "Neither safe nor unsafe," "Somewhat unsafe," or “Very unsafe. ”Don't Know"
responses are excluded.
Benchmark 2006 2010 2012 2014 2016 2018 2016
Actual Actual Actual Actual Target Target Actual
CoW Similar Neighborhood:
Day 88% 88% 91% 82% 87% 89% 89%
NA Neighborhood:
After Dark 62% 69% 72% 64% 68% 70% 70%
CoW
Similar Downtown:
Day 75% 75% 79% 72% 75% 82% 82%
NA Downtown: After Dark
26% 33% 26% 30% 30% 31% 31%
119
2016 Performance Measures Report
POLICE DEPARTMENT
Wichita, Kansas
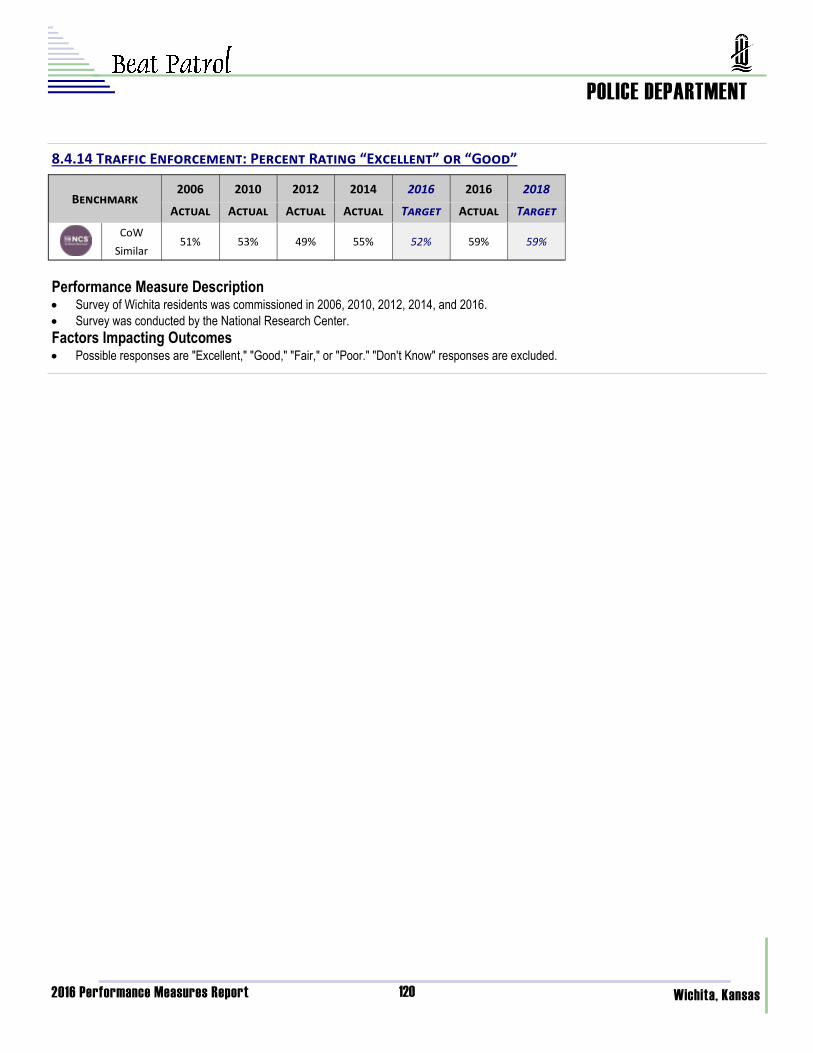
8.4.14 Traffic Enforcement: Percent Rating “Excellent” or “Good”
Performance Measure Description Survey of Wichita residents was commissioned in 2006, 2010, 2012, 2014, and 2016.
Survey was conducted by the National Research Center. Factors Impacting Outcomes Possible responses are "Excellent," "Good," "Fair," or "Poor." "Don't Know" responses are excluded.
Benchmark 2006 2010 2012 2014 2016 2018 2016
Actual Actual Actual Actual Target Target Actual
CoW
Similar 51% 53% 49% 55% 52% 59% 59%
120

2016 Performance Measures Report
POLICE DEPARTMENT
Wichita, Kansas
8.5.1 Percentage of Crimes against Persons Cleared
Performance Measure Description Includes UCR Part I Violent Crimes of murder, rape, robbery and aggravated assault, which are cleared.
FBI benchmark based on 2015 Crime in the United States report (Table 25) for cities with populations of 250,000 to 499,999.
Robbery was moved from Property Crimes to Persons Crimes in 2012.
Factors Impacting Outcomes In 2014, the rape statute changed and sodomy was re-categorized as rape.
In 2015, there was an increase in reported rapes.
Increases in rape evidence submissions to the Forensic Science Center created a backlog in evidence processing thereby delaying clearances.
In 2016, a homicide on 12/29/16 was not cleared until 1/6/17, which would have increased the clearance rate to 31 of 34 (91.2%);
In 2016, Aggravated Assault cases increased 25.7% while staffing for investigating that case type remained static.
In 2016, rape reports increased 1.7%.
Benchmark 2012 2013 2014 2015 2016 2017 2018 2016 2019
Actual Actual Actual Actual Target Target Target Actual Target
55.5% Homicide 100.0% 75.0% 92.3% 96.8% 89.1% 88.7% 88.7% 88.2% 88.7%
37.7% Rape 81.1% 91.4% 78.6% 73.7% 75% 79.3% 79.3% 73.5% 79.3%
45.3% Aggravated
Assault 73.7% 73.4% 71.0% 74.6% 73.2% 73.0% 73.0% 72.9% 73.0%
25.8% Robbery 35.7% 41.1% 40.1% 37.2% 38.9% 39.4% 39.4% 39.1% 39.4%
38.4% UCR Part I 66.9% 68.2% 64.7% 64.8% 66.7% 65.8% 65.8% 65.9% 65.8%
8.5.2 Percentage of UCR Part I Violent Crimes Assigned to Investigators
Performance Measure Description Includes UCR Part I Violent Crimes of murder, rape, robbery and aggravated assault that are assigned for further investigation by a detective
after initial review by a supervisor. Factors Impacting Outcomes All UCR Part I cases are reviewed by the section supervisor to determine if follow-up investigation is warranted.
All homicide, rape, and robbery cases are currently assigned.
In 2016, the 2.5% decrease in violent crimes assigned is attributed to a 25.7% increase in reported aggravated assaults over 2015. More cases were assigned, but that yielded a lower percentage. Ninety-one percent, or 1,999 of 2,192 of aggravated assault cases were assigned compared to 94% or 1,633 of 1,730 in 2015.
Benchmark 2011 2012 2013 2014 2015 2016 2017 2018 2016 2019
Actual Actual Actual Actual Actual Target Target Target Actual Target
86.3% 95.5% 96.5% 91.8% 95.4% 96.4% 94.8% 94.5% 94.5% 93.9% 94.5%
121
2016 Performance Measures Report
POLICE DEPARTMENT
Wichita, Kansas
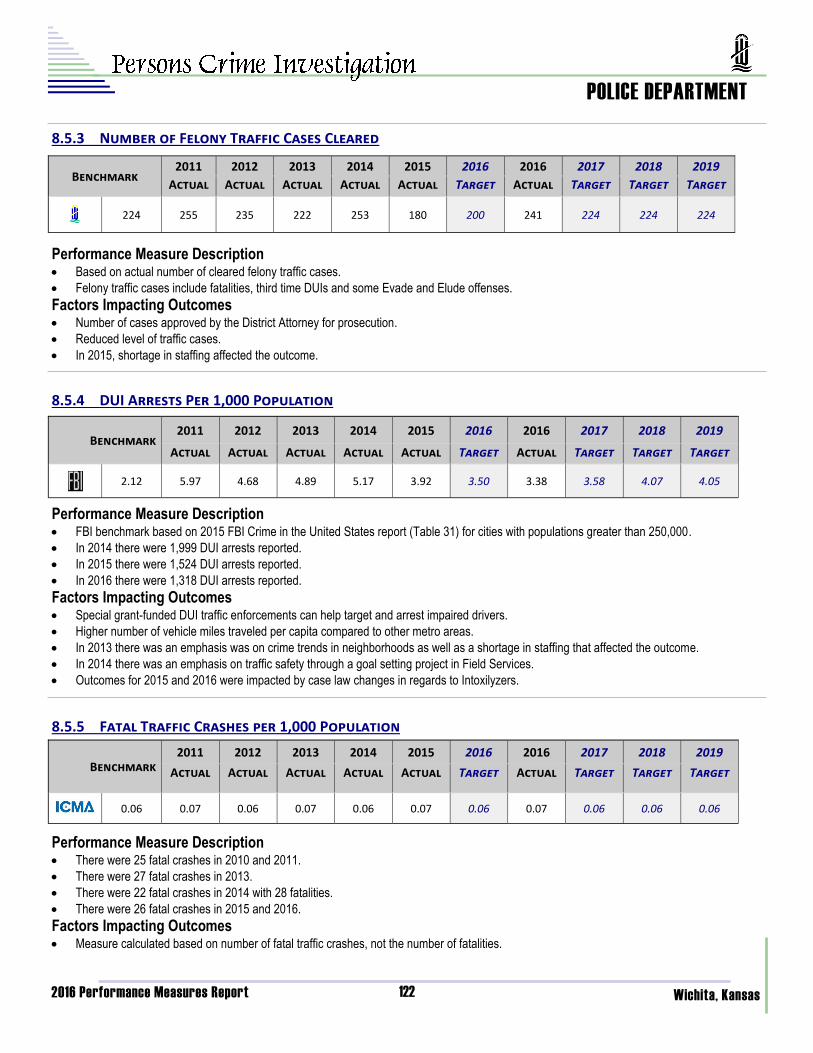
8.5.3 Number of Felony Traffic Cases Cleared
Performance Measure Description Based on actual number of cleared felony traffic cases.
Felony traffic cases include fatalities, third time DUIs and some Evade and Elude offenses.
Factors Impacting Outcomes Number of cases approved by the District Attorney for prosecution.
Reduced level of traffic cases.
In 2015, shortage in staffing affected the outcome.
Benchmark 2011 2012 2013 2014 2015 2016 2017 2018 2016 2019
Actual Actual Actual Actual Actual Target Target Target Actual Target
224 255 235 222 253 180 200 224 224 241 224
8.5.4 DUI Arrests Per 1,000 Population
Performance Measure Description FBI benchmark based on 2015 FBI Crime in the United States report (Table 31) for cities with populations greater than 250,000.
In 2014 there were 1,999 DUI arrests reported.
In 2015 there were 1,524 DUI arrests reported.
In 2016 there were 1,318 DUI arrests reported.
Factors Impacting Outcomes Special grant-funded DUI traffic enforcements can help target and arrest impaired drivers.
Higher number of vehicle miles traveled per capita compared to other metro areas.
In 2013 there was an emphasis was on crime trends in neighborhoods as well as a shortage in staffing that affected the outcome.
In 2014 there was an emphasis on traffic safety through a goal setting project in Field Services.
Outcomes for 2015 and 2016 were impacted by case law changes in regards to Intoxilyzers.
Benchmark 2011 2012 2013 2014 2015 2016 2016 2017 2018 2019
Actual Actual Actual Actual Actual Target Actual Target Target Target
2.12 5.97 4.68 4.89 5.17 3.92 3.50 3.38 3.58 4.07 4.05
8.5.5 Fatal Traffic Crashes per 1,000 Population
Performance Measure Description There were 25 fatal crashes in 2010 and 2011.
There were 27 fatal crashes in 2013.
There were 22 fatal crashes in 2014 with 28 fatalities.
There were 26 fatal crashes in 2015 and 2016.
Factors Impacting Outcomes Measure calculated based on number of fatal traffic crashes, not the number of fatalities.
Benchmark 2011 2012 2013 2014 2015 2016 2017 2018 2016 2019
Actual Actual Actual Actual Actual Target Target Target Actual Target
0.06 0.07 0.06 0.07 0.06 0.07 0.06 0.06 0.06 0.07 0.06
122

2016 Performance Measures Report
POLICE DEPARTMENT
Wichita, Kansas
8.5.6 Citizens Reporting being a Crime Victim in the Prior 12 months
Performance Measure Description Question asked “During the past 12 months, were you or anyone in your household the victim of any crime?”
Survey of Wichita residents was commissioned in 2006, 2010, 2012, 2014, and 2016.
Survey was conducted by the National Research Center.
Factors Impacting Outcomes Social, criminal, and economic conditions.
Benchmark 2006 2010 2012 2014 2016 2018 2016
Actual Actual Actual Actual Target Target Actual
CoW
Similar 22% 16% 12% 19% 15% 19% 18%
123
2016 Performance Measures Report
POLICE DEPARTMENT
Wichita, Kansas
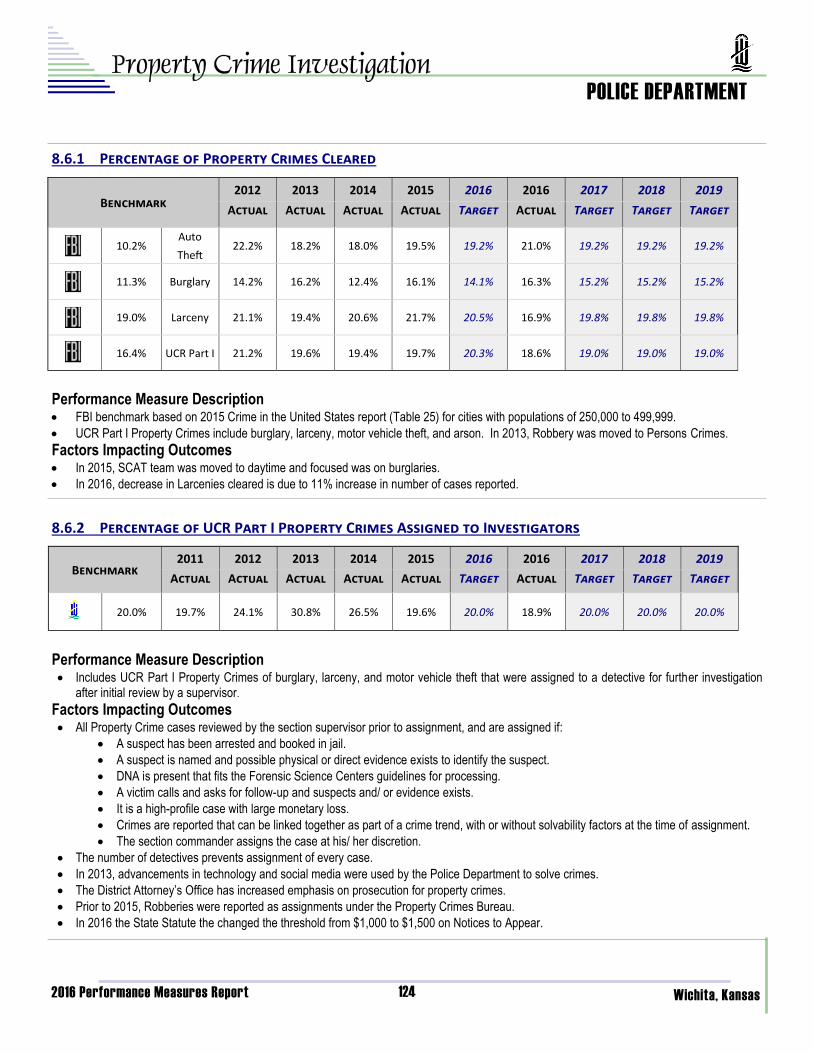
8.6.1 Percentage of Property Crimes Cleared
Performance Measure Description FBI benchmark based on 2015 Crime in the United States report (Table 25) for cities with populations of 250,000 to 499,999.
UCR Part I Property Crimes include burglary, larceny, motor vehicle theft, and arson. In 2013, Robbery was moved to Persons Crimes.
Factors Impacting Outcomes In 2015, SCAT team was moved to daytime and focused was on burglaries.
In 2016, decrease in Larcenies cleared is due to 11% increase in number of cases reported.
Benchmark 2012 2013 2014 2015 2016 2017 2018 2016 2019
Actual Actual Actual Actual Target Target Target Actual Target
10.2% Auto
Theft 22.2% 18.2% 18.0% 19.5% 19.2% 19.2% 19.2% 21.0% 19.2%
11.3% Burglary 14.2% 16.2% 12.4% 16.1% 14.1% 15.2% 15.2% 16.3% 15.2%
19.0% Larceny 21.1% 19.4% 20.6% 21.7% 20.5% 19.8% 19.8% 16.9% 19.8%
16.4% UCR Part I 21.2% 19.6% 19.4% 19.7% 20.3% 19.0% 19.0% 18.6% 19.0%
8.6.2 Percentage of UCR Part I Property Crimes Assigned to Investigators
Performance Measure Description Includes UCR Part I Property Crimes of burglary, larceny, and motor vehicle theft that were assigned to a detective for further investigation
after initial review by a supervisor. Factors Impacting Outcomes All Property Crime cases reviewed by the section supervisor prior to assignment, and are assigned if:
A suspect has been arrested and booked in jail.
A suspect is named and possible physical or direct evidence exists to identify the suspect.
DNA is present that fits the Forensic Science Centers guidelines for processing.
A victim calls and asks for follow-up and suspects and/ or evidence exists.
It is a high-profile case with large monetary loss.
Crimes are reported that can be linked together as part of a crime trend, with or without solvability factors at the time of assignment.
The section commander assigns the case at his/ her discretion.
The number of detectives prevents assignment of every case.
In 2013, advancements in technology and social media were used by the Police Department to solve crimes.
The District Attorney’s Office has increased emphasis on prosecution for property crimes.
Prior to 2015, Robberies were reported as assignments under the Property Crimes Bureau.
In 2016 the State Statute the changed the threshold from $1,000 to $1,500 on Notices to Appear.
Benchmark 2011 2012 2013 2014 2015 2016 2017 2018 2016 2019
Actual Actual Actual Actual Actual Target Target Target Actual Target
20.0% 19.7% 24.1% 30.8% 26.5% 19.6% 20.0% 20.0% 20.0% 18.9% 20.0%
124
2016 Performance Measures Report
POLICE DEPARTMENT
Wichita, Kansas
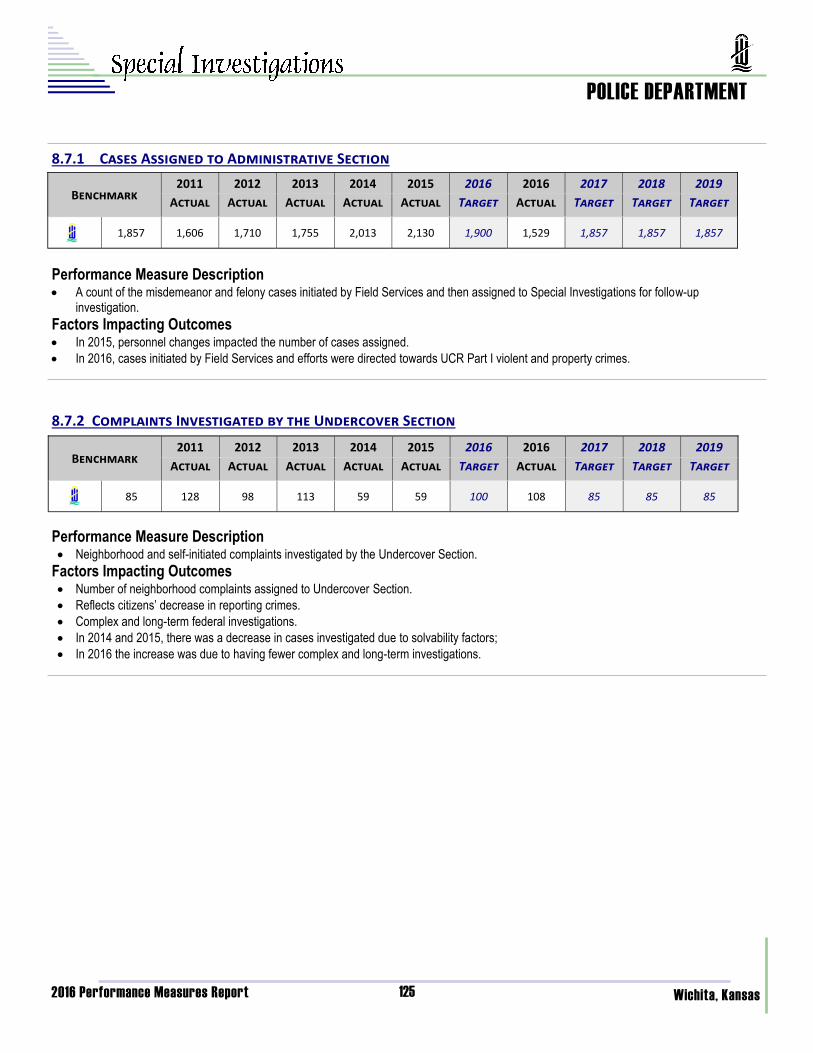
8.7.1 Cases Assigned to Administrative Section
Performance Measure Description A count of the misdemeanor and felony cases initiated by Field Services and then assigned to Special Investigations for follow-up
investigation.
Factors Impacting Outcomes In 2015, personnel changes impacted the number of cases assigned.
In 2016, cases initiated by Field Services and efforts were directed towards UCR Part I violent and property crimes.
Benchmark 2011 2012 2013 2014 2015 2016 2017 2018 2016 2019
Actual Actual Actual Actual Actual Target Target Target Actual Target
1,857 1,606 1,710 1,755 2,013 2,130 1,900 1,857 1,857 1,529 1,857
8.7.2 Complaints Investigated by the Undercover Section
Performance Measure Description Neighborhood and self-initiated complaints investigated by the Undercover Section.
Factors Impacting Outcomes Number of neighborhood complaints assigned to Undercover Section.
Reflects citizens’ decrease in reporting crimes.
Complex and long-term federal investigations.
In 2014 and 2015, there was a decrease in cases investigated due to solvability factors;
In 2016 the increase was due to having fewer complex and long-term investigations.
Benchmark 2011 2012 2013 2014 2015 2016 2017 2018 2016 2019
Actual Actual Actual Actual Actual Target Target Target Actual Target
85 128 98 113 59 59 100 85 85 108 85
125

2016 Performance Measures Report
POLICE DEPARTMENT
Wichita, Kansas
8.8.1 Number of Crime Scenes Processed by Crime Scene Investigators
Performance Measure Description Cases in which a Crime Scene Investigator was called to provide investigative assistance.
Factors Impacting Outcomes An increase in crime scenes processed is caused by greater focus on burglary efforts.
Vacant crime scene investigator positions and alternative assignments impact this outcome.
An increased number of crime scenes were processed in 2015 and 2016 due to improved crime reduction efforts.
Benchmark 2011 2012 2013 2014 2015 2016 2017 2018 2016 2019
Actual Actual Actual Actual Actual Target Target Target Actual Target
1,961 2,037 1,614 1,902 1,795 2,063 1,837 1,961 1,961 2,085 1,961
Benchmark 2011 2012 2013 2014 2015 2016 2017 2018 2016 2019
Actual Actual Actual Actual Actual Target Target Target Actual Target
4,316 3,770 3,671 4,185 4,288 4,264 4,100 4,316 4,316 4,528 4,316
8.8.2 Number of Fingerprints Analyzed Performance Measure Description Cases in which fingerprints were submitted to the latent print section for analysis.
Factors Impacting Outcomes Technical services is training Police Officers to process more minor crime scenes themselves.
An increase in burglaries in 2014 and 2015 resulted in an increased number of fingerprints analyzed.
There was one full-time and one part-time print examiner in 2016, which led to more fingerprint analysis.
126
2016 Performance Measures Report
POLICE DEPARTMENT
Wichita, Kansas
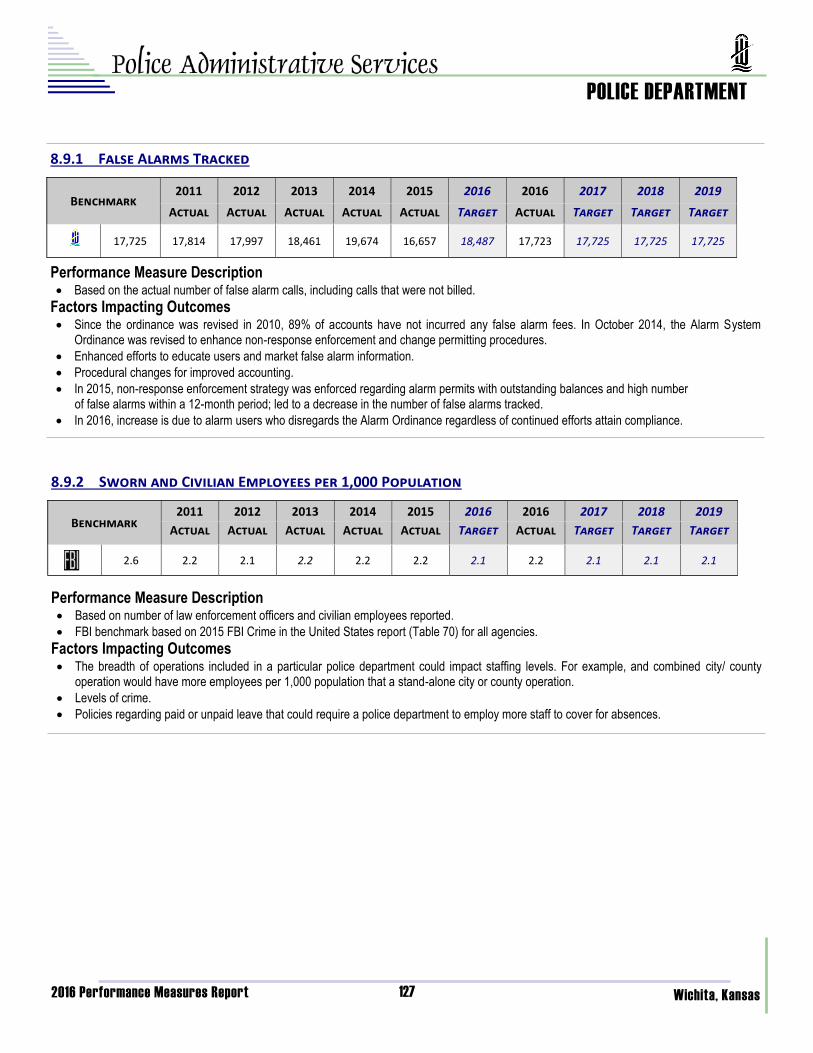
8.9.1 False Alarms Tracked
Performance Measure Description Based on the actual number of false alarm calls, including calls that were not billed.
Factors Impacting Outcomes Since the ordinance was revised in 2010, 89% of accounts have not incurred any false alarm fees. In October 2014, the Alarm System
Ordinance was revised to enhance non-response enforcement and change permitting procedures.
Enhanced efforts to educate users and market false alarm information.
Procedural changes for improved accounting.
In 2015, non-response enforcement strategy was enforced regarding alarm permits with outstanding balances and high number of false alarms within a 12-month period; led to a decrease in the number of false alarms tracked.
In 2016, increase is due to alarm users who disregards the Alarm Ordinance regardless of continued efforts attain compliance.
Benchmark 2011 2012 2013 2014 2015 2016 2017 2018 2016 2019
Actual Actual Actual Actual Actual Target Target Target Actual Target
17,725 17,814 17,997 18,461 19,674 16,657 18,487 17,725 17,725 17,723 17,725
8.9.2 Sworn and Civilian Employees per 1,000 Population
Performance Measure Description Based on number of law enforcement officers and civilian employees reported.
FBI benchmark based on 2015 FBI Crime in the United States report (Table 70) for all agencies.
Factors Impacting Outcomes The breadth of operations included in a particular police department could impact staffing levels. For example, and combined city/ county
operation would have more employees per 1,000 population that a stand-alone city or county operation.
Levels of crime.
Policies regarding paid or unpaid leave that could require a police department to employ more staff to cover for absences.
Benchmark 2011 2012 2013 2014 2015 2016 2017 2018 2016 2019
Actual Actual Actual Actual Actual Target Target Target Actual Target
2.6 2.2 2.1 2.2 2.2 2.2 2.1 2.1 2.1 2.2 2.1
127
2016 Performance Measures Report
POLICE DEPARTMENT
Wichita, Kansas
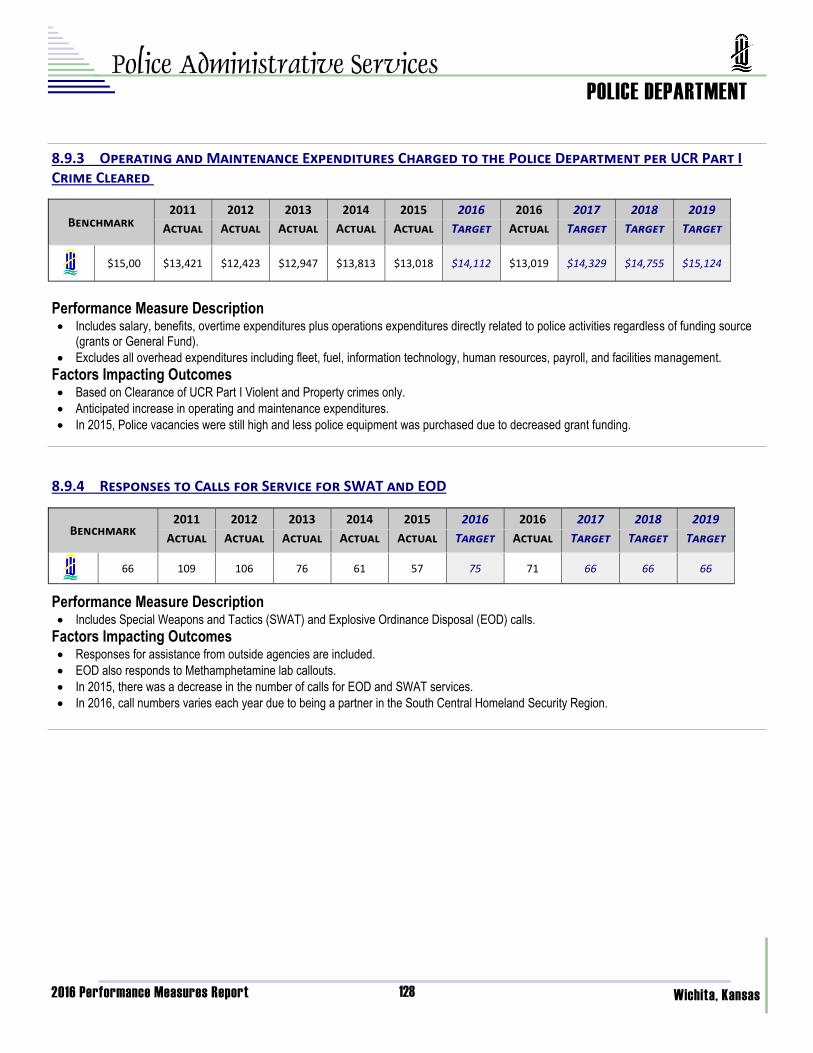
8.9.3 Operating and Maintenance Expenditures Charged to the Police Department per UCR Part I Crime Cleared
Performance Measure Description Includes salary, benefits, overtime expenditures plus operations expenditures directly related to police activities regardless of funding source
(grants or General Fund).
Excludes all overhead expenditures including fleet, fuel, information technology, human resources, payroll, and facilities management.
Factors Impacting Outcomes Based on Clearance of UCR Part I Violent and Property crimes only.
Anticipated increase in operating and maintenance expenditures.
In 2015, Police vacancies were still high and less police equipment was purchased due to decreased grant funding.
Benchmark 2011 2012 2013 2014 2015 2016 2017 2018 2016 2019
Actual Actual Actual Actual Actual Target Target Target Actual Target
$15,00 $13,421 $12,423 $12,947 $13,813 $13,018 $14,112 $14,329 $14,755 $13,019 $15,124
8.9.4 Responses to Calls for Service for SWAT and EOD
Performance Measure Description Includes Special Weapons and Tactics (SWAT) and Explosive Ordinance Disposal (EOD) calls.
Factors Impacting Outcomes Responses for assistance from outside agencies are included.
EOD also responds to Methamphetamine lab callouts.
In 2015, there was a decrease in the number of calls for EOD and SWAT services.
In 2016, call numbers varies each year due to being a partner in the South Central Homeland Security Region.
Benchmark 2011 2012 2013 2014 2015 2016 2017 2018 2016 2019
Actual Actual Actual Actual Actual Target Target Target Actual Target
66 109 106 76 61 57 75 66 66 71 66
128
2016 Performance Measures Report
POLICE DEPARTMENT
Wichita, Kansas
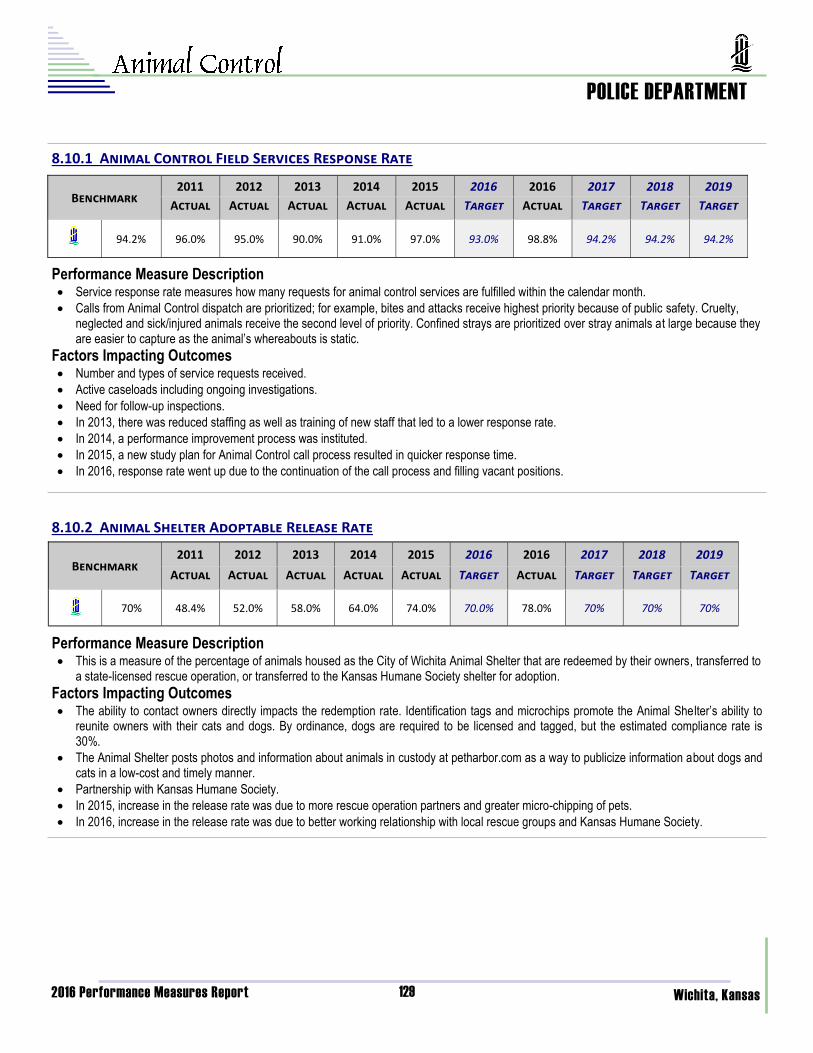
8.10.1 Animal Control Field Services Response Rate
Performance Measure Description Service response rate measures how many requests for animal control services are fulfilled within the calendar month.
Calls from Animal Control dispatch are prioritized; for example, bites and attacks receive highest priority because of public safety. Cruelty, neglected and sick/injured animals receive the second level of priority. Confined strays are prioritized over stray animals at large because they are easier to capture as the animal’s whereabouts is static.
Factors Impacting Outcomes Number and types of service requests received.
Active caseloads including ongoing investigations.
Need for follow-up inspections.
In 2013, there was reduced staffing as well as training of new staff that led to a lower response rate.
In 2014, a performance improvement process was instituted.
In 2015, a new study plan for Animal Control call process resulted in quicker response time.
In 2016, response rate went up due to the continuation of the call process and filling vacant positions.
Benchmark 2011 2012 2013 2014 2015 2016 2017 2018 2016 2019
Actual Actual Actual Actual Actual Target Target Target Actual Target
94.2% 96.0% 95.0% 90.0% 91.0% 97.0% 93.0% 94.2% 94.2% 98.8% 94.2%
8.10.2 Animal Shelter Adoptable Release Rate
Performance Measure Description This is a measure of the percentage of animals housed as the City of Wichita Animal Shelter that are redeemed by their owners, transferred to
a state-licensed rescue operation, or transferred to the Kansas Humane Society shelter for adoption.
Factors Impacting Outcomes The ability to contact owners directly impacts the redemption rate. Identification tags and microchips promote the Animal Shelter’s ability to
reunite owners with their cats and dogs. By ordinance, dogs are required to be licensed and tagged, but the estimated compliance rate is 30%.
The Animal Shelter posts photos and information about animals in custody at petharbor.com as a way to publicize information about dogs and cats in a low-cost and timely manner.
Partnership with Kansas Humane Society.
In 2015, increase in the release rate was due to more rescue operation partners and greater micro-chipping of pets.
In 2016, increase in the release rate was due to better working relationship with local rescue groups and Kansas Humane Society.
Benchmark 2011 2012 2013 2014 2015 2016 2017 2018 2016 2019
Actual Actual Actual Actual Actual Target Target Target Actual Target
70% 48.4% 52.0% 58.0% 64.0% 74.0% 70.0% 70% 70% 78.0% 70%
129
2016 Performance Measures Report
POLICE DEPARTMENT
Wichita, Kansas
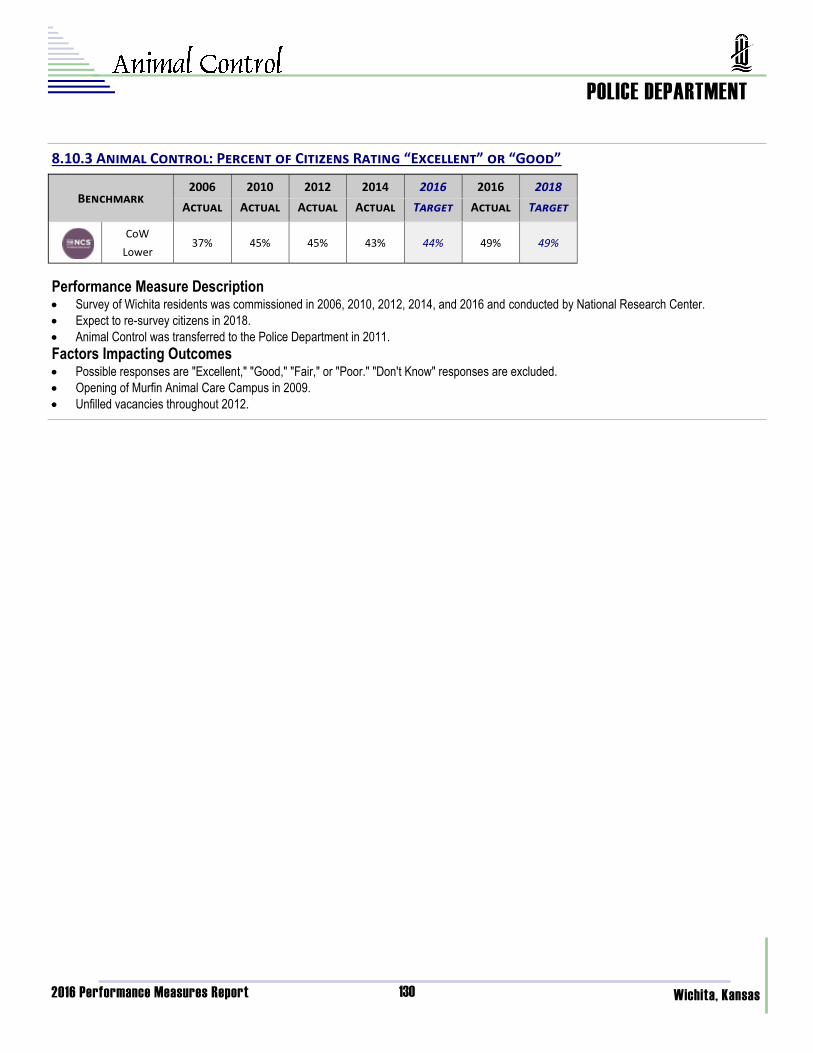
8.10.3 Animal Control: Percent of Citizens Rating “Excellent” or “Good”
Performance Measure Description Survey of Wichita residents was commissioned in 2006, 2010, 2012, 2014, and 2016 and conducted by National Research Center.
Expect to re-survey citizens in 2018.
Animal Control was transferred to the Police Department in 2011.
Factors Impacting Outcomes Possible responses are "Excellent," "Good," "Fair," or "Poor." "Don't Know" responses are excluded.
Opening of Murfin Animal Care Campus in 2009.
Unfilled vacancies throughout 2012.
Benchmark 2006 2010 2012 2014 2016 2018 2016
Actual Actual Actual Actual Target Target Actual
CoW
Lower 37% 45% 45% 43% 44% 49% 49%
130
2016 Performance Measures Report
POLICE DEPARTMENT
Wichita, Kansas
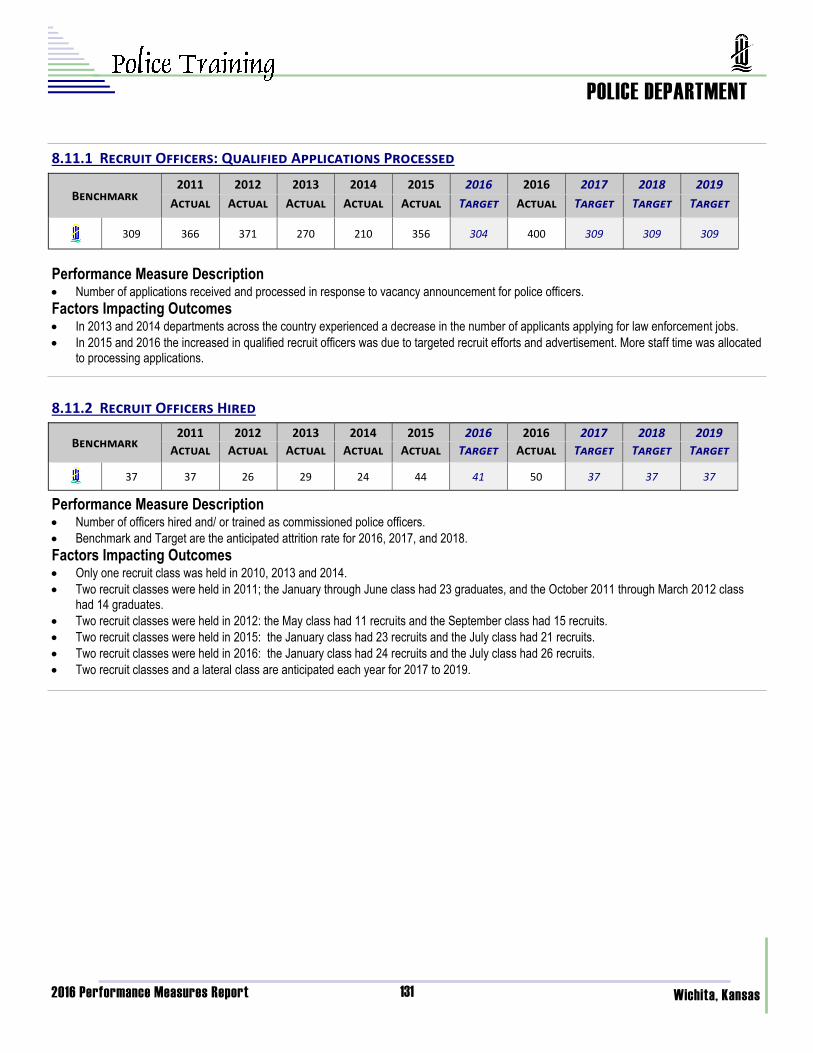
8.11.1 Recruit Officers: Qualified Applications Processed
Performance Measure Description Number of applications received and processed in response to vacancy announcement for police officers.
Factors Impacting Outcomes In 2013 and 2014 departments across the country experienced a decrease in the number of applicants applying for law enforcement jobs.
In 2015 and 2016 the increased in qualified recruit officers was due to targeted recruit efforts and advertisement. More staff time was allocated to processing applications.
Benchmark 2011 2012 2013 2014 2015 2016 2017 2018 2016 2019
Actual Actual Actual Actual Actual Target Target Target Actual Target
309 366 371 270 210 356 304 309 309 400 309
8.11.2 Recruit Officers Hired
Performance Measure Description Number of officers hired and/ or trained as commissioned police officers.
Benchmark and Target are the anticipated attrition rate for 2016, 2017, and 2018.
Factors Impacting Outcomes Only one recruit class was held in 2010, 2013 and 2014.
Two recruit classes were held in 2011; the January through June class had 23 graduates, and the October 2011 through March 2012 class had 14 graduates.
Two recruit classes were held in 2012: the May class had 11 recruits and the September class had 15 recruits.
Two recruit classes were held in 2015: the January class had 23 recruits and the July class had 21 recruits.
Two recruit classes were held in 2016: the January class had 24 recruits and the July class had 26 recruits.
Two recruit classes and a lateral class are anticipated each year for 2017 to 2019.
Benchmark 2011 2012 2013 2014 2015 2016 2017 2018 2016 2019
Actual Actual Actual Actual Actual Target Target Target Actual Target
37 37 26 29 24 44 41 37 37 50 37
131

2016 Performance Measures Report
POLICE DEPARTMENT
Wichita, Kansas
8.12.1 Call time to Answer (in minutes)
Performance Measure Description Number of minutes callers spend waiting on hold before speaking to a customer service representative. Factors Impacting Outcomes Staffing levels.
Availability of information on the internet.
Increase in cases made (10,048) from 2015 to 2016.
In 2016, there were changes in reporting requirements on some property/financial crimes & how they were charged.
In 2016, contributing factor was staffing shortage and training. Seven new staff members were hired with a 3-4 month training period.
Benchmark 2011 2012 2013 2014 2015 2016 2017 2018 2016 2019
Actual Actual Actual Actual Actual Target Target Target Actual Target
1.73 1.32 1.25 1.17 1.25 1.89 1.00 1.73 1.73 2.61 1.73
8.12.2 Call Abandon Rate
Performance Measure Description Percentage of callers who hang up before receiving assistance. Factors Impacting Outcomes Staffing levels.
External factors, including time of year, weather, and crime trends.
In 2015, the main factor contributing to call abandon rate increase was staffing shortage. One staff person was reassigned to the Records Division and six new staff were hired; however training period is 3 to 4 months long.
In 2016, contributing factor was staffing shortage and training. Seven new staff members were hired with a 3-4 month training period.
Benchmark 2011 2012 2013 2014 2015 2016 2017 2018 2016 2019
Actual Actual Actual Actual Actual Target Target Target Actual Target
10% 10% 11% 9% 9% 12% 10% 10% 10% 10% 10%
8.12.3 Number of Cases Made
Performance Measure Description The Records Office handles each case that is made.
Factors Impacting Outcomes Number of cases made in the field.
In 2015, the main factor contributing to the decrease in the number of cases made was staffing shortage. One staff person was reassigned to the Records Division and six new staff were hired; however training period is 3 to 4 months long.
In 2016, there were changes in reporting requirements on some property/financial crimes & how they were charged.
Benchmark 2011 2012 2013 2014 2015 2016 2017 2018 2016 2019
Actual Actual Actual Actual Actual Target Target Target Actual Target
113,233 111,972 113,121 112,713 111,347 109,411 112,288 113,233 113,233 119,459 113,233
132

2016 Performance Measures Report
POLICE DEPARTMENT
Wichita, Kansas
8.13.2 Number of Warrants Cleared
Performance Measure Description Number of warrants served to individuals with outstanding warrants. Factors Impacting Outcomes Numbers of individuals visiting Municipal Court to pay their warrants after the Warrant Office has contacted them.
Full time commissioned staffing levels were lower in 2012, and since November 2014.
In 2015, focus was getting individuals assigned a court date, therefore staff hours were allocated to warrant notifications.
In 2016, the decrease was due to position vacancies, which were two part-time clerks that remain unfilled.
8.13.1 Number of Warrant Notifications
Performance Measure Description Number of notifications made to individuals with outstanding City warrants.
Includes mail, phone, and in-person notifications.
Factors Impacting Outcomes In 2013, a higher number of warrant notifications resulted in a greater number of warrants cleared because of incorrect address information.
There was a temporary increase in Warrant Office commissioned staffing in 2014 due to alternative assignments. Staffing was then reduced in November 2014.
In 2015, the focus was getting individuals assigned a court date, therefore staff hours were allocated to warrant notifications.
In 2016, the decrease was due to position vacancies, which were two part-time clerks that remain unfilled.
Benchmark 2011 2012 2013 2014 2015 2016 2017 2018 2016 2019
Actual Actual Actual Actual Actual Target Target Target Actual Target
13,250 12,024 12,611 18,186 21,581 13,232 13,250 13,250 13,250 10,753 13,250
8.13.3 Warrants Cleared as a Percentage of Warrants Issued
Performance Measure Description Of available warrants, the percent that were cleared during the year.
Includes mail, phone, and in-person notifications.
Factors Impacting Outcomes Total number of actual warrants issued.
Benchmark 2011 2012 2013 2014 2015 2016 2017 2018 2016 2019
Actual Actual Actual Actual Actual Target Target Target Actual Target
16.4% 19.5% 16.6% 16.6% 15.6% 18.1% 17.1% 16.4% 16.4% 15.5% 16.4%
Benchmark 2011 2012 2013 2014 2015 2016 2017 2018 2016 2019
Actual Actual Actual Actual Actual Target Target Target Actual Target
3,910 4,473 3,659 3,767 3,740 4,376 3,910 3,910 3,910 3,811 3,910
133

2016 Performance Measures Report
POLICE DEPARTMENT
Wichita, Kansas
8.14.1 Helicopter Hours in Flight
Performance Measure Description Based on flight logs for the City of Wichita Police Department helicopter.
Factors Impacting Outcomes Scheduled and unscheduled maintenance.
Inclement weather.
Pilot training and re-certifications.
Logistics of accommodating major scheduled events and operations around maintenance.
Reorganization to different bureau and budgetary considerations resulted in fewer flight hours for 2012 forward. Call-outs are limited to emergencies and flight maintenance minimum hours.
Department Reorganization; reduction of personnel and costs.
In 2015, the helicopter was grounded from January through May.
In the 2016-2017 Adopted Budget, the Air Section was authorized a maximum of nine (9) flight hours per month to maintain helicopter airworthiness and pilot skills.
In 2016, WPD staff sought out partnerships with private funders (foundation) to assist with operational expenses.
In 2017, Air Section continues to be a non-supported expense in the General Fund budget.
Benchmark 2011 2012 2013 2014 2015 2016 2017 2018 2016 2019
Actual Actual Actual Actual Actual Target Target Target Actual Target
299 617 216 200 164 80 299 141 0 121 0
134

2016 Performance Measures Report
POLICE DEPARTMENT
Wichita, Kansas
8.15.1 Cost per Visitor Screened
Performance Measure Description Based on the actual number of individuals who pass through security prior to entering City Hall.
This is a new measure for the 2015 report.
In 2014, persons screened was 307,218 and the number of bags screened was 270,964
In 2015, persons screened was 313,003 and the number of bags screened was 296,275.
In 2016, persons screened was 272,124 and the number of bags screened was 278,521.
Factors Impacting Outcomes Visitors knowledge of carrying prohibited items.
Dependent on traffic flow and citizen utilization of City services.
Security responsibilities are not limited to visitor screening and also include monitoring video feed for the City Hall campus and offsite locations.
In 2016, Citizen Access Card (fast pass) was implemented.
In 2016, MABCD and MAPD relocated from City Hall.
Benchmark 2014 2015 2016 2017 2018 2016 2019
Actual Actual Target Target Target Actual Target
$4.25 $4.08 $3.89 $4.18 $4.21 $4.21 $4.73 $4.21
135