policy issue brief - oklahoma policy institute
TRANSCRIPT

November 2013
Policy basics: oklahoma’s Food security saFety Net
OK Policy is a non-profit organization that provides information, analysis and ideas on state policy issues.Oklahoma Policy Institute | P.O. Box 14347 | Tulsa, OK 74159-1347 | (918) 794-3944 | [email protected]
by Amanda Marcott Thottunkal, Gene Perry, and Kate Richey
This year brought impressive economic growth for many Oklahomans. The state unemployment rate is among
the lowest in the nation, and our economy is recovering rapidly from the Great Recession. Despite these encouraging indicators, Oklahomans also face serious challenges: rising food costs, a widening income gap, low health rankings, and years of rising poverty and food insecurity.
Several programs operated by the state and federal government in Oklahoma are helping to address these problems. For each of these programs, this issue brief examines who is eligible and how many participate in Oklahoma, how they are funded and administered, what is their economic impact within the state, and what successes or failures they have shown in fulfilling their mission to reduce food insecurity.
The first section of this report explains what is food insecurity and why it is vitally important for Oklahoma to address. Following sections describe the state’s active programs in seven areas of need: (1) the Supplemental Nutrition Assistance Program; (2) School and Daycare Food Programs; (3) Child and Adult Food Care Programs at day cares and shelters for the homeless and victims of domestic violence; (4) the Women, Infants, and Children Program; (5) Senior Food Programs; (6) Non-Profit Food Distribution Programs; and (7) Food Distribution in Indian Country.
Overall, these programs are providing significant, measurable benefits across the state. They require few state dollars to operate, because they are all mostly or entirely federally funded. Besides alleviating hunger and food insecurity, they contribute to the economic well-being of Oklahomans by improving workers’ health, reducing health care costs, promoting financial security, and bringing dollars into the state economy through federally subsidized food purchases.
Oklahoma’s food security safety net does have its shortcomings. Critics point to a lack of healthy food options for the neediest families, especially in “food deserts” where fresh fruits and vegetables are not easily accessible or affordable. Although the need remains high, many of these programs have been cut in recent years due to state budget shortfalls, the expiration of stimulus funds, and federal sequestration cuts. As a result, benefits frequently fall short of what is needed for a family’s minimum food budget. While we have made strides in meeting this most basic need of our residents, work remains to be done.
Oklahoma Policy Institute | P.O. Box 14347 | Tulsa, OK 74159-1347 | (918) 794-3944 | [email protected]
OKPOLICY.ORG Page 2
I. What is Food Insecurity?
Food security is defined as “ready availability of nutritionally adequate and safe foods.”1 The measure was introduced by the U.S. Census Bureau in 1996 to assess households’ ability to consistently obtain three nutritionally adequate meals a day. Households can be rated as being food secure, low food secure, or very low food secure.
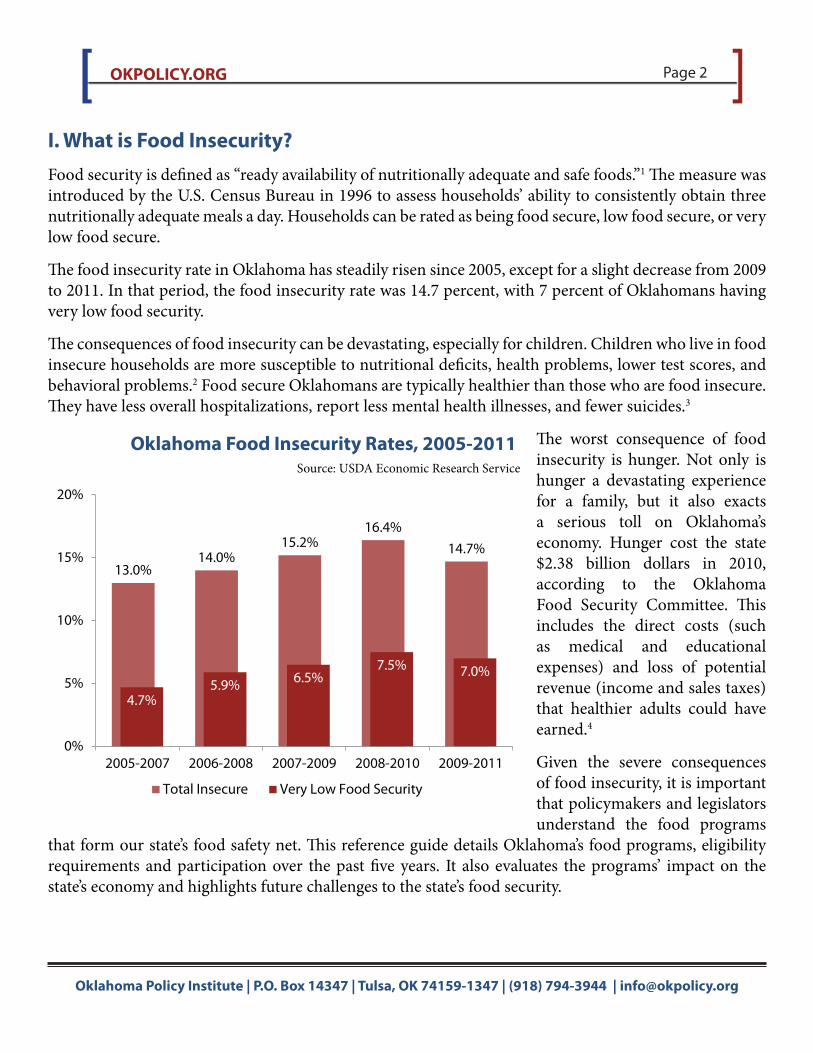
The food insecurity rate in Oklahoma has steadily risen since 2005, except for a slight decrease from 2009 to 2011. In that period, the food insecurity rate was 14.7 percent, with 7 percent of Oklahomans having very low food security.
The consequences of food insecurity can be devastating, especially for children. Children who live in food insecure households are more susceptible to nutritional deficits, health problems, lower test scores, and behavioral problems.2 Food secure Oklahomans are typically healthier than those who are food insecure. They have less overall hospitalizations, report less mental health illnesses, and fewer suicides.3
The worst consequence of food insecurity is hunger. Not only is hunger a devastating experience for a family, but it also exacts a serious toll on Oklahoma’s economy. Hunger cost the state $2.38 billion dollars in 2010, according to the Oklahoma Food Security Committee. This includes the direct costs (such as medical and educational expenses) and loss of potential revenue (income and sales taxes) that healthier adults could have earned.4
Given the severe consequences of food insecurity, it is important that policymakers and legislators understand the food programs
that form our state’s food safety net. This reference guide details Oklahoma’s food programs, eligibility requirements and participation over the past five years. It also evaluates the programs’ impact on the state’s economy and highlights future challenges to the state’s food security.
13.0%14.0%
15.2%16.4%
14.7%
4.7%5.9% 6.5%
7.5% 7.0%
0%
5%
10%
15%
20%
2005-2007 2006-2008 2007-2009 2008-2010 2009-2011
Total Insecure Very Low Food Security
Oklahoma Food Insecurity Rates, 2005-2011Source: USDA Economic Research Service
OKPOLICY.ORG Page 3
Oklahoma Policy Institute | P.O. Box 14347 | Tulsa, OK 74159-1347 | (918) 794-3944 | [email protected]
II. Supplemental Nutrition Assistance Program (SNAP)
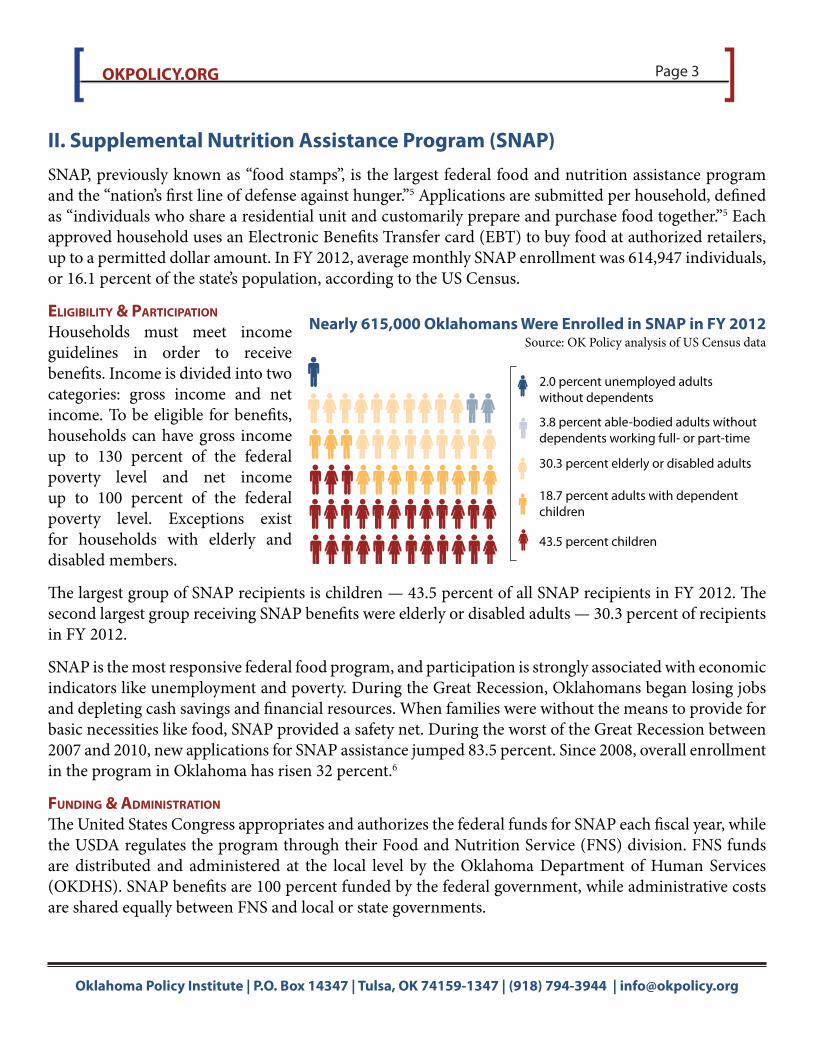
SNAP, previously known as “food stamps”, is the largest federal food and nutrition assistance program and the “nation’s first line of defense against hunger.”5 Applications are submitted per household, defined as “individuals who share a residential unit and customarily prepare and purchase food together.”5 Each approved household uses an Electronic Benefits Transfer card (EBT) to buy food at authorized retailers, up to a permitted dollar amount. In FY 2012, average monthly SNAP enrollment was 614,947 individuals, or 16.1 percent of the state’s population, according to the US Census.
eligibility & ParticiPatioN
Households must meet income guidelines in order to receive benefits. Income is divided into two categories: gross income and net income. To be eligible for benefits, households can have gross income up to 130 percent of the federal poverty level and net income up to 100 percent of the federal poverty level. Exceptions exist for households with elderly and disabled members.
The largest group of SNAP recipients is children — 43.5 percent of all SNAP recipients in FY 2012. The second largest group receiving SNAP benefits were elderly or disabled adults — 30.3 percent of recipients in FY 2012.
SNAP is the most responsive federal food program, and participation is strongly associated with economic indicators like unemployment and poverty. During the Great Recession, Oklahomans began losing jobs and depleting cash savings and financial resources. When families were without the means to provide for basic necessities like food, SNAP provided a safety net. During the worst of the Great Recession between 2007 and 2010, new applications for SNAP assistance jumped 83.5 percent. Since 2008, overall enrollment in the program in Oklahoma has risen 32 percent.6
FuNdiNg & admiNistratioN
The United States Congress appropriates and authorizes the federal funds for SNAP each fiscal year, while the USDA regulates the program through their Food and Nutrition Service (FNS) division. FNS funds are distributed and administered at the local level by the Oklahoma Department of Human Services (OKDHS). SNAP benefits are 100 percent funded by the federal government, while administrative costs are shared equally between FNS and local or state governments.
Nearly 615,000 Oklahomans Were Enrolled in SNAP in FY 2012Source: OK Policy analysis of US Census data
43.5 percent children
18.7 percent adults with dependent children
30.3 percent elderly or disabled adults
3.8 percent able-bodied adults without dependents working full- or part-time
2.0 percent unemployed adults without dependents
Oklahoma Policy Institute | P.O. Box 14347 | Tulsa, OK 74159-1347 | (918) 794-3944 | [email protected]
OKPOLICY.ORG Page 4
The 2009 Recovery Act increased the average monthly SNAP payments to families by $20-$25 dollars. Overall, this increased the average meal benefit per person from $1.30 to $1.50. This temporary increase expired in November 2013, amounting to a loss of $66 million from Oklahoma’s SNAP budget.7
Every five years, SNAP appropriations are authorized through the Farm Bill. In the most recent Farm Bill debate, the program has been targeted for cuts by Congressional Republicans. This year the US House approved a bill in a party-line vote that would cut $39 billion from SNAP over 10 years.8 While this bill has not been approved in the Senate and President Obama has threatened a veto, the possibility remains that Congress might further cut SNAP benefits in the future.
ecoNomic imPact
SNAP is the foundational food security program. Based on calculations by Feeding America, the food banks nationwide distribute less than 1/10th as many meals as are funded through SNAP each year.9 Without SNAP, malnutrition and hunger in the United States would dramatically rise. SNAP is also important to Oklahoma’s economy. For every $1 of SNAP benefits spent, $1.79 is put back into the economy.4 In 2011, SNAP contributed over $1.6 billion to net retail trade in Oklahoma.
evaluatioN & criticisms
By providing purchasing power to obtain food, SNAP reduces Americans’ probability of being food insecure by 20-30 percent.10 However, there is growing debate regarding SNAP‘s ability to ensure access to a nutritious diet. Fresh fruits and vegetables often cost more than unhealthy food such as chips and soda. Some recipients may opt for cheaper groceries over healthier meals in order to stretch SNAP dollars further. Eating less nutritious food can increase SNAP recipients’ vulnerability to food insecurity and obesity.11
Several policy changes could be implemented to address this problem:
• Offer cash back incentives to those who purchase healthier items using SNAP.• Increase the number of farmers’ markets that accept SNAP and expand “double up” programs that
provide matching funds for SNAP purchases at farmers’ markets.• Restrict SNAP eligibility on items like soda and some processed foods.
There are online resources for those wanting to research nutrition and healthy living, but it is unknown how many utilize this resource.12 Policymakers might consider the possibility of increasing access to nutrition education in the future.
Although “food stamp fraud” is a popular topic of discussion among some lawmakers and media, the error rate of the SNAP program is much lower than popular perceptions. It also continues to fall. Since
SNAP is the foundational food security program.
Without SNAP, malnutrition and hunger
in the United States would rise dramatically.
OKPOLICY.ORG Page 5
Oklahoma Policy Institute | P.O. Box 14347 | Tulsa, OK 74159-1347 | (918) 794-3944 | [email protected]
2007, rate of underpayments and overpayments for SNAP decreased 33 percent, from 6 percent to 3.9 percent.13 Fraudulent incidents have decreased, even while total applications and caseloads have increased.
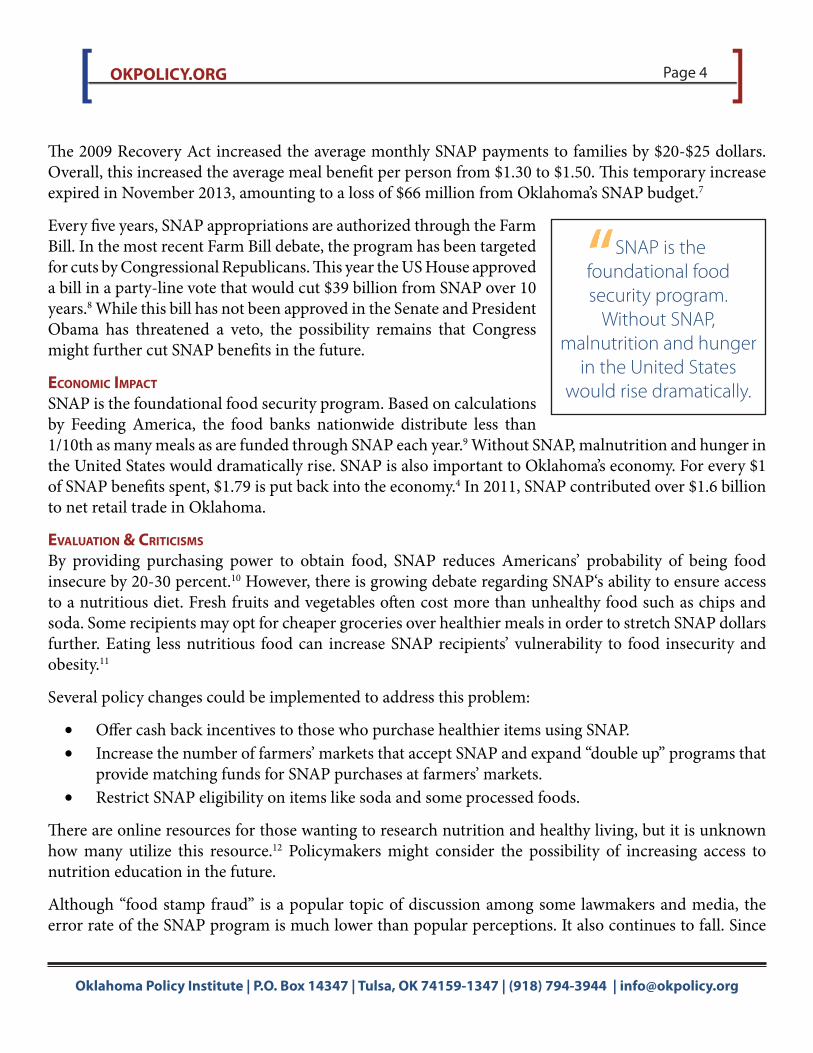
Finally, there is a growing gap between the adequacy of SNAP benefits and the cost of food. The USDA uses current food prices to estimate the amount of money the average family of four needs to budget for their groceries. A family of four (with two children between the ages of 6-11 on the ‘thrifty’ food plan) needs $582.60 each month for groceries. The average SNAP benefit is not keeping up with rising food prices.
III. School and Daycare Food Programs
Children have the highest food insecurity rates in Oklahoma. In 2009, while Oklahoma’s overall food insecurity rate was 15.2 percent, the child food insecurity rate was 26.7 percent.14 More than 1 in every 4 children are food insecure – either going hungry or not receiving the minimum nutritional amounts as set forth by the USDA. Four federal food programs seek to combat child food insecurity by providing healthy meals to children: the National School Lunch Program, the School Breakfast Program, the Special Milk Program, and the Summer Food Service Program.
eligibility & ParticiPatioN
In order for any student to participate in subsidized food programs, the family household income must meet federal requirements. A family must be at 185 percent or below the poverty line for children to receive a reduced priced meal and 130 percent at or below the poverty line for children to receive free meals. Each family must reapply annually through their school or residential child care institution to receive services.
In the 2011-2012 school year, 62 percent of all enrolled Oklahoma school children, or about 408,400 students, were eligible for free or reduced price school food programs.15 In the past five years, the largest participation change was seen in the School Breakfast Program, which grew by 29,717 students from 2008-2012. The National School Lunch Program grew by nearly as much — 21,648 children from 2008-2012.16
$588.30 $583.40 $582.60$611.70 $627.90
$437.04 $440.00
$517.84 $520.00 $512.00
FY2008 FY2009 FY2010 FY2011 FY2012
USDA Food Cost - Thrifty Plan Estimates SNAP Benefit
Average Monthly SNAP Benefit vs. Food Costs for Oklahoma Family of 4
Source: USDA Center for Nutrition Policy and Promotion/Food and Nutrition Service

Oklahoma Policy Institute | P.O. Box 14347 | Tulsa, OK 74159-1347 | (918) 794-3944 | [email protected]
OKPOLICY.ORG Page 6
Since the Great Recession, the percentage of Oklahoma school children participating in any federal food program has increased 7 percent.
FuNdiNg & admiNistratioN
All schoolchildren programs are federally funded (including state administration costs) through the Food and Nutrition Services division of the USDA. Within Oklahoma, all four programs are administered through the Oklahoma Department of Education. The Department requests reimbursement each year for funds spent the previous year.
ecoNomic imPact
None of the school children food programs cost the state any money; however, by providing federal dollars to our private and public schools, the money is supporting jobs. Furthermore, when children receive three healthy meals a day, they score better on tests, are less likely to have mental or physical illnesses, and are more likely to be food secure. Better food security throughout a child’s formative years facilitates better overall academic learning and therefore, better employment or college opportunities after graduation.
NatioNal school luNch Program
Since 1946, the National School Lunch Program (NSLP) has provided free or reduced cost lunches to both private and public schools, as well as residential childcare institutions. For children who remain after school for educational activities, the NSLP also provides free after-school snacks.
NSLP’s goal is to “provide nutritionally balanced, low-cost or free lunches to children each day at school.”17 This program is reducing hunger by providing meals to 3 out of every 5 Oklahoma schoolchildren. However, some have raised concerns about the nutritional quality of the foods served. Researchers have found mixed results over whether children who receive NSLP meals are healthier than those that do not.18,19,20
Critics point to less healthy items such as pizza and french fries that are frequently found on school lunch menus.
school breakFast Program
Established in 1966, the School Breakfast Program (SBP) provides breakfast to children in public and private schools as well as child care centers. The SBP served 227,356 students in FY 2012, or about 1 out of 3 of all Oklahoma schoolchildren. Studies have established that children who participate in the School
FY 2008 FY 2009 FY 2010 FY 2011 FY 2012National School Lunch 424,427 437,660 449,171 452,426 446,075School Breakfast 197,639 208,249 218,236 224,431 227,356Summer Food 11,686 12,826 11,665 10,628 11,390
0
100
200
300
400
500
Tho
usa
nd
s
Oklahoma Schoolchildren in Federal Food Programs Source: USDA Food and Nutrition Services

OKPOLICY.ORG Page 7
Oklahoma Policy Institute | P.O. Box 14347 | Tulsa, OK 74159-1347 | (918) 794-3944 | [email protected]
Breakfast Program instead of eating at home consume more protein, more carbohydrates, and less sugar.19 Overall, these children have more nutritious meals. These healthier eating patterns facilitate a reduction in childhood obesity. By providing the most important meal of the day, this program has been proven to boost academic performance.21
sPecial milk Program
The Special Milk Program, also established in 1966, offers fat free or 1 percent milk at a reduced price or free to students in schools or residential childcare institutions that do not participate in other federal meal programs. Children who drink more milk are more likely to receive more vitamins and minerals for healthy growth and bone structure. As mentioned previously, the overall participation levels have been dropping for the past few years. Policy makers should investigate the causes of this and market the program more effectively to increase participation.
summer Food service Program
The goal of the summer food service program (SFSP) is “to ensure that low-income children continue to receive nutritious meals when school is not in session.”22 Free meals are provided at approved sites from May to September. However, as of 2012 only 2.5 percent of the children who were enrolled in the NSLP during the school year received food from the SFSP. It is unclear how the remaining 97.5 percent of low income school children are receiving nutritious meals when school is not in session; the USDA currently does not have program data available.
The USDA reported an increase of 13 percent for Oklahoma in 2012, but this is still far below the needed numbers based on enrollment during the school year. The Healthy, Hunger-Free Kids Act of 2010 included a mandate that the NSLP work more closely with the SFSP to ensure that parents and children are aware of the food program during the summer.
A new component to the NSLP called the Seamless Summer Option allows any school already participating in the NSLP to continue to receive funds under NSLP throughout the summer instead of applying for the Summer Food Service Program.
According to research completed in 2012 by the Food Research and Action Center, 79 percent of total summer nutrition participation in Oklahoma is still funded through the Summer Food Service Program.23
evaluatioN & criticisms
Schoolchildren food programs are vital to ensure the food security of low-income children. However, while the programs are reducing hunger, the nutritional quality of the food could be improved. Any legislative changes to the programs are made at the federal, not state level. In 2010, the Healthy, Hunger-Free Kids Act was passed. This law mandated better administration for all school children food programs (except the Special Milk Program). These new changes are only just now being implemented, so it is unclear the overall effect they will have on the food programs.

Oklahoma Policy Institute | P.O. Box 14347 | Tulsa, OK 74159-1347 | (918) 794-3944 | [email protected]
OKPOLICY.ORG Page 8
IV. Child and Adult Food Care Programs (CAFCPs)
The Child and Adult Care Food Program (CACFP) reimburses day care centers, homeless and domestic violence shelters that provide food for children and adults. Each meal must include a meat (or meat alternative), a vegetable and/or fruit, milk, and bread.
eligibility & ParticiPatioN
Any child 12 years of age or younger, disabled child under 18 years, or adult with a disability or 60 years of age or older at a day care center, homeless shelter, or domestic violence shelter is eligible to receive CACFP funded food. Individuals must be at or below 130 percent of the poverty line in order to receive a free meal. Individuals between 130 percent and 185 percent of the poverty line may receive a meal at a reduced price. Those who participate in SNAP, SSI, Medicaid, Federal Distribution on Indian Reservation Food Program, or Temporary Assistance for Needy Families are automatically eligible for CACFP.
In 2011, 789 of the 811 Oklahoma organizations participating in CACFP were day care centers. The remaining organizations were emergency shelters such as those for homeless individuals or women escaping abuse. The number of CACFP meals served in Oklahoma has declined every year since FY 2008, for a cumulative decline of 5 percent, from 42.1 million to 39.8 million meals.
FuNdiNg & admiNistratioN
CACFP is completely funded by the USDA’s Food and Nutrition Service, including administrative costs. Organizations can be reimbursed up to three meals a day per person. Average reimbursement amounts are $1.46 per breakfast meal, $2.68 per lunch meal, and $0.74 per snack.
ecoNomic imPact
CACFPs do not cost any state funds. However, the overall impact on the state economy is substantial. By reimbursing the cost of day care meals, the program reduces the overall cost of day care, making it more
57,718
57,028
57,913
56,667
54,322
50
52
54
56
58
60
FY2008 FY2009 FY2010 FY2011 FY2012
Tho
usa
nd
s
42.07M
41.30M 41.30M
40.34M
39.85M
38
39
40
41
42
43
FY2008 FY2009 FY2010 FY2011 FY2012
Mill
ion
s
CACFP Average Oklahoma Daily Attendance Source: USDA Food and Nutrition Services
CACFP Meals Served in OklahomaSource: USDA Food and Nutrition Services

OKPOLICY.ORG Page 9
Oklahoma Policy Institute | P.O. Box 14347 | Tulsa, OK 74159-1347 | (918) 794-3944 | [email protected]
affordable for low- and moderate-income families. This provides more mothers, fathers, and caregivers the flexibility to hold a job and support dependent children or disabled adults.
evaluatioN & criticisms
This program’s goal is to make care more affordable for low-income families. However, many child day care centers located in low-income areas do not participate in this program. Lack of participation could be attributed to the center being unlicensed, the center not being aware of the program, or the center not wanting to do the paperwork required. However, a study on day care centers that participated in CACFP found that children received better nutritional value in their meals than those at day care centers without CACFP meals.24 Children receiving CACFP funded meals are less likely to be either overweight or underweight.
Oklahoma participation in CACFPs has decreased over the last few years. Although the decrease is relatively small, policymakers should do more to ensure that the program is available for the low-income working families that need it. An awareness campaign could help to inform more day cares in high-need areas about this program and why it is important.
V. Women, Infants, and Children Program (WIC)
Through the Women, Infants and Children program, low-income mothers and their young children can access nutritious foods including baby formula and milk, basic healthcare, and nutrition education. WIC foods are specifically chosen to provide the most important nutrients for nursing or pregnant mothers and young children. Nutrition education, including online training, consultations with registered dietitians, and fitness classes are also available through WIC.
eligibility & ParticiPatioN
Women who are pregnant or nursing, infants, and children up to five years of age are eligible for WIC benefits if the family makes below 185 percent of the poverty line. Families who already receive SNAP, Medicaid, or Temporary Assistance for Needy Families automatically qualify. Approximately half of all children born in Oklahoma rely on WIC services.4
FuNdiNg & admiNistratioN
All benefits and administrative costs are funded by federal block grants. The Oklahoma State Department of Health administers the program locally through WIC offices.
ecoNomic imPact
The average monthly benefit per person was $39.97. The WIC program enables participants to purchase up to 26 percent more of the same items than they would otherwise have been able to afford, according to a study by the USDA’s Economic Research Service. For every $1.00 spent on the program, $1.26 is put back into the local economy.25
WIC also saves health care costs by preventing premature births and infant deaths.26 Oklahoma has one

Oklahoma Policy Institute | P.O. Box 14347 | Tulsa, OK 74159-1347 | (918) 794-3944 | [email protected]
OKPOLICY.ORG Page 10
of the highest infant mortality rates in the nation; in 2010, more than 400 Oklahoma infants died before reaching their first birthday. A premature birth is often responsible for an infant’s death; even when the baby survives, premature births are bring much higher health care costs than full-term births.27,28
Mothers on WIC also typically receive health care through Medicaid. By providing supplemental health checks, education, and nutritious food, WIC saves significant Medicaid dollars. Research shows that for every WIC dollar, the Medicaid savings average $1.77 - $3.13 within the first 60 days following birth.29,30
evaluatioN & criticisms
WIC’s goal is to provide nutritious foods to supplement the diets of women, infants, and children. The program is certainly meeting its goal – as demonstrated by its ability to save lives and increase the health outcomes of moms and babies. Although reduction of food insecurity is not an explicit goal of WIC, the program does help. In 2009, 25 percent of all families that received WIC benefits in the last 30 days had at least one individual in the household that was food insecure.26 Multiple studies have found that food insecurity was reduced for women who enrolled in WIC.26,31
An estimated 60.4 percent of those eligible for WIC are receiving the services; in 2010, more than 86,000 mothers and young children in Oklahoma were eligible for WIC but did not receive assistance.32 Policymakers could do more to ensure access by expanding WIC offices, partnering with additional groups in high-need areas to provide WIC, and promoting awareness about the program and about maternal and infant health.
VI. Senior Food Programs
Elderly Nutrition Services and ADvantage Meal programs provide free food to low income seniors across Oklahoma, either through direct delivery to their home or in a congregate setting such as a senior center. Typically, these seniors have little social support and physical disabilities, making it difficult to purchase or cook meals for themselves.
Since 1972, Congregate Meal Services has provided funds to senior centers and faith-based organizations across Oklahoma for meals offered in a social setting. Meals are prepared by a registered dietitian. Since 1978, Home Delivered Meal Services provide meals directly delivered to a senior’s home. Meals are also required to be prepared by a registered dietitian.
ADvantage is a Medicaid program available to seniors who have made the decision to remain at home rather than be admitted to a nursing home. Through ADvantage, free meals are delivered to low income seniors who are unable to leave their homes.
In 2010, about 86,000 mothers and
young children in Oklahoma were eligible
for WIC but did not receive assistance.
OKPOLICY.ORG Page 11
Oklahoma Policy Institute | P.O. Box 14347 | Tulsa, OK 74159-1347 | (918) 794-3944 | [email protected]
eligibility & ParticiPatioN
Oklahomans are eligible for Congregate Meals and Home Delivered Meal Services once they reach the age of 60. Any spouse of a person 60 years or older is automatically eligible for services, regardless of age. There is no income or asset test for the Elderly Nutrition Service programs, but the programs do reach out to low-income seniors and persons with a disability. For ADvantage, the applicant must be referred to the program by an Oklahoma Department of Human Services case worker and be qualified for Medicaid.
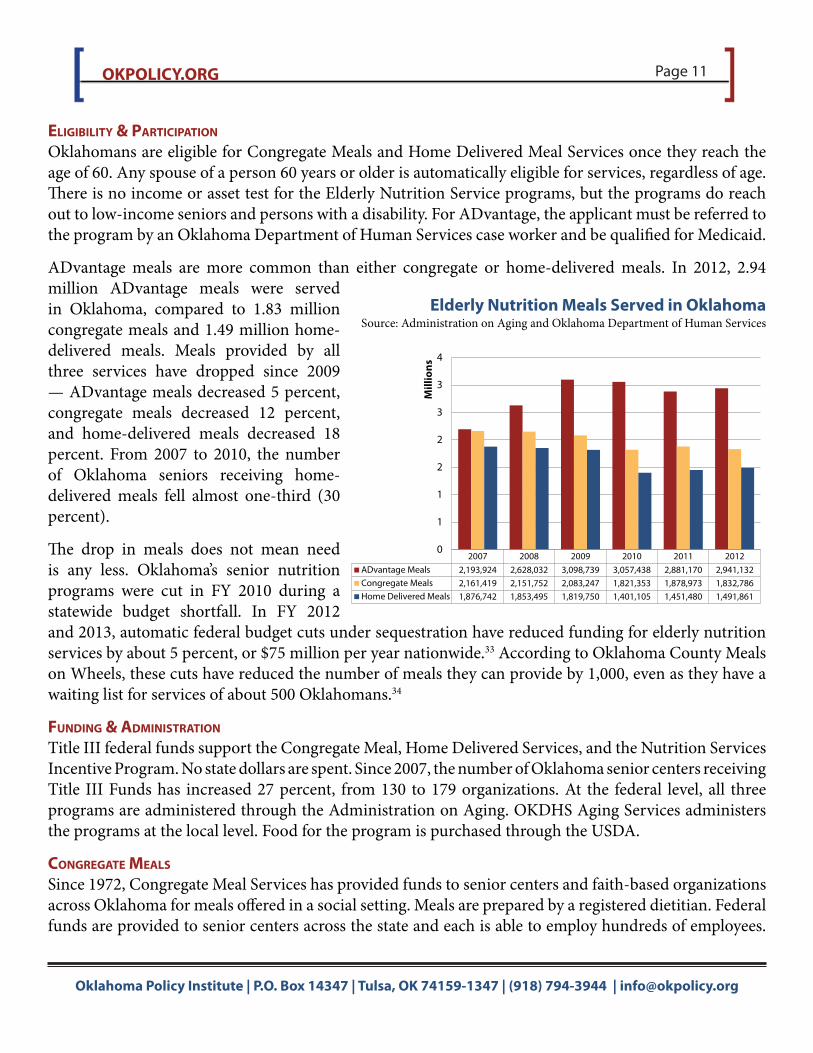
ADvantage meals are more common than either congregate or home-delivered meals. In 2012, 2.94 million ADvantage meals were served in Oklahoma, compared to 1.83 million congregate meals and 1.49 million home-delivered meals. Meals provided by all three services have dropped since 2009 — ADvantage meals decreased 5 percent, congregate meals decreased 12 percent, and home-delivered meals decreased 18 percent. From 2007 to 2010, the number of Oklahoma seniors receiving home-delivered meals fell almost one-third (30 percent).
The drop in meals does not mean need is any less. Oklahoma’s senior nutrition programs were cut in FY 2010 during a statewide budget shortfall. In FY 2012 and 2013, automatic federal budget cuts under sequestration have reduced funding for elderly nutrition services by about 5 percent, or $75 million per year nationwide.33 According to Oklahoma County Meals on Wheels, these cuts have reduced the number of meals they can provide by 1,000, even as they have a waiting list for services of about 500 Oklahomans.34
FuNdiNg & admiNistratioN
Title III federal funds support the Congregate Meal, Home Delivered Services, and the Nutrition Services Incentive Program. No state dollars are spent. Since 2007, the number of Oklahoma senior centers receiving Title III Funds has increased 27 percent, from 130 to 179 organizations. At the federal level, all three programs are administered through the Administration on Aging. OKDHS Aging Services administers the programs at the local level. Food for the program is purchased through the USDA.
coNgregate meals
Since 1972, Congregate Meal Services has provided funds to senior centers and faith-based organizations across Oklahoma for meals offered in a social setting. Meals are prepared by a registered dietitian. Federal funds are provided to senior centers across the state and each is able to employ hundreds of employees.
2007 2008 2009 2010 2011 2012
ADvantage Meals 2,193,924 2,628,032 3,098,739 3,057,438 2,881,170 2,941,132Congregate Meals 2,161,419 2,151,752 2,083,247 1,821,353 1,878,973 1,832,786Home Delivered Meals 1,876,742 1,853,495 1,819,750 1,401,105 1,451,480 1,491,861
0
1
1
2
2
3
3
4
Mill
ion
s
Elderly Nutrition Meals Served in OklahomaSource: Administration on Aging and Oklahoma Department of Human Services

Oklahoma Policy Institute | P.O. Box 14347 | Tulsa, OK 74159-1347 | (918) 794-3944 | [email protected]
OKPOLICY.ORG Page 12
Without the additional annual funds, it is unknown whether or not the centers would continue to provide free meals to seniors. In 2011, $5.0 million was spent on congregate meals in Oklahoma.
Congregate meals lower Medicaid and Medicare costs by reducing food insecurity and social isolation among seniors. In the most recent numbers (2009), Oklahoma ranked tenth among all states for seniors with the highest level of food insecurity.35 Seniors with higher levels of food insecurity have more difficulty with Activities of Daily Living (ADL) and mental illness. Social isolation can also be a contributor to a senior’s increased healthcare problems.36
home-delivered meals
Since 1978, Home Delivered Meal Services provide meals directly delivered to a senior’s home. Meals are also required to be prepared by a registered dietitian.
Home-delivered meals are typically provided by private or non-profit organizations (such as Meals on Wheels) that employ hundreds of employees. These organizations typically rely on private donations and philanthropy in addition to public funds. In 2011, $3.3 million was spent on home-delivered meals in Oklahoma.37 Like congregate meals, home-delivered meals can also reduce Medicaid and Medicare costs by reducing food insecurity and social isolation among seniors.
advaNtage meals
ADvantage is a Medicaid program available to seniors who have made the decision to remain at home rather than be admitted to a nursing home. Through ADvantage, free meals are delivered to low income seniors who are unable to leave their home.
When a senior chooses to stay at home rather than be admitted to a nursing home, it saves the state money. While ADvantage meals are reimbursed at $4.88 per person in a home setting, they are reimbursed at $5.17 in a nursing home setting. ADvantage meals also decrease health care costs to the state by reducing social isolation.
evaluatioN & criticisms
All Elderly Nutrition Services share the same goal - to reduce hunger and food insecurity, promote social contact for older individuals, and promote the health and well-being of older individuals to delay adverse health conditions. ADvantage meals have a slightly different goal. The program strives (1) to facilitate member independence by allowing members the choice to remain in his/her own home rather than enter a nursing facility, (2) to provide one daily nutritious meal to persons at risk of being institutionalized, and (3) to provide a daily social contact to ensure the member’s safety and well being.

OKPOLICY.ORG Page 13
Oklahoma Policy Institute | P.O. Box 14347 | Tulsa, OK 74159-1347 | (918) 794-3944 | [email protected]
All the programs are generally accomplishing their goals. However, senior nutrition programs could be improved:
• Dietitians are available to seniors at congregate settings for nutritional counseling; however, there is a lack of funding to provide that same counseling to those receiving their meals at home.
• Congregate meals and Home-Delivered meals have seen an overall decrease in funding since 2009. Legislators should find ways to increase funding to these important programs.
• The program is under promoted. These programs make many positive contributions to Oklahomans’ well-being and the Oklahoma economy, yet few individuals are aware of them and they are infrequently reported on. It is important that tax payers remain aware of good programs to insure that legislators and policymakers continue to support them.
Based on health screening statistics reported by the Oklahoma Department of Health to the Administration on Aging, 18 percent of Oklahoma seniors receiving congregate meals are considered to be of high nutritional risk, meaning that they are unable, even with congregate meal services, to receive the minimum daily nutritional guidelines as set forth by the USDA.38 Policymakers and legislators might wish to examine ways to continue improving the health and food security of seniors.
These same statistics also indicated that seniors living in rural areas find it more difficult to shop and prepare food than those living in urban areas. Policymakers and legislators should consider making congregate meals and home-delivered meals more accessible to those in rural areas to increase their food security.
VII. Non-Profit Food Distribution Programs
the emergeNcy Food assistaNce Program aNd Food baNks
The Emergency Food Assistance Program (TEFAP) is a federal program that provides food commodities directly to each state. In Oklahoma, the majority of commodities are supplied to the state’s food banks: the Regional Food Bank of Oklahoma and the Community Food Bank of Eastern Oklahoma. In turn, they distribute the food to Emergency Feeding Organizations (EFO) such as soup kitchens, food pantries, churches, and community action centers.
eligibility & ParticiPatioN
In Oklahoma, eligible organizations must have signed a TEFAP agreement with the state and provide the food to EFOs. An EFO must provide the food only to low-income or needy families. The Community Food Bank of Eastern Oklahoma and the Regional Food Bank of Oklahoma are the largest recipients of TEFAP funding. However, the majority of food
Community Food Bankof Eastern Oklahoma
12,888,527 meals
Regional Food Bank of Oklahoma35,166,666 meals
Oklahoma Food Bank Meals Served, FY 2012
Source: Food Bank Annual Reports

Oklahoma Policy Institute | P.O. Box 14347 | Tulsa, OK 74159-1347 | (918) 794-3944 | [email protected]
OKPOLICY.ORG Page 14
supplied by the food banks to EFOs comes from privately donated product and funds, both individual and corporate.
In fiscal year 2012, a total of 57 million pounds of food was distributed to both food banks. Pounds distributed included both TEFAP and CSFP funded food as well as food purchased from the USDA through private and corporate donations. This translates to approximately 48 million meals served throughout Oklahoma. More than 70 percent of these pounds were distributed through the Regional Food Bank. Only 18 percent of this food distribution in 2012 was through TEFAP and another government program, the Commodity Supplemental Food Program (see next section).
FuNdiNg & admiNistratioN
Both the food commodities and state administrative costs, including food storage, are 100 percent funded by the federal government. The amount of appropriations for each state is determined by the unem-ployment rate and the number of persons below the poverty line. Last year, the federal government spent $4.1 million on food commodities in Oklahoma. This is a 48 percent decrease from the amount spent in 2009, when spending was at its peak due to the Great Recession. Overall, just 13.4 percent of food distributed by the Regional Food Bank and 24.4 percent of food available through the Community Food Bank of Eastern Oklahoma was supplied by USDA commodities. TEFAP is administered at the federal level by the USDA FNS. OKDHS administers the program at the state level.
ecoNomic imPact
As the government is directly providing food commodities, a net zero impact (in terms of dollars) on the Oklahoma economy is produced. However, when Oklahomans are healthier and have greater food security, reduced amounts of Medicaid or Medicare benefits are needed (due to less illness), and individuals who feel better are able to work more hours. Both of these occurrences are of great economic benefit to the state as a whole.
evaluatioN & criticisms
The mission of TEFAP and food banks is to reduce hunger in times of emergencies. According to annual reports released by both the Regional Food Bank and the Community Food Bank of Eastern Oklahoma, TEFAP is a crucial and successful program.39,40 However, there is concern that TEFAP is underfunded. The poverty and food insecurity rate in Oklahoma have continued to rise, yet the amount of federal funding
$2,990,296
$7,857,300
$6,859,248
$5,876,925
$4,158,591
FY2008 FY2009 FY2010 FY2011 FY2012
Total Food Costs for The Emergency Food Assistance Program in Oklahoma
Source: USDA Food and Nutrition Services
OKPOLICY.ORG Page 15
Oklahoma Policy Institute | P.O. Box 14347 | Tulsa, OK 74159-1347 | (918) 794-3944 | [email protected]
has decreased significantly. Due in large part to higher food prices and less discretionary agricultural purchases made by the USDA, Oklahoma’s food banks saw a 40 percent decline in received TEFAP commodities from FY 2011 to FY 2012. Oklahoma continues to struggle with high rates of poverty and food insecurity, even though unemployment is relatively low compared to other states.
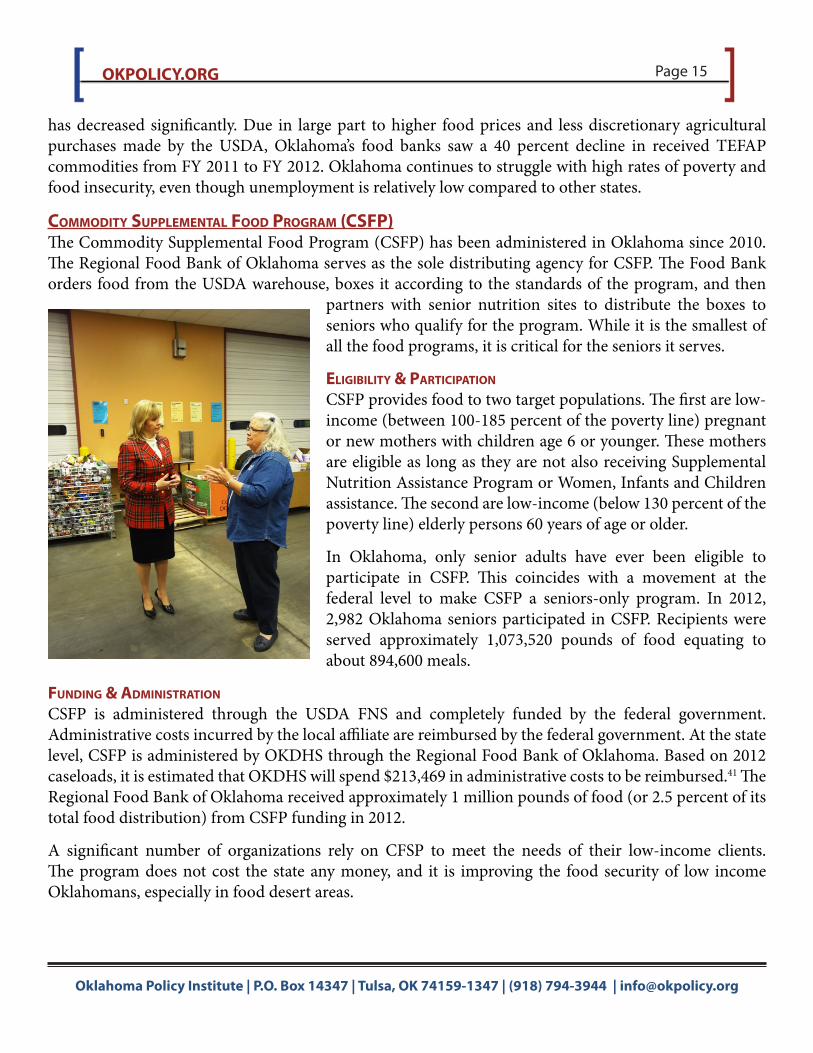
commodity suPPlemeNtal Food Program (csFP)The Commodity Supplemental Food Program (CSFP) has been administered in Oklahoma since 2010. The Regional Food Bank of Oklahoma serves as the sole distributing agency for CSFP. The Food Bank orders food from the USDA warehouse, boxes it according to the standards of the program, and then
partners with senior nutrition sites to distribute the boxes to seniors who qualify for the program. While it is the smallest of all the food programs, it is critical for the seniors it serves.
eligibility & ParticiPatioN
CSFP provides food to two target populations. The first are low-income (between 100-185 percent of the poverty line) pregnant or new mothers with children age 6 or younger. These mothers are eligible as long as they are not also receiving Supplemental Nutrition Assistance Program or Women, Infants and Children assistance. The second are low-income (below 130 percent of the poverty line) elderly persons 60 years of age or older.
In Oklahoma, only senior adults have ever been eligible to participate in CSFP. This coincides with a movement at the federal level to make CSFP a seniors-only program. In 2012, 2,982 Oklahoma seniors participated in CSFP. Recipients were served approximately 1,073,520 pounds of food equating to about 894,600 meals.
FuNdiNg & admiNistratioN
CSFP is administered through the USDA FNS and completely funded by the federal government. Administrative costs incurred by the local affiliate are reimbursed by the federal government. At the state level, CSFP is administered by OKDHS through the Regional Food Bank of Oklahoma. Based on 2012 caseloads, it is estimated that OKDHS will spend $213,469 in administrative costs to be reimbursed.41 The Regional Food Bank of Oklahoma received approximately 1 million pounds of food (or 2.5 percent of its total food distribution) from CSFP funding in 2012.
A significant number of organizations rely on CFSP to meet the needs of their low-income clients. The program does not cost the state any money, and it is improving the food security of low income Oklahomans, especially in food desert areas.
Oklahoma Policy Institute | P.O. Box 14347 | Tulsa, OK 74159-1347 | (918) 794-3944 | [email protected]
OKPOLICY.ORG Page 16
VIII. Food Distribution in Indian Country
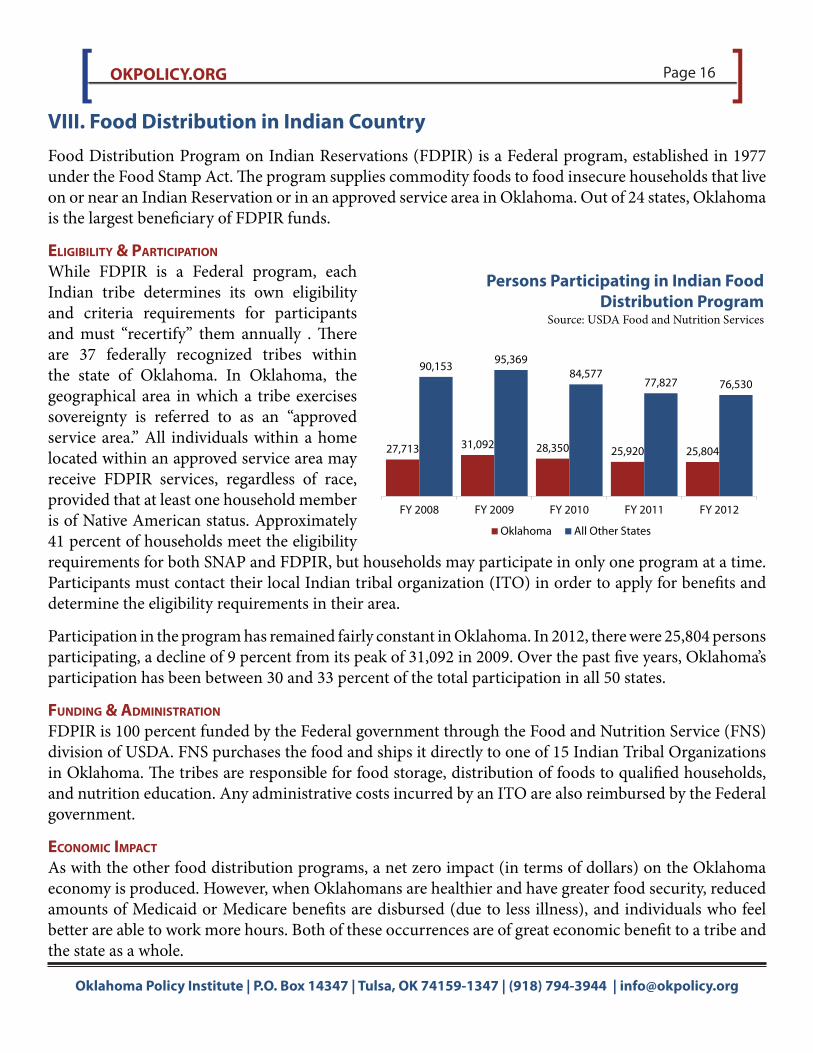
Food Distribution Program on Indian Reservations (FDPIR) is a Federal program, established in 1977 under the Food Stamp Act. The program supplies commodity foods to food insecure households that live on or near an Indian Reservation or in an approved service area in Oklahoma. Out of 24 states, Oklahoma is the largest beneficiary of FDPIR funds.
eligibility & ParticiPatioN
While FDPIR is a Federal program, each Indian tribe determines its own eligibility and criteria requirements for participants and must “recertify” them annually . There are 37 federally recognized tribes within the state of Oklahoma. In Oklahoma, the geographical area in which a tribe exercises sovereignty is referred to as an “approved service area.” All individuals within a home located within an approved service area may receive FDPIR services, regardless of race, provided that at least one household member is of Native American status. Approximately 41 percent of households meet the eligibility requirements for both SNAP and FDPIR, but households may participate in only one program at a time. Participants must contact their local Indian tribal organization (ITO) in order to apply for benefits and determine the eligibility requirements in their area.
Participation in the program has remained fairly constant in Oklahoma. In 2012, there were 25,804 persons participating, a decline of 9 percent from its peak of 31,092 in 2009. Over the past five years, Oklahoma’s participation has been between 30 and 33 percent of the total participation in all 50 states.
FuNdiNg & admiNistratioN
FDPIR is 100 percent funded by the Federal government through the Food and Nutrition Service (FNS) division of USDA. FNS purchases the food and ships it directly to one of 15 Indian Tribal Organizations in Oklahoma. The tribes are responsible for food storage, distribution of foods to qualified households, and nutrition education. Any administrative costs incurred by an ITO are also reimbursed by the Federal government.
ecoNomic imPact
As with the other food distribution programs, a net zero impact (in terms of dollars) on the Oklahoma economy is produced. However, when Oklahomans are healthier and have greater food security, reduced amounts of Medicaid or Medicare benefits are disbursed (due to less illness), and individuals who feel better are able to work more hours. Both of these occurrences are of great economic benefit to a tribe and the state as a whole.
27,713 31,092 28,350 25,920 25,804
90,15395,369
84,57777,827 76,530
FY 2008 FY 2009 FY 2010 FY 2011 FY 2012
Oklahoma All Other States
Persons Participating in Indian Food Distribution Program
Source: USDA Food and Nutrition Services
OKPOLICY.ORG Page 17
Oklahoma Policy Institute | P.O. Box 14347 | Tulsa, OK 74159-1347 | (918) 794-3944 | [email protected]
evaluatioN & criticisms
While there is no explicitly stated goal for FDPIR, the overall goal of the Food and Nutrition Services is to reduce food insecurity . FDPIR is facilitating this goal. Native Americans are more vulnerable than other populations to high food insecurity . Tribes are typically located in food deserts and Native Americans have higher rates of obesity and diabetes than other minority groups, which would suggest higher food insecurity rates.42
FDPIR is a unique program under the Food Stamp Act – it provides food directly by commodity instead of through vouchers. The program was created when the government discovered that many households living on tribal lands did not have access to a SNAP office nor grocery stores that accepted SNAP benefits. Families on tribal lands may choose to enroll in either SNAP or FDPIR.
Typically, SNAP benefits are larger than FDPIR benefits, but it does vary. When a household is deciding which program to enroll in, they are likely to consider factors like access to grocery stores, cultural understanding, food choices available, and ease of enrollment as well as overall benefit amount.
Most of the research conducted on FDPIR suggests that it is a necessary and effective program; however, more research should be conducted and encouraged by policy makers to determine more specific effects. For example, state level data on the program does not exist and less is known about the nutritional and cultural impact of the program on tribes.
While there are no legislatives issues on the horizon, policy makers and legislators need to be remain aware of the importance of FDPIR. Many Indian tribes depend on this program to provide food security to their communities.
P.O. Box 14347Tulsa, OK 74159-1347
(918) 794-3944 [email protected]
Oklahoma Policy Institute (OK Policy) is a non-profit organization that provides information, analysis and ideas on state policy issues.
This report was authored by Amanda Marcott Thottunkal ([email protected]), Gene Perry ([email protected]), and Kate Richey ([email protected]).

Oklahoma Policy Institute | P.O. Box 14347 | Tulsa, OK 74159-1347 | (918) 794-3944 | [email protected]
OKPOLICY.ORG Page 18
reFereNces
1. United States Department of Agriculture, Economic Research Service, 2012. Food Security in the U.S. Measurement. http://www.ers.usda.gov/topics/food-nutrition-assistance/food-security-in-the-us/measurement.aspx#security2. Judi Bartfield et al, 2005. United States Department of Agriculture, Economic Research Service. State-level predictors of food insecurity and hunger among households with children.3. Craig Gundersen et al, 2011.The Economics of Food insecurity in the United States. Applied Economic Perspectives and Policy, 33(3): 281-303.4. State of the State: The High Price of Hunger in Oklahoma. Oklahoma Food Security Committee 2011 Report.5. Characteristics of Supplemental Nutrition Assistance Program Households: Fiscal Year 2011: http://www.fns.usda.gov/ORA/menu/Published/SNAP/FILES/Participation/2011Characteristics.pdf.6. Center on Budget and Policy Priorities, 2013. Policy basics: Introduction to the Supplemental Nutrition Assistance Program (SNAP). http://www.cbpp.org/cms/index.cfm?fa=view&id=2226 & David Blatt, 2009. Saved by the net: Food assistance programs help mitigate recessions’http://okpolicy.org/saved-by-the-net-food-assistance-programs-help-mitigate-recessions-impact7. Putnam, Carly. October 2013. “SNAP Down: Reduced food benefits set to hit one in six Oklahomans.” Oklahoma Policy Insti-tute. http://okpolicy.org/snap-reductions-death-thousand-cuts.8. Richey, Kate. September 2013. “SNAP Out Of It: Food security shouldn’t be a budget battle.” Oklahoma Policy Institute. http://okpolicy.org/snap-cuts.9. Perry, Gene. October 2013. “Charity can’t replace the safety net.” Oklahoma Policy Institute. http://okpolicy.org/charity-cant-replace-safety-net.10. Ratcliffe, Caroline & Signe-Mary McKernan. 2010. “How Much Does SNAP Reduce Food Insecurity?” Urban Institute. http://www.urban.org/UploadedPDF/412065_reduce_food_insecurity.pdf.11. Charles Baum, 2007. The effects of food stamps on obesity. United States Department of Agriculture Economic Research Ser-vice and Nutrition Assistance Research Program.12. United States Department of Agriculture, 2013. Supplemental Nutrition Assistance Program Education. http://www.fns.usda.gov/snap/nutrition_education/13. U.S. Department of Agriculture, Supplemental Nutrition Assistance Program Payment Error Rates FY2011. June 6, 2012. http://www.fns.usda.gov/snap/qc/pdfs/2011-rates.pdf14. The USDA does not calculate food insecurity rates for children. This data was taken from Map the Meal Gap, which determines its rates differently. In 2009, Map the Meal Gap’s food insecurity rate was 17.1 percent while the USDA was 15.2. However, this difference is not significant enough to take away from the fact that children are significantly more food insecure than the overall population.15. Oklahoma State Department of Education. November 2012. “Oklahoma 2011-2012 Low-Income Report.” http://ok.gov/sde/sites/ok.gov.sde/files/LowIncomeReport1112.pdf.16. USDA Food and Nutrition Service. November 2013. “NATIONAL SCHOOL LUNCH PROGRAM: TOTAL LUNCHES SERVED.” http://www.fns.usda.gov/pd/05slmeals.htm.17. http://www.fns.usda.gov/nslp/national-school-lunch-program18. Gundersen, C., Kreider, B., & Pepper, J. (2012). The impact of the National School Lunch Program on child health: A nonpara-metric bounds analysis. Journal of Econometrics 166, 79-91.19. Condon, E.M., Crepinsek, M.K., & Fox., M.K.(2009). School meals: types of food offered to and consumed by children at lunch and breakfast. Journal of the American Dietetic Association, 109(2), S6-S78. 20. French, S.A. & Story, M. (2013). Commentary on nutrition standards in the national school lunch and breakfast programs. JAMA Pediatr. 2013 Jan;167(1):8-9.21. Worobey, J. & Worobey, H.S. (1999). The impact of a two-year school breakfast program for preschool-aged childrenon their nutrient intake and pre-academic performance. Child Study Journal, 29(2)22. USDA Food and Nutrition Service. Summer Food Service Program (SFSP). http://www.fns.usda.gov/sfsp/summer-food-service-program-sfsp.23. Food Research and Action Center. June 2012. “Hunger Doesn’t Take a Vacation: Summer Nutrition Status Report 2012. http://frac.org/pdf/2012_summer_nutrition_report.pdf.24. Korenman,S., Abner,K.S., Kaestner, R., & Gordon, R.A. (2013). The child and adult care food program and the nutrition of pre-schoolers. Early Childhood Research Quarterly, 28(2), 325-336. National Conference of State Legislatures. March 5, 2013. “FY 2013.
OKPOLICY.ORG Page 19
Oklahoma Policy Institute | P.O. Box 14347 | Tulsa, OK 74159-1347 | (918) 794-3944 | [email protected]
reFereNces (coNtiNued)
25. Hanson, Kenneth and Victor Oliveira. March 2009. “Economic Linkages between the WIC Program and the Farm Sector. United States Department of Agriculture Economic Research Service.” USDA Economic Research Service. http://www.ers.usda.gov/me-dia/177753/eb12.pdf26. Metallinos-Katsaras, Elizabeth et al, 2010. A longitudinal study of WIC participation on household food insecurity. Maternal and Child Health Journal. http://www.springerlink.com/content/l12w4171117h5674/fulltext.pdf 27. Richey, Kate. 2012. “Infant mortality: Its everyone’s responsibility.” Oklahoma Policy Institute. http://okpolicy.org/its-everyones-responsibility28. Oklahoma Department of Health, 2009. Infant Mortality in Oklahoma. http://www.ok.gov/health/Child_and_Family_Health/Improving_Infant_Outcomes/Infant_Mortality_in_Oklahoma/index.html29. Food and Nutrition Service, United States Department of Agriculture. How WIC Helps. http://www.fns.usda.gov/wic/aboutwic/howwichelps.htm#birth outcomes30. Barbara Devaney, et al, 1991. United States Department of Agriculture, Food and Nutrition Service. The Savings in Medicaid Costs for Newborns and Their Mothers Resulting from Prenatal Participation in the WIC program.31. United States General Accounting Office. 1992. “Early Intervention Federal Investments Like WIC Can Produce Savings” http://archive.gao.gov/d32t10/146514.pdf.32. United States Department of Agriculture Food and Nutrition Service, 2013. Special Supplemental Nutrition Program for Women, Infants, and Children (WIC) Eligibles and Coverage – 2010: National and State-Level Estimates of the Population of Women, Infants, and Children Eligible for WIC Benefits, Executive Summary. http://www.fns.usda.gov/Ora/menu/Published/WIC/FILES/WICEligibles2010Sum.pdf33. Impacts of Sequestration for Human Services, Aging, and Nutrition Programs. “ http://www.ncsl.org/research/human-services/fy13-sequestration-human-services-impact.aspx34. Oklahoma News Report. May 2013. “Sequestration Follow-Up.” OETA. http://www.oeta.tv/component/video/3400.html35. J.P. Ziliak and C. Gunderson 2011. “Food Insecurity Among Older Adults.” AARP.36. E.Y Cornwell, E.Y. and L.J. Waite 2009. “Social disconnectedness, perceived isolation, and health among older adults.” Journal of Health and Social Behavior. 50(March), 31-4837. United States Department of Health and Human Services. Administration on Aging. 2011. “Data-at-a-Glance.” http://www.agidnet.org/DataGlance/SPR/38. K.K. Quigley, K.K. and J.R. Hermanann and W.D. Warde. 2008. “Nutritional risk among Oklahoma congregate meal participants.” Journal of Nutrition Education and Behavior, 40(2), 89-93.39. Regional Food Bank of Oklahoma. 2012. “Annual Report, 2012.” http://www.regionalfoodbank.org/assets/AR%202012%20-%20Final.pdf40. Community Food Bank of Eastern Oklahoma. 2012. “Annual Report 2011-2012.” http://www.okfoodbank.org/wp/wp-content/uploads/2013/04/annualreport.pdf41. USDA Food and Nutrition Services. 2013. “Final CSFP Caseload and Administrative Funding.” http://www.fns.usda.gov/fdd/pro-grams/csfp/Attachment--2013_CSFP_Final_Caseload_and_Administrative_Funding-Final.xlsx.42. V.B.B Jernigan, A.L. Salvatore, D.M. Styne, M. Winkleby. 2012. “Addressing food insecurity in a Native American reservation us-ing community-based participatory research.” Health Education Research, 27(4), 645-655.