policy responses to changing perceptions of the role of agriculture...
TRANSCRIPT

Policy Responses to Changing Perceptions of the Role of Agriculture in Development
Kym Anderson
University of Adelaide, Australian National University, and CEPR
April 2012
Thanks are due to ANU workshop participants for helpful comments and to the Australian Research Council for financial support. To be published in The Theory and Practice of Globalisation in Asia: Essays in Honour of Ross Garnaut, edited by P. Drysdale, H. Hill and L. Song, Cambridge and New York: Cambridge University Press, 2012 (forthcoming).

2
Abstract
Traditionally, development economists had a dim view of the contribution that farmers made
to modern economic growth. Compared with the perceived advantages of manufacturing,
agriculture was seen as a low-productivity, constant-returns-to-scale sector whose producers
were not very responsive to incentives. Hence agricultural exports and manufacturing imports
were often taxed. This view changed over time though, as first economists and then gradually
policy makers came to understand the high cost of an anti-agricultural, import-substituting
industrialization strategy. This chapter outlines how this change came about and the resulting
economic policy reforms that have occurred in many developing countries since the 1980s. It
then considers the kinds of distortions that remain within agricultural markets, the instability
these distortions create, and their cost to the global economy. A number of alternatives to
these price-distorting measures are then discussed. The chapter argues for more integrated
global food markets and more public R&D expenditure in developing countries.
Keywords: agricultural development economics, import-substituting industrialization, farm and food price distortions JEL codes: F13, F14, O53, Q17, Q18 Author contact: Kym Anderson School of Economics University of Adelaide Adelaide SA 5005 Phone +61 8 8303 4712 [email protected]

Policy Responses to Changing Perceptions of the Role of Agriculture in Development
Kym Anderson
Traditionally, development economists had a dim view of the contribution that farmers made
to modern economic growth. Hence agricultural exports were often taxed and manufacturers
were protected from import competition. Over time this view changed as economists and then
policy makers came to understand the high cost of an anti-agricultural, anti-trade, import-
substituting industrialization strategy. The change in strategy and policies came first to East
Asia, but it was soon followed by a belief that in the face of rapid industrialization the
agricultural sector would deteriorate so fast as to cause an unacceptably large gap between
farm and non-farm household incomes. The policy response was to increasingly protect
farmers from import competition, following from earlier examples set by Europe and Japan.
This chapter begins by briefly outlining the history of thought regarding agriculture’s
role in economic development, and the resulting policy implications of these changes. It then
summarizes recently constructed time series evidence on the patterns of governmental
distortions to agricultural incentives over the past half-century, focusing on Asian results. The
third section reports on both the contribution of agriculture to the global welfare cost of
distortions to farm and nonfarm goods trade, and the impact of these distortions on income
inequality and poverty. The chapter concludes by pointing to alternative policy options, in
Asia and the rest of the world,for dealing with the perceived problems associated with
agriculture’s changing role in economic development.
Agriculture’s role in early development economics thinking
In the early stages of the evolution of development economics, farmers’ contribution to
economic growth was perceived to be minor at best. In contrast to the perceived advantages
of manufacturing, agriculture was seen as a low-productivity, constant-returns-to-scale
activity whose producers were not very responsive to incentives. In addition, the real
international prices of farm products were known to be volatile and thought to be in

2
permanent long-term decline (Singer 1950, Prebisch 1950). This led Prebisch and others to
argue that developing countries should strive to diversify their economies and reduce their
dependence on a small number of primary commodity exports. To do this, countries should
develop their manufacturing sectors through import-substituting industrialization aided by
manufacturing protection policies (Prebisch 1959). A corollary to this was the taxation of
agricultural exports which, like tariffs on manufactures, had the perceived additional benefit
of raising government revenue in settings where there were still very high costs associated
with collecting income or consumption taxes.
Meanwhile, agricultural development economists such as Johnston and Mellor (1961)
saw the sector’s contributions mainly as a market for manufactures and as a supplier of low-
wage labor to non-farm sectors. This view drew on Arthur Lewis’s (1954) closed-economy
model which assumed unlimited supplies of agricultural labor. The closed economy
perspective was also important in the early dual economy model developed by Fei and Ranis
(1965).
An assumption implicit in much of this early thinking was that farmers were not very
responsive to price incentives. This assumption was first challenged by T.W. Schultz (1964).
He argued that farmers in developing countries were ‘poor but efficient’. He believed that
farm output would respond positively to improved incentives, and suggested there would be
high returns from removing price distortions and boosting public investment in rural public
goods, both physical (e.g. transport and communications infrastructure) and human (e.g. rural
health and education, agricultural R&D).
By the late 1960s, comprehensive empirical evidence of the huge extent of the
distortions to incentives associated with manufacturing protectionism in developing countries
emerged (Little, Scitovsky and Scott 1970, Balassa and Associates 1971).It was already clear
that much faster industrial and overall economic growth was occurring in the few cases where
import-substituting industrialization had been replaced by a more open-economy strategy
(notably in East Asia). Development economists gradually abandoned their former support
for intervention in favor of freer trade, but it took other developing countries a decade to heed
the policy lessons of South Korea and Taiwan’s change of industrial strategy.
Meanwhile, those two densely populated Asian economies, like Europe and Japan
before them, worried that industrialization was eroding their former agricultural comparative
advantages and causing farm household incomes to lag behind incomes in the rapidly
growing cities. Their policy responses did not focus on ways of boosting farmer productivity;

3
instead they focused on increasingly protecting farmers from import competition (Anderson,
Hayami and Others 1986). This occurred despite the clear arguments and evidence presented
by D. Gale Johnson in his seminal 1973 book, World Agriculture in Disarray, on the costly
national economic folly and the international public ‘bads’ – in the form of lower and more
volatile international agricultural prices – that such a policy development entails.
Evidence of evolving distortions to agricultural incentives
When in the early years of the 20th century Japan switched from being a small net exporter of
food to becoming dependent on rice imports, farmers and their supporters called for rice
import controls. These calls were matched by equally vigorous calls from manufacturing and
commercial groups for unrestricted food trade, since at that time the price of rice was a major
determinant of real wages in the non-farm sector. These heated debates were not unlike those
that led to the repeal of the Corn Laws in Britain six decades earlier. In Japan, however, the
forces of protection triumphed, and from 1904 a tariff was imposed on rice imports. The tariff
gradually increased, raising the price of domestic rice to more than 30 per cent above the
import price during World War I. When there were food riots because of shortages and high
rice prices just after the war, the Japanese government's response was not to reduce protection
but instead to extend it to its colonies and to shift from a national to an imperial rice self-
sufficiency policy. This policy involved accelerated investments in agricultural development
in the colonies of Korea and Taiwan behind an ever-higher external tariff wall that, by the
latter 1930s, had driven imperial rice prices to more than 60 per cent above those in
international markets (Anderson and Tyers 1992).
After post-war reconstruction, Japan continued to raise its agricultural protection, just
like Western Europe did, but to even higher levels. Domestic prices for grains and livestock
products exceeded international market prices by around 40 per cent in the 1950s in both
Japan and the European Community. By the 1980s the difference for Japan was 90 per cent,
and since the 1990s it has been above 120 per cent.
Meanwhile, in South Korea and Taiwan, an import-substituting industrialization
strategy was adopted in the 1950s. Its replacement in the early 1960s with a more-neutral
trade policy stimulated very rapid export-oriented industrialization. But the new trade policy
imposed competitive pressure on the farm sector. Just as had happened in Japan decades

4
earlier, this increased pressure prompted farmers to successfully lobby for ever-higher levels
of agricultural import protection.
Measurement methodology
To gauge how changes in incentives in Northeast Asia compare with those of other
developing countries, it is helpful to draw on time series evidence from a recent World Bank
study which covers 75 countries and five decades of policy experience (Anderson and
Valenzuela 2008, summarized in Anderson 2009). This study reports nominal rates of
assistance (NRAs), defined as the percentage by which government policies have raised gross
returns to farmers above what they would be without the government’s intervention (or the
percentage by which government policies have lowered returns, if NRA is less than zero). If a
trade measure is the sole source of government intervention, then the measured NRA will
also be the consumer tax equivalent (CTE) rate at that same point in the value chain. But
where there are also domestic producer or consumer taxes, or subsidies, the NRA and CTE
will not be equal; due to trade measures at least one of them will be different from the price
distortion at the border. Both NRA and CTE are expressed as a percentage of the undistorted
price. Each industry is classified either as import-competing, or a producer of exportables, or
as producing a nontradable. Weighted averages are calculated for both groups of tradables.
Any non-product-specific distortions, including distortions to farm input prices, are also
added into the estimate for the overall sectoral NRA for agriculture.
The NRA estimates cover on average products that make up between two-thirds and
three-quarters of the gross value of Asian farm production at undistorted prices. Authors of
the country case studies also provide ‘guesstimates’ of the NRAs for non-covered farm
products. Weighted averages for all agricultural products are then generated, using as weights
the gross values of production at unassisted prices. For countries that also provide non-
product-specific agricultural subsidies or taxes (assumed to be shared on a pro-rata basis
between tradables and nontradables), such net assistance is then added to product-specific
assistance to get a NRA for total agriculture (and also for tradable agriculture for use in
generating the Relative Rate of Assistance, defined below).
Farmers are affected not just by the prices of their own outputs but also by those of
nonagricultural producers. In other words, it is relative prices and hence relative rates of
government assistance that affect producer incentives. More than seventy years ago Lerner
(1936) provided his Symmetry Theorem proving that in a two-sector economy, an import tax

5
has a similar effect to an export tax. This carries over to a model that also includes a third
sector producing only nontradables, to a model with imperfect competition. The model holds
regardless of the economy’s size (Vousden 1990, pp. 46-47). If one assumes that there are no
distortions in the markets for nontradables and that the value shares of agricultural and non-
agricultural nontradable products remain constant, then the economy-wide effect of
distortions to agricultural incentives can be captured by the extent to which the tradable parts
of agricultural production are assisted or taxed relative to producers of non-farm tradables.
By generating estimates of the average NRA for non-agricultural tradables, it is then possible
to calculate a Relative Rate of Assistance, RRA, defined in percentage terms as:
RRA = 100[(1+NRAagt/100)/(1+NRAnonagt/100) – 1]
where NRAagt and NRAnonagt are the weighted average percentage NRAs for the tradable
parts of the agricultural and non-agricultural sectors, respectively. Since the NRA cannot be
less than -100 percent if producers are to earn anything, neither can the RRA (assuming
NRAnonagt is positive). And if both of those sectors are equally assisted, RRA is zero. This
measure is useful in that if it is below zero, it provides an internationally comparable
indication of the extent to which a country’s policy regime has an anti-agricultural bias, and
conversely when it is above zero (Anderson et al. 2008).1
In summarizing the pertinent empirical findings from theWorld Bank study, it is
helpful to begin with NRA estimates for the farm sector and then turn to RRA estimates for
Asia compared with similar estimates for other regions.
NRA estimates for Asian agriculture
From the mid-1950s to the early 1980s, agricultural price and trade policies reduced earnings
of farmers in developing Asia by an average of more than 20 per cent. From the early 1980s
price and trade policy changed, however, and from the mid-1990s the previously negative
average NRA became positive.
That average hides considerable diversity within the region, however. Nominal
assistance to farmers in Korea and Taiwan was positive from the early 1960s (although very
1In calculating the NRA for producers of agricultural and non-agricultural tradables, the methodology sought to include distortions generated by dual or multiple exchange rates. Such direct interventions in the market for foreign currency were common in some Asian countries, including China in the 1970s and 1980s. However, authors of some of the focus country studies had difficulty finding an appropriate estimate of the extent of this distortion, so the impact on NRAs has not been included in every country. The estimated (typically) positive NRAs for importables and (typically) negative NRAs for exportables in the countries in the excluded distortions means that the estimates in this data are smaller than they should be.

6
small initially when compared with the 40+ percent in Japan). Indonesia had some years in
the 1970s and 1980s when its NRA was a little above zero (as did Pakistan prior to
Bangladesh becoming an independent country in 1971). India and the Philippines’ average
NRAs became positive in the 1980s (Table 1).
This trend is present for the vast majority of the commodity NRAs for the region too,
with meat and milk the only products whose assistance rates were cut over the period. As is
true for other regions, assistance was highest for the ‘rice pudding’ products of sugar, milk
and rice. But even for those three products countries have diverse NRAs, with 5-year
averages ranging from almost zero to as much as (in the case of Korea) 400 percent for rice
and 140 percent for milk, and to 230 percent for sugar in the case of Bangladesh. There is
also a great deal of NRA diversity across commodities within each Asian economy’s farm
sector, the extent of which (measured by the standard deviation) has grown rather that
diminished over the past five decades, from a regional average of less than 40 percent in the
early years under study to more than 55 percent in recent years (see bottom row of Table 1).
This suggests that there is still much that could be gained from improved resource
reallocation both between Asian economies and within the agricultural sector of individual
Asian economies, were differences in rates of assistance to be reduced.
A striking feature of the distortion pattern within the farm sector is its strong anti-
trade bias. This is evident in Figure 1, which depicts the region’s average NRAs for
agriculture’s import-competing and export sub-sectors: the NRA average for import-
competing sub-sectors is always positive and its trend is upward-sloping, whereas the NRA
average for exportables is negative and did not rise until the 1980s, after which it gradually
approached zero. For the region as a whole the gap between these two sub-sector’s NRAs has
diminished little since the 1960s, but this obscures the fact that the gap has narrowed
somewhat in several countries (Malaysia, Thailand, Pakistan, Sri Lanka).
Assistance to Asia’s non-farm sectors and relative rates of assistance
Anti-agricultural biases extended beyondagricultural policy. The significant reductions in
border protection for the manufacturing sector (the dominant kind of intervention in the
tradables part of non-agricultural sectors) have also been an important factorchanging the
incentives affecting inter-sectorally mobile resources. The reduction in assistance to
producers of non-farm tradables has improved farmer incentives more than the reduction in
the direct taxation of agricultural industries did.
7
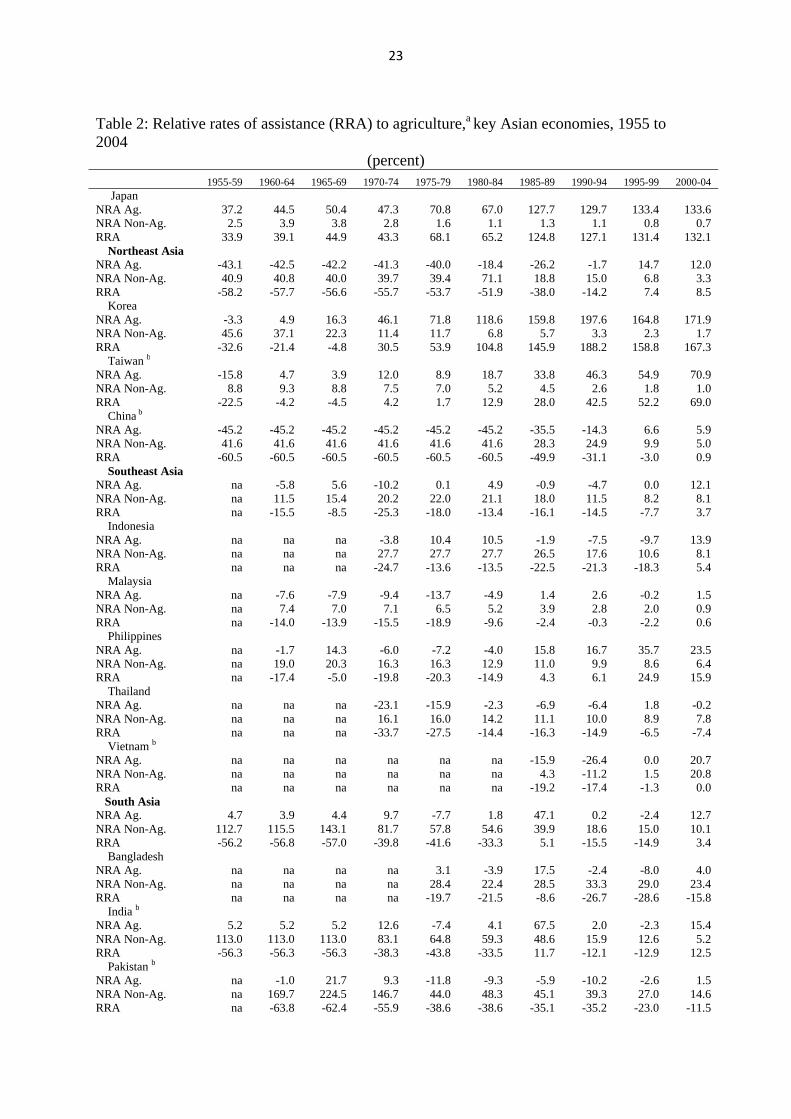
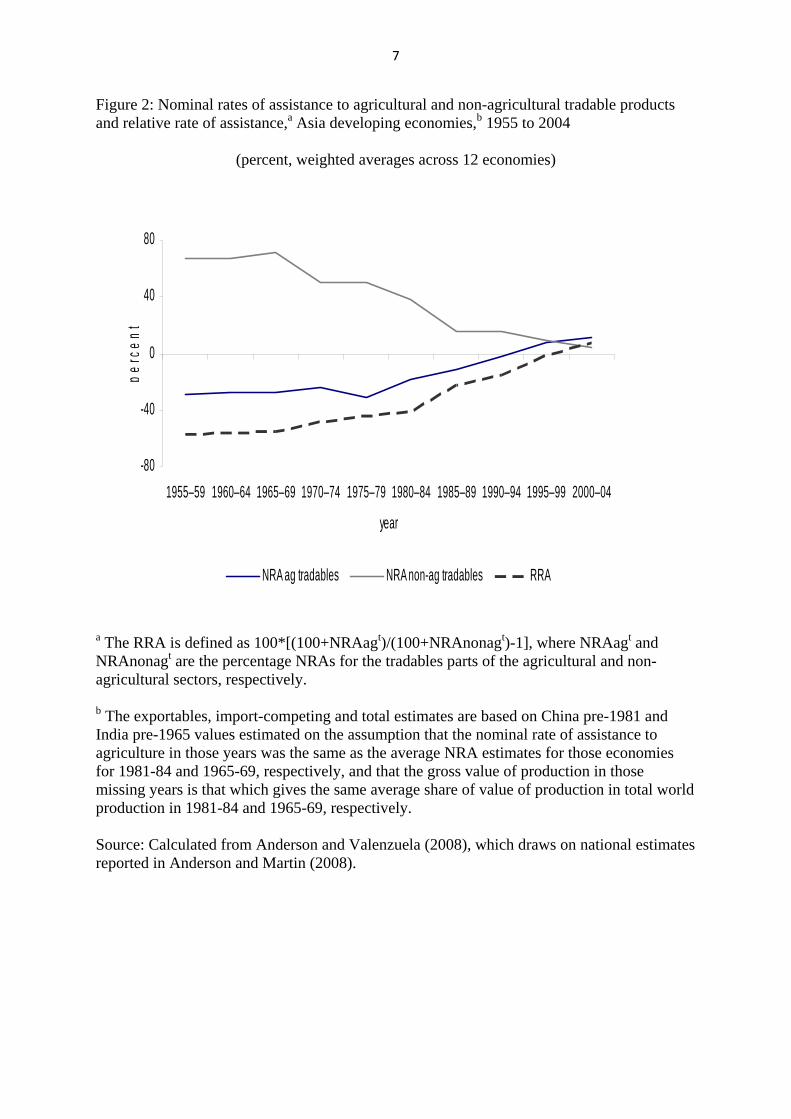
The NRA estimates for non-farm tradables are very sizeable prior to the 1990s. For
Asia as a whole, the average NRA value has steadily declined over the past four or five
decades as policy reforms have spread. This has contributed to a decline in the estimated
negative relative rate of assistance for farmers: the weighted average RRA was worse than -
50 percent up to the early 1970s but improved to an average of -32 percent in the 1980s, -9
percent in the 1990s. It is now positive, averaging 7 percent in 2000-04. The five-decade
trends in RRAs and their two component NRAs for each economy are reported in Table 2. It
is clear from Figure 2 that the rise of the RRA in Asia has been caused more by the decline in
positive NRAs for non-farm producers, than by the gradual reduction in negative NRAs for
farmers due to agricultural policy reforms.
Has the international location of production of farm products within Asia become
more or less efficient as a result of policy changes over the past five decades? A global
computable general equilibrium model with a time series of databases is needed to answer
that question. But one very crude way of addressing the question is to examine the standard
deviation of RRAs across the economies of the region over time. This indicator suggests that
distortions have become more dispersed across countries over time: it averaged 35 percent
over 1960-74, 50 percent over 1975-89 and 55 percent over 1990-2004 (see the final row of
Table 2).
Of all the striking changes in RRAs over the past two decades, it is the move from
negative to positive RRAs in China and India that matters most for the region – and indeed
for the world. The extent of the decline in the non-agricultural NRA since the early 1980s is
very similar for these two key countries, but the agricultural NRAs are different: in China the
5-year averages have risen steadily from -45 percent to 6 percent, whereas in India averages
have been close to zero except for a upward spike in the mid-1980swhen international food
prices collapsed, and a rise in the present decade.
This dramatic rise in the RRA for the world’s two most populous countries is of great
significance in understanding the causes of this decade’s international food price rises. One of
the contributors of this rise is said to be the China and India’s growing appetite for food
imports as they industrialize and their per capita incomes rise. Yet both countries have
remained very close to self-sufficient in agricultural products over the past four decades.
Undoubtedly the steady rise in China and India’s RRAs has contributed to this outcome. It
may also have helped ensure that the trend in China’s ratio of urban to rural mean incomes
(adjusted for cost of living differences) has been flat since 1980 (Ravallion and Chen 2007,

8
Figure 3), and that the Gini coefficient for India has hardly changed between 1984 and 2004
(World Bank 2008). A major question, to which we return at the end of the chapter, is: will
China and India’s RRAs remain at their current neutral level, close to zero, or will they
continue to rise in the same way as observed in Korea and Taiwan and, before them, in Japan
and Western Europe?
Comparisons with other regions
The upward shift towards zero in agricultural NRAs and the RRAs, and even the recent move
to positive agricultural NRAs and RRAs, are not unique to Asia. Figure 3 shows that similar
effects, albeit less pronounced, have resulted from policy reforms in other developing country
regions over the past four decades, suggesting that similar political economy trends might be
at work. In the past it has been found that agricultural NRAs and RRAs are positively
correlated with per capita income and agricultural comparative disadvantage (Anderson 1995,
2010). A glance at the above tables suggests that Asian economies continue to fit that trend.
This is confirmed statistically in the multiple regressions with country and time fixed effects
shown in Table 3.
The role of agricultural policies in stabilizing domestic prices
An often-stated objective of food policies in Asia and elsewhere is to reduce fluctuations in
both domestic food prices and in the quantities of food available for consumption. Nowhere
is this more obvious than in the case of rice. Countries often vary their trade barriers to buffer
against domestic or international shocks in the price of rice, foregoing the more beneficial
options of using trade as a source of cheaper imports, or of using the opportunity of high rice
prices to generate export earnings. Since Asia produces and consumes four-fifths of the
world’s rice (compared with about one-third of the world’s wheat and corn), Asian policy
makers’market-insulating behavior means that by 2000-4 only 6.9 percent of global rice
production was traded internationally2 (compared with 14 and 24 percent for maize and
wheat), and so international prices are much more volatile for rice than for those other grains.
This in turn means that nominal rates of protection for rice would be above trend in years of
low international prices and below trend in years when international prices for rice are
2 This was up from the pre-1990s half-decade global shares which are all less than 4.5 percent (e.g., 4.1 percent in 1985-89), and is greater than the Asian share of just 5.7 percent in 2000-04, according to the project’s database (Anderson and Valenzuela 2008).

9
high.Figure 4 reveals that this indeed is the case. Even when averaged over all key countries
in Southeast or South Asia, the negative correlation between the rice NRAs and the
international rice price is very high, at -0.59 for Southeast Asia and -0.75 for South Asia.
Similarpatterns of intervention affect many other farm products, which raises the
question of the extent to which such policies stabilize domestic prices relative to international
prices. Anderson and Nelgen (2011) explore this for the full sample of products and
developing countries in the Anderson and Valenzuela (2008) database. They find that
governments seem to have succeeded in stabilizing prices more in Asia than in Africa or
Latin America, but that even in Asia the degree of stabilization achieved is modest (Table
4).Yet the combined actions of such beggar-thy-neighbor policies is to destabilize
international prices.If every country desisted from insulating their domestic markets, it is
conceivable that international prices would become sufficiently stable so that no intervention
would be felt necessary by national governments.
Policy costs and consequences for inequality and poverty
Anderson, Valenzuela and van der Mensbrugghe (2010) use the World Bank’s global
Linkage model (van der Mensbrugghe 2005) to assess the effects of the world’s agricultural
and trade policies as of 2004 on individual countries and country groups. This model uses the
distortion estimates summarized above for developing country agriculture, and otherwise
uses the standard GTAP protection estimates for that year. This model provides the basis for
estimations of the effects of rest-of-world policies on the import and export prices and
demand for the various exports of any one developing country in a series of country case
studies detailed in Anderson, Cockburn and Martin(2010), summarized below.
The Linkage model results suggest that developing countries would gain nearly twice
as much as high-income countries in welfare terms if 2004 agricultural and trade policies
were removed globally (an average welfare increase of 0.9 percent, compared with
0.5 percent for high-income countries). In this broad conception of the world as just two large
country groups, global reform would reduce international inequality. The results vary widely
across developing countries, however: India would suffer some slight losses, and some Sub-
Saharan African countries would suffer exceptionally large adverse terms of trade changes.
The Linkage study also finds that net farm incomes in developing countries would rise by 5.6
percent, compared with 1.9 percent for non-agricultural value added, if those policies were

10
eliminated. This suggests that inequality between farm and nonfarm households in
developing countries would fall. By contrast, in high-income countries net farm incomes
would fall by 15 percent on average, compared with a slight rise for real non-farm value
added. That is, inequality between farm households in developing countries and those in
high-income countries would fall substantially. If only agricultural policies were removed,
these results would not change much (see columns 2 and 3 of Table 5). This underscores the
large magnitude of the distortions from agricultural, as compared with non-agricultural,
trade-related policies.
The Linkage study also reports that unskilled workers in developing countries – the
majority of whom work on farms – would benefit most from reform (followed by skilled
workers and then capital owners). The average change in the real unskilled wage across
developing countries would rise by 3.5 percent. However, the most relevant consumer prices
for poor people relate to food and clothing. This includes those many poor farm and other
rural households who earn most of their income from their labor and are net buyers of food.
Hence deflating by a food and clothing price index rather than the aggregate CPI provides a
better indication of the welfare change for those workers. As shown near the bottom of the
final column of Table 6, for all developing countries the real unskilled wage across
developing countries would rise by 5.9 percent with that deflator. That is, inequality between
unskilled wage-earners and the much wealthier owners of capital (human or physical) within
developing countries would fallwith full trade reform.
To explicitly assess the likely impacts of trade policy reform on poverty using the
Linkage model requires using an elasticities approach. This involves taking the estimated
impact on average real household incomeand applying an estimated income to poverty
elasticity to estimate the impacts on the poverty headcount index for each country. The
authors focus on the change in the average wage of unskilled workers deflated by the food
and clothing CPI, and assume those workers are exempt from the direct income tax imposed
to replace the lost customs revenue following trade reform (a realistic assumption for many
developing countries). Under their full merchandise trade reform scenario, there would be 2.7
percent fewer people living on less than US$1 a day in developing countries. The
proportional reduction is much higher in China and in Sub-Saharan Africa, each falling
around 4 percent. It is even higher in Latin America (7 percent) and in South Asia excluding
India (10 percent). By contrast, the number of extreme poor in India is estimated to rise by 4

11
percent.3 Under the more moderate definition of poverty – people living on no more than
US$2 per day – the number of poor in developing countries would fall by nearly 90 million
compared to an aggregate baseline level of just under 2.5 billion in 2004, or by 3.4 percent
(notwithstanding the number in India below $2 a day still increasing, but by just 1.7 percent).
Hertel and Keeney (2010), drawing on the widely used global economy-wide model
of the Global Trade Analysis Project (GTAP), adopt the same price distortions as Anderson,
Valenzuela and van der Mensbrugghe (2010), and run the same scenarios, but generate more-
explicit poverty effects for a sample of 15 developing countriesfor which they have detailed
household survey data.This multi-country study covers five Asian countries (Bangladesh,
Indonesia, Philippines, Thailand, and Vietnam), as well as four African countries (Malawi,
Mozambique, Uganda, and Zambia), and six Latin American countries (Brazil, Chile,
Colombia, Mexico, Peru, and Venezuela). Overall, the study concludes that removing current
farm and trade policies globally would tend to reduce poverty, primarily via agricultural
reforms (Table 7). The unweighted average for all 15 developing countries is a headcount
decline in extreme poverty (<$1 a day) of 1.7 percent. The average fall for the Asian sub-
sample is twice that, however – and it is in Asia where nearly two-thirds of the world’s
extremely poor people live (although their sample did not include China and India). These
GTAP model results are close to the Linkage model results summarized above.
The final column of Table 7 reports the percentage change in the national poverty
headcount when the poor are not subject to the income tax rise required to replace the trade
tax revenue lost following trade reform. This assumption represents a significant implicit
income transfer from non-poor to poor households and thus generates a marked difference in
the predicted poverty alleviation. Trade reforms go from being marginally poverty-reducing
in most of the 15 cases to being considerably poverty-reducing in all cases. In this scenario
reform reduces the poverty rate by roughly one-quarter in Thailand and Vietnam, for
example. Overall, the regional and total average extent of poverty alleviation is around four
times larger in this scenario than when scenario in which the poor are levied with income
taxes to replace lost trade tax revenue. The unweighted average poverty headcount reduction
for the three regions shown in the final column of Table 7 are remarkably similar to the
population-weighted averages from the Linkage model with a similar tax-replacement
3 The rise in India is partly because of the removal of the large subsidies and import tariffs that assist Indian
farmers, and partly due to the greater imports of farm products raising the border price of those imports.

12
assumption: the latter’s 17 percent for Asia excluding China and India and 6.4 percent for
Latin America are just slightly above the GTAP model’s 14 percent and 5.7 percent.
Anderson, Cockburn and Martin (2010) also report results from ten more-detailed
individual country case studies and compare these with the above results from global models.
Like the global models, these individual country case studies focus on price-distorting
policies as of 2004, but they include more sectoral and product disaggregation than the global
models and consider multiple types of households and types of labor. The national results for
real GDP and household consumption suggest that GDP would increase from full global trade
reform in all ten countries, but only by 1 or 2 percent. Given falling consumer prices, real
household consumption would increase by considerably more in most cases. Generally these
numbers are a little larger than those generated by the global Linkage model, but they are
generally much lower than would be the case had the authors used dynamic models. They
therefore share the feature of the global models of underestimating the poverty-alleviating
benefits of trade reform, given the broad consensus that trade liberalization increases
economic growth, which is in turn a major contributor to poverty alleviation.
The comparative Tables 8 and 9 summarize the national results for the incidence of
extreme poverty and income inequality, respectively, resulting from own-country, rest-of-
world or global full liberalization of agricultural or all goods trade. One should not
necessarily expect the unweighted averages of the poverty results for each region to be
similar to those generated by Hertel and Keeney (2010), but for comparative purposes the
latter’s unweighted averages of national poverty effects for each of the key developing
country regions are reported in brackets in the last 4 rows of Table 8(c).
Global agricultural liberalization and non-agricultural liberalization reduces poverty
in all countries studied, with the exception of the Philippines (Table 8(c)). When all
merchandise trade is liberalized, the reduction ranges from close to zero to about 3.5
percentage points, except for Pakistan where it is more than 6 points. On average nearly two-
thirds of the alleviation is due to non-farm trade reform. On average the contribution of own-
country reforms to the reduction in poverty appears to be equally important as rest-of-world
reform, although there is some considerable cross-country divergence in the extent of this for
both farm and non-farm reform.
In parts (a) and (b) of Table 8, poverty alleviation is sub-divided into rural and urban
sources. In every case rural poverty is reduced much more than urban poverty. This is true for
both farm and non-farm trade reform, and for own-country as well as rest-of-world reform.

13
Since the rural poor are much poorer on average than the urban poor, this would lead one to
expect trade reform to also reduce inequality. That is indeed what the results at the bottom of
Table 9(c) show for this sample of countries: inequality declines in all three developing
country regions following full trade liberalization of either all goods, or just agricultural
products, and for both own-country and rest-of-world reforms. The effect of non-farm trade
reform on its own is more mixed, providing another reason to urge trade negotiators not to
neglect agricultural reform in trade negotiations. Rest-of-world and global agricultural reform
both lead to a reduction in inequality in every country in the sample except Thailand (and the
Philippines slightly for global reform). Non-farm global reform increases inequality slightly
in three countries. In the case of Indonesia, the inequality-increasing impact of non-farm
reform more than offsets the egalitarian effect of farm trade reform, whereas both types of
reform increase inequality in the case of the Philippines and Thailand.
Inequality within rural or urban household groupings are not altered very much by
trade reform compared with overall national inequality (compare parts (a) and (b) with part
(c) of Table 9). This underlines the point that trade reform would tend to reduce urban-rural
inequality predominantly rather than inequality within regions.
Several national studies investigate the possible impacts of reforms that could
potentially complement trade reforms, most notably approaches to dealing with the
elimination of trade tax revenues. If these revenues can be recouped through taxes that do not
bear on the poor, reform would reduce poverty even more. The China study focuses on the
vitally important issue of reducing the barriers to migration out of agriculture, by improving
the operation of land markets and reducing the barriers to mobility created by the hukou
system. These measures, and international trade liberalization that increases China’s market
access, are found to reduce poverty so much that a combination of these measures would
benefit all major household groups.
In summary, the benefits for the world’s poor from the full liberalization of global
merchandise trade would come more from agricultural than non-agricultural reform; and,
within agriculture, more from the removal of substantial support provided to farmers in
developed countries than from developing country policy reform. According to the economy-
wide models used in AndersonCockburn and Martin (2010), such reform would raise the real
earnings of unskilled workers in developing countries, most of whom work in agriculture.
Their earnings would rise relative to both unskilled workers in developed countries and other
income earners in developing countries. This would thus reduce inequality both within

14
developing countries and between developing and developed countries, in addition to
reducing poverty. The studies all find global trade liberalization to be poverty alleviating,
regardless of whether the reform involves only agricultural goods or all goods, with the
benefit to developing countries coming roughly equally from reform at home and abroad.
They also find that rural poverty would be cut much more than urban poverty in all cases.
Policy implications
These empirical findings have a number of policy implications. First and foremost, the
attractive poverty and inequality alleviating effects of unilateral and multilateral trade policy
reforms provide yet another argument for countries to seek further liberalization of national
and world markets. The potential benefits are generally much greater for global reform than
from just own-country reform. In the Indonesia study, for example, unilateral trade
liberalization is expected to reduce poverty only very slightly, but global liberalization is
expected to lower poverty substantially. In the Philippines, domestic reform alone may
marginally increase poverty rates, whereas the benefits of rest-of-world liberalization would
almost fully recover these losses (and in the case of just agricultural reform, the Philippines
would in fact benefit).The results of this set of studies also show that the winners from trade
reform would overwhelmingly be found among the poorer countries and the poorest
individuals within these countries. However, it is also clear that even among the extreme
poor, some will lose out. Hence the merit of compensatory policies, ideally ones that focus
not on private goods but rather on public goods that reduce under-investments in pro-growth
factors such as rural human capital.
Second, the strongest prospective benefits come from agricultural reform. This
underscores the economic and social importance of securing reforms for the agricultural
sector, notwithstanding the political sensitivities involved. There are more-direct and hence
more-efficient domestic policy instruments that could meet government’s poverty and hunger
Millennium Development Goals than trade policies, but generally they are more of a net drain
on treasury finances. This is particularly true for governments of low-income countries which
still rely heavily on trade tax revenue. One solution for this is to expand aid-for-trade funding
as part of official development assistance programs.
Third, most of the national case studies show that domestic reform on its own can be a
way of reducing poverty and inequality. This suggests that developing countries should not

15
hold back on domestic reforms while negotiations in the World Trade Organization’s Doha
Round and other international accords continue. It also suggests that from a poverty
alleviating perspective, developing countries have little to gain, and potentially much to lose,
from negotiating exemptions or delays in national reforms in the framework of WTO
multilateral agreements.
Most commentators believe that Asia’s developing economies will keep growing
rapidly in the foreseeable future provided they remain open and continue to practice good
macroeconomic governance. Their growth is expected to be more rapid in manufacturing and
service activities than in agriculture. In the more densely populated economies of the region,
the growth in labor-intensive exports will be accompanied by rapid increases in the per capita
incomes of low-skilled workers. Agricultural comparative advantage is thus likely to decline
in these economies (Anderson and Strutt 2011). Whether these economies become more
dependent on imports of farm products depends, however, on what happens to their RRAs.
The first wave of Asian industrializers (Japan, and then Korea and Taiwan) chose to slow the
growth of food import dependence by raising their NRA for agriculture even as they were
bringing down their NRA for non-farm tradables, so that their RRA became increasingly
above the neutral zero level. A key question is: will later industrializers follow suit, given the
past close association of RRAs with rising per capita income and falling agricultural
comparative advantage?
The progress of lower-income countries relative to first industrializers can be found
by mapping the RRAs for Japan, Korea and Taiwan against real per capita income, and
superimposing a graph of the RRAs for lower-income economies onto this. Figure 4 does this
for China and India, and shows that China and India’s RRA trends over the past three
decades are the same as those of richer Northeast Asian countries. True, the earlier
industrializers were not bound under GATT to not raise their agricultural protection: had
there been strict discipline on farm trade measures at the time Japan and Korea joined GATT
in 1955 and 1967, their NRAs may have been capped at less than 20 percent. At the time of
China’s accession to WTO in December 2001, its NRA was less than 5 percent according to
the Anderson and Valenzuela (2008) database, or 7.3 percent for just import-competing
agriculture. Its average bound import tariff commitment was about twice that (16 percent in
2005), but what matters most is China’s out-of-quota bindings on the items whose imports
are restricted by tariff rate quotas. The latter tariff bindings as of 2005 were 65 percent for
grains, 50 percent for sugar and 40 percent for cotton (WTO, ITC and UNCTAD 2007, p.

16
60). China also has bindings on farm product-specific domestic supports of 8.5 percent, and
can provide another 8.5 percent as non-product specific assistance if it so wishes – a total of
17 percent NRAfrom domestic support measures alone, in addition to what is available
through out-of-quota tariff protection (Anderson, Martin and Valenzuela 2010). Thus the
legal commitments on Chinaare far from the current levels of domestic and border support for
Chinese farmers, and so are unlikely to constrain the government very much in the next
decade or two.
There are even weaker constraints on Asian developing countries that joined the WTO
earlier. The estimated NRAs for agricultural importables in 2000-04 of India, Pakistan and
Bangladesh, for example, are 34, 4 and 6 percent, respectively, whereas the average bound
tariffs on their agricultural imports are 114, 96 and 189 percent, respectively (WTO, ITC and
UNCTAD 2007). Also, like other developing countries, these countries have high bindings
on product-specific domestic supports of 10 percent and another 10 percent for non-product
specific assistance, a total of 20 more percentage points of NRA that legally could come from
domestic support measures – compared with currently 10 percent being applied in India and
less than 3 percentin the rest of South Asia.
One can only hope that China and South and Southeast Asia will not make use of the
legal wiggle room they have allowed themselves in their WTO bindings and follow Japan,
Korea and Taiwan into high agricultural protection. A much more efficient and equitable
strategy would be to instead treat agriculture in the same way they have been treating non-
farm tradable sectors. That would involve opening the sector to international competition,
relying on more-efficient domestic policy measures for raising government revenue (e.g.,
income and consumption or value-added taxes), and to assist farm families (e.g., public
investment in rural education and health, rural infrastructure, and agricultural research).4
What do these lessons suggest that developing country policymakers should do when
confronted, as in recent years, with a sharp upward movement in international food prices? In
the past, as illustrated for rice in Figure 4, many governments have simply either increased
their export restrictions or lowered their import restrictions on food staples for the duration of
4See Fan and Hazell (2001) and Fan (2008). Even if just one-twentieth of the current NRA provided to Asian farmers via farm price-support policies was replaced by agricultural R&D expenditure, that would more than double current public spending on R&D – and the latter would increase regional economic welfare whereas price-distortionary policies reduce it (Anderson and Martin (2010, Ch. 1). Such a boost to Asian R&D could generate another green revolution of the same order of magnitude of the one in the 1960s, especially if it took full advantage of the new developments in biotechnology (as shown for rice, for example, in Anderson, Jackson and Nielsen 2005).

17
the spike. Such responses are undesirable because, collectively, they are not very effective in
stabilizing domestic prices, and not least because they add to international price volatility by
reducing the stabilizing role that trade between nations can play for the world food market.
That adverse effect will become ever more important as climate change increases the
frequency of extreme weather events.
There is considerable scope for improvement in national policy responses to price
spikes. If price-stabilizing interventions in poor countries are justified by underdeveloped
credit markets, or because credit markets are inefficient due to local monopoly lenders, the
first-best policy response is to improve the credit market. The same is true for markets for
futures and options (Sarris, Conforti and Prakash 2010). More generally, where domestic
markets are underdeveloped, there can be a high payoff from investing more in efficient
institutional arrangements (for such things as contract enforcement and market information
services) and in infrastructure (transport, communications), as well as ensuring a level
playing field in terms of incentives (Byerlee, Jayne and Myers 2006). Holding national public
grain stocks is more problematic, not only because it crowds out private stockholding but also
because bureaucrats are typically less likely than private firms to buy and sell optimally.
A price spike is but one of many situations in which an economic change
disadvantages some households. There is a strong case for developing better social safety net
policies that can offset the adverse impacts of a wide range of different shocks on poor people
– who are net sellers as well as net buyers of food – without imposing the costly by-product
distortions that necessarily accompany nth-best trade policy instruments. A program of
targeted income supplements to only the most vulnerable households, and only while the
price spike lasts, is possibly the lowest-cost intervention. It is often claimed that such
payments are unaffordable in poor countries, but the information and communication
technology revolution has made it possible for conditional cash transfers to be provided as
direct assistance to even remote and small households, and even to the most vulnerable
members of those households (typically women and their young children – see, e.g., Fiszbein
and Schady (2009), Adato and Hoddinott (2010) and Skoufias, Tiwari and Zaman (2010)).
There is also scope for governments to multilaterally agree to stop intermittently
intervening in these ways. In the current Doha round of WTO negotiations there are
proposals to phase out agricultural export subsidies as well as to reduce import tariff
bindings, both of which would contribute to global economic welfare and more stable
international farm product prices. At the same time, however, developing countries have

18
added a proposal to the WTO’s Doha agenda for a Special Safeguards Mechanism (SSM) that
would allow those countries in the event of a sudden international price rise or an import
surge to raise their import barriers above their bindings for a significant proportion of
agricultural products. This is the opposite of what is needed to reduce the frequency and
amplitude of food price spikes (Hertel, Martin and Leister 2010). Moreover, proposals to
broaden the Doha agenda to introduce disciplines on export restraints have struggled to gain
traction.
Could greater supply assurances from food-surplus countries in the form of stronger
disciplines on export restrictions provide a Doha breakthrough? Potentially it could reduce
the need for an SSM, which has been one of the more contentious issues in the Doha talks
and the one that triggered their suspension in mid-2008. But more than that, it could reduce
the general concerns Asia’s food-deficit countries have on relying on food imports, thereby
increasing the chances of lowering not only the variance of but also the mean NRAs of those
countries.
References
Adato, M. and J. Hoddinott, editors. 2010. Conditional Cash Transfers in Latin America.
Baltimore: Johns Hopkins University Press for IFPRI.
Anderson, K. 1995. ‘Lobbying Incentives and the Pattern of Protection in Rich and Poor
Countries.’ Economic Development and Cultural Change 43(2): 401-23 January.
Anderson, K., editor. 2009.Distortions to Agricultural Incentives: A Global Perspective,
1955-2005. London: Palgrave Macmillan and Washington DC: World Bank.
Anderson, K., editor. 2010. The Political Economy of Agricultural Price Distortions.
Cambridge and New York: Cambridge University Press.
Anderson, K., J. Cockburn and W. Martin, editors. 2010.Agricultural Price Distortions,
Inequality and Poverty. Washington DC: World Bank.
Anderson, K., Y. Hayami and others. 1986. The Political Economy of Agricultural
Protection: East Asia in International Perspective. London: Allen and Unwin.
Anderson, K., L.A. Jackson and C.P. Nielsen. 2005. ‘GM Rice Adoption: Implications for
Welfare and Poverty Alleviation.’ Journal of Economic Integration 20(4): 771-88
December.
19
Anderson, K., M. Kurzweil, W. Martin, D. Sandri and E. Valenzuela. 2008. ‘Measuring
Distortions to Agricultural Incentives, Revisited.’ World Trade Review 7(4): 675–704.
Anderson, K. and W. Martin, editors. 2008. Distortions to Agricultural Incentives in Asia.
Washington DC: World Bank.
Anderson, K., W. Martin and E. Valenzuela. 2009. ‘Long Run Implications of WTO
Accession for Agriculture in China.’ In China's Agricultural Trade: Issues and
Prospects, edited by I. Sheldon. St Paul MN: International Agricultural Trade
Research Consortium.
Anderson, K. and S. Nelgen. 2011. ‘Trade Barrier Volatility and Agricultural Price
Stabilization.’ World Development 40(1): 36-48, January.
Anderson, K. and A. Strutt. 2011. ‘Agriculture and Food Security in Asia by 2030.’
Background Paper 07 for a forthcoming book on ASEAN, China and India: A
Balanced, Sustainable, Resilient Growth Pole. Tokyo: Asian Development Bank
Institute.
Anderson, K. and R. Tyers. 1992. ‘Japanese Rice Policy in the Interwar Period: Some
Consequences of Imperial Self Sufficiency.’ Japan and the World Economy 4(2):
103-27 September.
Anderson, K. and E. Valenzuela. 2008.Global Estimates of Distortions to Agricultural
Incentives, 1955 to 2005. Data spreadsheets available from October at
www.worldbank.org/agdistortions.
Balassa, B. and Associates. 1971. The Structure of Protection in Developing Countries.
Baltimore: Johns Hopkins University Press.
Byerlee, D., T.S. Jayne and R.J. Myers. 2006. ‘Managing Food Price Risks and Instability in
a Liberalizing Market Environment: Overview and Policy Options.’ Food Policy
31(4): 275-87August.
Fan, S. 2008. Public Expenditures, Growth and Poverty in Developing Countries: Issues,
Methods and Findings. Baltimore: Johns Hopkins University Press.
Fan, S. and P. Hazell. 2001. ‘Returns to Public Investment in the Less-Favored Areas of India
and China.’ American Journal of Agricultural Economics 83(5): 1217-22.
Fei, J.C.H. and G. Ranis. 1965. Development of the Labor Surplus Economy. Homewood IL:
Richard D. Irwin.

20
Fiszbein, A. and N. Schady with F. H.G. Ferreira, M. Grosh, N. Kelleher, P. Olinto and E.
Skoufias. 2009. Conditional Cash Transfers: Reducing Present and Future Poverty.
Policy Research Report, Washington DC: World Bank.
Hertel, T.W. and R. Keeney. 2010. ‘Inequality and Poverty Impacts of Trade-related Policies
Using the GTAP Model.’ In Agricultural Price Distortions, Inequality and Poverty,
edited by K. Anderson, J. Cockburn and W. Martin.Washington DC: World Bank.
Hertel, T., W, Martin and A. Leister. 2010. ‘Potential Implications of a Special Safeguard
Mechanism in the World Trade Organization: The Case of Wheat.’ World Bank
Economic Review 24(2): 330–59.
Johnson, D.G. 1973. World Agriculture in Disarray (revised edition 1991). London: St
Martin’s Press.
Johnston, B.F. and J.W. Mellor. 1961. ‘The Role of Agriculture in Economic Development.’
American Economic Review 51(4): 566-93, September.
Lerner, A. 1936. ‘The Symmetry Between Import and Export Taxes.’ Economica 3(11): 306-
13, August.
Lewis, W.A. 1954. ‘Economic Development with Unlimited Supplies of Labour.’
Manchester School 22: 139–91.
Little, I.M.D., T. Scitovsky and M. Scott. 1970. Industry and Trade in Some Developing
Countries: A Comparative Study. London: Oxford University Press.
Prebisch, R. 1950. ‘The Economic Development of Latin America and its Principal
Problems.’ Economic Bulletin for Latin America 7.
Prebisch, R. 1959. ‘Commercial Policy in Underdeveloped Countries.’ American Economic
Review 49(2): 251-73, May.
Ravallion, M. and S. Chen. 2007. ‘China’s (Uneven) Progress Against Poverty.’ Journal of
Development Economics 82, 1-42.
Sarris, A., P. Conforti and A. Prakash. 2010. ‘The Use of Organized Commodity Markets to
Manage Food Import Price Instability and Risk.’ Agricultural Economics 42(1): 47-
64, January.
Schultz, T.W. 1964. Transforming Traditional Agriculture. New Haven: Yale University
Press.
Skoufias, E., S. Tiwari and H. Zaman. 2010. ‘Can We Rely on Cash Transfers to Protect
Dietary Diversity During Food Crises? Estimates from Indonesia.’ Policy Research
Working Paper 5548, World Bank, Washington DC, January.
21
Singer, H.W. 1950. ‘The Distribution of Gains between Investing and Borrowing Countries.’
American Economic Review 40(2): 473-85, May.
van der Mensbrugghe, D. 2005. ‘Linkage Technical Reference Document: Version 6.0.’
Unpublished, World Bank, Washington DC, January 2005. Accessible at
www.worldbank.org/prospects/linkagemodel.
Vousden, N. 1990. The Economics of Trade Protection. Cambridge: Cambridge University
Press.
World Bank. 2008. World Development Indicators, Washington DC: World Bank.
WTO, ITC and UNCTAD. 2007. World Tariff Profiles 2006. Geneva: World Trade
Organization.

22
Table 1: Nominal rates of assistance to agriculture,a key Asian economies, 1955 to 2004
(percent)
1955-59 1960-64 1965-69 1970-74 1975-79 1980-84 1985-89 1990-94 1995-99 2000-04
Japan 38.8 45.8 50.4 46.9 65.9 68.3 116.6 115.8 118.6 119.8Northeast Asia -42.8 -42.6 -41.7 -41.2 -39.5 -38.2 -25.7 -1.7 14.4 11.9Korea -3.2 4.0 13.4 35.7 56.3 89.4 126.1 152.8 129.8 137.3Taiwan -12.0 3.6 3.0 9.3 7.1 14.9 27.1 38.1 46.4 61.3Chinab -45.2 -45.2 -45.2 -45.2 -45.2 -45.2 -35.5 -14.3 6.6 5.9Southeast Asia na -6.8 5.9 -8.8 0.0 4.6 -0.4 -4.2 0.0 11.1Indonesia na na na -2.6 9.3 9.2 -1.7 -6.6 -8.6 12.0Malaysia na -7.2 -7.5 -9.0 -13.0 -4.6 1.3 2.3 -0.2 1.2Philippines na -5.3 14.4 -5.1 -7.1 -1.0 18.7 18.5 32.9 22.0Thailand na na na -20.3 -14.0 -2.0 -6.2 -5.7 1.7 -0.2Vietnam na na na na na na -13.9 -25.4 0.6 21.2South Asia 0.0 -0.5 0.6 0.4 -5.5 0.6 20.9 0.7 0.2 13.6Bangladesh na na na -16.0 1.4 -3.3 11.7 -1.5 -5.2 2.7Indiab 0.1 0.1 0.1 0.2 -5.6 1.9 24.9 1.8 0.7 15.8Pakistan na -0.7 15.3 6.8 -8.5 -6.4 -4.0 -6.9 -1.6 1.2Sri Lanka -2.3 -22.8 -24.5 -16.3 -25.5 -13.5 -9.9 -1.2 12.2 9.5Asian dev.economiesa -27.3 -26.7 -25.1 -25.3 -23.8 -20.6 -9.0 -2.0 7.5 12.0Av. dispersionc 39 37 56 42 48 51 67 56 56 64
a The weighted average includes product-specific input distortions and non-product specific assistance as well as the authors’ guesstimates for non-covered farm products, with weights based on gross value of agricultural production at undistorted prices. b The estimates for China pre-1981 and India pre-1965 assume that the nominal rates of assistance to agriculture in those years were the same as the average NRA estimates for those economies for 1981-84 and 1965-69, respectively, and that the gross value of production in those missing years is that which gives the same average share of value of production in total world production in 1981-84 and 1965-69, respectively. This set of assumptions is conservative in the sense that for both countries the average NRA was probably even lower (more negative) in earlier years. c The simple average across countries of the standard deviation of product NRAs around the weighted mean for each country each year. Source: Calculated from Anderson and Valenzuela (2008), which draws on national estimates reported in Anderson and Martin (2008).
23
Table 2: Relative rates of assistance (RRA) to agriculture,a key Asian economies, 1955 to 2004
(percent) 1955-59 1960-64 1965-69 1970-74 1975-79 1980-84 1985-89 1990-94 1995-99 2000-04 Japan NRA Ag. 37.2 44.5 50.4 47.3 70.8 67.0 127.7 129.7 133.4 133.6 NRA Non-Ag. 2.5 3.9 3.8 2.8 1.6 1.1 1.3 1.1 0.8 0.7 RRA 33.9 39.1 44.9 43.3 68.1 65.2 124.8 127.1 131.4 132.1 Northeast Asia NRA Ag. -43.1 -42.5 -42.2 -41.3 -40.0 -18.4 -26.2 -1.7 14.7 12.0 NRA Non-Ag. 40.9 40.8 40.0 39.7 39.4 71.1 18.8 15.0 6.8 3.3 RRA -58.2 -57.7 -56.6 -55.7 -53.7 -51.9 -38.0 -14.2 7.4 8.5 Korea NRA Ag. -3.3 4.9 16.3 46.1 71.8 118.6 159.8 197.6 164.8 171.9 NRA Non-Ag. 45.6 37.1 22.3 11.4 11.7 6.8 5.7 3.3 2.3 1.7 RRA -32.6 -21.4 -4.8 30.5 53.9 104.8 145.9 188.2 158.8 167.3 Taiwan b NRA Ag. -15.8 4.7 3.9 12.0 8.9 18.7 33.8 46.3 54.9 70.9 NRA Non-Ag. 8.8 9.3 8.8 7.5 7.0 5.2 4.5 2.6 1.8 1.0 RRA -22.5 -4.2 -4.5 4.2 1.7 12.9 28.0 42.5 52.2 69.0 China b NRA Ag. -45.2 -45.2 -45.2 -45.2 -45.2 -45.2 -35.5 -14.3 6.6 5.9 NRA Non-Ag. 41.6 41.6 41.6 41.6 41.6 41.6 28.3 24.9 9.9 5.0 RRA -60.5 -60.5 -60.5 -60.5 -60.5 -60.5 -49.9 -31.1 -3.0 0.9 Southeast Asia NRA Ag. na -5.8 5.6 -10.2 0.1 4.9 -0.9 -4.7 0.0 12.1 NRA Non-Ag. na 11.5 15.4 20.2 22.0 21.1 18.0 11.5 8.2 8.1 RRA na -15.5 -8.5 -25.3 -18.0 -13.4 -16.1 -14.5 -7.7 3.7 Indonesia NRA Ag. na na na -3.8 10.4 10.5 -1.9 -7.5 -9.7 13.9 NRA Non-Ag. na na na 27.7 27.7 27.7 26.5 17.6 10.6 8.1 RRA na na na -24.7 -13.6 -13.5 -22.5 -21.3 -18.3 5.4 Malaysia NRA Ag. na -7.6 -7.9 -9.4 -13.7 -4.9 1.4 2.6 -0.2 1.5 NRA Non-Ag. na 7.4 7.0 7.1 6.5 5.2 3.9 2.8 2.0 0.9 RRA na -14.0 -13.9 -15.5 -18.9 -9.6 -2.4 -0.3 -2.2 0.6 Philippines NRA Ag. na -1.7 14.3 -6.0 -7.2 -4.0 15.8 16.7 35.7 23.5 NRA Non-Ag. na 19.0 20.3 16.3 16.3 12.9 11.0 9.9 8.6 6.4 RRA na -17.4 -5.0 -19.8 -20.3 -14.9 4.3 6.1 24.9 15.9 Thailand NRA Ag. na na na -23.1 -15.9 -2.3 -6.9 -6.4 1.8 -0.2 NRA Non-Ag. na na na 16.1 16.0 14.2 11.1 10.0 8.9 7.8 RRA na na na -33.7 -27.5 -14.4 -16.3 -14.9 -6.5 -7.4 Vietnam b NRA Ag. na na na na na na -15.9 -26.4 0.0 20.7 NRA Non-Ag. na na na na na na 4.3 -11.2 1.5 20.8 RRA na na na na na na -19.2 -17.4 -1.3 0.0 South Asia NRA Ag. 4.7 3.9 4.4 9.7 -7.7 1.8 47.1 0.2 -2.4 12.7 NRA Non-Ag. 112.7 115.5 143.1 81.7 57.8 54.6 39.9 18.6 15.0 10.1 RRA -56.2 -56.8 -57.0 -39.8 -41.6 -33.3 5.1 -15.5 -14.9 3.4 Bangladesh NRA Ag. na na na na 3.1 -3.9 17.5 -2.4 -8.0 4.0 NRA Non-Ag. na na na na 28.4 22.4 28.5 33.3 29.0 23.4 RRA na na na na -19.7 -21.5 -8.6 -26.7 -28.6 -15.8 India b NRA Ag. 5.2 5.2 5.2 12.6 -7.4 4.1 67.5 2.0 -2.3 15.4 NRA Non-Ag. 113.0 113.0 113.0 83.1 64.8 59.3 48.6 15.9 12.6 5.2 RRA -56.3 -56.3 -56.3 -38.3 -43.8 -33.5 11.7 -12.1 -12.9 12.5 Pakistan b NRA Ag. na -1.0 21.7 9.3 -11.8 -9.3 -5.9 -10.2 -2.6 1.5 NRA Non-Ag. na 169.7 224.5 146.7 44.0 48.3 45.1 39.3 27.0 14.6 RRA na -63.8 -62.4 -55.9 -38.6 -38.6 -35.1 -35.2 -23.0 -11.5

1
Table 2 (continued): Relative rates of assistance (RRA) to agriculturea, key Asian economies, 1955 to 2004
(percent) 1955-59 1960-64 1965-69 1970-74 1975-79 1980-84 1985-89 1990-94 1995-99 2000-04 Sri Lanka NRA Ag. -2.7 -25.7 -27.6 -18.5 -29.0 -15.4 -11.2 -1.3 14.0 10.8 NRA Non-Ag. 104.9 124.6 138.4 70.7 52.9 57.1 59.0 47.1 36.4 22.9 RRA -52.5 -66.6 -68.0 -51.6 -53.5 -46.2 -44.3 -32.9 -16.3 -9.8 Asian dev. economiesc NRA Ag. -29.0 -27.7 -26.9 -24.3 -31.3 -18.8 -11.2 -2.6 7.5 11.7 NRA Non-Ag. 66.8 67.1 70.9 50.3 50.3 38.3 15.4 14.9 9.6 4.3 RRA -57.5 -56.4 -55.3 -47.9 -44.7 -40.8 -22.8 -15.2 -1.9 7.1 Dispersion of national RRAsd 21.9 30.7 36.2 37.6 41.5 51.9 56.0 65.1 50.5 50.8 a The RRA is defined as 100*[(100+NRAagt)/(100+NRAnonagt)-1], where NRAagt and NRAnonagt are the percentage NRAs for the tradables parts of the agricultural and non-agricultural sectors, respectively. b The estimates for China pre-1981 and India pre-1965 are based on the assumption that the nominal rates of assistance to agriculture in those years was the same as the average NRA estimates for those economies for 1981-84 and 1965-69, respectively, and that the gross value of production in those missing years is that which gives the same average share of value of production in total world production in 1981-84 and 1965-69, respectively. This NRA assumption is conservative in the sense that for both countries the average NRA was probably even lower in earlier years, according to the authors of those country case studies. c The weighted averages of the above national averages, using weights based on gross value of national agricultural production at undistorted prices. d The simple average of the standard deviation around a weighted mean of the national RRAs for the region each year. Source: Calculated from Anderson and Valenzuela (2008), which draws on national estimates reported in Anderson and Martin (2008).

2
Table 3: Relationships between nominal rates of assistance to farm products and some of its determinants,a Asian developing economies, 1960 to 2004 Explanatory variables: (1) (2) (3) (4) (5) (6) (7) (8) (9) (10) (11) (12)
Ln GDP per capita -0.28*
(-0.03) -0.21* (-0.03)
-0.23* (-0.03)
-0.22* (-0.03)
-0.11 (-0.05)
-0.06 (-0.05)
-0.14 (-0.06)
-0.16* (-0.06)
-0.38* (-0.10)
-0.28* (-0.9)
-0.44* (-0.10)
-0.38* (-0.11)
Ln GDP per capita
squared 0.23*
(-0.02) 0.20*
(-0.01) 0.21*
(-0.01) 0.21*
(-0.01) 0.19*
(-0.02) 0.15*
(-0.02) 0.21*
(-0.03) 0.18*
(-0.02) 0.23*
(-0.03) 0.19*
(-0.02) 0.22*
(-0.03) 0.21*
(-0.03) Importable
0.33*
(-0.04) 0.34*
(-0.04) 0.32*
(-0.04) 0.40*
(-0.04) 0.41*
(-0.04) 0.40*
(-0.04) 0.39*
(-0.04) 0.39*
(-0.04) 0.39*
(-0.04) Exportable
-0.13
(-0.04) -0.12
(-0.04) -0.14
(-0.04) -0.03
(-0.04) -0.03
(-0.04) -0.03
(-0.04) -0.04
(-0.04) -0.04
(-0.04) -0.04
(-0.04) Revealed
comp. advantagea
0.03* (-0.01)
-0.07* (-0.02)
-0.04 (-0.03)
Trade Specializa-tion Indexb
0.11* (-0.03)
-0.13 (-0.09)
-0.03 (-0.10)
Constant 0.14*
(-0.01) 0.03
(-0.03) 0.00
(-0.03) -0.02
(-0.04) 0.07*
(-0.02) -0.11
(-0.04) -0.05
(-0.05) 0.07
(-0.07) -0.49* (-0.12)
0.23* (-0.11)
-0.19 (-0.09)
-0.08 (-0.10)
R2 0.10 0.27 0.27 0.27 0.07 0.23 0.22 0.22 0.14 0.28 0.29 0.29
No. of obs. 2766 2766 2594 2594 2766 2766 2594 2594 2766 2766 2594 2594 Country
fixed effects
No No No No Yes Yes Yes Yes Yes Yes Yes Yes
Time fixed effects No No No No No No No No Yes Yes Yes Yes
a The dependent variable for regressions is NRA by commodity and year. Results are OLS estimates, with standard errors in parentheses and significance levels shown at the 99%(*). b Revealed comparative advantage index is the share of agriculture and processed food in national exports as a ratio of that sector’s share of global exports (world=1). c Net exports as a ratio of the sum of exports and imports of agricultural and processed food products (world=1). Source: Author’s estimates

3
Table 4: Relative stabilitya of domestic producer and border prices of all covered agricultural products, developing country regions, 1955-84 and 1985-2004 1955-1984 1985-2004
Asia SDd/SDb 0.67 0.71 CVd/CVb 0.70 0.69 Africa SDd/SDb 0.88 1.11 CVd/CVb 1.06 1.15 Latin America SDd/SDb 0.84 0.99 CVd/CVb 0.96 0.99 All developing countries SDd/SDb 0.73 0.80 CVd/CVb 0.80 0.79 aSDd/SDb is the standard deviation of the domestic producer price relative to that for the border price;CVd/CVb is the coefficient of variation (the standard deviation divided by the sample mean) of the domestic producer price relative to that for the border price. Source: Anderson and Nelgen (2011), based on prices compiled by Anderson and Valenzuela (2008).

4
Table 5: Effects of full global liberalization of the agricultural and merchandise trade on national economic welfare and real GDP, by country and region, using the Linkage model
(percent change relative to benchmark data)
All sectors' policies
Agricultural policies
All sectors' policies
Economic welfare(EV)
Agric GDP
Non-ag
GDPAgric GDP
Non-ag
GDP East and South Asia 0.9 -0.3 0.7 0.5 2.9 of which China 0.2 2.8 0.2 5.7 3.0 India -0.2 -6.1 1.4 -8.3 -0.3 Africa 0.2 0.1 0.8 -0.9 0.0 Latin America 1.0 36.3 2.8 37.0 2.3 All developing countries 0.9 5.4 1.0 5.6 1.9 Eastern Europe &Central Asia 1.2 -4.4 0.3 -5.2 0.3 All high-income countries 0.5 -13.8 0.2 -14.7 0.1 World total 0.6 -1.0 0.4 -1.2 0.5
Source: Linkage model simulations from Anderson, Valenzuela and van der Mensbrugghe (2010).

1
Table 6: Effects of full global merchandise trade liberalization on the incidence of extreme poverty using the Linkage model
Average
unskilled wage
change, reala (%)
Baseline headcount
New levels, $1/day New levels, $2/day
Change in number of poor from baseline
levels
Change in number of poor from
baseline levels
$1/day $2/day Headcount Number of poor, Headcount
Number of poor, $1/day, $2/day, $1/day, $2/day,
(%) (%) (%) million (%) million million million % %
East Asia 4.4 9 37 8 151 34 632 -17 -52 -10.3 -7.6
China 2.1 10 35 9 123 34 440 -5 -12 -4.0 -2.7 Other East Asia 8.1 9 50 6 29 42 192 -12 -40 -30.1 -17.1 South Asia -1.9 31 77 32 454 78 1124 8 8 1.8 0.7 India -3.8 34 80 36 386 82 883 15 15 4.2 1.7 Other South Asia 4.0 29 94 26 68 92 241 -8 -7 -9.9 -2.7 Sub Saharan Africa 5.3 41 72 39 287 70 508 -11 -14 -3.8 -2.7 Latin America 4.1 9 22 8 44 21 115 -3 -6 -6.8 -4.7 Middle East/ N.Africa 14.3 1 20 1 3 13 40 -2 -19 -36.4 -32.7 All dev. countries 5.9 18 48 18 944 46 2462 -26 -87 -2.7 -3.4
Developing ex. China 6.5 21 52 20 820 50 2022 -21 -74 -2.5 -4.7
Eastern Europe & Central Asia 4.5 1 10 1 4 9 43 -0 -4 -6.8 -8.0
a Nominal unskilled wage deflated by the food and clothing CPI Source: Linkage model simulations from Anderson, Valenzuela and van der Mensbrugghe (2010).

2
Table 7: Effects of full global liberalization of the agricultural and merchandise trade on the incidence of extreme poverty using the GTAP model
(percentage point change using $1 a day poverty line)
Default tax replacement Alternative tax
replacement (poor are exempt)
Agriculture-only reform
Non-agriculture-only reform
All merchandise reform
All merchandise reform
Bangladesh -0.3 0.5 0.3 -5.3Indonesia -1.1 0.5 -0.6 -5.2Philippines -1.4 0.4 -1.0 -6.4Thailand -11.2 0.9 -10.3 -28.1Vietnam -0.5 -5.3 -5.7 -23.6 Unweighted averages: -Asia -2.9 -0.6 -3.5 -13.7 -Africa -0.7 0.1 -0.7 -4.5 -Latin Amer -1.3 0.3 -1.0 -5.7 -All 15 DCs -1.7 -0.1 -1.7 -8.0 Source: Hertel and Keeney (2010, Table 5).

3
Table 8: The impact of reform on the incidence of extreme poverty, selected developing countries (percentage point change using national or $1 a day poverty line)
(a) rural poverty Base Agriculture-only reform Non-agriculture-only reform All merchandise reform (%) Unilateral R of W Global Unilateral R of W Global Unilateral R of W GlobalChina($2/day) 58 0.3 -1.4 -1.1 0.2 -0.5 -0.3 0.5 -1.9 -1.4Indonesia 29 0.1 -1.1 -1.1 -0.2 -3.2 -3.3 -0.1 -4.3 -4.4Pakistan 38 -1.4 -0.1 -1.5 -6.2 -1.1 -7.1 -7.6 -1.2 -8.6Philippines 49 0.0 -0.6 -0.3 0.6 -0.3 0.2 0.6 -0.9 -0.1Thailand 30 0.3 -1.6 -1.3 -3.8 0.7 -3.1 -3.5 -0.9 -4.4(b) urban poverty Base Agriculture-only reform Non-agriculture-only reform All merchandise reform (%) Unilateral R of W Global Unilateral R of W Global Unilateral R of W Global China($2/day) 3 0.0 0.0 0.0 0.0 -0.1 -0.1 0.0 -0.1 -0.1Indonesia 12 -0.1 -0.3 -0.4 -0.1 -1.7 -1.8 -0.2 -2.0 -2.2Pakistan 20 -2.4 -0.1 -2.7 4.7 -1.4 3.1 2.3 -1.5 0.4Philippines 19 0.8 -0.9 -0.2 1.2 -0.7 0.3 2.0 -1.6 0.1Thailand 6 0.0 -0.8 -0.7 -3.3 0.2 -3.2 -3.3 -0.6 -3.9(c) total poverty Base Agriculture-only reform Non-agriculture-only reform All merchandise reform (%) Unila
teral R of W Global Unilateral R of W Global Unilateral R of W Global
China($2/day) 36 0.2 -0.8 -0.6 0.1 -0.4 -0.3 0.3 -1.2 -0.9Indonesia 23 -0.0 -0.8 -0.8 -0.1 -2.7 -2.8 -0.1 -3.5 -3.6Pakistan 31 -1.6 -0.1 -1.8 -3.6 -1.2 -4.6 -5.2 -1.3 -6.4Philippines 34 0.4 -0.6 -0.1 0.7 -0.3 0.2 1.1 -0.9 0.1Thailand 14 0.1 -1.1 -0.8 -3.5 0.4 -3.3 -3.4 -0.7 -4.1Unwted averages: -Asia 28 -0.2 -0.7 (-2.9)-0.8 -1.2 -0.8 (-0.6)-2.2 -1.5 -1.6 (-3.5)-3.0 -Africa 32 -0.8 -0.2 (-0.7)-0.9 -0.5 -0.7 (0.1)-1.2 -1.3 -0.9 (-0.7)-2.1 -Latin Am. 36 -0.3 -1.3 (-1.3)-1.6 -0.7 0.4 (0.3)-0.3 -1.0 -0.9 (-1.0)-2.0 -All 9 DCs 43 -0.4 -0.6 (-1.7)-1.0 -0.9 -0.6 (-0.1)-1.5 -1.3 -1.2 (-1.7)-2.6

4
a Numbers in italics for individual countries are implied assuming linearity holds; numbers do not always add because of either rounding or interaction effects Source: Country case studies in Parts II to IV of Anderson, Cockburn and Martin (2010) plus (in the case of the unbolded numbers in brackets in the final 4 rows), from Hertel and Keeney (2010) as reported in the last 4 rows of Table 7 above.

5
Table 9: Impact of reform on the incidence of income inequality (percentage point change in Gini Coefficient) (a) rural
Base Agriculture-only reform Nonagriculture-only reform All merchandise reform (%) Unilateral R of W Global Unilateral R of W Global Unilateral R of W Global China 0.32 0.0 -0.2 -0.2 0.0 0.0 0.0 0.0 -0.2 -0.2 Indonesia 0.29 0.0 0.0 0.0 0.1 0.0 0.1 0.1 0.0 0.1 Pakistan 0.26 -0.1 -0.0 -0.1 0.3 0.0 0.3 0.2 -0.0 0.2 Philippines 0.43 0.2 -0.1 0.1 0.3 0.0 0.1 0.5 -0.1 0.2 Thailand 0.33 0.0 0.5 0.5 0.4 0.0 0.4 0.4 0.5 0.9 (b) urban Base Agriculture-only reform Nonagriculture-only reform All merchandise reform (%) Unilateral R of W Global Unilateral R of W Global Unilateral R of W Global China 0.26 0.0 0.1 0.1 0.0 -0.1 -0.1 0.0 0.0 0.0 Indonesia 0.36 0.0 -0.1 -0.1 0.3 0.3 0.6 0.3 0.2 0.5 Pakistan 0.40 -0.1 -0.0 -0.1 -1.9 0.0 -1.9 -2.0 -0.0 -2.0 Philippines 0.48 0.3 -0.2 0.1 0.1 0.0 0.1 0.4 -0.2 0.2 Thailand 0.15 0.1 0.6 0.7 0.5 0.0 0.5 0.6 0.6 1.2 (c)total Base Agriculture-only reform Nonagriculture-only reform All merchandise reform (%) Unilateral R of W Global Unilateral R of W Global Unilateral R of W Global China 0.44 0.1 -0.4 -0.3 0.0 -0.1 -0.1 0.1 -0.5 -0.4 Indonesia 0.34 0.0 -0.1 -0.1 0.2 0.2 0.4 0.2 0.1 0.3 Pakistan 0.34 -0.1 -0.0 -0.2 -3.2 -0.1 -3.1 -3.3 -0.1 -3.3 Philippines 0.51 0.3 -0.2 0.1 0.1 0.0 0.1 0.4 -0.2 0.2 Thailand 0.34 0.1 0.7 0.8 0.4 0.0 0.4 0.5 0.7 1.2 Unweighted averages: -Asia 0.39 0.1 -0.0 0.1 -0.5 0.0 -0.5 -0.4 -0.0 -0.4 -Africa 0.58 -0.7 -0.1 -0.8 -0.4 0.1 -0.3 -1.0 -0.0 -1.0 -LatinAm. 0.56 -0.2 -0.7 -0.8 0.0 -0.2 -0.1 -0.2 -0.8 -1.0 -All 9 DCs 0.59 -0.2 -0.2 -0.4 -0.3 -0.0 -0.3 -0.5 -0.2 -0.7 a Numbers in italics are implied assuming linearity holds; numbers do not always add because of either rounding or interaction effects Source: Country case studies in Parts II to IV of Anderson, Cockburn and Martin (2010).

6
Figure 1: Nominal rates of assistance to exportable, import-competing and alla agricultural products, Asian developing economies,b 1955 to 2004
(percent, weighted averages across 12 economies)
-50
-30
-10
10
30
50
1955-59 1960-64 1965-69 1970-74 1975-79 1980-84 1985-89 1990-94 1995-99 2000-04
import-competing exportables total
a The total NRA can be above or below the exportable and importable averages because assistance to nontradables and non-product specific assistance is also included.
b The exportables, import-competing and total estimates are based on China pre-1981 and India pre-1965 values estimated on the assumption that the nominal rate of assistance to agriculture in those years was the same as the average NRA estimates for those economies for 1981-84 and 1965-69, respectively, and that the gross value of production in those missing years is that which gives the same average share of value of production in total world production in 1981-84 and 1965-69, respectively. Source: Calculated from Anderson and Valenzuela (2008), which draws on national estimates reported in Anderson and Martin (2008).
7
Figure 2: Nominal rates of assistance to agricultural and non-agricultural tradable products and relative rate of assistance,a Asia developing economies,b 1955 to 2004
(percent, weighted averages across 12 economies)
-80
-40
0
40
80
1955–59 1960–64 1965–69 1970–74 1975–79 1980–84 1985–89 1990–94 1995–99 2000–04
year
perc
ent
NRA ag tradables NRA non-ag tradables RRA
a The RRA is defined as 100*[(100+NRAagt)/(100+NRAnonagt)-1], where NRAagt and NRAnonagt are the percentage NRAs for the tradables parts of the agricultural and non-agricultural sectors, respectively. b The exportables, import-competing and total estimates are based on China pre-1981 and India pre-1965 values estimated on the assumption that the nominal rate of assistance to agriculture in those years was the same as the average NRA estimates for those economies for 1981-84 and 1965-69, respectively, and that the gross value of production in those missing years is that which gives the same average share of value of production in total world production in 1981-84 and 1965-69, respectively. Source: Calculated from Anderson and Valenzuela (2008), which draws on national estimates reported in Anderson and Martin (2008).

8
Figure 3: Nominal and relative rates of assistance,a Asian, African and Latin American developing country regions, 1965 to 2004b
(percent) (a) NRA
-30
-20
-10
0
10
20
1965–69 1970–74 1975–79 1980–84 1985–89 1990–94 1995–99 2000–04
year
perc
ent
LAC Africa Asia
(b) RRA
-70
-50
-30
-10
10
1965–69 1970–74 1975–79 1980–84 1985–89 1990–94 1995–99 2000–04
year
perc
ent
LAC Africa Asia
a 5-year weighted averages with value of production at undistorted prices as weights.
b Estimates for China pre-1981 and India pre-1965 are based on the assumption that the nominal rates of assistance to agriculture and national share or regional agricultural production in those years were the same as the average NRA estimates for those economies for 1981-84 and 1965-69, respectively. Source: Calculated from Anderson and Valenzuela (2008), which draws on national estimates reported in Anderson and Martin (2008).

9
Figure 4: Rice NRA and international rice price, South and Southeast Asia, 1970 to 2005 (left axis is int’l price in USD, right axis is NRA in percent)
(a) South Asia
-
100
200
300
400
500
60019
70
1972
1974
1976
1978
1980
1982
1984
1986
1988
1990
1992
1994
1996
1998
2000
2002
2004
USD
-70-60-50-40-30-20-100102030
NRA
%
Pw S Asia
Correlation coefficient is -0.75 (b)Southeast Asia
-
100
200
300
400
500
600
1960
1963
1966
1969
1972
1975
1978
1981
1984
1987
1990
1993
1996
1999
2002
2005
-40
-30
-20
-10
0
10
20
30
40
Pw (USD)
SE Asia
-
100
200
300
400
500
600
1970
1972
1974
1976
1978
1980
1982
1984
1986
1988
1990
1992
1994
1996
1998
2000
2002
2004
USD
-40
-30
-20
-10
0
10
20
30
NRA %
Pw SE Asia Correlation coefficient is -0.59 Source: Anderson and Nelgen (2011).

Figure 5: RRAs and log of real per capita GDP, India and Northeast Asian focus economies, 1955 to 2005
-100
-50
0
50
100
150
200
7 8 9 10 11
ln real GDP per capita
Rel
ativ
e R
ate
of A
ssis
tanc
e, %
China
Korea
India
Japan
Taiwan
Source: Anderson and Martin (2009, Ch. 1).