policy uncertainty and foreign direct investment: evidence ... · china, and foreign direct...
TRANSCRIPT

Policy Uncertainty and Foreign DirectInvestment: Evidence from the China-Japan
Island Dispute∗
Cheng Chen† Tatsuro Senga‡ Chang Sun§ Hongyong Zhang¶
September 1, 2016
Abstract
Can a temporary negative shock generate long-lasting effects on economic ac-
tivities? To show causal evidence, we utilize data from Japanese multinational
corporations (MNCs) and explore the economic impact of the unexpected esca-
lation of an island dispute between China and Japan in 2012. Our difference-in-
differences (DID) estimation substantiates that a sharp, but temporary fall in local
sales of Japanese MNCs in China led to persistent downward deviation of foreign
direct investment (FDI) from its trend. Moreover, despite the quick recovery of
local sales, Japanese MNCs in China have continued to underestimate their local
sales, which generates pessimistic and more dispersed forecast errors after the is-
land crisis. We view this as evidence for a belief-driven channel through which a
large and unexpected negative shock leads agents to revise their beliefs and start
tail risk hedging.
JEL: D84, E22, E32, F23
Keywords: Uncertainty, Forecasts, FDI, Geopolitical Conflicts, Business Cycles.
∗We are grateful to Arata Ito, Masayuki Morikawa, Makoto Yano and seminar participants in RIETIfor their insightful comments. Financial support from Hong Kong government and RIETI is greatlyappreciated.†University of Hong Kong. Email: [email protected].‡Queen Mary University of London. Email: [email protected].§Princeton University. Email: [email protected].¶RIETI. Email: [email protected].

1. Introduction
“... in practice the process of revision of short-term expectation is a gradual and continuousone, carried on largely in the light of realized results; ... producers’ forecasts are more oftengradually modified in the light of results than in anticipation of prospective changes.”
— Keynes, 1936
The literature has extensively investigated the relationship between uncertaintyand firm-level activities. One stylized fact emerging from the literature is the negativeuncertainty-investment relationship. Various theories have been proposed to explainhow increased uncertainty adversely affects firm investment.1 A large body of empir-ical work has also tried to show this negative relationship.2 Moreover, the effects ofthis relationship are also found to be greater in developing countries due to politicalinstability and geopolitical conflicts.
Despite the extensive research on uncertainty and its relationship with investment,there is still a lack of causal evidence on how increased uncertainty affects firm-levelactivities for two reasons.3 First, in periods during which uncertainty increases, othereconomic factors are also likely to vary, such as economic policies. Second, there isa lack of high-quality firm-level data that can be used to obtain direct measures onfirm-level uncertainty (e.g., forecast errors) at high frequency levels.4 In this paper,we use the sudden escalation of the dispute over the Senkaku Islands (between Chinaand Japan) in 2012 to explore the impact of increased uncertainty on economic activi-ties. Specifically, we use this “island shock” which is arguably exogenous to solve thefirst problem mentioned above. Furthermore, we utilize data from Japanese multina-tional corporations (MNCs) and their foreign affiliates to deal with the second prob-lem. These data include both qualitative and quantitative measures of firm-level un-certainty at quarterly and annual frequencies.
Using data from Japanese MNCs and their foreign affiliates, we show how in-creased uncertainty (due to geopolitical conflicts) has variously affected sales and cap-ital investment of Japanese MNCs in China, forecast errors (FEs) of Japanese firms in
1For example, existing theories have shown that increased uncertainty raises the option value ofwaiting (to undertake investment) in the presence of nonconvex adjustment costs (Bernanke 1983; Dixitand Pindyck 1994; Abel and Eberly 1996; Bloom 2009), which makes firms delay their investment andhiring.
2Various measures of uncertainty are under development, including the stock-price volatility (Leahyand Whited 1996), the frequency of appearance of words such as “uncertain” in news articles (Baker etal. 2012), and disagreement among forecasters (Backmann et al. 2013). These proxies are used for theirpanel analysis and show that investment is negatively associated with uncertainty at the firm level.
3A notable exception is Baker and Bloom (2013), who use natural disasters as experiments to inves-tigate the relationship between uncertainty and growth.
4An exception is Bachmann et al. (2013), who utilize quarterly data on firm-level uncertainty to studythe impact of increased uncertainty on firm-level outcomes. Using market information, Senga (2015)constructs firm-level uncertainty measures to study how firms’ learning in the aftermath of recessionsaffects economic recoveries during business cycles.
1

China, and foreign direct investment (FDI) flows from Japan to China.5 We documentthree sets of empirical findings. First, we look at the impact of the island shock on salesof Japanese affiliates in China. The data show that local sales of Japanese affiliates inChina plummeted immediately after the sudden escalation of the island crisis (i.e.,2012/Q3). However, these sales recovered quickly and substantially surpassed theirpre-crisis levels not long after the crisis. Taken together, this evidence implies that thenegative demand shock on Japanese goods (sold in China) was temporary and doesnot seem to have generated long-term impact on Chinese consumers’ confidence inJapanese goods.6
However, the impact of the island crisis on FDI and capital investment differs sub-stantially from our first finding. The data substantiate that FDI flows from Japan toChina started to drop significantly when the island dispute suddenly escalated, al-though FDI had continually increased before the island shock. Figure 1 shows theevolution of the share of FDI inflows from Japan to China in total FDI inflows intoChina. When we implement difference-in-differences (DID) analysis by comparingFDI flows from Japan to China with them from Japan to other countries, this patternbecomes even more pronounced. We have also looked at channels through which theisland shock reduced FDI flows from Japan to China and find that the extensive mar-gin plays the dominant role. That is, compared with the pre-crisis time, more affiliatesof Japanese MNCs’ exited from and fewer Japanese affiliates entered into China afterthe island crisis. Moreover, the fraction of existing Japanese affiliates that increasedFDI in China dropped significantly, as did those reporting zero FDI flows after theisland shock. In addition, capital investment of Japanese affiliates in China, which isa part of FDI, displays a similar pattern. We conclude that FDI flows from Japan toChina were substantially reduced by the unexpected island shock, even in the longrun, despite that demand for Japanese goods recovered quickly and strongly after theshock. A natural question to ask is which factor is responsible for this difference.
Third, we show that Japanese affiliates’ forecasts of their sales in China became sig-nificantly pessimistic after the outbreak of the island crisis and have not returned topre-event levels, even three years after the island shock. First, we show that our dataof firm-level forecasts are reliable and make sense economically.7 Next, we find thatthis pessimistic belief holds more strongly for local sales, which are the most impor-tant part of total sales of Japanese affiliates in China. In addition, when we implementdifference-in-differences (DID) regressions by comparing FEs of Japanese affiliates inChina with FEs in other countries, the above two findings become even more pro-
5In this paper, China refers to mainland China (i.e., excluding Hong Kong).6Our data also show that exports from Japan to China featured a similar pattern. Namely, they fell
substantially in the short run after the event but recovered very quickly.7For instance, our data show that firm-level forecasts for local demand and total demand are highly
positively correlated. Moreover, forecasts for local demand (in a given quarter) made at different (pre-vious) quarters are positively correlated, and have smaller errors (on average) for those made at later(previous) quarters.
2

nounced. Together, this suggests that local demand shock played a role in triggeringthe pessimistic forecast. Putting findings two and three together, we conjecture thatthe long-lasting pessimistic belief in local demand led to the sudden and persistentdrop in FDI flows from Japan to China. In addition, we also present evidence on howthe forecast error of sales affects capital investment of Japanese MNCs in China. Theresults shows that conditional on other firm-level characteristics (including realizedsales and employment), underestimation of sales has a negative and quantitativelysizable impact on firm-level investment. This finding substantiates that firm’s belief(about future demand) has real effect on firm’s investment.
Finally, we show that underestimation of firm sales has a negative and quantita-tively sizable impact on firm-level investment by regressing log capital investment onforecast errors of sales and other firm-level characteristics. In addition, we also findthat imprecise forecast for future demand (i.e., higher absolute value of FEs) also neg-atively impacts firm-level investment. Moreover, this negative impact appears mainlyat the extensive margin (i.e., investing or not).8 Of course, we cannot claim theserelationships are causal. However, these new findings uncover some interesting cor-relations between firm’s belief, sentiment, and investment.
In this paper, we focus on subjective uncertainty measures (i.e., forecast errors), andmainly look at how a change in the first-order moment of these measures (averageof forecast errors across firms) affects firm investment and FDI. In other words, ourpaper does not focus on riskiness or volatility of market demand. Instead, we aremainly interested in a type of uncertainty called “unknown unknown” (i.e., unknowndistribution of economic variable and ex post learning), and our paper can be seen asproviding supporting evidence for a recent literature on tail risk (e.g., Kozlowski et al.2015; Orlik and Veldkamp 2015) and economic fluctuation. Interestingly, our annualdata show that the standard deviation of FEs for sales increased substantially from2011 to 2013. This hints that local demand for Japanese goods in China probably hasbecome more volatile and difficult to predict after the island crisis, and accordinglydampened Japanese firms’ investment in China.
To empirically isolate the relationship between uncertainty and firm actions suchas investment and R&D, many authors have conducted various excellent panel anal-ysis. For example, Leahy and Whited (1996) and Bloom et al. (2007) use realizedvolatilities of stock prices as proxies for uncertainty and show a negative relationshipbetween uncertainty and firm investment. Stein and Stone (2013) use the option priceto create forward-looking measures of uncertainty and arrive at a similar result on theuncertainty-investment relationship and a different result on the uncertainty-R&D re-lationship. Using information on the subjective probability distribution from an Italianmanufacturing firm survey, Guiso and Parigi (1999) also find a negative relationship
8The first-order movement in the forecast error such as pessimism can also trigger imprecise forecast.Thus, we cannot identify the pure effect of increased variance of forecast error on firm investment, aswe do not have a distribution of FEs for each firm in a given time.
3

between uncertainty and investment. Our paper, to the best of our knowledge, is thefirst to show a causal relationship between uncertainty and FDI.
An increasing number of studies examine the economics impact of one specific typeof uncertainty: policy uncertainty. For instance, by using the policy uncertainty indexdeveloped by Baker et al. (2013), Gulen and Ion (2015) show that firm-level capitalinvestment is negatively affected by uncertainty associated with future policies. Fur-thermore, Morikawa (2013, 2016) explore the type(s) of policy uncertainty affectingbusiness behavior and find that uncertainty related to tax systems and trade policyaffects capital investment and overseas activities of Japanese firms. Among variousfactors regarding policy uncertainty, our paper sheds light on economic consequencesof government’s geopolitical actions. We will quantify the role of this type of uncer-tainty in our future work.
This paper finds that increased uncertainty due to a short-term event plays an im-portant role in generating persistent impact on long-run economic activities such asinvestment. This has not been studied very much in the literature that looks at variouseffects of sudden and short-term events. For instance, event studies in internationaltrade fail to find long-run impact of sudden events on trade variables (e.g., Fuchs andKlann 2013; Boehm et al. 2014). On the contrary, our paper finds a long-run negativeimpact of a geopolitical conflict on FDI and MNEs’ capital investment. This findingpoints out an important channel through which sudden events can affect internationaltrade and investment in the long run. That is, agents face increased uncertainty due tosudden events, and they revise their beliefs gradually, even after the end of the event.This in turn has long-lasting effects on real economic activities, similarly explored byKozlowski et al. (2015) in the study of business cycles. We view our finding on thelong-run revision of beliefs as a mechanism behind the long-run effects of the islandcrisis studied by Fisman et al. (2014).9
Studies of uncertainty involve dynamics analysis. Research in international tradehas just started to investigate how uncertainty affects exports and FDI in a dynamicsetting (Handley 2014; Handley and Limao 2014, 2015; Novy and Taylor 2014; Carballo2015) in a dynamic setting. However, due to the lack of high-quality firm-level dataand exogenous events, there is little evidence on how increased uncertainty affectsFDI causally. Our work tries to fill this gap by using high-quality Japanese data andstudying the impact of an unexpected geopolitical event.
The rest of the paper is organized as follows. Section 2 describes the escalation ofthe island crisis. Section 3 presents our empirical results, starting with some stylizedfacts, followed by DID estimation. Section 4 concludes.
9Fisman et al. (2014) study the effect of shocks to political tension between China and Japan on stockmarket valuation of individual firms.
4

2. The Island Crisis
China and Japan have been arguing for the sovereignty of the Senkaku islands (orDiaoyu Islands) for many years, and the most serious conflict between the two coun-tries by far is the one that happened in the third quarter of 2012. On July/7th., Japaneseprime minister, Yoshihiko Noda, expressed his consideration for the Japanese gov-ernment to buy the disputed islands, which triggered the first wave of anti-Japaneseprotests in several cities of China on Aug./19th. On Sep./10th., Japanese govern-ment said that it has decided to purchase the disputed islands from a private Japaneseowner in an effort, Tokyo claims, aimed at diffusing territorial tensions. However,much larger scale anti-Japanese demonstrations happened afterwards. In the week-end of Sep./15th.-16th., citizens in mainland China participated in protest marchesand called for a boycott of Japanese products in as many as 85 Chinese cities. More-over, on Sep./18th., people in over 180 cities of China attended protests against Japanon the 81st. anniversary of the Mukden Incident.10
The severity of the island dispute during July-Sep./2012 is unprecedented, and itwas unexpected by Japanese firms in China. The anti-Japanese movements withinthe three months of 2012 had generated significant impact on Sino-Japan economicrelationship. As Figure 1 shows, the share of imports from Japan (in China’s totalimports) fell from 8% to 4.8% within three month after the outbreak of the island crisis.As Figure 2 shows, the share of manufacturing FDI flows from Japan in China’s totalmanufacturing FDI inflows plummeted from 22% (the third quarter of 2012) to 9%(the third quarter of 2014) in two years. One survey done by Teikoku Databank inOct./2012 shows that the sudden escalation of the island dispute was unexpected byJapanese firms, and one third of firms surveyed think the unexpected anti-Japanesedemonstrations are going to negatively affect their sales in China.11 Moreover, onesixth of them plan to withdraw or reduce their investment in China.12
3. Empirical Findings: Differences-in-Differences Estimation
3.1. Data Description
We use two data sets to implement our analysis. The first one is the annual parent-affiliate-level data and the second one is affiliate-level data at quarterly frequency.
10For details, see https://en.wikipedia.org/wiki/2012_China_anti-Japanese_demonstrations.11For details, see https://www.tdb.co.jp/report/watching/press/pdf/keiki_w1210.pdf .12It was reported that the substantial scale-up of anti-Japan protests was related to problems associ-
ated with the transition of political power in China around the same time. This further shows that theescalation of the island dispute was exogenous to Sino-Japan economic relationship. For details, seehttp://www.cnn.com/2012/09/18/world/asia/china-protests-japan-fury/index.html.
5

3.1.1. Annual Data of Japanese MNCs and Affiliates
We use the parent-affiliate-level data of the Basic Survey on Overseas Business Activ-ities (BSOBA, Kaigai Jigyo Katsudo Kihon Chosa) prepared by the Ministry of Econ-omy, Trade and Industry (METI). This survey covers two types of overseas subsidiariesof Japanese MNCs: (1) direct subsidiaries with the ratio of investment by Japaneseenterprises’ being 10% or higher as of the end of the fiscal year (March 31) (2) second-generation subsidiaries with the ratio of investment by Japanese subsidiaries’ being50% or higher as of the end of the fiscal year (March 31). This survey is conductedannually by a questionnaire based on self-declaration survey forms (one for parentfirm and another one for each foreign affiliate) sent to the parent firm, and each yearrefers to the period from April/1 of that year to March/31st. of the next year. The sur-vey form for parent firms includes variables on parent’s sales, capital, employment,industry classification etc. The survey form for the foreign affiliates reports their cap-ital, sales, investment, number of employees, country and industry information, thedate of establishment or capital participation, and operation status including dissolu-tion or withdrawal. Since the dataset also reports the fraction of direct invested by theJapanese parental firm each year, we can calculate the FDI inflow from Japan to Chinaat the firm level.13
Importantly, regarding sales and capital investment, foreign affiliates report boththe realized value and the projected value. These variables allow us to calculate quan-titative FEs at the affiliate-year-level. Specifically, FE for sales and investment is calcu-lated as (realized value-projected value)/projected value. Based on this annual cross-section survey, we constructed a panel dataset of foreign affiliates from 2003 to 2013.Each parent-affiliate pair is traced throughout the period using the identification code.To obtain real sales and investment, parent and affiliate’s sales and investment are de-flated by GDP deflators of Japan and each destination country, respectively. Summarystatistics of this dataset is reported in Figure 14, and the total number of observationsacross 11 years is roughly 220,000.
3.1.2. Quarterly Data of Foreign Affiliates
Our quarterly data of foreign affiliates collected by the Ministry of Economy, Tradeand Industry (METI) is called the Quarterly Survey of Overseas Subsidiaries (QSOS,Kaigai Genchi Hojin Shihanki Chosa). This survey is conducted every quarter in orderto trace out trends of Japanese foreign affiliates’ business activities. It includes over-seas subsidiaries above certain size in manufacturing sectors14 The Number of foreign
13Specifically, the FDI flow from Japan into affiliate j in year t equals sjt ∗ Kjt − sj,t−1 ∗ Kj,t−1, wheresjt is the fraction of investment by the Japanese parental firm in affiliate j in year t, and Kjt is the totalinvestment in affiliate j in year t. Note that sj,t−1 ∗ Kj,t−1 equals zero for FDI entrants in year t andsjt ∗ Kjt equals zero for firms that withdraw their FDI from China in year t.
14Firms included in this survey have to have (1) at least 50 employees; (2) the value of capital biggerthan or equal to 100 million JPY; (3) at least 50% of the total capital coming from the Japanese parentalfirms (including both direct and indirect funds, such as funds provided via local subsidiaries).
6

subsidiaries covered by this survey is around 5,000 every year and the response rateis about 80%. Compared with the first survey, the key advantage of the second one isthat it reports realized and predicted value of various sales, investment, and employ-ment at quarterly level. Moreover, in this survey, sales are decomposed into local sales,sales to Japan, sales to countries other than Japan. The high frequency of the data andthe finer division of sales are crucial for our empirical analysis. Based this quarterlycross-section survey, we constructed a panel dataset of foreign affiliates from 2006/Q4to 2015/Q2. In order to obtain real sales and investment, we deflate affiliate’s salesand investment using GDP deflators of destination countries.
Variables appearing in this survey are defined as follows. Capital investment is theacquisition of tangible fixed assets excluding land and depreciation. The number ofemployees is measured at the end of each quarter. Regarding the forecast, subsidiariesreport its value on various sales (e.g., local sales, sales back to Japan etc.), capital in-vestment and the number of employees for the next quarter and the next next quarter.Specifically, for each item “A”, subsidiaries are requested to compare the predictedvalue of “A” (for the next quarter and the next next quarter) with its current valueand choose one from the following three options: “Increase (1)”, “Unchanged (0)”,and “Decrease (-1)”. With the information of forecast in hand, we construct FE whichis the difference between the realized value and the predicted value. FE is definedover the grid of [-2, -1, 0, +1, +2]. For instance, if both the realized and predicted lo-cal sales increase, FE is 0(=1-1). However, if the realized local sales increase while thepredicted local sales is “Decrease”, FE is 2(=1-(-1)). Summary statistics of this datasetis reported in Figure 15, and the total number of observations across 35 quarters isroughly 180,000.
3.1.3. Validation of our Forecast Errors
In order to ensure the reliability of firm-level forecasts and FEs we have constructed,we implement the following several checks using the quarterly data. First, Table 1shows that forecasts for total sales and local sales are highly and positively correlatedat the firm level. This excludes a potential concern that firms randomly report theirforecasts, as local sales are the most import part of total sales. Second, as Table 2 shows,error of forecast (for local sales) made one quarter before is highly and positively cor-related with error of forecast (for local sales) made two quarters before. This againshows that firms are reporting their forecasts consistently. Of course, firms updatetheir information set when time goes by. Thus, the two types of errors are not per-fectly correlated. Third, Table 3 shows forecast for local sales becomes more precisewhen time elapses, as the average of absolute value of FE made one quarter before issmaller than the average of absolute value of FE made two quarter before. This is thekey evidence that firms are using their best knowledge to forecast, as it is (and shouldbe) easier for the firm to forecast one period before than two periods before. Takentogether, the above three empirical checks validate the use of FEs in our following
7

analysis.
Since there is a reasonable amount of observations (roughly 45%) that did not re-port their forecasts in the quarterly data , we check whether the existence of obser-vations that did not report their forecasts affect our results. First, Figures 16 and 17show that non-reporting observations have higher levels of employment and sales onaverage. However, this pattern is the same for Japanese affiliates in China as for allJapanese affiliates. Thus, this difference should not affect our DID results. Second, wehave checked whether the characteristics (i.e., employment and real sales) of obser-vations with missing forecasts and without missing forecasts have changed after theisland crisis. As a result, we have found no systematic differences (before and after theisland crisis) for both Japanese affiliates in China and for all Japanese affiliates. Finally,we found that before the island crisis, 33% of observations that reported their forecastsare from China. This number for quarters after the island shock is 34% which barelychanged compared with before. Taken together, we conclude that the existence of ob-servations that did not report their forecasts should not affect our following empiricalfindings.
3.2. Stylized facts
In this section, we empirically explore how the outbreak of the island dispute in thesummer of 2012 affected Japanese multinational firms that serve Chinese local mar-kets through vertical integration. Our findings are summarized by the following fourstylized facts. First, local sales of Japanese affiliates in China dropped sharply but re-bounded quickly. Second, FDI flows of Japanese MNCs into China started to deviatedownward from its previous trend and remain at a lower level persistently after theisland shock. In addition, capital investment of Japanese affiliates in China began todrop after the island crisis as well. Third, Japanese MNCs in China kept reportingnegative FE of local sales. That is, even after their local sales rebounded quickly, theykept underestimating their local sales. Finally, underestimation of sales (i.e., positiveFE) and imprecise forecast (measured by bigger absolute value of FE) have a negativeand quantitatively sizable impact on firm-level investment (especially at the extensivemargin). The first three stylized facts are more pronounced when we compare activi-ties of Japanese affiliates in China with those in other countries. Since we want to teaseout common shocks to all Japanese affiliates abroad, we implement DID regressionsand add country-specific time trends (i.e., China and non-China) into our regressionswhen possible. DID analysis suggests that the third quarter of 2012 is indeed a turn-ing point for Japanese MNCs’ affiliates in China, and we point out an explanation forthese documented facts: a belief-driven relationship between subjective uncertaintyand investment.
8

3.2.1. Finding One: Big and Transitory Demand Shock to Sales of JapaneseGoods in China
In this subsection, we present evidence that local demand faced by Japanese affiliatesin China fell only temporarily after the island shock. Figure 3 compares historicalcyclical series of local sales reported by Japanese subsidiaries in China and in othercountries. While both lines exhibit a large drop in the first two quarters of 2009 duringthe financial crisis, only the blue solid line hits the lowest level in the fourth quarter of2012. Local sales in China bounced back from the trough quickly starting from the 1st.quarter of 2013.
We use quarterly data to further examine this large but transitory fluctuation oflocal sales of Japanese goods in China. Figure 4 presents the distribution of growthrate of local sales across firms for quarters around the outbreak of the island crisis(from 2012/Q2 to 2013/Q1). The figure shows a significant drop in average growthrate in the third quarter and the fourth quarter of 2012. As we saw in the aggregateseries, the plummet in the average sales growth rate disappeared in the first quarter of2013 and reverted to the level of the second quarter of 2012. If we turn our attention tothe dispersion of local sales, it gets larger when the average level goes down. However,it remains more dispersed in the first quarter of 2013 relative to the second quarter of2012. This heterogeneity suggests that some are behind the average recovery pace oflocal sales in China even though the aggregate series displayed a quick recovery. Usingthe annual data, we document a similar pattern. Specifically, Figure 5 verifies thataverage annual growth rate of local sales did fall substantially in 2012 (i.e., comparedwith 2010 and 2011), although it recovered and surpassed its pre-crisis level in 2013.
3.2.2. Finding Two: Persistently Negative Impact on FDI Flows and CapitalInvestment
In this subsection, we show that FDI flows (from Japan to China) started to drop afterthe outbreak of the island crisis. In addition, when we look at capital investment ofJapanese affiliates in China which is a part of FDI, it displays a similar pattern at boththe annual frequency and the quarterly frequency. Furthermore, evidence suggeststhat the extensive margin plays an dominant role in shaping the change in FDI flowsand capital investment.
To this end, we start off presenting evidence on aggregate FDI flows. As in the leftpanel of Figure 6, there is a clear sign that FDI inflows from Japan to China startedto drop after the island shock and remained lower than its pre-shock trend even in2016. The right panel of Figure 6 shows the four-quarter change rate of FDI flowswhich removes seasonal components. It is evident that FDI flows from Japan to Chinastayed in the negative region, the level of which was lower than the one during thefinancial crisis. Furthermore, the duration of the decline was also longer compared tothe financial crisis. This is distinctive relative to FDI inflows to other countries during
9
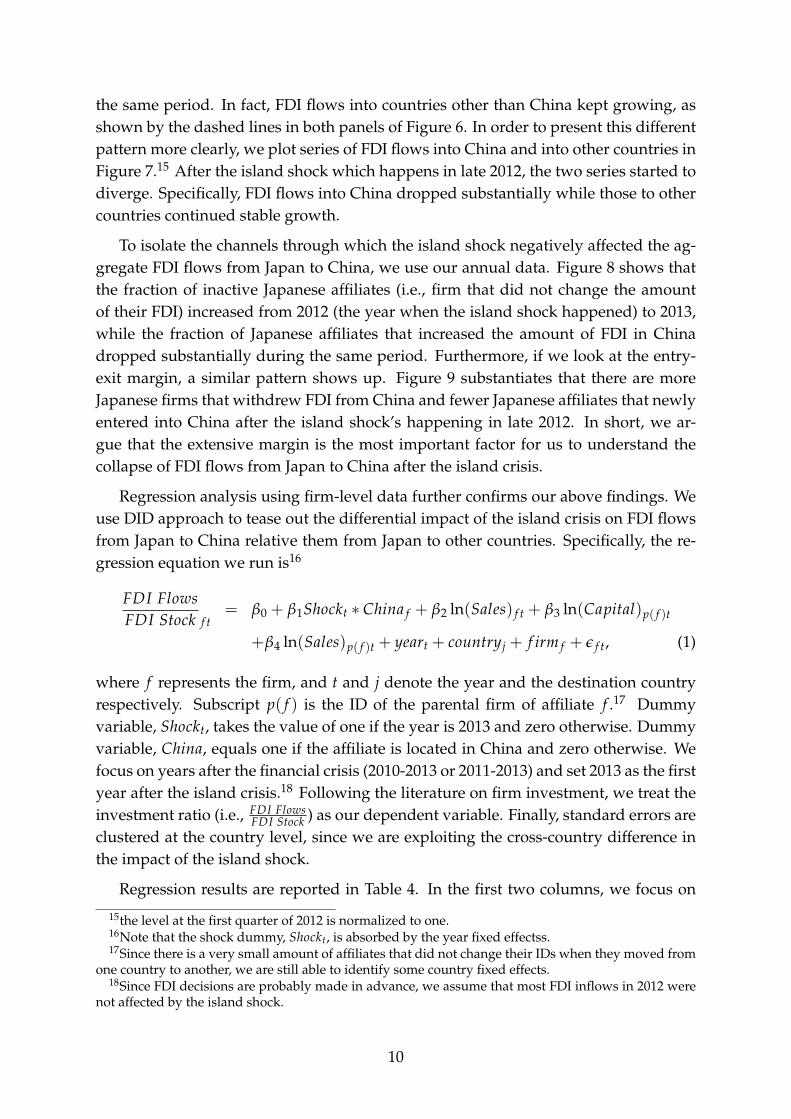
the same period. In fact, FDI flows into countries other than China kept growing, asshown by the dashed lines in both panels of Figure 6. In order to present this differentpattern more clearly, we plot series of FDI flows into China and into other countries inFigure 7.15 After the island shock which happens in late 2012, the two series started todiverge. Specifically, FDI flows into China dropped substantially while those to othercountries continued stable growth.
To isolate the channels through which the island shock negatively affected the ag-gregate FDI flows from Japan to China, we use our annual data. Figure 8 shows thatthe fraction of inactive Japanese affiliates (i.e., firm that did not change the amountof their FDI) increased from 2012 (the year when the island shock happened) to 2013,while the fraction of Japanese affiliates that increased the amount of FDI in Chinadropped substantially during the same period. Furthermore, if we look at the entry-exit margin, a similar pattern shows up. Figure 9 substantiates that there are moreJapanese firms that withdrew FDI from China and fewer Japanese affiliates that newlyentered into China after the island shock’s happening in late 2012. In short, we ar-gue that the extensive margin is the most important factor for us to understand thecollapse of FDI flows from Japan to China after the island crisis.
Regression analysis using firm-level data further confirms our above findings. Weuse DID approach to tease out the differential impact of the island crisis on FDI flowsfrom Japan to China relative them from Japan to other countries. Specifically, the re-gression equation we run is16
FDI FlowsFDI Stock f t
= β0 + β1Shockt ∗ China f + β2 ln(Sales) f t + β3 ln(Capital)p( f )t
+β4 ln(Sales)p( f )t + yeart + countryj + f irm f + ε f t, (1)
where f represents the firm, and t and j denote the year and the destination countryrespectively. Subscript p( f ) is the ID of the parental firm of affiliate f .17 Dummyvariable, Shockt, takes the value of one if the year is 2013 and zero otherwise. Dummyvariable, China, equals one if the affiliate is located in China and zero otherwise. Wefocus on years after the financial crisis (2010-2013 or 2011-2013) and set 2013 as the firstyear after the island crisis.18 Following the literature on firm investment, we treat theinvestment ratio (i.e., FDI Flows
FDI Stock ) as our dependent variable. Finally, standard errors areclustered at the country level, since we are exploiting the cross-country difference inthe impact of the island shock.
Regression results are reported in Table 4. In the first two columns, we focus on
15the level at the first quarter of 2012 is normalized to one.16Note that the shock dummy, Shockt, is absorbed by the year fixed effectss.17Since there is a very small amount of affiliates that did not change their IDs when they moved from
one country to another, we are still able to identify some country fixed effects.18Since FDI decisions are probably made in advance, we assume that most FDI inflows in 2012 were
not affected by the island shock.
10
how value of FDI flows (i.e., the intensive margin) was affected the island crisis. Itis clear that FDI inflows into China dropped relative to the flows into other countriesafter the island shock. Furthermore, this drop (2% to 2.2%) is quantitatively signifi-cant, given that China was already a maturing market for Japanese firms in 2013. InColumns three and six, we focus on the extensive margin of FDI inflows (i.e., whetheror not making FDI inflows). Both the Probit model and the linear probability modelyield the same qualitative result: After 2012, Japanese MNEs are less likely to increasetheir FDI stock in China relative to in other countries.19 In short, the regression re-sults using the annual data support our argument. Annual capital investment whichis a part of FDI displays a similar pattern to FDI flows. For this variable, we run asimilar regression to equation 1 and replace log FDI flows by log capital investment.The regression results are reported in Table 5. Depending on the specification, the is-land shock decreased capital investment of Japanese affiliates in China by 16% to 20%relative to other countries.
Finally, we use the our quarterly data to show the differential impact of the islandshock on capital investment. We basically follow the regression equation (1) exceptfor the following three modifications. First, the shock dummy we use here equalsone for quarters starting from 2012/Q4 or 2013/Q1, as we think investment decisionsare made in advance. Second, we use observations from 2011/Q1 in order to avoidthe effect of the financial crisis on capital investment. As a result, we have 18 quar-ters in our regressions, and China and non-China specific time trends are includedinto the regressions. Finally, as there is no information about the parental firm in thequarterly data, we drop ln(Capital)p( f )t and ln(Sales)p( f )t from equation (1) and addlog(Employment) f t as one of the explanatory variables into equation (1) instead. Stan-dard errors are still clustered at the country level.
Regression results for using the quarterly data are reported in Table 6 and confirmour previous findings. Depending on the specification, the island shock reduced cap-ital investment of Japanese affiliates in China by 5% to 11% relative to the investmentmade in other countries. Taken all above results together, we conjecture that it is theisland shock that reduced FDI flows from Japan to China and capital investment ofJapanese affiliates in China.
3.2.3. Finding Three: Persistent Effects on Forecast Errors
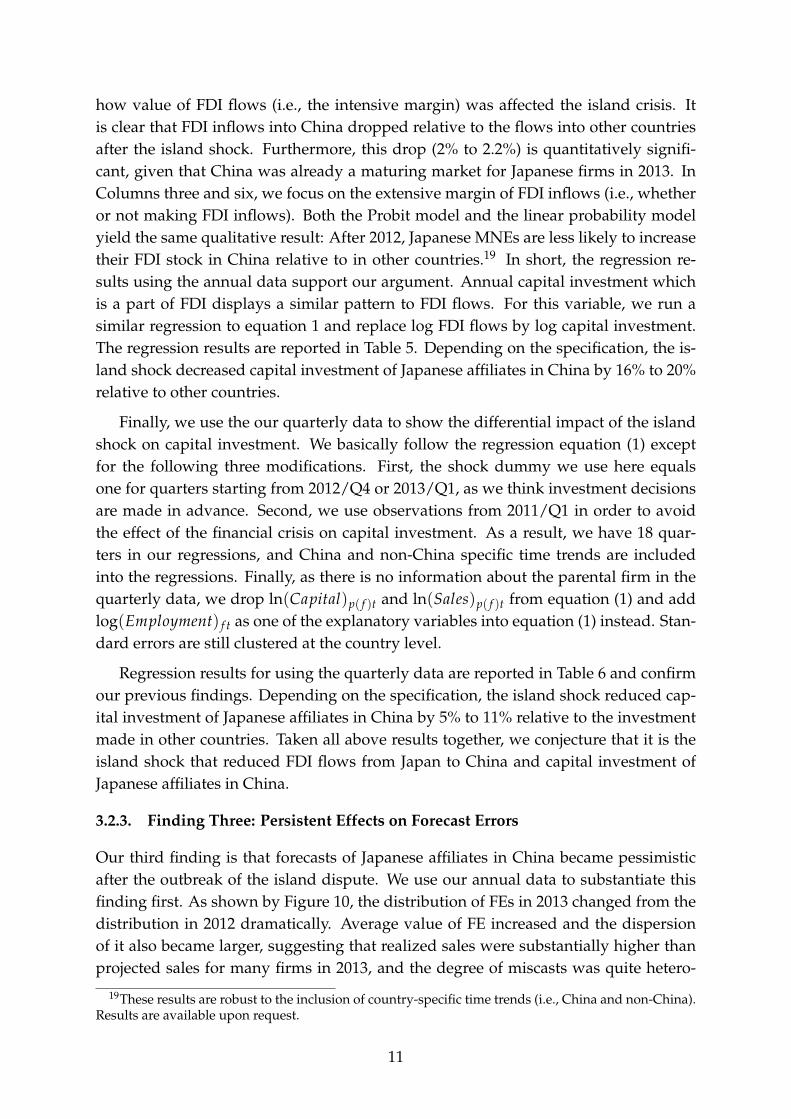
Our third finding is that forecasts of Japanese affiliates in China became pessimisticafter the outbreak of the island dispute. We use our annual data to substantiate thisfinding first. As shown by Figure 10, the distribution of FEs in 2013 changed from thedistribution in 2012 dramatically. Average value of FE increased and the dispersionof it also became larger, suggesting that realized sales were substantially higher thanprojected sales for many firms in 2013, and the degree of miscasts was quite hetero-
19These results are robust to the inclusion of country-specific time trends (i.e., China and non-China).Results are available upon request.
11

geneous. As shown by our first finding, realized sales in 2013 were much higher thanin 2012 and the dispersion of sales distribution was also larger than in 2013. Overall,the quick recovery in sales appears to be unanticipated by the Japanese affiliates inChina, and the recovery pace seems to be heterogeneous across firms as well. As aresult, many projections ended up being less accurate, which suggests the existenceof increased uncertainty when firms made projections in the recovery phase from theisland shock.
Interestingly, the distribution of FEs in 2012 is not too much different from thosein 2011 and 2010, as shown by Figure 10 as well. Although Japanese subsidiaries inChina experienced a large drop in local sales in the third and fourth quarter of 2012,local sales bounced back and exceeded their pre-crisis level in the first quarter of 2013already. This reduced the size of drop in annual sales which makes the distributionof FEs in 2012 not too much different from those in 2011 and 2010. Therefore, thelarge positive values of FEs in 2013 do not necessarily come from the fact that manyfirms missed their forecasts in the previous year, rather they adjusted their forecastsconservatively after the crisis. This implies that Japanese firms in China tried erringon the side of caution.
Since the fluctuation in local sales turned out to be transitory and did not last formore than half a year, we use the quarterly data to confirm our previous findings.Using forecasts made one quarter or two quarters before, Figures 11 and 12 show thefraction of pessimistic firms (i.e., firms that had underestimation for their local sales)and the fraction of optimistic firms (firms that had overestimation for their local sales)across time. Both figures reveal that after the outbreak of the island crisis, Japanesefirms in China began to underestimate their local demand and this pessimism lastsuntil the end of our sample.20 When we look at the evolution of the mean of FEs, thesame result is obtained which is shown by Figure 13. Moreover, the increase in themean of FE (after the island shock) holds for both local sales and sales back to Japan,and is more pronounced for local sales (especially in the short run). This suggests thatthe underestimation and pessimism hold for both demand (i.e., worries for decliningdemand of Chinese consumers in the future) and supply (worries for sabotage by andlow work morale of Chinese employees in the future) in China.
In order to further confirm our previous findings, we run DID regressions now.Specifically, using the annual data, we run the following regression:
log(FE) f t = β0 + β1Shockt ∗ China f + β2 ln(Sales) f t + β3 ln(Capital)p( f )t
+β4 ln(Sales)p( f )t + yeart + countryj + f irm f + ε f t, (2)
20In Figure (11), firms forecast their local sales on quarter before. Since Japanese firms did not an-ticipate the island shock, there were many (and few) firms that overestimated their local sales (andunderestimated their local sales) in 2012/Q3. However, after the shock came in 2012/Q3, the oppositepattern began to appear which is shown by the pattern of FE after 2012/Q4. The reversal of the patternis more pronounced in Figure (12) (note the change from 2012/Q4 to 2013/Q1).
12

where f represents the firm, and t and j denote the year and the country respectively.Subscript p( f ) is the ID of the parental firm of affiliate f . Dummy variable, Shock,takes the value of one if the year is 2013 and zero otherwise. Dummy variable, China,is one if the affiliate is located in China and zero otherwise. Similar to before, we focuson years after the financial crisis and set 2013 as the first year after the island crisis,and standard errors are clustered at the country level as before. Regression results inthe first four columns of Table 7 show that after the island shock, Japanese affiliates inChina became more pessimistic about their local sales and investment in China, whichverifies our findings in Figure 10. Interestingly, the last three columns show that theforecast for sales and investment also become less accurate.
Finally, when we use the quarterly data to run regression equation (2), the samepattern shows up. We basically follow the regression equation (2) except for the fol-lowing three modifications. First, the shock dummy we use here equals one for quar-ters starting from 2012/Q4 or 2013/Q1, as we think belief adjustment might takessome time after the crisis. Second, we use observations from 2011/Q1 in order toavoid the effect of the financial crisis on capital investment. As a result, we have18 quarters in our regressions, and China and non-China specific time trends are in-cluded into the regressions. Finally, as there is no information about the parental firmin the quarterly data, we drop ln(Capital)p( f )t and ln(Sales)p( f )t from equation (2) anduse log(Employment) f t or ln(Sales) f t as the explanatory variable. Standard errors arestill clustered at the country level. Regression results for using the quarterly data arereported in Table 8 and confirm our previous findings.
3.2.4. Finding Four: Impact of Forecasts on Firm Investment
The final finding of this paper is that underestimation of firm sales (i.e., positive fore-cast error) has a negative and quantitatively sizable impact on firm-level investment.In order to substantiate this point, we run regressions of log capital investment onforecast error of total sales and other firm-level characteristics. In order to alleviatethe endogeneity problem, we purposely use the forecast error of firm sales (insteadof capital investment) or one-period lag of it in our regressions. We cluster standarderrors at the firm level, as the variation we explore now is at the firm level. For boththe annual data and the quarterly data, we use the whole time span (i.e., 2003-2013 forthe annual data and 2006Q4-2015Q2 for the quarterly data).
Tables 9 and 10 present our results for using the annual data and the quarterly dataand support the hypothesis that a pessimistic belief reduces capital investment. Inthe annual data, if the firm underestimates its total sales in the future, the probabilityof doing positive investment and the amount of investment in the current year godown, as shown by Tables 9. In the quarterly data, if the forecast error changes from 2(extremely pessimistic) to -2 (extremely optimistic), the capital investment goes up by6% to 8%, as shown by Tables 10.
13

In addition, we also run regressions of firm-level investment on the absolute valueof FE and explore the impact of imprecise forecast on firm investment. In our regres-sions, imprecise forecast for future demand is measured by a bigger absolute value ofFEs. Tables 11 and 12 show that imprecise forecast of firm sales negatively impactsfirm-level investment. Moreover, this negative impact seems to work at the extensivemargin mainly.21 Of course, we cannot claim these relationships are causal. How-ever, these new findings uncover some interesting correlations between firm’s belief,sentiment, and investment.
4. Concluding Remarks
Using data of Japanese MNCs and the sudden escalation of the island dispute betweenChina and Japan in 2012, we provide causal evidence on the effect of a temporary un-certainty shock on long-term business activities. Specifically, we find that a sharp,but temporary fall in local sales of Japanese MNCs in China led to a persistent down-ward deviation of FDI flows from Japan to China from its pre-crisis trend. Moreover,despite the quick recovery of local sales, Japanese MNCs in China persistently under-estimated their local sales which generated pessimism. We view this as evidence for abelief-driven channel through which an unexpected temporary shock leads agents torevise their beliefs and start tail risk hedging.
Nevertheless, much remains to be done. Currently, we are modeling the belief-driven channel proposed above theoretically and exploring its quantitative impact onthe drop of FDI inflows and capital investment of Japanese MNCs in China. In ad-dition, other effects of the island crisis on Sino-Japan economic relationship (e.g., theimpact on the location choice of global value chains) also wait to be explored.
21The first-order movement in the forecast error such as pessimism can also trigger imprecise forecast.Thus, we cannot identify the pure effect of increased variance of forecast error on firm investment, aswe do not have a distribution of FEs for each firm in a given time.
14

5. Acknowledgement
We are grateful to the Ministry of Economy, Trade and Industry (METI) for provid-ing the micro-data of the Basic Survey of Japanese Business Structure and Activities(BSJBSA), the Basic Survey on Overseas Business Activities (BSOBA), and the Quar-terly Survey of Overseas Subsidiaries (QSOS). This research was conducted under theproject “Data Management” at the Research Institute of Economy, Trade and Industry(RIETI).
15

6. Reference
1. Abel, Andrew B., and Janice C. Eberly (1996): “Optimal investment with costlyreversibility,” Review of Economic Studies, 63(4): 581-593.
2. Bachmann, Rudiger and Christian Bayer (2014): “Investment Dispersion and theBusiness Cycle,” American Economic Review 104(4): 1392-1416.
3. Bachmann, Ruediger, Steffen Elstner, and Erik R. Sims (2013): “Uncertainty andEconomic Activity: Evidence from Business Survey Data,” American EconomicJournal: Macroeconomics 5(2): 217-249.
4. Baker, Scott R., Nicholas Bloom, and Steve J. Davis (2012): “Measuring EconomicPolicy Uncertainty,” Unpublished manuscript, Stanford University.
5. Baker, Scott R., and Nicholas Bloom (2013): “Does Uncertainty Drive BusinessCycles? Using Disasters as Natural Experiments,” NBER working paper 19475.
6. Bernanke, Ben. S. (1983): “Irreversibility, Uncertainty, and Cyclical Investment,”Quarterly Journal of Economics, 98(1): 85-106.
7. Bloom, Nicholas (2009): ”The Impact of Uncertainty Shocks,” Econometrica 77(3):623-685.
8. Bloom, Nicholas (2014): “Fluctuations in Uncertainty,” Journal of Economic Per-spectives, 28(2): 153-76.
9. Bloom, Nicholas, Stephen Bond, and John Van Reenen (2007): “Uncertainty andInvestment Dynamics,” Review of Economic Studies 74(2): 391-415.
10. Bloom, Nicholas and Floetotto, Max and Jaimovich, Nir and Saporta Eksten, Itayand Terry, Stephen (2012): “Really Uncertain Business Cycles,” NBER workingpaper 18245.
11. Boehm, Christoph, Aaron Flaaen, and Nitya Pandalai Nayar (2014): “Input Link-ages and the Transmission of Shocks: Firm-Level Evidence from the 2011 TohokuEarthquake,” Unpublished manuscript, University of Michigan.
12. Carballo, Jeromino (2015): “Global Sourcing Under Uncertainty,” Unpublishedmanuscript, University of Colorado.
13. Dixit, Avinash K., and Robert S. Pindyck (1994): “Investment under Uncertainty,”Princeton University Press.
14. Fisman, Raymond J., Yasushi Hamao, and Yongxiang Wang (2014): “National-ism and Economic Exchange: Evidence from Shocks to Sino-Japanese Relations,”Review of Financial Studies, 27(9): 2626-2660.
15. Fuchs, Andreas, and Nils-Hendrik Klann (2013): “Paying a Visit: The Dalai LamaEffect on International Trade,” Journal of International Economics, 91(1): 164-177.
16. Guiso, Luigi, and Giuseppe Parigi (1999): “Investment and Demand Uncertainly,”Quarterly Journal of Economics 114(1): 185-227.
16

17. Gulen, Huseyin and Mihai Ion (2015): “Policy Uncertainty and Corporate Invest-ment,” Review of Financial Studies forthcoming.
18. Handley, Kyle (2014): “Exporting Under Trade Policy Uncertainty: Theory andEvidence,” Journal of International Economics 94: 50-66.
19. Handley, Kyle, and Nuno Limao (2014): “Policy Uncertainty, Trade and Welfare:Theory and Evidence for China and the U.S.” NBER working paper 19376.
20. Handley, Kyle, and Nuno Limao (2015): “Trade and Investment under PolicyUncertainty: Theory and Firm Evidence,” American Economic Journal: EconomicPolicy 7(4): 189-222.
21. Kehrig, Matthias (2011): “The Cyclicality of Productivity Dispersion,” WorkingPapers 11-15, Center for Economic Studies, U.S. Census Bureau.
22. Kozlowski, Julian, Laura Veldkamp, and Venky Venkateswaran (2015): “The Tailthat Wags the Economy: Belief-Driven Business Cycles and Persistent Stagna-tion,” NBER working paper 21719.
23. Leahy, John, and Toni Whited (1996): “The Economic Effect of Uncertainty onInvestment: Some Stylized Facts,” Journal of Money, Credit and Banking, 28(1): 64-83.
24. Morikawa, Masayuki (2013): “What Type of Policy Uncertainty Matters for Busi-ness?” Discussion papers 13076, Research Institute of Economy, Trade and In-dustry (RIETI).
25. Morikawa, Masayuki (2016): “Policy Uncertainty: Evidence from survey data (inJapanese),” Discussion papers 16005, Research Institute of Economy, Trade andIndustry (RIETI).
26. Novy, Dennis, and Alan M. Taylor (2014): “Trade and Uncertainty,” Unpublishedmanuscript, University of Warwick.
27. Orlik, Anna, and Laura Veldkamp (2015): “Understanding Uncertainty Shocksand the Role of Black Swans,” Unpublished manuscript, New York University.
28. Senga, Tatsuro (2015): “A New Look at Uncertainty Shocks: Imperfect Informa-tion and Misallocation,” Unpublished manuscript, Queen Marry University ofLondon.
29. Stein, Luke C.D. and Elizabeth Stone (2013): “The Effect of Uncertainty on Invest-ment, Hiring, and R&D: Causal Evidence from Equity Options,” Unpublishedmanuscript, Arizona State University.
17

7. Tables
Table 1. Correlation between different forecasts
F1sales F2salesF1local sales 0.816F2local sales 0.821F1: Forecast made one quarter before.F2: Forecast made two quarters before.
Table 2. Correlation between FEs made in different quarters
FE2local salesFE1local sales 0.380FE1: Error of forecast made one quarter before.FE2: Error of forecast made two quarters before.
Table 3. Forecast becomes more precise when time elapses
obs. Mean|FE1local sales| 89615 0.669|FE2local sales| 85027 0.768FE1: Error of forecast made one quarter before.FE2: Error of forecast made two quarters before.
18

Table 4. Annual FDI Flows and the Island Shock: Negative Impact
OLS Probit LPMFDI FlowsFDI Stock IFDI>0 IFDI>0
Shockt ∗ China f -0.0229∗∗∗ -0.0203∗∗∗ -0.113∗∗∗ -0.118∗∗∗ -0.0168∗∗∗ -0.0184∗∗∗
(-3.93) (-3.49) (-5.11) (-5.15) (-3.23) (-3.86)Year F.E. Yes Yes Yes Yes Yes YesCountry F.E. Yes Yes Yes Yes Yes YesFirm F.E. Yes Yes No No Yes YesIndustry F.E. No No Yes Yes No NoTime span 2011-2013 2010-2013 2011-2013 2010-2013 2011-2013 2010-2013Year after shock 2013 2013 2013 2013 2013 2013N 45527 59360 46970 61179 47242 61473adj. R2 0.087 0.074 - - 0.238 0.209t statistics in parentheses∗ p < 0.10, ∗∗ p < 0.05, ∗∗∗ p < 0.01Standard errors are clustered at the country level.Top and bottom one percent obs. of FDI Flows
FDI Stock are winsored.Unit for investment and sales: one million JPY.Parent-level Control: log(sales) and log(capital).Affiliate-level Control: log(sales).
8. Figures
19

Table 5. Annual Capital Investment and the Island Shock: Negative Impact
OLS Probit LPMLog(investment) IInvestment>0 IInvestment>0
Shockt ∗ China f -0.164∗∗∗ -0.200∗∗∗ -0.128∗∗∗ -0.147∗∗∗ -0.0199∗∗∗ -0.0264∗∗∗
(-2.82) (-4.08) (-9.67) (-10.59) (-4.24) (-5.31)Year F.E. Yes Yes Yes Yes Yes YesCountry F.E. Yes Yes Yes Yes Yes YesFirm F.E. Yes Yes No No Yes YesIndustry F.E. No No Yes Yes No NoTime span 2011-2013 2010-2013 2011-2013 2010-2013 2011-2013 2010-2013Year after shock 2013 2013 2013 2013 2013 2013N 28022 36278 40180 52036 40268 52133adj. R2 0.799 0.786 - - 0.680 0.658t statistics in parentheses∗ p < 0.10, ∗∗ p < 0.05, ∗∗∗ p < 0.01Standard errors are clustered at the country level.Top and bottom one percent obs. of Log(investment) are winsored.Unit for investment and sales: one million JPY.Parent-level Control: log(sales) and log(capital).Affiliate-level Control: log(sales).
Table 6. Quarterly Capital Investment and the Island Shock: Negative Impact
(1) (2) (3) (4) (5) (6)linv1 linv1 linv1 linv1 linv linv
Shockt ∗ China f -0.0529∗∗ -0.0555∗∗ -0.105∗∗∗ -0.105∗∗∗ -0.114∗∗∗ -0.107∗∗∗
(-2.20) (-2.26) (-4.89) (-5.05) (-3.12) (-2.95)
log(sales) 0.252∗∗∗ 0.167∗∗∗ 0.252∗∗∗ 0.167∗∗∗ 0.298∗∗∗ 0.168∗∗∗
(13.59) (8.05) (13.57) (8.03) (9.70) (6.13)
log(employment) 0.460∗∗∗ 0.459∗∗∗ 0.555∗∗∗
(7.79) (7.79) (7.78)Quarterly F.E. Yes Yes Yes Yes Yes YesCountry F.E. Yes Yes Yes Yes Yes YesFirm F.E. Yes Yes Yes Yes Yes YesTime after shock 2012Q4- 2012Q4- 2013Q1- 2013Q1- 2013Q1- 2013Q1-N 82215 82103 82215 82103 48890 48890adj. R2 0.696 0.697 0.696 0.697 0.644 0.647t statistics in parentheses∗ p < 0.10, ∗∗ p < 0.05, ∗∗∗ p < 0.01Standard errors are clustered at the country level.linv=log(capital investment); linv1=log(capital investment+1)Unit for investment and sales: one million JPY.Top and bottom one percent obs. are winsored.China and non-China specific linear time trends are included.Time span: 2011/Q1-2015/Q2.
20

Tabl
e7.
Fore
cast
Erro
rsof
Ann
ualS
ales
and
Inve
stm
ent:
Mor
ePe
ssim
istic
and
Less
Acc
urat
eaf
ter
the
Isla
ndC
risi
s
(1)
(2)
(3)
(4)
(5)
(6)
(7)
FEsa
les
FEin
v|F
Ein
v||F
Esa
les|
Shoc
k t∗
Chi
naf
0.03
85∗∗
0.03
78∗∗∗
0.14
1∗∗∗
0.17
7∗∗
0.12
8∗∗
0.15
9∗∗
0.01
06(2
.22)
(2.6
8)(2
.65)
(2.3
9)(2
.45)
(2.2
3)(1
.03)
Affi
liate
Con
trol
--
log(
sale
s)lo
g(sa
les)
log(
sale
s)lo
g(sa
les)
-Ye
arF.
E.Ye
sYe
sYe
sYe
sYe
sYe
sYe
sC
ount
ryF.
E.Ye
sYe
sYe
sYe
sYe
sYe
sYe
sFi
rmF.
E.Ye
sYe
sYe
sYe
sYe
sYe
sYe
sTi
me
span
2010
-201
320
11-2
013
2010
-201
320
11-2
013
2010
-201
320
11-2
013
2010
-201
3Ye
araf
ter
shoc
k20
1320
1320
1320
1320
1320
1320
13N
4062
731
054
2066
015
707
2066
015
707
4062
7ad
j.R
20.
229
0.25
10.
117
0.09
00.
119
0.08
90.
304
tsta
tist
ics
inpa
rent
hese
s∗
p<
0.10
,∗∗
p<
0.05
,∗∗∗
p<
0.01
Stan
dard
erro
rsar
ecl
uste
red
atth
eco
untr
yle
vel.
Top
and
bott
omon
epe
rcen
tobs
.are
win
sore
d.FE
sale
s=(r
ealiz
edsa
le-p
roje
cted
sale
s)/p
roje
cted
sale
s.FE
inv=
(rea
lized
capi
tali
nves
tmen
t-pr
ojec
ted
capi
tali
nves
tmen
t)/p
roje
cted
capi
tali
nves
tmen
t.Pa
rent
Con
trol
:log
(sal
es)a
ndlo
g(ca
pita
l).
21

Table 8. Forecast Errors of Local Sales and the Island Shock: More Pessimistic After Shock
(1) (2) (3) (4) (5) (6)FE1 FE1 FE2 FE2 FE2 FE2
Shockt ∗ China f 0.147∗∗∗ 0.0582 0.274∗∗∗ 0.257∗∗∗ 0.353∗∗∗ 0.308∗∗∗
(2.72) (1.37) (2.79) (2.99) (3.27) (3.55)Quarterly F.E. Yes Yes Yes Yes Yes YesCountry F.E. Yes Yes Yes Yes Yes YesFirm F.E. Yes Yes Yes Yes Yes YesFirm-level Control log(sales) log(sales) log(sales) log(sales) log(emp) log(emp)Belief adjusts from 2013Q1- 2012Q4- 2013Q1- 2012Q4- 2013Q1- 2012Q4-N 49666 49666 48257 48257 48506 48506adj. R2 0.065 0.065 0.112 0.112 0.069 0.069t statistics in parentheses∗ p < 0.10, ∗∗ p < 0.05, ∗∗∗ p < 0.01Standard errors are clustered at the country level.Top and bottom one percent obs. are winsored.China and non-China specific linear time trends are included.Time span: 2011/Q1-2015/Q2.FE1: error of forecast made one period before.FE2: error of forecast made two periods before.
Table 9. Forecast Error and Annual Capital Investment: Negative Impact
Probit OLSIinvestment>0 linv1
FEsales -0.117∗∗∗ -0.113∗∗∗ -0.0382∗∗ -0.0375∗∗
(-9.31) (-9.03) (-2.32) (-2.29)Affiliate Control log(sales) log(sales) log(sales) log(sales)Parent Control log(sales) - log(sales) -Year F.E. Yes Yes Yes YesCountry F.E. Yes Yes Yes YesFirm F.E. - - Yes YesIndustry F.E. Yes Yes - -N 86953 87405 87063 87516adj. R2 - - 0.766 0.766t statistics in parentheses∗ p < 0.10, ∗∗ p < 0.05, ∗∗∗ p < 0.01Standard errors are clustered at the firm level.linv1=log(capital investment+1)FEsales=(realized sale-projected sales)/projected sales.Time span: 2003-2013.
22

Table 10. Pessimistic Forecast Leads to Lower Level of Investment
(1) (2) (3) (4) (5) (6)linv linv1 linv linv1 linv linv1
sales_ f r_l1 -0.0174∗∗∗ -0.0163∗∗∗
(-2.92) (-2.78)
sales_ f r_l2 -0.0148∗∗ -0.0159∗∗∗
(-2.45) (-2.71)
lag sales_ f r_l1 -0.0193∗∗∗ -0.0125∗∗
(-3.33) (-2.38)Quarterly F.E. Yes Yes Yes Yes Yes YesCountry F.E. Yes Yes Yes Yes Yes YesFirm F.E. Yes Yes Yes Yes Yes YesN 64269 88717 60276 83874 69357 103312adj. R2 0.580 0.610 0.579 0.607 0.593 0.630t statistics in parentheses∗ p < 0.10, ∗∗ p < 0.05, ∗∗∗ p < 0.01Standard errors are clustered at the firm level.Top and bottom one percent obs. are winsored.Time span: 2006/Q4-2015/Q2.linv=log(capital investment); linv1=log(capital investment+1)Firm-level controls: log(sales) and log(employment).sales_ f r_l1: error of forecast (of total sales) made one period before.lag sales_ f r_l1: lagged forecast error (one period ahead)
Table 11. Imprecise Forecast and Capital Investment (Annual Data): Negative Impact at the ExtensiveMargin
Probit LPMIinvestment>0
Abs.(FEsales) -0.163∗∗∗ -0.159∗∗∗ -0.00753∗ -0.00697(-10.77) (-10.60) (-1.65) (-1.53)
Affiliate Control log(sales) log(sales) log(sales) log(sales)Parent Control log(sales) - log(sales) -Year F.E. Yes Yes Yes YesCountry F.E. Yes Yes Yes YesFirm F.E. - - Yes YesIndustry F.E. Yes Yes - -N 86953 87405 87066 87519adj. R2 - - 0.591 0.591t statistics in parentheses∗ p < 0.10, ∗∗ p < 0.05, ∗∗∗ p < 0.01Standard errors are clustered at the firm level.FEsales=(realized sale-projected sales)/projected sales.Time span: 2003-2013.
23

Table 12. Imprecise Forecast and Capital Investment (Quarterly Data): Negative Impact at the Exten-sive Margin
(1) (2) (3) (4)linv1 linv1 linv1 linv1
abs(sales_ f r_l1) -0.0366∗∗∗
(-4.23)
abs(sales_ f r_l2) -0.0282∗∗∗
(-3.20)
lag abs(sales_ f r_l1) -0.0167∗
(-1.95)
lag abs(sales_ f r_l2) -0.0215∗∗
(-2.40)Quarterly F.E. Yes Yes Yes YesCountry F.E. Yes Yes Yes YesFirm F.E. Yes Yes Yes YesN 88717 83874 84940 80214adj. R2 0.610 0.607 0.609 0.604t statistics in parentheses∗ p < 0.10, ∗∗ p < 0.05, ∗∗∗ p < 0.01Standard errors are clustered at the firm level.Top and bottom one percent obs. are winsored.Time span: 2006/Q4-2015/Q2.linv1=log(capital investment+1)Firm-level controls: log(sales) and log(employment).sales_ f r_l1: error of forecast (of total sales) made one period before.lag sales_ f r_l1: lagged forecast Error (one period ahead)
24

Figure 1. Share of FDI Flows from Japan
0
.1
.2
2009q1 2010q3 2012q1 2013q3 2015q1
Total FDI Manufacturing FDINonmanufacturing FDI
Japan's share in China FDI inflow
The island shock happened in the third quarter of 2012 (i.e., the second red vertical line). Data areobtained from the Bank of Japan.
25

Figure 2. Share of Japanese Imports
.05
.1
.15
.2
2000m1 2005m1 2010m1 2015m1
Japan's share in China's Total Imports
The last red vertical line corresponds to the month when the large scale anti-Japanese demonstrationshappened. Data are obtained from Japanese customs.
26

Figure 3. Local sales in China dropped in 2012 Q3 and 2012 Q4 after the burst of the island dispute
-.4-.2
0.2
2006q1 2009q1 2012q1 2015q1
Constructed from the Quarterly Survey of Overseas Subsidiaries released by the Ministry of Economy,Trade and Industry. Two series are HP-filtered log local sales of subsidiaries of Japanese multinationalfirms: Blue solid line is for China and red dashed line is for all other countries. Both are in US dollars.
27

Figure 4. Distribution of Quarterly Growth Rate of Local Sales
Plotted from our unbalanced panel using the Quarterly Survey of Overseas Subsidiaries released by theMinistry of Economy, Trade and Industry. Observations with growth rate lower than −100% or higherthan 100% are excluded.
28

Figure 5. Distribution of Annual Growth Rate of Local Sales
Plotted from our unbalanced panel using the firm-level data of the Survey of Overseas Business Activ-ities released by the Ministry of Economy, Trade and Industry. Observations with growth rate lowerthan −100% or higher than 300% are excluded.
29

Figure 6. Aggregate FDI flows from Japan to China and to Other Countries
78
910
11
2006q1 2008q3 2011q1 2013q3 2016q1
-2-1
01
2
2006q1 2008q3 2011q1 2013q3 2016q1
Constructed from the dataset called Japan’s Outward and Inward Foreign Direct Investment reportedby the The Japan External Trade Organisation. The left panel shows log series of FDI flows from Japanto China (blue solid line) and the other countries (red dashed line). Both are in US dollars. Since theMinistry of Finance and the Bank of Japan revised the balance of payments statistics and thus the dataseries is disconnected around January 2014. The right panel shows the annual change rate of FDI flowscalculated as log(FDIt)− log(FDIt−4) where t denotes the quarter.
30

Figure 7. Evolution of Log FDI flows
.85
.9.9
51
1.05
1.1
2012q1 2013q1 2014q1 2015q1 2016q1
Constructed from the data called Japan’s Outward and Inward Foreign Direct Investment reported bythe The Japan External Trade Organisation. Blue solid line plots log series of FDI flows from Japaninto China. Red line plots log series of FDI flows from Japan into all other countries. We normalizelog(FDI) in 2012Q1 to one and both are in US dollars. Since the Ministry of Finance and the Bank ofJapan revised the balance of payments statistics and thus the data series is disconnected around January2014.
31

Figure 8. FDI inaction increases and positive FDI flows decreases
.2.3
.4.5
.6.7
2003 2005 2007 2009 2011 2013
Constructed from our unbalanced panel using the firm-level data of the Survey of Overseas BusinessActivities released by the Ministry of Economy, Trade and Industry. Blue solid line plots the populationshare of firms that undertake positive FDI in China. Red dashed line plots the population share of firmsthat report zero FDI inflows. The fractions are calculated amongst total number of Japanese subsidiariesin China.
32

Figure 9. FDI entry decreases and FDI exit increases
0.0
2.0
4.0
6.0
8
2003 2005 2007 2009 2011 2013
Constructed from our unbalanced panel using the Survey of Overseas Business Activities released bythe Ministry of Economy, Trade and Industry. Blue solid line plots the population share of firms thatenter by undertaking the initial FDI into China during each year. Red dashed line plots the populationshare of firms that report exit in the previous year. The fractions are calculated amongst total number ofJapanese subsidiaries in China.
33

Figure 10. Distribution of Forecast Errors of Annual Total Sales
Constructed from our unbalanced panel using the Survey of Overseas Business Activities released bythe Ministry of Economy, Trade and Industry. Forecast error is calculated as Realized Sales−Projected Sales
Projected Sales .Therefore, any positive value of forecast error implies that a firm underestimates its sales and vice versa.
34

Figure 11. Underestimation and Overestimation of Local Sales (Forecast Made One Quarter Before)
.1.2
.3.4
.5.6
2007q1 2009q1 2011q1 2013q1 2015q1
Constructed from our unbalanced panel using the Quarterly Survey of Overseas Subsidiaries releasedby the Ministry of Economy, Trade and Industry. Forecast errors are defined over the grid points [-2,-1, 0, +1, +2], being calculated as (up(+1), down(-1) or unchanged(0): realized changes in local sales) -(up(+1), down(-1) or unchanged(0): projected changes in local sales). Red dashed line plots the fractionof firms whose forecast error is greater than or equal to +1. Blue solid line plots the fraction of firmswhose forecast error is smaller than or equal to -1. White dashed line plots the fraction of firms whoseforecast error is zero. The red vertical bar denotes 2012/Q3.
35

Figure 12. Underestimation and Overestimation of Local Sales (Forecast Made Two Quarters Before)
.1.2
.3.4
.5.6
2007q1 2009q1 2011q1 2013q1 2015q1
Constructed from our unbalanced panel using the Quarterly Survey of Overseas Subsidiaries releasedby the Ministry of Economy, Trade and Industry. Forecast errors are defined over the grid points [-2,-1, 0, +1, +2], being calculated as (up(+1), down(-1) or unchanged(0): realized changes in local sales) -(up(+1), down(-1) or unchanged(0): projected changes in local sales). Red dashed line plots the fractionof firms whose forecast error is greater than or equal to +1. Blue solid line plots the fraction of firmswhose forecast error is smaller than or equal to -1. White dashed line plots the fraction of firms whoseforecast error is zero. The red vertical bar denotes 2012/Q4.
36

Figure 13. Cross-sectional Average of Forecast Error for Local Sales and Sales to Japan (Forecast MadeTwo Quarters Before)
-.3
-.2
-.1
0.1
.2
2007q1 2009q1 2011q1 2013q1 2015q1
Constructed from our unbalanced panel using the Quarterly Survey of Overseas Subsidiaries releasedby the Ministry of Economy, Trade and Industry. Forecast errors are defined over the grid points [-2, -1,0, +1, +2], being calculated as (up(+1), down(-1) or unchanged(0): realized changes in sales) - (up(+1),down(-1) or unchanged(0): projected changes in sales). Red dashed line plots the evolution of the meanof FE for sales back to Japan. Blue solid line plots the evolution of the mean of FE for local sales. The redvertical bar denotes 2012/Q4.
Figure 14. Summary Statistics of the Basic Survey on Overseas Business Activities
37

Figure 15. Summary Statistics of the Quarterly Survey of Overseas Subsidiaries
Figure 16. Log Employment of Reporting and Non-reporting Observations (for forecasts made twoquarters in advance)
0.1
.2.3
.4D
ensi
ty
0 5 10Log employment
total missing total non-missingChina missing China non-missing
Density Plot of Employment
Non-reporting observations have higher levels of employment on average. However, this pattern is thesame for Japanese affiliates in China as for all Japanese affiliates abroad.
38

Figure 17. Log Sales of Reporting and Non-reporting Observations (for forecasts made two quarters inadvance)
0.1
.2.3
Den
sity
0 5 10 15Log total sales
total missing total non-missingChina missing China non-missing
Density Plot of Log total sales
Non-reporting observations have higher levels of (real) sales on average. However, this pattern is thesame for Japanese affiliates in China as for all Japanese affiliates abroad.
39