policy uncertainty and international financial markets ... · ruhr economic papers #657 ansgar...
TRANSCRIPT
RUHRECONOMIC PAPERS
Policy Uncertainty and International Financial Markets: The Case of Brexit
#657
Ansgar Belke
Irina Dubova
Thomas Osowski
Imprint
Ruhr Economic Papers
Published by
Ruhr-Universität Bochum (RUB), Department of Economics Universitätsstr. 150, 44801 Bochum, Germany
Technische Universität Dortmund, Department of Economic and Social Sciences Vogelpothsweg 87, 44227 Dortmund, Germany
Universität Duisburg-Essen, Department of Economics Universitätsstr. 12, 45117 Essen, Germany
RWI Leibniz-Institut für Wirtschaftsforschung Hohenzollernstr. 1-3, 45128 Essen, Germany
Editors
Prof. Dr. Thomas K. Bauer RUB, Department of Economics, Empirical Economics Phone: +49 (0) 234/3 22 83 41, e-mail: [email protected]
Prof. Dr. Wolfgang Leininger Technische Universität Dortmund, Department of Economic and Social Sciences Economics – Microeconomics Phone: +49 (0) 231/7 55-3297, e-mail: [email protected]
Prof. Dr. Volker Clausen University of Duisburg-Essen, Department of Economics International Economics Phone: +49 (0) 201/1 83-3655, e-mail: [email protected]
Prof. Dr. Roland Döhrn, Prof. Dr. Manuel Frondel, Prof. Dr. Jochen Kluve RWI, Phone: +49 (0) 201/81 49-213, e-mail: [email protected]
Editorial Office
Sabine Weiler RWI, Phone: +49 (0) 201/81 49-213, e-mail: [email protected]
Ruhr Economic Papers #657
Responsible Editor: Volker Clausen
All rights reserved. Bochum, Dortmund, Duisburg, Essen, Germany, 2016
ISSN 1864-4872 (online) – ISBN 978-3-86788-763-2The working papers published in the Series constitute work in progress circulated to stimulate discussion and critical comments. Views expressed represent exclusively the authors’ own opinions and do not necessarily reflect those of the editors.

Ruhr Economic Papers #657
Ansgar Belke, Irina Dubova, and Thomas Osowski
Policy Uncertainty and International Financial Markets: The Case of Brexit

Bibliografische Informationen der Deutschen Nationalbibliothek
Die Deutsche Bibliothek verzeichnet diese Publikation in der deutschen National-bibliografie; detaillierte bibliografische Daten sind im Internet über: http://dnb.d-nb.de abrufbar.
http://dx.doi.org/10.4419/86788763ISSN 1864-4872 (online)ISBN 978-3-86788-763-2
Ansgar Belke, Irina Dubova, and Thomas Osowski1
Policy Uncertainty and International Financial Markets: The Case of Brexit
AbstractThis study assesses the impact of the uncertainty caused by Brexit, on both the UK and international financial markets, for the first and second statistical moments (i.e. on changes and the standard deviations of the respective variables.) As financial markets are by nature highly interlinked, one might expect that the uncertainty engendered by Brexit also has an impact on financial markets in several other countries. By analysing the impact of Brexit on financial markets, we might also gain some insights into market expectations about the magnitude of the economic impact beyond the UK and which other country might be most affected. For this purpose, we first use both the Diebold and Yilmaz (2012) and the Hafner and Herwartz (2008) method to estimate the time-varying interactions between UK policy uncertainty, which to a large extent is attributed to uncertainty about Brexit, and UK financial market volatilities (second statistical moment) and try to identify the direction of causality among them. Second, we use two other measures of the perceived probability of Brexit before the referendum, namely daily data released by Betfair and results of polls published by Bloomberg. Based on these datasets, and using both panel and single-country SUR (seemingly unrelated regressions) estimation methods, we analyse the Brexit effect on levels of stock returns, sovereign credit default swaps (CDS), 10-year interest rates in 19 predominantly European countries, and those of the British pound and the euro (first statistical moment). We show that Brexit-induced policy uncertainty will continue to cause instability in key financial markets and has the potential to damage the real economy in both the UK and other European countries, even in the medium run. The main losers outside the UK are the ‘GIIPS’ economies: Greece, Ireland, Italy, Portugal and Spain.
JEL Classification: C58, D81, E44, F36, G15
Keywords: Brexit; causality tests; financial instability; Pound sterling; uncertainty; spillovers
October 2016
1 Ansgar Belke, UDE, Centre for European Policy Studies (CEPS), Brussels, and Institute for the Study of Labor (IZA), Bonn; Irina Dubova, RGS Econ and UDE; Thomas Osowski, UDE. – All correspondence to: Thomas Osowski, University of Duisburg-Essen, Universitätsstraße 12, 45117 Essen, Germany, e-mail: [email protected]

-4-
Introduction
The majority of the British citizens has decided that the UK will leave the European Union
(EU) in the near future. Although the result was very close, the supporters of the leave campaign
led by Boris Johnson and Nigel Farage have succeeded. However, it could be seen as a political
disaster for the EU as the first country ever is going to actually leave. Several institutions,
academics, and politicians have warned of negative economic effects for the UK and the Euro-
pean countries alike, arguing that Britain leaving the EU would generate a “lose-lose” situa-
tion.2
As Brexit can surely be regarded as the most significant political issue in the first half of 2016,
poll updates, as well as the actual result on 24th of June, greatly affected international financial
markets (European Commission, 2016). As financial markets are highly linked in general and
several countries apart from the UK might be negatively affected, one may feel legitimized to
expect that Brexit does not only have an impact on financial markets in Britain. By analyzing
the impact of Brexit on financial markets, we might also get some insights about market’s ex-
pectations about the magnitude of the economic impact beyond the UK and which country be-
yond the UK may be mostly affected.
In our view, the topic is too complex to just check for trade and financial linkages in order to
determine the most affected countries partly because the institutional framework of the EU and
the Euro area has generated additional dependencies between countries. According to the divi-
dend discount model (Gordon and Shapiro, 1956), expectations about future effects on the real
economy generated by Brexit will immediately affect stock returns and several other financial
market variables. Therefore, we give a short overview of the possible effects of enduring Brexit
uncertainty on the UK’s and other countries’ real economy, particularly the remaining EU coun-
tries. Of course, an increase in policy uncertainty itself can be expected to affect financial mar-
kets as well. Among others, these kinds of uncertainty typically lead to option value effects, i.e.
a “wait-and-see attitude” with investment-type decisions.
We also have to address the discussion in the literature of whether and why volatility means
uncertainty. In the empirical part of this paper, we use actual asset price changes instead of only
unanticipated ones, but at the monthly horizon, the anticipated change is usually close to zero.
Hence actual and unanticipated changes should give the same results and we feel legitimized
2 For a survey of the related arguments see, for instance, London School of Economics (2016). Fears of Brexit do not come by chance but have been indicated by systematic differences in monetary policies on both sides of the channel. See D’Addona and Musumeci (2011).

-5-
to strictly follow, for instance, Belke and Gros (2002) and use also historical volatilities (i.e.
the standard deviation) or GARCH estimates as measures of uncertainty.
So our interest is in the direction of spillovers among policy uncertainty and financial market
volatilities in the UK itself. Our second research question is whether we can expect contagion
from the UK to other countries not only through the political and institutional channel, for
instance, other EU member countries also asking “Why can’t we also be exceptions?” For this
purpose, we also empirically check for spillovers of Brexit uncertainty to a variety of asset
classes on international financial markets (Begg, 2016).
The remainder of this paper is organized as follows. The next section provides a brief overview
of the possible effects of enduring Brexit uncertainty on the UK and other countries’ real econ-
omy. In Section 3, we investigate the effect of Brexit on UK financial market volatilities. Our
main focus is on the Diebold and Yilmaz (2009) and the Hafner and Herwartz (2004, 2008)
method to estimate spillovers of policy uncertainty on financial volatility (second statistical
moment). What is more, we try to identify the direction of causality among them. In section 4,
we empirically assess the impact of Brexit on international financial markets and a variety of
asset categories (first statistical moment), employing both panel as well as single-country SUR
estimation methods. Section 5 finally concludes.
1. Potential effects of enduring Brexit uncertainty on the UK’s and other
countries’ real economy
Leaving the EU can be expected to have large implications for the British economy through the
following channels: trade in goods and services, investment, immigration, productivity and fis-
cal costs.3 As Brexit is a political novelty, it is very difficult to estimate the effect of each
channel as well as the overall impact on the British economy. Uncertainty around the effects is
further increased by the fact that the British government and the EU will have to completely
reevaluate the political and economic relationship. Furthermore, the British government will
have to make significant political decisions e.g. regarding prudential and regulatory laws.
As a starting point of our empirical study, it is important to note that, except for a weaker pound
and lower UK interest rates, the referendum has not caused much of an enduring impact (Gros,
2016). Financial markets tumbled for a couple of weeks after the referendum, but have recov-
ered since then. Consumer spending remains rather stable. Even more surprisingly, investment
3 In the following, we do not discuss the various arguments surrounding immigration and fiscal costs. For a broad survey on the potential economic impacts of Brexit see IMF (2016).
-6-
has remained relatively constant, in spite of significant uncertainty about Britain’s future trade
relations with the EU. So, have the costs of Brexit been overblown? One may argue that “(t)he
United Kingdom’s vote to ‘Brexit’ the EU is of course to become the year’s biggest non-event”
(Gros, 2016). But how to explain the current lack of impact? It may just be because Brexit has
not yet happened (Begg, 2016). Hence, a big economic impact of Brexit can still not be ex-
cluded for the future. Furthermore, CEIC Data for July 2016 already indicates that business and
consumer confidence has declined by about 4% and 12% respectively.
Regarding the trade channel, the most important aspect is the fact that the UK will most prob-
ably lose its access to the European Single Market. The EU is the most important trading partner
of the UK. Nearly half of UK exports in goods and services are delivered into the EU (approx.
13% of UK GDP in 2014). Apart from an absence of tariffs, the single market guarantees the
principle of mutual recognition and the so-called “single passport” - a system which allows
services operators legally established in one member state to provide their services in the other
member states without further authorization requirements (EC, 2016). Therefore, non-European
firms can set up headquarters in the UK in order to access the single market and offer their
services in the entire EU. The financial sector is a key component of the UK economy with
London being one of the largest financial centers in the world.4 Financial services generate
about 8 percent of national income (EU average: nearly 5%), trade in financial services alone
is about 3% of the nominal GDP in 2014 (EU average: nearly 1%). and 40% of total financial
service exports are exported to the EU. The financial center of London would lose significantly
in terms of attractiveness as it could no longer generate access to the European Single Market.5
The effects will crucially depend on the results of the negotiations between the UK and EU
about the future economic (and political) relationship. If the UK keeps its access to the single
market, the effects via trade might be small.6 However, in the worst scenario, the trade relation-
ship default to the WTO framework, if no alternative agreement is reached (Blockmans and
Emerson, 2016). In that event, it appears to be highly probable that trading linkages between
the UK and the EU will be weakened or even disrupted, generating decreases in UK incomes
4 UK is the world leader in fixed-income and derivatives transactions and far ahead of EU peers in private equity, hedge funds, and cross-border bank lending (Bank of England, 2015). The UK’s insurance industry is the largest in Europe and the third largest in the world. 5 Several asset managing companies (e.g. M&G, Columbia Threadneedle) and several banks have expressed in-tentions to move staff out of the UK capital and/or set up fund ranges in neighboring EU countries in fear of being locked out of European fundraising (FT, 2016). However, this “escape” from the UK is not limited to the financial sector, because Vodafone has already announced that it might move its headquarter if the UK leaves the single market (WSJ, 2016). 6 An alternative might be the Norwegian model (EEA) or Swiss model.
-7-
from export.7 Effects are not only limited to trade relationships with the EU. Firstly, the UK
will not be part of future FTAs which are currently negotiated between the EU and countries
like Brazil, China, and the USA. Secondly, UK will no longer be subject to FTAs which have
been successfully negotiated by the EU and thereby experience further limitation in trading
possibilities.8 It remains questionable whether the UK might be able to offset the decrease in
trade with the EU and corresponding national income by focusing its trade ambitions on other
(faster-growing) markets. While it might be possible for the UK to negotiate new FTA, it will
probably take longer than Britain’s withdrawal from the EU under Article 50 generating a po-
tential disruption of trade as trade relationships with those countries will default to WTO rules.
Furthermore, it appears questionable whether the UK can simply substitute European markets
by other exports markets especially in the short- to mid-term.
The UK has been subject to large FDI especially from EU countries – almost half of total FDI.
It appears reasonable to assume that the amount of FDI coming from the EU will be adversely
affected as a strong link between EU membership and inward FDI has been documented by
several studies (Fournier et al. 2015, Bruno et al. 2015, Dhingra et al. 2016b). Furthermore, FDI
from outside the EU might decrease as well, as the UK can no longer provide a gateway to the
single market. According to the Office for National Statistics (ONS), the average flow of inward
FDI has been about 5 percent of GDP between 1999 and 2015. The UK as a financial center is
dependent on inward FDI and financial flows in general. If the London loses its status as a
global financial center, FDI will decrease and so probably will consumption and investment.
Critics of the EU argue that many regulations imposed by EU institution are generating costs,
inflexible and are limiting business opportunities for companies. OpenEurope (2015) argue that
benefits from deregulation might compensate trade losses. However, the space for further de-
regulation appears to be limited in the UK. According to OECD, the UK ranks at a level with
the USA with regard to product market liberalization. Labor market flexibility is relatively high
- especially compared with European countries like France and Germany. Therefore, it appears
questionable whether this limited potential of deregulation will boost productivity enough to
offset trade losses that further deregulation is political enforceable and desirable. LSE (2013)
concludes that the UK is already deregulated and a more skilled workforce and a better infra-
structure are more potent sources of further productivity enhancements.
7 This view is backed by empirical results underscoring that the reduction in trade barriers due to EU member-ship has increased UK incomes (Crafts (2016), Campos et al. (2014)). 8 For an overview, see Van der Loo and Blockmans (2016).

-8-
Figure 2.1 represents a survey of studies which attempt to quantify the long- and short-term
effects for 2018 in the case of Brexit. According to the IMF (2016) under their adverse scenario,
UK might experience a strong drop in GDP in 2017 causing a severe recession. While some
studies even indicate positive (long-term) effects (Minford, 2016, OpenEurope, 2015, Mans-
field, 2014), the majority of studies indicates large negative short- and long-term effects which
are likely to be considerable. Differences in the results of studies presented in Figure 2.1 can
be mainly traced back to differences in the assumptions of the underlying economic model,
different emphasis on specific channels and different projections about the future economic
relationship between the EU und the UK. Studies which find negative effects put more emphasis
on negative trade and investment effects.
The few studies describing positive net results focus on gains from deregulation and enhanced
productivity. The short-term effects (for 2018) of Brexit are uniformly negative, but also vary
in magnitude. These studies underline the possibility of a severe recession or at least decrease
in growth. Apart from academic arguments, the monetary and fiscal policies seem to support
this view. In July, the decision of Bank of England to decrease its bank rate to 0.25% has been
justified the adverse effects of Brexit on the economy. On the fiscal policy side, UK’s finance
minister Hammond has made several statements about the possibility of a more aggressive fis-
cal approach in order to cope with the short- to mid-term effects of Brexit.9
Considering short-run effects, the Brexit decision resulted in immediate financial turmoil after
the vote - stock markets have slid in response to the Brexit vote in an orderly decline and the
British pound suffered big losses. Since the exit of a large, established member of the EU has
never been tested, it could take at least two years for the UK to formally leave the 28-nation
bloc, and it is unclear how much the country’s relationship with the EU will change. This means
that markets are likely to remain volatile at least until it becomes clear what a Brexit scenario
means for the UK and the rest of the EU.10
9 See http://uk.reuters.com/article/uk-britain-eu-economy-hammond-idUKKCN1020O7. 10 One vision in this respect is the so-called Continental Partnership Proposal delivered by Bruegel (2016) includ-ing much free trade and less free movement of labour between the EU and Great Britain. The idea is that free trade substitutes labour mobility.

-9-
Figure 2.1 - Economic effects of Brexit on the UK GDP
a) Long-term effects b) Short-term effects
Source: IMF (2016)Note: Deviation from baseline (=UK remains in the EU)
It has already been shown in the literature that during crises and particular political events fi-
nancial market volatility generally increases sharply and spills over across markets. Thus,
Brexit uncertainty and the consequent decision to leave the EU might not only directly influence
stock and exchange markets, but might also be a trigger for increased spillovers across them.
Financial instabilities, such as an increase in FX volatilities, pose further potential adverse ef-
fects for the economy, implying that firms will postpone new investments and hiring decisions
into the future benefiting from the so-called “option value of waiting” (Belke and Gros, 2002).
Given the important nexus between financial volatility and output, investment and consumption
described above, we will estimate the Brexit uncertainty effects on the UK financial markets’
volatilities in section 3.
The potential effects of Brexit are of course not limited to the UK. Obviously, there is a large
potential of spillover especially for the other EU countries via trade and financial linkages.
However, once again the impact is highly uncertain and will depend on the future political and
economic relationship between the UK and the EU. According to a vast majority of papers,
other countries are likely to lose economically. Based on trade linkages (exports to the UK in
% of own GDP), Ireland (11.2%), the Netherlands (6.7%) and Belgium (7.5%) are primarily
exposed. Regarding banking linkages, the Irish, Dutch, Swedish and German banking sectors

-10-
are highly connected with the British. Based on capital market linkages (FDI and portfolio in-
vestment), Ireland, the Netherlands, Luxembourg and France are mostly exposed.
IMF (2016) analyzes spillover effects to other (European) countries. Based on financial and
trading linkages, Ireland (-0.6 to -2% of GDP), the Netherlands (-0.3% to -0.7% of GDP) and
Belgium (-0.25 to -0.65% of GDP) are the most affected countries. The other countries are less
affected. Output falls by 0.2 to 0.5 percent below baseline in the rest of the EU. The European
Commission (2016) highlights that “the referendum has created an extraordinary uncertain sit-
uation". According to its forecasts, the result of the referendum is expected to put pressure on
investment and consumption. Therefore, the EC has reduced its GDP growth forecasts for the
Euro area by 0.1-0.2% for 2016 and 0.2-0.5 for 2017.
Apart from direct economic linkages, Brexit might also generate political and institutional un-
certainty about the EU. While the EU will still have 27 members left, the UK will be the first
country to actually leave the EU under Article 50 which is far from delivering a concrete divorce
procedure (Lazowski, 2016). Furthermore, the UK is not the only country where anti-EU move-
ments have gained support. Economic issues and especially the sovereign debt crisis have fa-
cilitated political campaigns especially in France, the Netherlands, and Italy to leave the EU.
Also, we are not of the opinion that the existence of the EU is endangered by Brexit, the success
of the Brexit movements might generate momentum for similar movements in other countries
increasing the probability of more countries leaving the EU. This might damage the reputation
of the EU as a sustainable and irrevocable institution decreasing its political power, influence,
and ability to negotiate new supranational contracts like FTA.
Therefore, political uncertainty may spread across Europe especially affecting countries whose
sovereign solvency is heavily linked with the existence of the EU and the Euro area – namely
Spain, Portugal, Italy and Greece. Without the Euro area or sufficient contributors, the installed
rescue mechanisms like the ESM would cease to exist or be perceived too small to act as a
safeguard if member states are in financial difficulties. Furthermore, these countries are still
struggling to reach a moderate level of growth and still have troubles in its banking sectors
especially Italy. Therefore, existing trade and financial linkages might deliver an incomplete
picture about the (relative) magnitude of country-specific spillover effects.11 Since the Brexit
11 Gros (2016), however, puts the assessment of the literature reviewed in section 2 into perspective and states: “(b)eyond a weaker pound and lower UK interest rates, the referendum has not had much of a lasting impact. Financial markets wobbled for a few weeks after the referendum, but have since recovered. Consumer spending remains unmoved“. While it is true that consumer spending stayed rather unmoved, we mention in this section that business and consumer confidence went down. See also our remarks in Section 4.

-11-
referendum was held just in the recent past, the first assessments of the Brexit were dedicated
to the financial markets’ effects. Raddant (2016) analyzes financial data of the UK, Germany,
France, Spain, and Italy. The author performs several standard estimation techniques comparing
the behavior of European stock returns, stock market volatility, and exchange rates before and
after the referendum. In contrast to our study, Raddant (2016) focuses more on the immediate
impact after the referendum. His study shows that stock markets fell after Brexit (losses ranging
between 10-15%) and had similar effects across Europe. In line with our argumentation above,
the Italian stock market is mostly affected by Brexit (including the UK) despite being the least
connected with the UK (in terms of trade and financial linkages). Regarding exchange rate de-
velopments, the British Pound immediately lost 10% vis-à-vis the USD (8% vis-à-vis the euro).
Looking at the response of the sterling exchange to poll numbers accordingly find that investors
appear to view Brexit as a negative event (Arnorsson and Zoega, 2016).
The second relevant study for our research is the short paper by Krause et al. (2016) argue that
the referendum in the UK created a high degree of uncertainty about possible consequences and
that this could also be seen in financial markets in the run-up to the referendum. According to
their empirical investigation, poll results pointing toward Brexit resulted in short-term declines
in returns of bank indices. According to the authors, this suggests that negative consequences
of exiting the EU are expected not only for the UK but also for the EU. Their results point at a
strong depreciation of the UK Sterling relative to the euro or the Swiss franc which might reflect
the (expected) decline in the attractiveness of the UK as a financial center and reduced demand
for the UK Sterling.
Their results cannot be compared in quantitative terms with ours due to differences in the vari-
ables measuring the Brexit probability. They employ a pure dummy variable using poll results
from “whatukthinks.org” amounting to 0 if the probability falls below 50 percent and is equal
to 1 if the probability is higher than 50 percent. In our view, this risks being a too crude measure
which does not adequately measure the likelihood of Brexit and therefore its potential adverse
effects. A general critique against measuring Brexit effects using poll results is presented by
Gerlach (2016). He argues that poll data do not contribute much to the explanation of financial
market developments. Therefore, we utilize more sophistic measures by using the probability
of Brexit based on data from betting agencies.
The third, again less comprehensive, study comparable to ours is Gerlach and Di Giamberardino
(2016). They come up with the results that the outcome of the UK’s referendum on EU mem-
bership could have a significant effect on sterling. They estimate the potential size of this effect
-12-
by looking at the relationship between daily changes in the sterling exchange rate and book-
makers’ odds of Brexit. According to their estimations, movements of between 5% and 15%
seem plausible. We use an almost identical approach, but do not restrict our estimations on the
effects on exchange rates.
2. Brexit and its effect on UK financial market volatilities
3.1 Data
In this section, we estimate the magnitude and the sign of short-run Brexit effects which are
related to an environment of increased policy uncertainty during the time preceding the refer-
endum and directly after Brexit-vote on UK financial markets. Our focus here is on volatilities
(second statistical moments) instead of changes of the levels (first statistical moment).
As a measure of uncertainty, we employ the Economic Policy Uncertainty index (EPU) devel-
oped by Scott R. Baker, Nicholas Bloom and Steven J. Davis12 which draws upon newspapers
and other written sources and is calculated as scaled counts of articles containing ‘uncertain’ or
‘uncertainty’, ‘economic’ or ‘economy’, and one or more policy-relevant terms (‘tax’, ‘policy’,
‘regulation’, ‘spending’, ‘deficit’, ‘budget’, or ‘central bank’). Policy-driven uncertainty is
shown to raise during political turmoil or elections, as well as during the implementation of
major policies and programs and reflects the level of doubt and confusion in the private sector
caused by government policies. Thus, according to its definition, using the EPU Index should
be a good proxy for the estimations of Brexit uncertainty and Brexit-vote effects. The other
index provided by the same source - the Brexit Uncertainty index – is calculated by multiplying
the EPU index by the share of EPU articles that contain ‘Brexit’, ‘EU’ or ‘European Union’.
By nature, it is available only until May 2016.
Figure 3.1 shows that the EPU index in the United Kingdom in the near-referendum time is
hovering at its highest point surpassing previous records during the Scottish referendum, the
Eurozone crisis, the Gulf war and the global financial crisis of 2008. Further visual inspection
of the EPU and Brexit uncertainty reveals a strong, although time-varying, correlation of both
during the period before the referendum.
12 See http://www.policyuncertainty.com/index.html.

-13-
Figure 3.1 UK economic policy uncertainty and Brexit uncertainty
In our empirical estimations, we will use EPU instead of Brexit uncertainty for two reasons.
Firstly, Brexit uncertainty data is available only for the period preceding the referendum, while
EPU data is highly correlated with the Brexit uncertainty during the time preceding the refer-
endum and therefore also reflects the uncertainty triggered by the referendum. In this context,
it is important to note that the current lack of impact can be explained just by the fact that Brexit
has not yet happened (Begg, 2016).
Secondly, since financial markets are very flexible and are able to react to news immediately
using daily EPU data could be beneficial in contrast to Brexit uncertainty which is only availa-
ble at monthly frequencies.
Our model includes the following variables:
Daily stock market volatility13 calculated as the annualized daily percent standard devi-
ation of daily high and low FTSE 250 prices:250 = 100 365 × 0.361 × 250 250We have decided to consider FTSE 250 prices instead of FTSE 100 since the first might
be a better gauge of domestically-oriented share prices than the FTSE 100 which is
dominated by multinationals of which some have little exposure to the UK economy
(Sheffield, 2016).
Daily United Kingdom pound sterling volatility calculated as the annualized daily per-
cent standard deviation of intraday high and low exchange rate GBP/USD:
13 For more details about the construction of daily volatilities please refer to Alizadeh et al. (2002).

-14-
= 100 365 × 0.361 ×Daily EPU index14 constructed by Baker et al. (2015)
Additionally, in order to disentangle domestic policy uncertainty from global uncertainty, we
have included the CBOE Volatility Index (VIX Index)15 as an exogenous variable.
The sample contains 4105 observations, from 2001:01:01 to 2016:23:09, all variables are taken
in logs and plotted in Figure 3.2 below.
Figure 3.2 Financial volatilities and EPU index, logs
In Figure 3.2, we observe that both stock prices and exchange rate went through a major period
of volatility during the global financial crisis. Stock prices have also experienced an increased
amount of volatility around August 2011, which could be explained by the effects of the euro
crisis (Gros, 2011). Moreover, there is a considerable upward spike at the time of the referen-
dum (23, June 2016 marked as a vertical line) for all variables under consideration as magni-
tudes reach levels comparable with previous maxima.
14 In cases when the index was equal to 0, we have replaced it with the value from the previous day. 15 Empirical realizations of the VIX index, intraday high and low values of FTSE250 and the GBP/USD exchange rate are obtained from the Datastream database.
-15-
3.2 Estimation approach
In order to estimate the effect of policy uncertainty on volatility in financial markets, we will
use the empirical approach proposed by Diebold and Yilmaz (2009, 2012) based on VAR var-
iance decompositions.16
Firstly, we estimate the VAR(p) model:x = x + , (1)
where (0, ) is the i.i.d. errors vector.
The moving average representation, thus, could be written as x = A , (2)
where A = A , A is the identity matrix × and A = 0 for i < 0.
Our further analysis relies on variance decompositions which allow assessing the fraction of
the H-step-ahead error variance in forecasting x that is due to shocks to x . In order to deal with
contemporaneous correlations of VAR shocks, we use the generalized VAR framework, which
produces variance decompositions which are invariant to choice of ordering. The generalized
approach allows correlated shocks taking into account the historically observed distribution of
errors.The H-step-ahead forecast error variance decomposition is calculated as (H) = ( )( ) , (3) where is the variance matrix for the errors , is the standard deviation of the error term
for the i-th equation of VAR and e is a vector which contains one as i-th element and zeros
otherwise.
The total volatility spillover index is then constructed as:
16 Alternatively, Hafner and Herwartz (2006b) proposed a concept of impulse response functions tracing the effects of independent shocks on volatility and then considered the effect of historical shocks, such as “Black Wednesday” and an announcement by the European Community finance ministers on August 2, 1993, on foreign exchange market. However, we believe that the identification of a “Brexit shock” is not trivial and should not be constrained only to the day of the announcement of the referendum results but should include the days preced-ing the referendum as well. Moreover, the applied approach in this paper allows us to take into account the time-varying volatility of multivariate financial time series.
-16-
S (H) = ( ), ( ), × 100, (4)
where (H) is normalized value for (H), so that (H) = ( )( ). The total spillover in-
dex, thus, measures the contribution of spillovers of shocks across variables under consideration
to the total forecast error variance.
In order to investigate the direction of spillovers across financial volatilities and policy uncer-
tainty, i.e. the portion of total spillover index that comes from x to all other variables, the
directional spillover is applied:
S (H) = ( )( ) × 100 (5)
The net spillover from variable i to all other variables j is obtained as the difference between
gross shocks transmitted to and gross shocks received from all other markets: S (H) = ( )
( )( )( ) × 100 (6)
The last spillover measure of interest is the net pairwise spillover index between variables xand x which is defined as the difference between gross shocks transmitted from x to x and
gross shocks transmitted from x to x :
S (H) = ( )( ) ( )( ) × 100 (7)
The chosen approach allows us to investigate the dynamics of spillovers in form of rolling
regressions, and thus, the time variations of total, directional, net and net-pairwise spillovers in
the periods before and after the Brexit referendum, which are of particular interest of this study.
The lag length of five was chosen according to the Akaike Information Criterion, the residuals
are not serially correlated, according to the unit root test the model could be considered as
dynamically stable17.
17 Our VAR model specification tests are presented in Table A1 in Appendix.
-17-
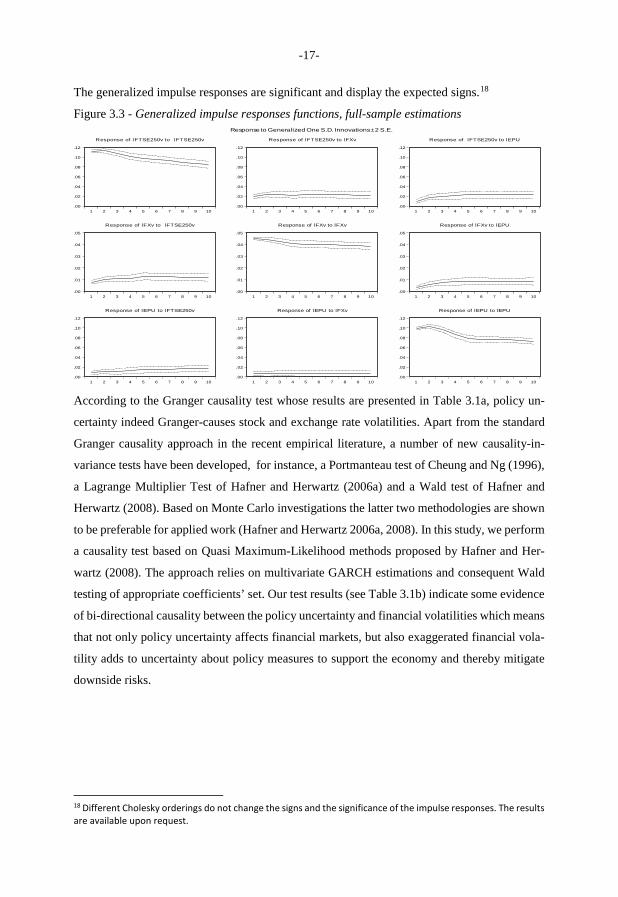
The generalized impulse responses are significant and display the expected signs.18
Figure 3.3 - Generalized impulse responses functions, full-sample estimations
.00
.02
.04
.06
.08
.10
.12
1 2 3 4 5 6 7 8 9 10
Response of lFTSE250v to lFTSE250v
.00
.02
.04
.06
.08
.10
.12
1 2 3 4 5 6 7 8 9 10
Response of lFTSE250v to lFXv
.00
.02
.04
.06
.08
.10
.12
1 2 3 4 5 6 7 8 9 10
Response of lFTSE250v to lEPU
.00
.01
.02
.03
.04
.05
1 2 3 4 5 6 7 8 9 10
Response of lFXv to lFTSE250v
.00
.01
.02
.03
.04
.05
1 2 3 4 5 6 7 8 9 10
Response of lFXv to lFXv
.00
.01
.02
.03
.04
.05
1 2 3 4 5 6 7 8 9 10
Response of lFXv to lEPU
.00
.02
.04
.06
.08
.10
.12
1 2 3 4 5 6 7 8 9 10
Response of lEPU to lFTSE250v
.00
.02
.04
.06
.08
.10
.12
1 2 3 4 5 6 7 8 9 10
Response of lEPU to lFXv
.00
.02
.04
.06
.08
.10
.12
1 2 3 4 5 6 7 8 9 10
Response of lEPU to lEPU
Response to Generalized One S.D. Innovations±2 S.E.
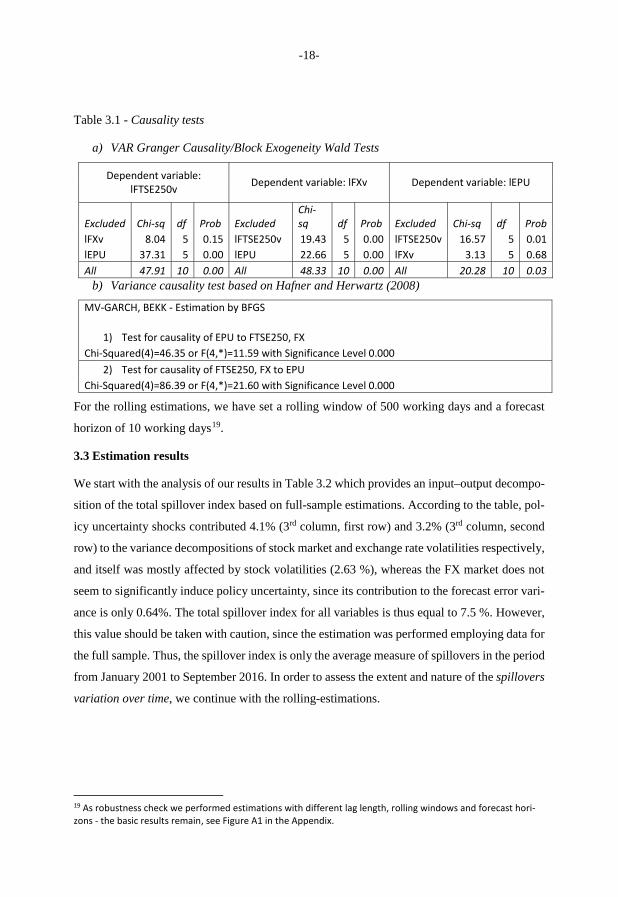
According to the Granger causality test whose results are presented in Table 3.1a, policy un-
certainty indeed Granger-causes stock and exchange rate volatilities. Apart from the standard
Granger causality approach in the recent empirical literature, a number of new causality-in-
variance tests have been developed, for instance, a Portmanteau test of Cheung and Ng (1996),
a Lagrange Multiplier Test of Hafner and Herwartz (2006a) and a Wald test of Hafner and
Herwartz (2008). Based on Monte Carlo investigations the latter two methodologies are shown
to be preferable for applied work (Hafner and Herwartz 2006a, 2008). In this study, we perform
a causality test based on Quasi Maximum-Likelihood methods proposed by Hafner and Her-
wartz (2008). The approach relies on multivariate GARCH estimations and consequent Wald
testing of appropriate coefficients’ set. Our test results (see Table 3.1b) indicate some evidence
of bi-directional causality between the policy uncertainty and financial volatilities which means
that not only policy uncertainty affects financial markets, but also exaggerated financial vola-
tility adds to uncertainty about policy measures to support the economy and thereby mitigate
downside risks.
18 Different Cholesky orderings do not change the signs and the significance of the impulse responses. The results are available upon request.
-18-
Table 3.1 - Causality tests
a) VAR Granger Causality/Block Exogeneity Wald Tests
Dependent variable: lFTSE250v Dependent variable: lFXv Dependent variable: lEPU
Excluded Chi-sq df Prob Excluded Chi-sq df Prob Excluded Chi-sq df Prob
lFXv 8.04 5 0.15 lFTSE250v 19.43 5 0.00 lFTSE250v 16.57 5 0.01 lEPU 37.31 5 0.00 lEPU 22.66 5 0.00 lFXv 3.13 5 0.68 All 47.91 10 0.00 All 48.33 10 0.00 All 20.28 10 0.03
b) Variance causality test based on Hafner and Herwartz (2008)
MV-GARCH, BEKK - Estimation by BFGS
1) Test for causality of EPU to FTSE250, FX Chi-Squared(4)=46.35 or F(4,*)=11.59 with Significance Level 0.000
2) Test for causality of FTSE250, FX to EPU Chi-Squared(4)=86.39 or F(4,*)=21.60 with Significance Level 0.000
For the rolling estimations, we have set a rolling window of 500 working days and a forecast
horizon of 10 working days19.
3.3 Estimation results
We start with the analysis of our results in Table 3.2 which provides an input–output decompo-
sition of the total spillover index based on full-sample estimations. According to the table, pol-
icy uncertainty shocks contributed 4.1% (3rd column, first row) and 3.2% (3rd column, second
row) to the variance decompositions of stock market and exchange rate volatilities respectively,
and itself was mostly affected by stock volatilities (2.63 %), whereas the FX market does not
seem to significantly induce policy uncertainty, since its contribution to the forecast error vari-
ance is only 0.64%. The total spillover index for all variables is thus equal to 7.5 %. However,
this value should be taken with caution, since the estimation was performed employing data for
the full sample. Thus, the spillover index is only the average measure of spillovers in the period
from January 2001 to September 2016. In order to assess the extent and nature of the spillovers
variation over time, we continue with the rolling-estimations.
19 As robustness check we performed estimations with different lag length, rolling windows and forecast hori-zons - the basic results remain, see Figure A1 in the Appendix.

-19-
Table 3.2 - Full-sample spillover table
lFTSE250v lFXv lEPU From Others: lFTSE250v 91.02 4.88 4.1 9
lFXv 7.03 89.77 3.2 10.2 lEPU 2.63 0.64 96.73 3.3
Contribution to others: 9.7 5.5 7.3 22.5 Contribution including own: 100.7 95.3 104 7.50%
Note: The ij-th element of the table represents the estimated contribution to the forecast error variance of xi coming from innovations to xj.
Our rolling estimations for total spillovers between stock volatility, FX volatility and policy
uncertainty (see Figure 3.4) show an increase in spillovers during the period from the end of
2008 till the end of 2012 which could be attributed to the subprime-mortgage crisis, global
financial crisis, and sovereign debt crisis. The consequent huge rise of the spillover index di-
rectly after Brexit-Referendum has exceeded all historical maxima.
Figure 3.4 - Total Spillover Index
In Figure 3.5, we observe that the spike of total spillover index at the end of our sample is
indeed due to increased spillovers from policy uncertainty to financial market volatilities.

-20-
Figure 3.5 - Directional Spillovers from EPU to Financial Volatilities
According to our results in Figure 3.6, starting in May 2004, the index of net spillovers from
EPU to financial volatilities has a positive value apart from some minor exceptions. This means
that since 2004 policy uncertainty has been a net shock contributor for financial market volatil-
ities, or in other words, policy uncertainty shocks have influenced financial markets to a larger
extent than it was affected by financial market volatility shocks itself. However, the value of
the net spillover index changed dramatically after the Brexit-vote and increased from 9 % to 26
% and remains dominant until the end of our sample.
Figure 3.6 - Net spillovers from EPU to Financial Volatilities

-21-
Our final empirical exercise in this section is to look at the pairwise net spillovers (Figures 3.7
to 3.9) in order to reveal bilateral relationships between the variables under consideration. Ac-
cording to Figure 3.7, stock prices volatility was a net receiver of policy uncertainty shocks
starting in February 2016 – the month, when the Brexit-referendum was announced.
Figure 3.8 provides the net spillovers between exchange rate volatility and EPU. Starting in
May 2006, policy uncertainty shocks dominate in net terms apart from some exceptions. Similar
to the net spillovers between stock volatility and EPU, the Brexit-referendum resulted in an
increase in net spillovers between FX volatility and policy uncertainty.
From the net spillovers between stock and FX volatilities presented in Figure 3.9, we observe
that the FX market was a net recipient of large levels of stock volatility shocks starting in 2007
till the end of 2013, and afterwards became a net transmitter to the stock market. The time right
before and after the Brexit-vote does not exhibit any extraordinary patterns in the relationship
between financial volatilities.
Figure 3.7 - Net pairwise spillovers between Stock volatility and EPU

-22-
Figure 3.8 - Net pairwise spillovers between FX volatility and EPU
Figure 3.9 Net pairwise spillovers between Stock volatility and FX volatility
To conclude this section, our estimation results reveal the substantial role of policy uncertainty
on financial market volatilities. Policy uncertainty after 23, June 2016 induced huge spillovers
to financial markets which exceeded all previous historical maxima. Interestingly, policy un-
certainty spillovers have remained strong since then and could be considered as empirical evi-
dence that policy uncertainty concerning the development of the relationship between the
United Kingdom and the EU causes turbulence to financial markets even 3 months after the
referendum which can further weaken investment and hiring in the UK (and Europe). Overall,

-23-
we can corroborate the view of IMF (2016) and others that Brexit uncertainty has caused insta-
bility in key financial markets. Our analysis, however, also provides evidence that the observed
immediate effect has not disappeared and remains to be steadily high, and thus, might prevail
also over the medium run.
4. Brexit and its effects on international financial markets
4.1 Data
In this section, we analyze the effect of Brexit on international financial markets. In this context,
we estimate the impact of an increase in the likelihood that the citizens of the UK will vote in
favor of Brexit on several financial variables. We use daily data between the 1st April and 23rd
June 2016. Thereby, we examine the critical phase before the EU-Referendum took place. We
include data from the following countries: Austria, Belgium, Canada, Denmark, Finland,
France, Germany, Netherlands, Norway, Italy, Japan, Portugal, Spain, Sweden, Switzerland,
United Kingdom and the United States.
Table 4.1 – National stock indices
Country Stock index Country Stock index
Austria ATX Ireland ISEQ20
Belgium Bel20 Italy FTSE MIB
Canada S&P/TSX Composite Japan Nikkei 225
Denmark OMX Copenhagen 20 Portugal PSI-20
Finland OMX Helsinki 25 Spain IBEX 35
France CAC 40 Sweden OMX Stockholm 30
Germany DAX Switzerland SMI
Greece ASE United Kingdom FTSE 100
Netherlands AEX United States S&P 500
Norway OBX
Our measures of daily stock returns are based on closing prices of the most important stock
indexes of the countries under observations which (see Table 4.1). Furthermore, we analyze the
impact on 10-year government yields and sovereign CDS for 10-year bonds which measure
sovereign credit risk. In order to examine the impact of an increase in the probability of Brexit
on the external value of the British currency, we use the exchange rate of the British pound vis-

-24-
à-vis the Canadian Dollar, Danish Krone, Euro, Japanese Yen, Norwegian Krone, Swedish
Krona, Swiss Franc and the US-Dollar. When not stated otherwise, the data is obtained from
Thomson Reuters Datastream.
The most crucial variables of this study are the variables which are supposed to track the prob-
ability of Brexit. Because the corresponding coefficients are most relevant for answering our
research question, we use two different measures in order to check for robustness of our results.
Firstly, we use probability data in percentage points (Brexit_Prob) based on decimal odds of
the online betting exchange ‘Betfair.’ As probabilities vary intra-daily, we have to make a
choice regarding the time of day. We use the 4pm (GMT) values. As financial markets are
considered to be very fast in processing new information, we assume that new information
arriving at 4pm (GMT) should be fully reflected in the daily closing prices.20 Secondly, we
attempt to measure the probability of Brexit by using survey (poll) data collected by Bloomberg
(Brexit_Poll).21 Our variables to track the probability of Brexit are presented in Figures 4.1 and
4.2.
Figure 4.1 – Probability of Brexit (in percentage points)
Source: Betfair.
Both figures show a similar evolution about the implied chance of Brexit. In both cases, we can
observe a sideways movement till mid-May followed by a noticeable strengthening of the “re-
main” campaign. However, starting around the end of May, the “leave” campaign gains mo-
mentum till mid-June. Although the Brexit probability does not reach 50%, the “leave” cam-
paign overtakes the “remain”-side in polls in mid-June. Close to the referendum, we see another
strong increase for the “remain”-campaign in both variables.
20 Additionally, we performed several estimations using 12pm (GMT) values and obtain nearly identical results. 21 Further information can be found here: http://www.bloomberg.com/graphics/2016-brexit-watch/
0102030405060708090
01.04.16
08.04.16
15.04.16
22.04.16
29.04.16
06.05.16
13.05.16
20.05.16
27.05.16
03.06.16
10.06.16
17.06.16
remain leave

-25-
Although we include both Brexit variables alternatively in our estimations, we focus our anal-
ysis mainly on Brexit_Prob. As shown by Gerlach (2016), the information content of polls and
survey data for explaining developments of financial variables is generally low. We can confirm
this argument because the explanatory power of Brexit_Poll is low in general as indicated by
the R^2 in our estimations.
Figure 4.2 – Summary of Brexit polls
Source: Bloomberg.
While it can be assumed that changes in the probability of Brexit should have an impact on fast
information processing markets, it is straightforward to assume that the timing also matters. An
increase in the probability three months before the date of the referendum might have a smaller
effect compared to a similar increase one day before the vote. Similarly, one may assume that
during times of high public attention the effects on financial markets might be stronger. Both
aspects are highly interconnected because public interest should be at its high point just before
the vote takes place.
6
8
10
12
14
16
18
35
37,5
40
42,5
45
47,5
50
01.04.16
08.04.16
15.04.16
22.04.16
29.04.16
06.05.16
13.05.16
20.05.16
27.05.16
03.06.16
10.06.16
17.06.16
remain leave undecided
-26-
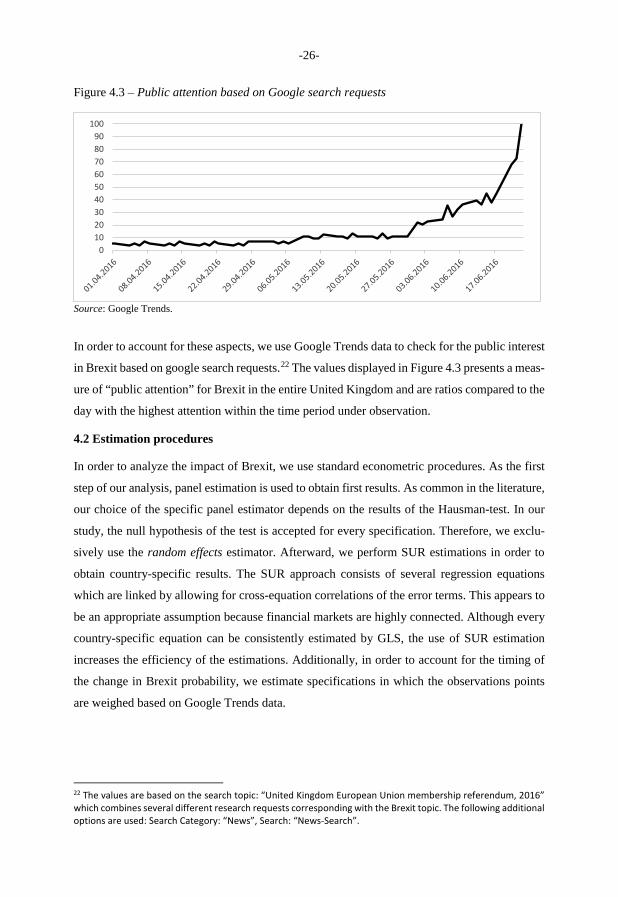
Figure 4.3 – Public attention based on Google search requests
Source: Google Trends.
In order to account for these aspects, we use Google Trends data to check for the public interest
in Brexit based on google search requests.22 The values displayed in Figure 4.3 presents a meas-
ure of “public attention” for Brexit in the entire United Kingdom and are ratios compared to the
day with the highest attention within the time period under observation.
4.2 Estimation procedures
In order to analyze the impact of Brexit, we use standard econometric procedures. As the first
step of our analysis, panel estimation is used to obtain first results. As common in the literature,
our choice of the specific panel estimator depends on the results of the Hausman-test. In our
study, the null hypothesis of the test is accepted for every specification. Therefore, we exclu-
sively use the random effects estimator. Afterward, we perform SUR estimations in order to
obtain country-specific results. The SUR approach consists of several regression equations
which are linked by allowing for cross-equation correlations of the error terms. This appears to
be an appropriate assumption because financial markets are highly connected. Although every
country-specific equation can be consistently estimated by GLS, the use of SUR estimation
increases the efficiency of the estimations. Additionally, in order to account for the timing of
the change in Brexit probability, we estimate specifications in which the observations points
are weighed based on Google Trends data.
22 The values are based on the search topic: “United Kingdom European Union membership referendum, 2016” which combines several different research requests corresponding with the Brexit topic. The following additional options are used: Search Category: “News”, Search: “News-Search”.
0102030405060708090
100
-27-
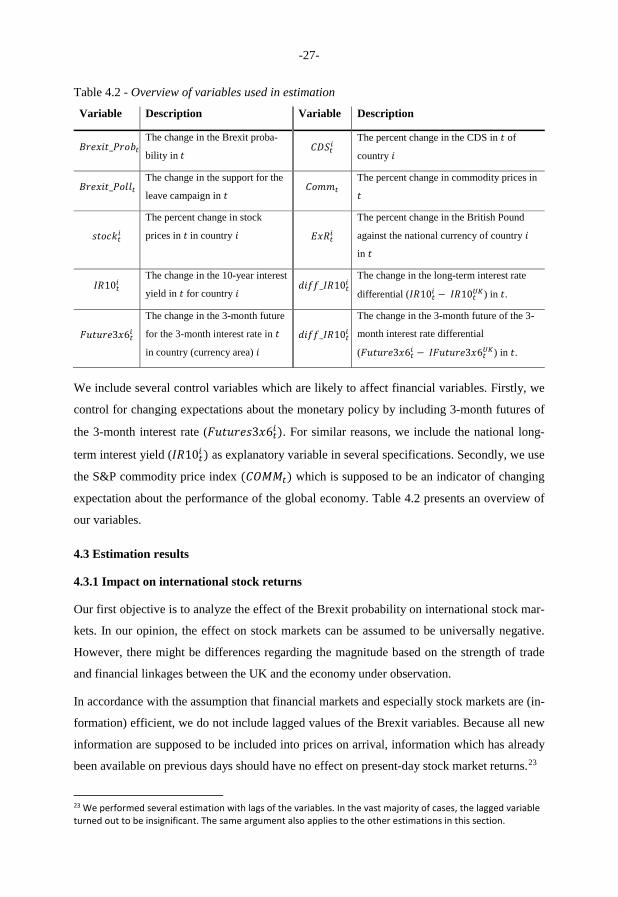
Table 4.2 - Overview of variables used in estimation
Variable Description Variable Description
_ The change in the Brexit proba-
bility in The percent change in the CDS in of
country
_ The change in the support for the
leave campaign in
The percent change in commodity prices in
The percent change in stock
prices in in country The percent change in the British Pound
against the national currency of country
in
10 The change in the 10-year interest
yield in for country _ 10 The change in the long-term interest rate
differential ( 10 10 ) in .
3 6 The change in the 3-month future
for the 3-month interest rate in
in country (currency area)
_ 10 The change in the 3-month future of the 3-
month interest rate differential
( 3 6 3 6 ) in .
We include several control variables which are likely to affect financial variables. Firstly, we
control for changing expectations about the monetary policy by including 3-month futures of
the 3-month interest rate ( 3 6 ). For similar reasons, we include the national long-
term interest yield ( 10 ) as explanatory variable in several specifications. Secondly, we use
the S&P commodity price index ( ) which is supposed to be an indicator of changing
expectation about the performance of the global economy. Table 4.2 presents an overview of
our variables.
4.3 Estimation results
4.3.1 Impact on international stock returns
Our first objective is to analyze the effect of the Brexit probability on international stock mar-
kets. In our opinion, the effect on stock markets can be assumed to be universally negative.
However, there might be differences regarding the magnitude based on the strength of trade
and financial linkages between the UK and the economy under observation.
In accordance with the assumption that financial markets and especially stock markets are (in-
formation) efficient, we do not include lagged values of the Brexit variables. Because all new
information are supposed to be included into prices on arrival, information which has already
been available on previous days should have no effect on present-day stock market returns.23
23 We performed several estimation with lags of the variables. In the vast majority of cases, the lagged variable turned out to be insignificant. The same argument also applies to the other estimations in this section.
-28-
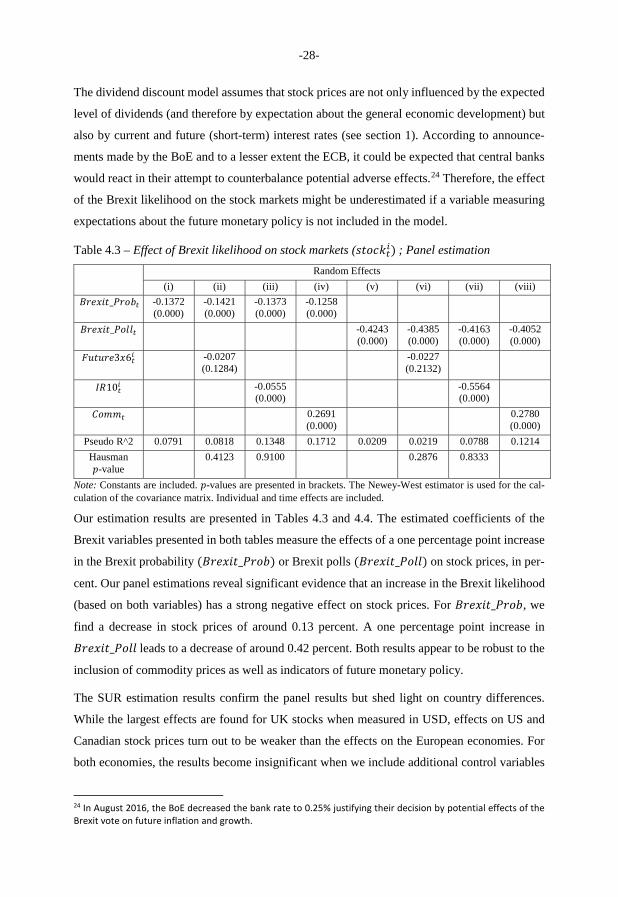
The dividend discount model assumes that stock prices are not only influenced by the expected
level of dividends (and therefore by expectation about the general economic development) but
also by current and future (short-term) interest rates (see section 1). According to announce-
ments made by the BoE and to a lesser extent the ECB, it could be expected that central banks
would react in their attempt to counterbalance potential adverse effects.24 Therefore, the effect
of the Brexit likelihood on the stock markets might be underestimated if a variable measuring
expectations about the future monetary policy is not included in the model.
Table 4.3 – Effect of Brexit likelihood on stock markets ( ) ; Panel estimationRandom Effects
(i) (ii) (iii) (iv) (v) (vi) (vii) (viii)_ -0.1372 (0.000)
-0.1421 (0.000)
-0.1373 (0.000)
-0.1258 (0.000)_ -0.4243
(0.000)-0.4385 (0.000)
-0.4163 (0.000)
-0.4052 (0.000)3 6 -0.0207
(0.1284)-0.0227 (0.2132)10 -0.0555
(0.000)-0.5564 (0.000)
0.2691 (0.000)
0.2780 (0.000)
Pseudo R^2 0.0791 0.0818 0.1348 0.1712 0.0209 0.0219 0.0788 0.1214Hausman
-value0.4123 0.9100 0.2876 0.8333
Note: Constants are included. -values are presented in brackets. The Newey-West estimator is used for the cal-culation of the covariance matrix. Individual and time effects are included.
Our estimation results are presented in Tables 4.3 and 4.4. The estimated coefficients of the
Brexit variables presented in both tables measure the effects of a one percentage point increase
in the Brexit probability ( _ ) or Brexit polls ( _ ) on stock prices, in per-
cent. Our panel estimations reveal significant evidence that an increase in the Brexit likelihood
(based on both variables) has a strong negative effect on stock prices. For _ , we
find a decrease in stock prices of around 0.13 percent. A one percentage point increase in _ leads to a decrease of around 0.42 percent. Both results appear to be robust to the
inclusion of commodity prices as well as indicators of future monetary policy.
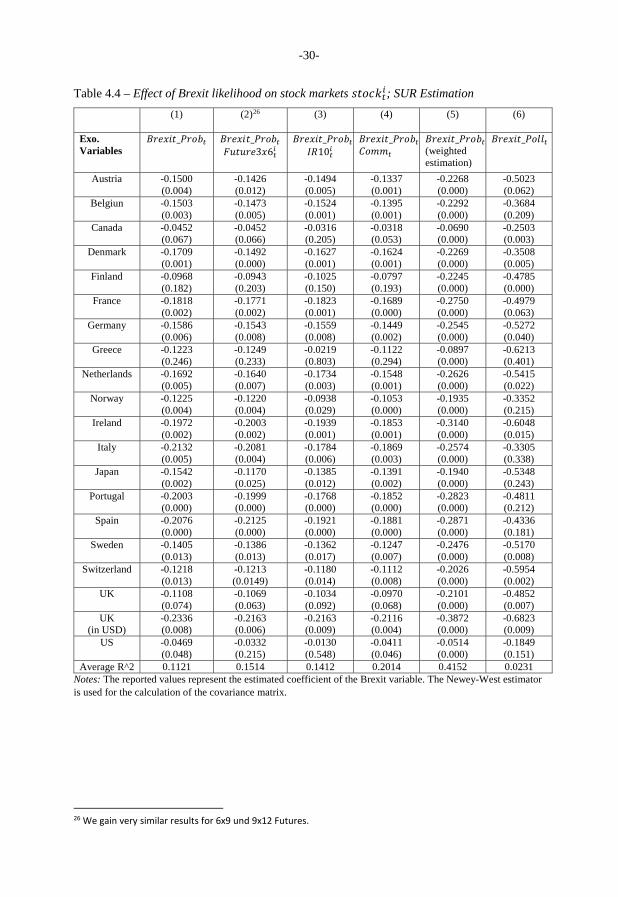
The SUR estimation results confirm the panel results but shed light on country differences.
While the largest effects are found for UK stocks when measured in USD, effects on US and
Canadian stock prices turn out to be weaker than the effects on the European economies. For
both economies, the results become insignificant when we include additional control variables
24 In August 2016, the BoE decreased the bank rate to 0.25% justifying their decision by potential effects of the Brexit vote on future inflation and growth.
-29-
such as . Regarding differences between European countries, the effects are overall
similar. Therefore, it appears somewhat difficult to trace back the results to the strength of trade,
banking or capital market linkages. However, we observe a tendency that the effects for the
GIIPS25 states is stronger with the exception of Greece. Based on the amount of economic ties
between the UK and Ireland, it does not come as a surprise that Irish stock prices are strongly
affected due to economic ties. For Italy, Spain and Portugal the strong effect is surprising and
cannot be solely explained by the strength of economic ties with the UK. When we weight the
observation by Google Trends data, the effects are stronger and significant for all countries
indicating that the timing does in fact matter.
25 The GIIPS states comprise Greece, Ireland, Italy, Portugal and Spain.
-30-
Table 4.4 – Effect of Brexit likelihood on stock markets ; SUR Estimation(1) (2)26 (3) (4) (5) (6)
Exo. Variables
_ _ 3 6 _10 _ _(weighted estimation)
_Austria -0.1500
(0.004)-0.1426 (0.012)
-0.1494 (0.005)
-0.1337 (0.001)
-0.2268 (0.000)
-0.5023 (0.062)
Belgiun -0.1503 (0.003)
-0.1473 (0.005)
-0.1524 (0.001)
-0.1395 (0.001)
-0.2292 (0.000)
-0.3684 (0.209)
Canada -0.0452 (0.067)
-0.0452 (0.066)
-0.0316 (0.205)
-0.0318 (0.053)
-0.0690 (0.000)
-0.2503 (0.003)
Denmark -0.1709 (0.001)
-0.1492 (0.000)
-0.1627 (0.001)
-0.1624 (0.001)
-0.2269(0.000)
-0.3508 (0.005)
Finland -0.0968 (0.182)
-0.0943 (0.203)
-0.1025 (0.150)
-0.0797 (0.193)
-0.2245 (0.000)
-0.4785 (0.000)
France -0.1818 (0.002)
-0.1771 (0.002)
-0.1823 (0.001)
-0.1689 (0.000)
-0.2750 (0.000)
-0.4979 (0.063)
Germany -0.1586 (0.006)
-0.1543 (0.008)
-0.1559 (0.008)
-0.1449 (0.002)
-0.2545 (0.000)
-0.5272 (0.040)
Greece -0.1223 (0.246)
-0.1249 (0.233)
-0.0219 (0.803)
-0.1122 (0.294)
-0.0897 (0.000)
-0.6213 (0.401)
Netherlands -0.1692 (0.005)
-0.1640 (0.007)
-0.1734 (0.003)
-0.1548 (0.001)
-0.2626 (0.000)
-0.5415 (0.022)
Norway -0.1225 (0.004)
-0.1220 (0.004)
-0.0938 (0.029)
-0.1053 (0.000)
-0.1935 (0.000)
-0.3352 (0.215)
Ireland -0.1972 (0.002)
-0.2003 (0.002)
-0.1939 (0.001)
-0.1853 (0.001)
-0.3140 (0.000)
-0.6048 (0.015)
Italy -0.2132 (0.005)
-0.2081 (0.004)
-0.1784 (0.006)
-0.1869 (0.003)
-0.2574 (0.000)
-0.3305 (0.338)
Japan -0.1542 (0.002)
-0.1170 (0.025)
-0.1385 (0.012)
-0.1391 (0.002)
-0.1940 (0.000)
-0.5348 (0.243)
Portugal -0.2003 (0.000)
-0.1999 (0.000)
-0.1768(0.000)
-0.1852 (0.000)
-0.2823 (0.000)
-0.4811 (0.212)
Spain -0.2076 (0.000)
-0.2125 (0.000)
-0.1921 (0.000)
-0.1881 (0.000)
-0.2871 (0.000)
-0.4336 (0.181)
Sweden -0.1405 (0.013)
-0.1386 (0.013)
-0.1362 (0.017)
-0.1247 (0.007)
-0.2476 (0.000)
-0.5170 (0.008)
Switzerland -0.1218 (0.013)
-0.1213 (0.0149)
-0.1180 (0.014)
-0.1112 (0.008)
-0.2026 (0.000)
-0.5954 (0.002)
UK -0.1108 (0.074)
-0.1069 (0.063)
-0.1034 (0.092)
-0.0970 (0.068)
-0.2101 (0.000)
-0.4852 (0.007)
UK (in USD)
-0.2336 (0.008)
-0.2163 (0.006)
-0.2163 (0.009)
-0.2116 (0.004)
-0.3872 (0.000)
-0.6823 (0.009)
US -0.0469 (0.048)
-0.0332 (0.215)
-0.0130 (0.548)
-0.0411 (0.046)
-0.0514 (0.000)
-0.1849 (0.151)
Average R^2 0.1121 0.1514 0.1412 0.2014 0.4152 0.0231Notes: The reported values represent the estimated coefficient of the Brexit variable. The Newey-West estimator is used for the calculation of the covariance matrix.
26 We gain very similar results for 6x9 und 9x12 Futures.

-31-
4.3.2 Impact on long-term interest rates and sovereign credit risk
The impact on long-term interest rate and sovereign credit risk can be expected to show a larger
degree of heterogeneity across countries. In this regard, some countries might benefit from in-
creased uncertainty, because their bonds are considered to be a safe haven in times of market
turmoil.
We believe that those countries rated AAA are most likely to benefit from decreased bond
yields. Table 4.5 presents the panel results for the 10-year interest yield. Because we assume
different effects, we divide the sample into two groups: While the first group contains countries
which are considered to be nearly “risk-free” indicated by a rating of AAA, the second group
contains countries which have a credit rating of below AA.27
Table 4.5 – Effects on long-term interest rates ( 10 ); panel estimationsRandom Effects
AAA <AA (GIIPS)(i) (ii) (iii) (iv) (v) (vi) (vii) (viii)_ -0.3283 (0.000)
-0.2750 (0.000)
-0.3023 (0.000)
0.7246 (0.000)
0.7177 (0.000)
0.6991 (0.000)_ -0.5710
(0.000)1.6459 (0.000)3 6 0.4420
(0.000)0.2412 (0.7315)
0.3784 (0.000)
-0.5829(0.0670)
Pseudo R^2 0.0521 0.2022 0.0761 0.0098 0.0356 0.0360 0.0425 0.0051Hausman p-value
0.3190 0.2151
Note: Constants are included. P-values are presented in brackets. The Newey-West estimator is used for the cal-culation of the covariance matrix. Individual and time effects are included.
We find that a one percentage point increase in Brexit probability leads to a decrease of about
0.3 basis points in AAA bonds, but increases interest rates of riskier countries by about 0.7
basis points. Again, our results are not driven by other developments as indicated by the results
of regressions which include additional variables. Apart from the effects of Brexit probability,
we obtain the surprising results, that an increase in expected future interest rates increases AAA
long-term yields, but has no significant effect on yields of riskier country
27 Ratings are taken from Fitch Ratings. The AAA group contains: Canada, Denmark, Germany, Netherlands, Nor-way, Sweden, Switzerland and the USA. The second group contains only the so-called GIIPS states.
-32-
Table 4.6 – Effects on sovereign credit risk perception ( ); panel estimationsAAA <AA (GIIPS)
(i) (ii) (iii) (iv) (vi) (vii) (viii) (ix)_ 0.0064 (0.3847)
0.0068 (0.373)
0.0051 (0.454)
0.0923 (0.011)
0.1029 (0.002)
0.0847 (0.019)_ 0.2127
(0.003)0.6682 (0.015)3 6 -0.0271
(0.278)0.3706 (0.001)
-0.0361 (0.064)
-0.1808 (0.001)
Pseudo R^2 0.0191 0.0156 0.0171 0.0223 0.0117 0.0318 0.0251 0.0165Hausman p-value 0.3521 0.9012
Note: Constants are included. P-values are presented in brackets. The Newey-West estimator is used for calculation of the covariance matrix. Individual and time effects are included.
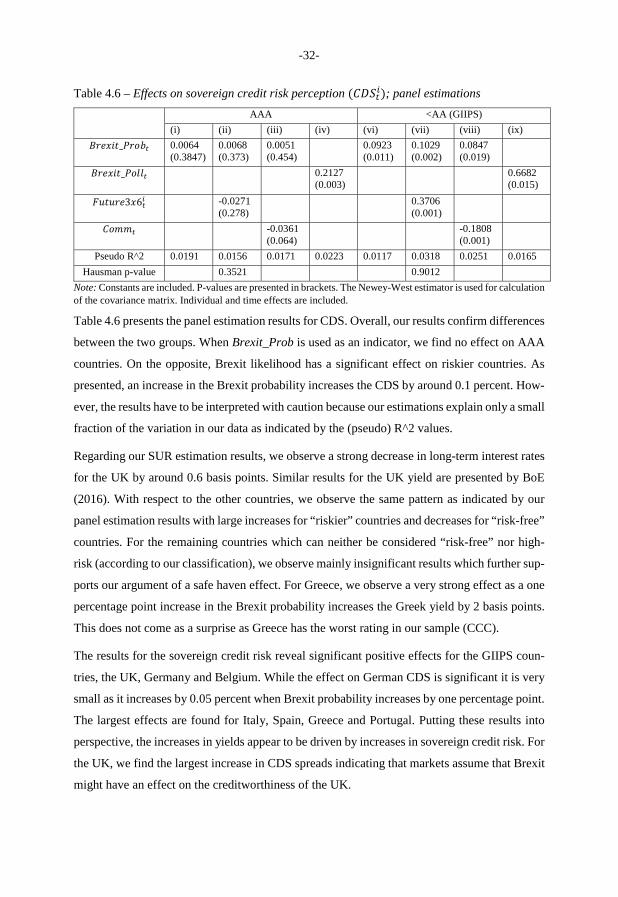
Table 4.6 presents the panel estimation results for CDS. Overall, our results confirm differences
between the two groups. When Brexit_Prob is used as an indicator, we find no effect on AAA
countries. On the opposite, Brexit likelihood has a significant effect on riskier countries. As
presented, an increase in the Brexit probability increases the CDS by around 0.1 percent. How-
ever, the results have to be interpreted with caution because our estimations explain only a small
fraction of the variation in our data as indicated by the (pseudo) R^2 values.
Regarding our SUR estimation results, we observe a strong decrease in long-term interest rates
for the UK by around 0.6 basis points. Similar results for the UK yield are presented by BoE
(2016). With respect to the other countries, we observe the same pattern as indicated by our
panel estimation results with large increases for “riskier” countries and decreases for “risk-free”
countries. For the remaining countries which can neither be considered “risk-free” nor high-
risk (according to our classification), we observe mainly insignificant results which further sup-
ports our argument of a safe haven effect. For Greece, we observe a very strong effect as a one
percentage point increase in the Brexit probability increases the Greek yield by 2 basis points.
This does not come as a surprise as Greece has the worst rating in our sample (CCC).
The results for the sovereign credit risk reveal significant positive effects for the GIIPS coun-
tries, the UK, Germany and Belgium. While the effect on German CDS is significant it is very
small as it increases by 0.05 percent when Brexit probability increases by one percentage point.
The largest effects are found for Italy, Spain, Greece and Portugal. Putting these results into
perspective, the increases in yields appear to be driven by increases in sovereign credit risk. For
the UK, we find the largest increase in CDS spreads indicating that markets assume that Brexit
might have an effect on the creditworthiness of the UK.
-33-
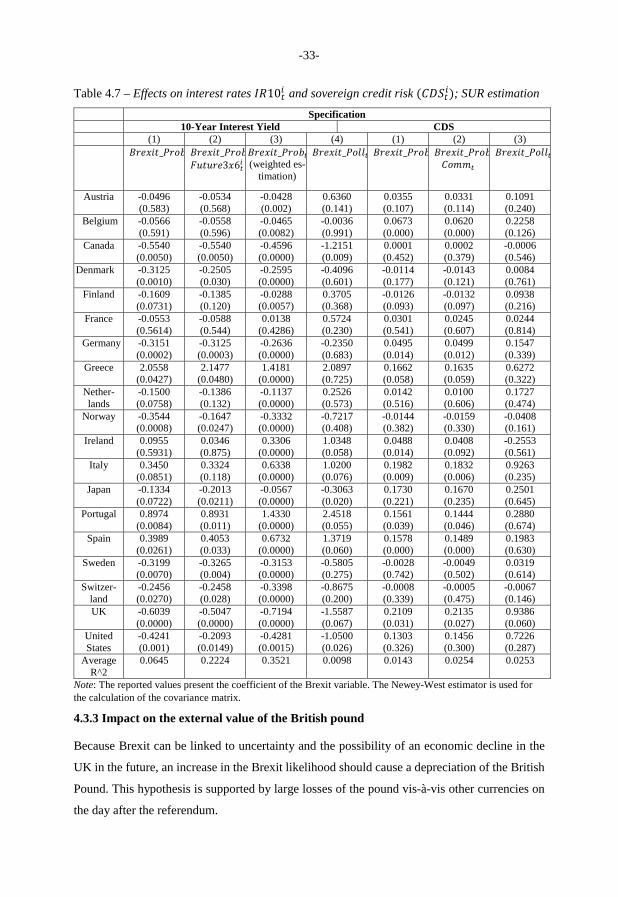
Table 4.7 – Effects on interest rates 10 and sovereign credit risk ( ); SUR estimationSpecification
10-Year Interest Yield CDS(1) (2) (3) (4) (1) (2) (3)_ _3 6 _
(weighted es-timation)
_ _ _ _Austria -0.0496
(0.583)-0.0534 (0.568)
-0.0428 (0.002)
0.6360 (0.141)
0.0355 (0.107)
0.0331 (0.114)
0.1091 (0.240)
Belgium -0.0566 (0.591)
-0.0558 (0.596)
-0.0465 (0.0082)
-0.0036 (0.991)
0.0673 (0.000)
0.0620 (0.000)
0.2258 (0.126)
Canada -0.5540 (0.0050)
-0.5540 (0.0050)
-0.4596 (0.0000)
-1.2151 (0.009)
0.0001 (0.452)
0.0002 (0.379)
-0.0006 (0.546)
Denmark -0.3125 (0.0010)
-0.2505 (0.030)
-0.2595 (0.0000)
-0.4096 (0.601)
-0.0114 (0.177)
-0.0143 (0.121)
0.0084 (0.761)
Finland -0.1609 (0.0731)
-0.1385 (0.120)
-0.0288 (0.0057)
0.3705 (0.368)
-0.0126 (0.093)
-0.0132 (0.097)
0.0938 (0.216)
France -0.0553 (0.5614)
-0.0588 (0.544)
0.0138 (0.4286)
0.5724 (0.230)
0.0301 (0.541)
0.0245 (0.607)
0.0244 (0.814)
Germany -0.3151 (0.0002)
-0.3125 (0.0003)
-0.2636 (0.0000)
-0.2350 (0.683)
0.0495 (0.014)
0.0499 (0.012)
0.1547 (0.339)
Greece 2.0558 (0.0427)
2.1477 (0.0480)
1.4181 (0.0000)
2.0897 (0.725)
0.1662 (0.058)
0.1635 (0.059)
0.6272 (0.322)
Nether-lands
-0.1500 (0.0758)
-0.1386 (0.132)
-0.1137 (0.0000)
0.2526 (0.573)
0.0142 (0.516)
0.0100 (0.606)
0.1727 (0.474)
Norway -0.3544 (0.0008)
-0.1647 (0.0247)
-0.3332 (0.0000)
-0.7217 (0.408)
-0.0144 (0.382)
-0.0159 (0.330)
-0.0408 (0.161)
Ireland 0.0955 (0.5931)
0.0346 (0.875)
0.3306 (0.0000)
1.0348 (0.058)
0.0488 (0.014)
0.0408 (0.092)
-0.2553 (0.561)
Italy 0.3450 (0.0851)
0.3324 (0.118)
0.6338 (0.0000)
1.0200 (0.076)
0.1982 (0.009)
0.1832 (0.006)
0.9263 (0.235)
Japan -0.1334 (0.0722)
-0.2013 (0.0211)
-0.0567 (0.0000)
-0.3063 (0.020)
0.1730 (0.221)
0.1670 (0.235)
0.2501 (0.645)
Portugal 0.8974 (0.0084)
0.8931 (0.011)
1.4330 (0.0000)
2.4518 (0.055)
0.1561 (0.039)
0.1444 (0.046)
0.2880 (0.674)
Spain 0.3989 (0.0261)
0.4053 (0.033)
0.6732 (0.0000)
1.3719 (0.060)
0.1578 (0.000)
0.1489 (0.000)
0.1983 (0.630)
Sweden -0.3199 (0.0070)
-0.3265 (0.004)
-0.3153 (0.0000)
-0.5805 (0.275)
-0.0028 (0.742)
-0.0049 (0.502)
0.0319 (0.614)
Switzer-land
-0.2456 (0.0270)
-0.2458 (0.028)
-0.3398 (0.0000)
-0.8675 (0.200)
-0.0008 (0.339)
-0.0005 (0.475)
-0.0067 (0.146)
UK -0.6039 (0.0000)
-0.5047 (0.0000)
-0.7194 (0.0000)
-1.5587 (0.067)
0.2109 (0.031)
0.2135 (0.027)
0.9386 (0.060)
United States
-0.4241 (0.001)
-0.2093 (0.0149)
-0.4281(0.0015)
-1.0500 (0.026)
0.1303 (0.326)
0.1456 (0.300)
0.7226 (0.287)
Average R^2
0.0645 0.2224 0.3521 0.0098 0.0143 0.0254 0.0253
Note: The reported values present the coefficient of the Brexit variable. The Newey-West estimator is used for the calculation of the covariance matrix.
4.3.3 Impact on the external value of the British pound
Because Brexit can be linked to uncertainty and the possibility of an economic decline in the
UK in the future, an increase in the Brexit likelihood should cause a depreciation of the British
Pound. This hypothesis is supported by large losses of the pound vis-à-vis other currencies on
the day after the referendum.

-34-
However, the exchange value is not only linked with expectations about the development of
real economic variables and the level of uncertainty but also with interest rate differentials and
expectations about (national) monetary policies.28 In order to account for these aspects, we cal-
culate the difference between the 3-month future of country and the value for the UK
(Future3x6 Future3x6 ). We follow the same approach to calculate the (long-term) interest
rate differential.
Table 4.8 – Effects on the external value of the British Pound ; panel estimationsRandom Effects
(i) (ii) (iii) (iv) (v) (ii)_ -0.1217 (0.000)
-0.1183 (0.000)
-0.1118 (0.000)_ -0.2306
(0.000)-0.2100 (0.000)
-0.2063 (0.000)_ 3 6 -0.0557
(0.000)-0.0551 (0.000)_ 10 -0.0331
(0.000)-0.0342 (0.000)
Pseudo R^2 0.1731 0.1788 0.1862 0.0148 0.0314 0.0517Hausman-test
-value0.4998 0.5062 0.7213 0.7009
Note: Constants are included. P-values are presented in brackets. Newey-West estimator is used for the calculation of the covariance matrix. Individual and time effects are included.
According to our panel estimation results, a one percentage point increase of the Brexit proba-
bility decreases the value of the pound by around 0.12 percent. When we focus our analysis on
poll survey data (Brexit_Poll), the effect is about 0.23 percent. For our control variables, we
find the expected impact of the interest rate differentials.
28 In case of the Euro, we take German 10y yields as a proxy of the „European“ interest rate. However, we do not find different results when Dutch, French or Finnish Yields are used.
-35-
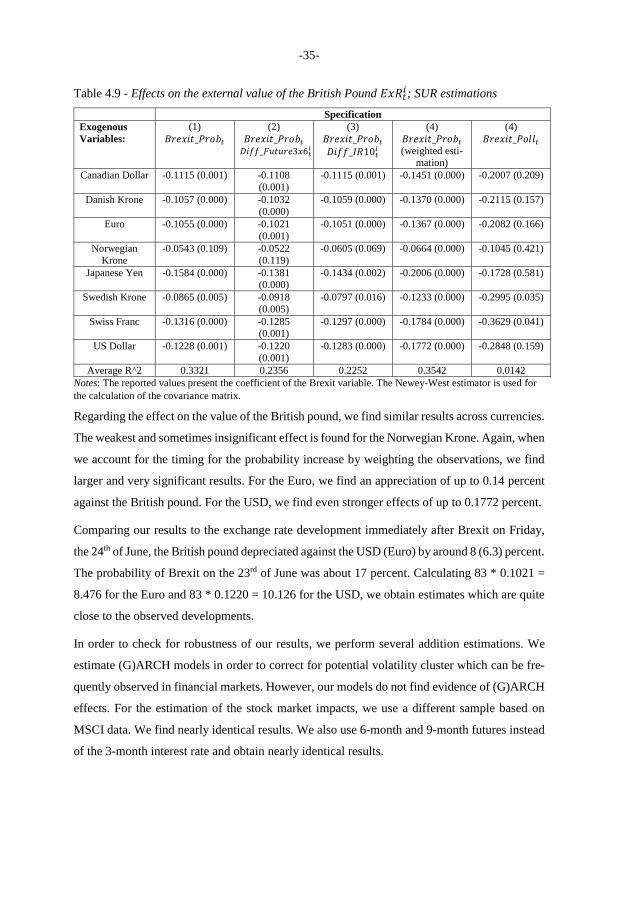
Table 4.9 - Effects on the external value of the British Pound ; SUR estimationsSpecification
Exogenous Variables:
(1)_ (2)__ 3 6 (3)__ 10 (4)_(weighted esti-
mation)
(4)_Canadian Dollar -0.1115 (0.001) -0.1108
(0.001)-0.1115 (0.001) -0.1451 (0.000) -0.2007 (0.209)
Danish Krone -0.1057 (0.000) -0.1032 (0.000)
-0.1059 (0.000) -0.1370 (0.000) -0.2115 (0.157)
Euro -0.1055 (0.000) -0.1021 (0.001)
-0.1051 (0.000) -0.1367 (0.000) -0.2082 (0.166)
Norwegian Krone
-0.0543 (0.109) -0.0522 (0.119)
-0.0605 (0.069) -0.0664 (0.000) -0.1045 (0.421)
Japanese Yen -0.1584 (0.000) -0.1381 (0.000)
-0.1434 (0.002) -0.2006 (0.000) -0.1728 (0.581)
Swedish Krone -0.0865 (0.005) -0.0918 (0.005)
-0.0797 (0.016) -0.1233 (0.000) -0.2995 (0.035)
Swiss Franc -0.1316 (0.000) -0.1285 (0.001)
-0.1297 (0.000) -0.1784 (0.000) -0.3629 (0.041)
US Dollar -0.1228 (0.001) -0.1220 (0.001)
-0.1283 (0.000) -0.1772 (0.000) -0.2848 (0.159)
Average R^2 0.3321 0.2356 0.2252 0.3542 0.0142Notes: The reported values present the coefficient of the Brexit variable. The Newey-West estimator is used for the calculation of the covariance matrix.
Regarding the effect on the value of the British pound, we find similar results across currencies.
The weakest and sometimes insignificant effect is found for the Norwegian Krone. Again, when
we account for the timing for the probability increase by weighting the observations, we find
larger and very significant results. For the Euro, we find an appreciation of up to 0.14 percent
against the British pound. For the USD, we find even stronger effects of up to 0.1772 percent.
Comparing our results to the exchange rate development immediately after Brexit on Friday,
the 24th of June, the British pound depreciated against the USD (Euro) by around 8 (6.3) percent.
The probability of Brexit on the 23rd of June was about 17 percent. Calculating 83 * 0.1021 =
8.476 for the Euro and 83 * 0.1220 = 10.126 for the USD, we obtain estimates which are quite
close to the observed developments.
In order to check for robustness of our results, we perform several addition estimations. We
estimate (G)ARCH models in order to correct for potential volatility cluster which can be fre-
quently observed in financial markets. However, our models do not find evidence of (G)ARCH
effects. For the estimation of the stock market impacts, we use a different sample based on
MSCI data. We find nearly identical results. We also use 6-month and 9-month futures instead
of the 3-month interest rate and obtain nearly identical results.
-36-
Comparing our results with those presented by Krause et al. (2016), we find qualitatively sim-
ilar results. Although results cannot be compared quantitatively due to differences in the varia-
bles used to measure the Brexit probability29, it is worth to mention that Krause et al. (2016)
find strong effects on stock prices, government bond yields and the British pound. However,
while the authors find significant effects for the UK, impacts on German, European and US
variables are significantly smaller and in most cases insignificant. Another study by Arnorsson
and Zoega (2016) finds a (very) strong effect on the British pound. Based on their results, a one
percentage point increase in Brexit Polls lowers the external value of the pound vis-à-vis the
Euro by 1.1 percent. As both studies are based on poll data, the differences might be caused by
differences in the exogenous variables. However, the results suffer from a weak amount of
explanatory power as indicated by the R^2 of their estimations.
Gerlach and Di Giamberardino (2016) use an approach which is related to ours; but they restrict
their estimations on the effects on the British pound (we include more countries and their ex-
change rates) and do not correct for expectations of future monetary policy, as we do. They find
that an increase of one percentage point in the Brexit probability depreciates the Pound against
the USD by about 0.21%. Our results point in the same direction but are somewhat smaller
(around 0.12%). Regarding the effects on stock prices, Raddant (2016) focuses on the immedi-
ate impact after the referendum. While he also observes strong negative effects on European
stock markets, he concludes that the Italian stock market is highly affected by Brexit, despite a
relatively low connection between both markets. His result is corroborated by our estimations.
However, we observe a similar pattern for Portugal and Spain as well.
Regarding the most recent developments in equity markets in Europe, we have observed a rel-
atively strong recovery after the EU-referendum in the UK. For example, the Stoxx Europe 600
was priced at around 346 points before Brexit and subsequently decreased by about 11%. On
22nd of September 2016, the index was again at 347 points. Some authors evaluate the devel-
opment by stating that the effects of Brexit have already vanished. We argue that the recovery
of prices does not indicate that Brexit had only a little or no effect. First of all, stock prices are
assumed to follow a random walk. Therefore, past shocks – like Brexit – still have an effect on
current prices. Furthermore, stock prices are highly information-efficient. As new information
are priced in, the new (good) news might (over-)compensate the effects of past news. As we do
29 The authors use poll results from whatukthinks.org and in order to construct a dummy variable for time periods when the support for “leave” surpasses the support for “remain”.

-37-
not know the counterfactual i.e. the equity price development without Brexit, we cannot state
that Brexit effects have already vanished by simply observing recent price developments.
5. Conclusions
In this paper, we have assessed the impact of Brexit uncertainty on the UK and also on interna-
tional financial markets, for the first and the second statistical moments. Firstly, we estimated
the time-varying interactions between UK policy uncertainty, which can to a large extent be
attributed to Brexit uncertainty, and UK financial market volatilities (second statistical mo-
ment) and identified the substantial role of policy uncertainty for financial market volatilities.
The policy uncertainty induced by the Brexit referendum resulted in huge spillovers to financial
markets, with magnitudes that were never observed before. Moreover, the policy uncertainty
spillovers remained strong since then, suggesting that political uncertainty concerning the de-
velopment of the relationship between the United Kingdom and the EU causes turbulences on
financial markets even 3 months after the vote. This can further weaken investment and hiring
in the UK (and Europe). Seen on the whole, thus, we feel legitimized to corroborate the view
of IMF (2016) and others that Brexit-caused policy uncertainty will continuously cause insta-
bility in key financial markets and has the potential to do damage to the British (and, as shown
in section 4, also other European countries’) real economy as well, even in the medium run.
Secondly, we used two other measures of the perceived probability of Brexit, namely daily data
between 1st of April to the 23rd of June 2016 of probabilities released by Betfair as well as
(aggregated) results of polls published by Bloomberg. Based on these datasets, we analyzed the
Brexit effect on the levels of stock returns, sovereign CDS, ten-year interest rates of 19 different
countries predominantly from Europe as well as the British pound and the euro (first statistical
moment). Here, we find evidence that an increase in Brexit probability has especially strong
effects on European stock markets. Regarding the effect on long-term interest rates and CDS,
we observe a large heterogeneity across countries which can be related to the differences in
sovereign credit risk. The main cause of this pattern might be related to an expected decrease
in economic activity which might further jeopardize the sustainability of government debt. As
Brexit might have unforeseeable effects on the stability of the entire EU, the effects may simply
be generated by an increase in the, according to our view, still low probability of a breakup of
the Euro area or the EU. Regarding the effect on the exchange rate, we find that an increase in
the Brexit probability leads to a depreciation of the British pound. Based on the results gained
in our paper, the main losers outside of the UK appear to be the GIIPS economies which are

-38-
already struggling with the still ongoing sovereign debt crisis. So, how to explain the current
lack of an even bigger (real economic) impact? It may just be because Brexit has not happened
yet.
-39-
References
Alizadeh, S., Brandt, M. W., Diebold, F.X. (2002): Range-based estimation of stochastic vol-atility models, Journal of Finance 57, 1047–1092.
Arnorsson, A., Zoega, G. (2016): On the causes of Brexit, CESifo Working Paper 6056, Mu-nich, August.
Bank of England (2015): EU membership and the Bank of England, London, October.
Bank of England (2016): Inflation Report, London, August.
Baker, S, Bloom, N and Davis, S (2015): Measuring economic policy uncertainty, NBER Working Paper No. 21633, National Bureau of Economic Research, Cambridge/MA, October.
Begg, I. (2016): European economic governance in the aftermath of Brexit: integrating or disintegrating?, Presentation at the Jean Monnet Conference “Economic prospects for the European Union - Challenges for economic policy until the end of the decade”,Duesseldorf, September 23-24.
Belke, A., Gros, D. (2002): Designing EU–US Atlantic monetary relations: Exchange rate variability and labour markets on both sides of the Atlantic, The World Economy, 25/6, 789-813.
Blockmans, S. Emerson, M. (2016): Brexit's Consequences for the UK - and the EU, CEPS Commentary, Centre for European Policy Studies, Brussels, June 6.
Bruegel (2016): Europe after Brexit: A proposal for a continental partnership, Brussels, Au-gust.
Bruno, R., Campos, N., Estrin, S., Tian, M. (2016): Gravitating towards Europe: an econo-metric analysis of the FDI effects of EU membership, CEP Technical Paper, Brexit Analysis, 3, London.
Crafts, N. (2016): The growth effects of EU membership for the UK: a review, mimeo, Uni-versity of Warwick.
Campos, N. (2016): Lousy experts: looking back at the ex ante estimates of the costs of Brexit,VoxEU, August 4.
Campos, N.F., Coricelli, F., Moretti, L. (2014): Economic growth and political integration: estimating the benefits from membership in the European Union using the synthetic counterfactuals method, CEPR Discussion Paper No. 9968, Center for Economic Pol-icy Research, London.
Cheung, Y.M., Ng, L.K. (1996): A causality-in-variance test and its application to financial market prices, Journal of Econometrics 72, 33-48.
Correia Fernandes, M. (2016): How will Brexit impact deposit balances in the UK? A forecast of sight deposits on UK monetary financial institutions’ using Structural Break in the Holt Method, ISCTE – University Institute of Lisbon, Observatório Lusófono de Ac-tividades Económicas.
D’Addona, S., Musumeci, I. (2011): The British opt-out from the European Monetary Union: empirical evidence from monetary policy rules, CREI Working Paper 6/2011, CREI Centro di Ricerca Interdipartimentale di Economia delle Istituzioni, Universita Romea Tre, Rome.
-40-
Dhingra, S., Ottaviano, G., Sampson, T. (2015): Should we stay or should we go? The eco-nomic consequences of leaving the EU, Paper EA022, Centre for Economic Perfor-mance, London.
Diebold, F.X., Yilmaz, K. (2009): Measuring financial asset return and volatility spillovers, with application to global equity markets, Economic Journal 119, 158-171.
Diebold, F.X., Yilmaz, K. (2012): Better to give than to receive: predictive directional meas-urement of volatility spillovers, International Journal of Forecasting 28(1), pages 57-66.
Eichengreen, B., Gupta, P., Ospino, A. (2016): The Brexit surprise and emerging markets,VoxEU, July 4.
Economists for Brexit (2016): web: http://www.economistsforbrexit.co.uk/.
European Commission (2016): The economic outlook after the UK referendum: a first assess-ment for the Euro Area and the EU, Institutional Paper 032, European Economy, Brus-sels.
Fournier, J.-M., Domps, A., Gorin, Y., Guillet, X., Morchoisne, D. (2015): Implicit regulatory barriers in the EU single market, OECD Economics Department Working Paper No. 1181, Organisation for Economic Co-operation and Development.
Gerlach, S. (2016): What Brexit surveys really tell us, VoxEU, Mai 6.
Gerlach, S., Di Giamberardino, E. (2016): The Brexit referendum and sterling, VoxEU, June 10.
Gordon, M.J., Shapiro, E. (1956): Capital equipment analysis: the required rate of profit, Management Science 3(1), 102-110.
Gros, D. (2011): Euro crisis reaches the core, VoxEU, August 11.
Gros, D. (2016): The Economics of Brexit: It’s not about the Internal Market, CEPS commen-tary, Centre for European Policy Studies, Brussels, September 22.
Hafner, C. M., Herwartz, H. (2006a): A Lagrange multiplier test for causality in variance,Economic Letters 93, 137-141.
Hafner, C. M., Herwartz, H. (2006b): Volatility impulse responses for multivariate GARCH models: An exchange rate illustration", Journal of International Money and Finance25/5, 719-740.
Hafner, C.M., Herwartz, H. (2008): Testing for causality in variance using multivariate GARCH models, Annales d'Économie et de Statistique 89, 215-241.
International Monetary Fund (2016): Uncertainty in the aftermath of the U.K. referendum,World Economic Outlook Update, International Monetary Fund, Washington/DC, July 19.
International Monetary Fund (2016a): United Kingdom – Selected issues, IMF Country Re-port No. 16/169, International Monetary Fund, Washington/DC, June.
McCrum, D., Moore, E. (2016): Brexit fears fuel market rush for safety, Financial Times, June 14.
Krause, T., Noth, F., Tonzer, L. (2016): Brexit (probability) and effects on financial market stability, IWH Online, 5/2016, Halle Institute for Economic Research.
Lazowski, A. (2016): Procedural steps towards Brexit, CEPS Commentary, Centre for Euro-pean Policy Studies, Brussels, July 13.
-41-
Mansfield, I. (2014): A blueprint for Britain: Openness not isolation, Institute of Economic Affairs, London.
London School of Economics (2016): LSE Commission on the future of Britain in Europe –Overview and summary of reports, LSE European Institute, London.
OpenEurope (2015): What if...? The consequences, challenges and opportunities facing Brit-ain outside the EU, OpenEurope, London, web: http://openeurope.org.uk/intelli-gence/britain-and-the-eu/what-if-there-were-a-brexit/.
Raddant, M. (2016): The response of European stock markets to the Brexit, Kiel Policy Brief No. 100, Institute for the World Economy, Kiel, August.
Sheffield, H. (2016): Why the FTSE 100 at a post-Brexit high is not necessarily good news,The Independent, 1 July, web: www.independent.co.uk/news/business/news/pound-sterling-ftse-100-250-brexit-eu-referendum-recovery-a7111156.html.
Van der Loo, G., Blockmans, S. (2016): The Impact of Brexit on the EU’s International Agreements, CEPS Commentary, Centre for European Policy Studies, Brussels, July 15.
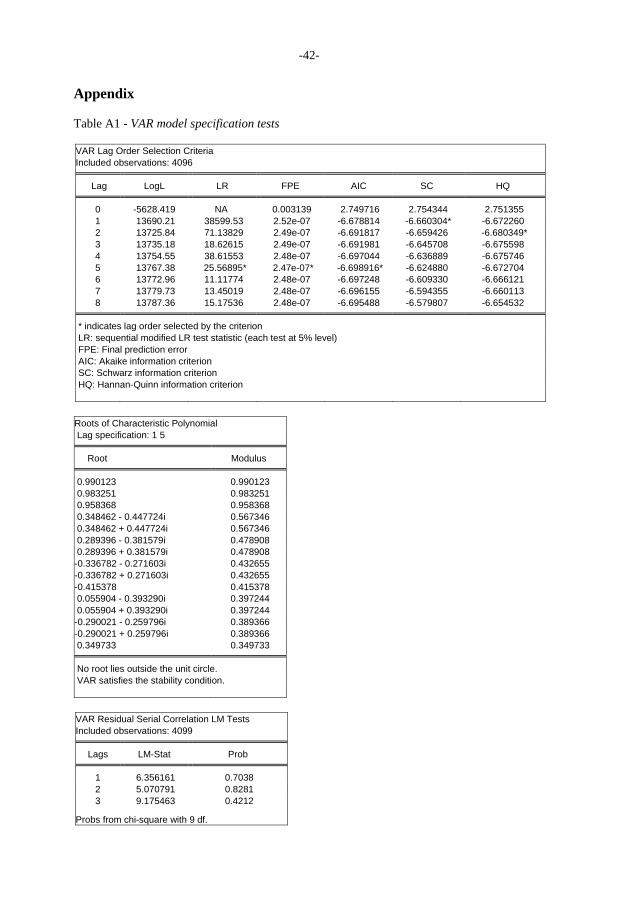
-42-
Appendix
Table A1 - VAR model specification tests
VAR Lag Order Selection CriteriaIncluded observations: 4096
Lag LogL LR FPE AIC SC HQ
0 -5628.419 NA 0.003139 2.749716 2.754344 2.7513551 13690.21 38599.53 2.52e-07 -6.678814 -6.660304* -6.6722602 13725.84 71.13829 2.49e-07 -6.691817 -6.659426 -6.680349*3 13735.18 18.62615 2.49e-07 -6.691981 -6.645708 -6.6755984 13754.55 38.61553 2.48e-07 -6.697044 -6.636889 -6.6757465 13767.38 25.56895* 2.47e-07* -6.698916* -6.624880 -6.6727046 13772.96 11.11774 2.48e-07 -6.697248 -6.609330 -6.6661217 13779.73 13.45019 2.48e-07 -6.696155 -6.594355 -6.6601138 13787.36 15.17536 2.48e-07 -6.695488 -6.579807 -6.654532
* indicates lag order selected by the criterionLR: sequential modified LR test statistic (each test at 5% level)FPE: Final prediction errorAIC: Akaike information criterionSC: Schwarz information criterionHQ: Hannan-Quinn information criterion
Roots of Characteristic PolynomialLag specification: 1 5
Root Modulus
0.990123 0.9901230.983251 0.9832510.958368 0.9583680.348462 - 0.447724i 0.5673460.348462 + 0.447724i 0.5673460.289396 - 0.381579i 0.4789080.289396 + 0.381579i 0.478908
-0.336782 - 0.271603i 0.432655-0.336782 + 0.271603i 0.432655-0.415378 0.4153780.055904 - 0.393290i 0.3972440.055904 + 0.393290i 0.397244
-0.290021 - 0.259796i 0.389366-0.290021 + 0.259796i 0.3893660.349733 0.349733
No root lies outside the unit circle.VAR satisfies the stability condition.
VAR Residual Serial Correlation LM TestsIncluded observations: 4099
Lags LM-Stat Prob
1 6.356161 0.70382 5.070791 0.82813 9.175463 0.4212
Probs from chi-square with 9 df.

-43-
Figure A1 - Robustness Check30
a) Total Spillover Index for different lag choices
b) Total Spillover Index for different forecast horizon choices
c) Total Spillover Index for different rolling window choices
30 Additional robustness check results for other spillover indices are available upon request.