polio survivors in the u.s., 1915-2000 age distribution...
TRANSCRIPT

Polio Survivors in the U.S., 1915-2000 Age Distribution Data
Lawrence C. Becker
Prepared for the Board of Directors Post-Polio Health International
October, 2006
© Post-Polio Health International
2
Contents
Summary of Results…3 Sources and Methods…7 Age Distribution Data: USPHS and NHIS…13 ……. blank pages…24 ___________ Appendix I: Additional Demographic Charts…26 Appendix II: Data Tables…30 Appendix III: Notes on the Numbers…35

3
Summary of Results1 Conflicting and Incomplete Estimates. Counts of the total number of polio survivors
living in the US differ dramatically from one another. They range from a high of around two million (an estimate constructed in 1987, and sometimes incautiously repeated to this day2) down through approximately one million (an estimate usually constructed with data from 1994-1995, but also still floating around in some quarters as if it were current) and bottoming out at a presumably more current estimate of around 600,000, or perhaps 500,000. It is difficult, however, to get a clear idea of the reliability of these conflicting estimates, the methods used to construct them, and sometimes even the sources used for them.
Moreover, by themselves, estimates of the total number of polio survivors tell us nothing about the age distribution of those survivors, the extent of their paralysis, and the extent of post-polio syndrome in the population. For policymaking purposes, age distribution in particular is a crucial concern, and only the sketchiest information on this topic seems to be readily available. Current estimates are not only conflicting, then, they are incomplete.
Given the importance of good estimates for our strategic planning purposes, it is wise to take a thorough look at the raw data from the best available sources, and to choose (or construct) the best estimates available. This will include getting accurate information on age distribution. Incautious use of raw numbers or of outdated estimates is unwise.
Sources and Methods. There are two types of raw data that are reasonable candidates
for estimating the total number of polio survivors in the US. One source is self-reported -- data gathered from reliable interviews with representative samples of people who report that they themselves had polio. The other source is officially-reported -- data on medically diagnosed cases of polio recorded by public health agencies.
The National Center for Health Statistics (a Division of the Centers for Disease Control) is the best source for both sorts of data, but for each sort, the raw numbers need to be adjusted to account for probable under-reporting, probable over-reporting, and the probable life expectancy of polio survivors, among other things. The self-reported data also contains information on age, medical history, and other demographic matters, but it too needs careful analysis.
1 I am grateful for the patient and generous help of a number of people during the preparation of these estimates. This whole venture started from some remarks Daniel J. Wilson makes about the age-of-onset polio data in his book Living with Polio (University of Chicago Press, 2005). Dan later referred me to classic epidemiological essays on that topic, and introduced me to David Rose, archivist, March of Dimes Foundation. Mr. Rose supplied me with a good deal of raw data on the period from 1915-1960. Joan Headley has kept PHI current with information from government sources and has published estimates from time to time in PHI newsletters. She encouraged me to contact the epidemiologist Nancy A. Myers, who presented highlights of her analysis of the 1994-95 NHIS data at our 2005 conference. Professor Myers was very helpful in guiding my analysis, and in providing me with some detailed data from the survey. Dan Wilson, Nancy Myers, and Joan Headley all commented helpfully on an earlier draft of this essay. Thanks are also due to Amanda Hurst, of the Robertson Library at Hollins University, and to my research assistant, Meia Crites. LCB 2 The estimate of 2 million is quoted, for example, in the introductory material of a training video about treating people with post-polio syndrome that is used in some continuing education classes for physical therapists. The estimate was unsourced, and although other parts of the video had obviously been brought up to date, this part of it had not been changed since the original production of the video sometime in the mid-90s.

4
Starting Fresh. It thus seems important to invest the time needed to examine the available sources of information behind the variety of estimates in use, bringing them up to date, and getting good estimates of the age distribution and other demographic characteristics of the polio population. This turns out to be a fairly demanding task -- especially if one wants to examine the raw data for oneself, and redo the calculations, in ways that are most likely to be relevant to our planning needs. The difficulties will be explained at length in the body of this report, and in its appendices. The conclusions, however, are basically as follows.
Best Estimates. In 2006 there appear to be roughly 775,000 self-reported polio
survivors living in households in the United States.3 (We have no reliable information about the number currently living in institutions such as nursing homes and assisted living facilities.)
Of that 775,000, roughly 426,000 describe a medical history that is clearly consistent with paralytic polio and/or clearly consistent with being at risk for post-polio syndrome. At least 194,000 believe they are experiencing the effects of post-polio syndrome, though perhaps only 86,000 report having had a formal diagnosis of PPS.4 Further, we can reliably estimate that 53% of the people in each of these groups are now, in 2006, over the age of 65.
We recommend using the figure of 426,000 (55% of self-reported cases) as the fraction of most interest for our purposes. 5 It excludes from the overall total only those interviewees who report a medical history inconsistent with paralytic polio, or inconsistent with known risk factors for post-polio syndrome. Again, 53% of these people are currently over the age of 65.
Best Estimates for the Next 20 Years. The best actuarial assumption about the life
expectancy of polio survivors in the US seems to be that, on average, it now matches average life expectancy for the general population in the US. We may therefore estimate the numbers beyond 2006 in the following self explanatory tables. More detailed graphs, and a much more detailed
3 This is a general population estimate drawn from a careful survey of a representative sample of US households done in 1994-95, when a special questionnaire on polio was included in the National Health Interview Survey (NHIS) done annually by the National Center for Health Statistics. Eleven years ago, those survey results yielded a general population estimate of roughly one million self-reported polio survivors, but to get numbers for 2006 we must adjust those estimates downward to account for mortality (which the available evidence suggests tracks mortality for the general population), and upward to account for immigration (which the available evidence indicates is statistically negligible), as well as for people who are institutionalized (for example in nursing homes or assisted living facilities). We will also follow Nancy A. Myers in excluding from the original sample all of those respondents who, though they insisted they had had polio, could not say when they had had it, or at what age, and who generally could not or did not respond to other significant questions about their medical history. Myers thus reduces the general population estimate (for 1994-95) to 920,000. 4 These numbers related to PPS are adjusted downward for mortality between 1995 and 2006, but not adjusted upward for new cases of PPS experienced or officially diagnosed during those years. So they are undoubtedly low, but there seems to be no defensible way to estimate the extent of the upward adjustment needed. We therefore recommend focusing on the entire population of most interest -- the 426,000. 5 The grand total of cases (580,659), both paralytic and nonparalytic, reported to United States Public Health Service between 1915 and 1997, when the last indigenous case of polio in the US was reported, yields the understandably lower estimate of 305,000 polio survivors in 2006. This reflects the well-known underreporting of cases that occurred throughout the 20th century, especially in the years before 1933 when the roster of states reporting to the USPHS was incomplete. It would, however, presumably include people who are now institutionalized.

5
explanation of the raw data and the nature of the assumptions and computations needed to generate these estimates are given in the body of the report and its appendices.
National Health Interview Survey, 1994-95 self-reported polio survivors of most interest (55% of NHIS total)
estimates adjusted for expected mortality
Date Est. # of Survivors
#,% older than 44
#,% older than 54
#,% older than 64
#,% older than 74
#,% older than 84
2006 426,000 421,000 (99%)
379,000 (89%)
224,000 (53%)
101,000 (24%)
31,000 (7%)
2016 315,000 315,000 (100%)
310,500 (98%)
270,000 (86%)
132,500 (42%)
39,000 (12%)
2021 230,000 230,000 (100%)
228,000 (99%)
216,000 (94%)
131,500 (57%)
13,000 (5%)
2026 157,500 157,500 (100%)
157,500 (100%)
153,300 (97%)
120,500 (76.5%)
34,500 (22%)
As the table indicates, ten years from now, in 2016, 86% of the current population of polio survivors in the US will be 65 years of age or older, and 42% will be 75 or older. 20 years from now, in 2026, those figures will be 97% and 76.5%, respectively. This is a vivid reminder of the effectiveness of the vaccines introduced in 1955. The number of polio cases each year in the US declined dramatically thereafter -- especially after 1957. The other important factor to consider is that during the epidemics of the late 40s and early 50s, most of the cases of paralytic polio were in people ten years of age or older.6
The following table presents the same data organized to show how many people in the US, of what ages, might continue to need medical care for PPS in the coming years.
National Health Interview Survey, 1994-95
self-reported polio survivors of most interest (55% of NHIS total) estimates adjusted for expected mortality
Date Est. # of Survivors
# younger than 45
# younger than 55
# younger than 65
# younger than 75
# younger than 85
2006 426,000 4,700 47,000 202,000 325,000 395,000 2016 315,000 0.001 4,500 45,000 182,500 276,000 2021 230,000 0.001 1,800 14,000 98,500 217,000 2026 157,500 0.001 0.001 4,200 37,000 123,000
Ten years from now, for example, there will still be 276,000 such polio survivors under the age of 85, even though only 4,500 of them will be younger than 55. Twenty years from now, in 2026, 123,000 under the age of 85 will remain, though only 37,000 of them will be younger than 75, and only 4,200 of those will be younger than 65.
6 This is outlined in detail in the discussion to follow. See also the discussion of the demographics in Daniel J. Wilson, Living with Polio: the Epidemic and Its Survivors (Chicago: University of Chicago Press, 2005), pp 14-16; 230-231; 250.
6
Other Demographic Estimates of Interest. The data from the National Health Interview Survey of 1994-95 also yield general population estimates about the living arrangements, income levels, educational levels, gender ratio, and race/ethnic origin of polio survivors. These data are summarized in Appendix I. The charts in that appendix give estimates for 1996. Some of these percentages (for example of education level) would presumably remain roughly accurate through 2006 and future years. Others, such as living arrangements and family income levels, are likely to change.
Level of Confidence in the Results. The results in this report are still in need of
refinement by demographers. But there is reason to be confident that they are reliable enough for our present purposes.
The aim in what follows is to give enough detail about the sources and methods behind the estimates, and enough of the raw data to make it possible for members of the board and other readers to assess the reliability of the estimates for themselves.

7
Sources and Methods Objectives. Ultimately, we need to get solid information on the age distribution of polio
survivors worldwide. But that is beyond the scope of the effort here, and since our traditional core constituency has been North American, and most heavily concentrated in the US, that seemed the place to start. The aim was to get good information not only about the total number of survivors in 2006, but on the age distribution of that population today. Methods for making estimates for the future were then employed to make the relevant calculations. Sources. There are two basic sorts of data that one can plausibly use in this effort.
1) USPHS data. The first sort is the "officially-reported" incidence data from morbidity and mortality reports made to public health authorities. For convenience, officially reported incidence data will be referred to as United States Public Health Service (USPHS) data in what follows. All but the Massachusetts data comes directly from the National Center for Health Statistics, a Division of the Centers for Disease Control, and is publicly available through their website or through government depository libraries. MMWR. The National Center for Health Statistics (CDC) publishes annual summaries of the “Morbidity and Mortality Weekly Report” (MMWR), which give data on the reported incidence throughout the United States of a lengthy list of diseases and medical conditions. At the end of each annual summary one can find historical tables that reach back as far as a decade from the date of publication. These historical tables express the final, corrected version of the data in the weekly reports and annual summaries, and the numbers from those corrected tables are the ones used here.
Vital Statistics of the United States. These reports, also published by the National Center for Health Statistics, give final, corrected mortality data for the list of diseases and conditions in the MMWR, and also calculate historical trends and life expectancy. One can then use the annual mortality data to subtract deaths during the acute phase of polio from the total incidence of the disease each year. Unfortunately, there does not seem to be any data reported on polio as an underlying cause of death following the acute phase.
It should be noted that only "indigenous cases" of polio are reported by the USPHS. People living in the US but who contracted polio (and were treated during the initial phase) outside the US are not represented in these reports. Further, as late as 1929 data from only 20 states was routinely available to the United States Public Health Service, and until 1933 the reporting system remained incomplete. USPHS data from the years before 1933 thus almost certainly underreport the incidence of polio substantially, even though they do report data from the most populous states. They also underreport cases treated outside the official medical system in the reporting states, and that probably means that mild or nonparalytic cases -- especially in subpopulations without easy access to physicians -- are underreported. There does not appear to be any generally accepted way of compensating for such underreporting. See the appendix on "Notes on the Numbers" for further discussion of this and other problems with the USPHS data.
Life Tables of the United States. These reports give life expectancy data for the general population in the US and various subcategories of it (by state, by sex, etc.). All the charts in the pages to follow use the "Life Tables of the United States, 2003" to calculate the mortality rate for polio survivors throughout the period 1915-2006. This is the latest year for which final data are now available.
8
Massachusetts Data (1912-1952) on Age-of-Onset. In order to calculate the age distribution of polio survivors for officially reported cases, we need to know their year of birth. Age is not reported in the USPHS sources mentioned above, however. Epidemiologists have therefore relied upon the age data kept by some states and municipalities. The most complete and representative of these sources is apparently the "age-of-onset" information collected by Massachusetts between 1912 and 1952 -- though the years 1917-1919 and 1945-1948 are missing. Data for those years, and for years after 1952 have to be imputed. See the discussion below under "Methods," and the "Notes on the Numbers."
2) NHIS data. The second sort of data used here is the "self-reported" information on polio survivors gathered in The National Health Interview Survey done in 1994-95.
The National Health Interview Survey (from the National Center for Health Statistics, available through their website) is an annual event, using a representative sample of 100,000 US households. Lengthy questionnaires are administered in face-to-face interviews. Phase I of the survey each year goes to all 100,000 households. Phase II, the "follow-back" survey, goes back to a representative subset of roughly 20,000 households from the original sample in order to address, with additional face-to-face interviews, some topic of special concern for the year.
In 1994, the topic of special concern was people with disabilities generally, and more specifically people who reported themselves to be polio survivors. (A less satisfactory effort by the NHIS in 1987 had yielded a problematic estimate of 2 million polio survivors.) Such self-reported polio survivors were given a lengthy questionnaire, carefully constructed with the help of physicians who had special expertise in post-polio syndrome. Because the polio sample in 1994 turned out to be too small by itself for making general population estimates, the questionnaire was administered again in the 1995 NHIS. Those two years yielded a combined, carefully structured and representative sample of 566 self-identified polio survivors from a total two-year Phase I survey population of 200,000, and a two-year Phase II follow-back population of roughly 40,000.
This survey data is attractive because it includes information about age distribution, income distribution, and severity of disability, among other things. It also covers all legal residents as well as US citizens, and reflects not only the number of survivors of indigenous cases of polio, but also those survivors who acquired polio outside the US.
Use of this data depends, however, on a number of assumptions. It assumes that self-reported cases of polio, without any medical confirmation, can be relied upon; that the sample of 566 polio survivors interviewed constitutes a genuinely representative sample of US households; that we can live with the fact that the survey reaches only "non-institutionalized" persons -- that is, people in households rather than prisons, nursing homes, assisted living facilities, and so on. See the “Notes on the Numbers" for further discussion of these issues. Methods. The summary of the data here begins with what are presumably the "hard" numbers of officially reported cases -- the USPHS cases -- from the year before the big epidemic of 1916, through the end of the 20th century. (The last indigenous case of polio in the US was reported in 1997.) The 1915 beginning date was convenient in terms of the available USPHS data, and seemed safe enough given that infants who acquired polio in 1915 would now be 91 years old, and that there would be very few of those still surviving, and even fewer surviving from earlier years or later onsets in 1915. Those USPHS numbers are then compared with the estimates derived from the NHIS.

9
Working with the USPHS Numbers. The first step was to take the year-by-year incidence reports (totaling 580,659 officially reported cases), and to subtract year-by-year deaths reported from acute polio. There were 59,025 such deaths, leaving an otherwise unadjusted total of 521,626 survivors. That number, as mentioned above, does not correct for mortality after the initial phase, for underreporting during the years before 1933, for underreporting of cases treated outside the medical system, or for other problems detailed in the "Notes on the Numbers."
The next step was surprisingly speculative, and softened up the "hard" numbers considerably. It involved getting birth-year data for these 521,626 survivors by applying the Massachusetts age-of-onset numbers to the year-by-year totals. Doing this requires making three significant assumptions.
First, one has to assume that Massachusetts is representative of the nation throughout the century in terms of the incidence of polio. Reputable epidemiologists have made this assumption, especially prior to the NHIS polio survey in 1994-95.7 But this is certainly far from the ideal situation.
Second, since the versions of the Massachusetts data readily available from secondary sources were given only in the age ranges 0-4, 5-9, and 10+, and we needed to calculate a specific birth year for each survivor, it was necessary to pick a point estimate for each of those ranges. It seemed reasonable to chose midpoints for the first two ranges -- ages 2 and 7, respectively -- and the age of 15 for the last range. It looks as though these choices might have contributed to some minor differences in age distribution shown in the charts comparing USPHS and NHIS numbers.
Third, anyone using the Massachusetts data in this way has to impute numbers from the seven years missing from it between 1915-1952, and to extrapolate numbers along a trend-line for the entire run of years from 1952-1997, when the last case was reported. The trend-line is reasonably clear, and the number of cases after 1963 declined so rapidly toward single digits that this assumption was probably not too harmful. But the "smoothness" that it introduced might also have contributed to some differences in the comparison between USPHS and NHIS data.
In any case, once these assumptions are made, one can estimate birth years for the survivors of USPHS reported cases, and apply life expectancy probabilities from the United States Life Tables to them. Strictly, since life expectancy in the US rose dramatically during the middle third of the 20th century, and has continued to rise at a slower rate, one should apply the probabilities annually to the running total of survivors in each year, using the life expectancy data from the contemporaneous Life Table. The USPHS estimates here are more generous about survival, because they begin by taking the total of all reported cases of polio, minus deaths in the acute phase, and then by applying the life expectancy probabilities just once, from the latest available life table (2003), to get an estimate of survivors in the year 1996. The method adopted here then adds 10 years to the life of each of those survivors, and uses the 2003 life table again to calculate the probability that those "older" people would still be alive in 2006, and repeats that sort of process for 2016, 2021, and 2006.
7 See Neal Nathanson and John R. Martin, "The Epidemiology of Poliomyelitis," American Journal of Epidemiology 110 (1979): 672-692, at 676. They cite as a precedent "one of the most incisive epidemiological reviews of the disease ever published," A.B. Sabin's "Epidemiologic Patterns of Poliomyelitis in Different Parts of the World," in Poliomyelitis: Papers and Discussions Presented at the First International Poliomyelitis Conference (Philadelphia: Lippincott, 1949), Pages 3-33.

10
All of this manipulation reduces one's confidence in the estimates based on USPHS reported cases -- at least unless they turn out to be roughly comparable to the NHIS figures. (They are comparable, with an exception which will be discussed as we go through the charts.)
Working with the NHIS Numbers. The survey data include, for each respondent, date of birth, year in which polio was acquired, whether an official diagnosis of paralytic polio was given, the extent of initial muscle weakness and initial rehabilitation, extent of continuing limitations from polio, whether PPS has been diagnosed, current living arrangements, family income, and much more. It is therefore an elaborate resource for making inferences about the population of polio survivors in the US in 1994-95, including their age distribution. Plausible estimates for 2006, 2016, 2021, in 2026 can be constructed using the 2003 life table.
These estimates do not depend on the extensive manipulation required merely to get the initial age distribution numbers for the USPHS data. Further, underreporting is not the same sort of problem here, since the survey reaches people who did not have an official reported diagnosis of polio, as well as those people who got polio outside the US.
Reliance on the NHIS numbers does, however, require us to accept two rather large assumptions. One of these is about making inferences based on small samples rather than actual enumeration of cases. The other is about the reliability of self-reports.
Sampling. Can this sample support general population estimates? It is the professional judgment of the demographers and statisticians involved that the sample was large enough (n=566), and representative enough, to be multiplied by the number required to get a 1994-95 general population estimate of polio survivors living in households. We are not in a position to challenge this professional judgment. But we note two things about the sample:
One thing is that the sample excludes people who are institutionalized. That is certainly a limitation for our purposes, since we do not exclude them from our mission of serving polio survivors and ventilator users. We should therefore remember this gap in the data when using NHIS figures.
The other is that we should probably be cautious about relying on general population estimates drawn from very small fractions of the sample -- estimates drawn from 1% or 2% of the responses, for example.
Self-reported cases. Many of the questions on the NHIS polio survey dealt with information that one could expect people to know, rather than merely believe, and to be willing and able to report accurately. These include questions about age, sex, race, marital status, living arrangements, family income, existing level of physical disability, and a physician’s diagnosis of PPS. Unfortunately, we cannot have the same confidence in responses to some of the crucial questions central to our interest.
These crucial questions include those about the initial diagnosis of polio, the initial extent of muscle weakness, length of initial rehabilitation, and extent of lifelong limitations from polio. In these cases, people are being asked to report events that happened in the distant past, sometimes events that happened while they were infants, and which have been the stuff of family legend and the construction of personal identity. This can be a significant problem. For example, 31 of the 566 respondents -- all presumably certain that they had had polio -- were unable to give either the year in which they got it, or their age when they got it. (We will follow the epidemiologist Nancy Myers in excluding those respondents from the sample, thus reducing it to 535.)
More troubling is the substantial percentage of people in the sample who, while reporting confidently that they had had polio, also reported that they had never been weakened or limited

11
by it in any way. On the one hand, we know that some people who have had such beliefs throughout much of their lives have later turned out to be diagnosed with PPS. On the other, we know that some people who have always accepted the family legend that they had polio, and accepted that this explained certain of their physical limitations, have later found out under rigorous medical examination that their physical limitations were due to quite a different cause.8 So it isn't reasonable to exclude everyone from the sample who reports no weakness or limitation from polio, but neither is it reasonable to include everyone from that part of the sample.
This problem -- that is, the problem of how many of the self-reported cases of polio to treat as genuine cases of polio -- does present us with a significant difficulty in interpreting the NHIS. Here is an example of the difficulty.
In the Phase One surveys in both 1994 and 1995, interviewees were asked "Was anyone in the family EVER told by a doctor that they had polio, whether or not it resulted in a physical disability?" (Family, in this case, means enumerated members of the family in a particular household, not family members living elsewhere.) Interviewees who answered yes were asked to identify that person, and to say whether or not that person ever had paralysis of any kind caused by polio. The people identified in Phase I as "told by a doctor that they had polio" went into the pool from which a representative sample of 566 was ultimately selected for the follow-back interview. Nonparalytic cases were included. So far so good.
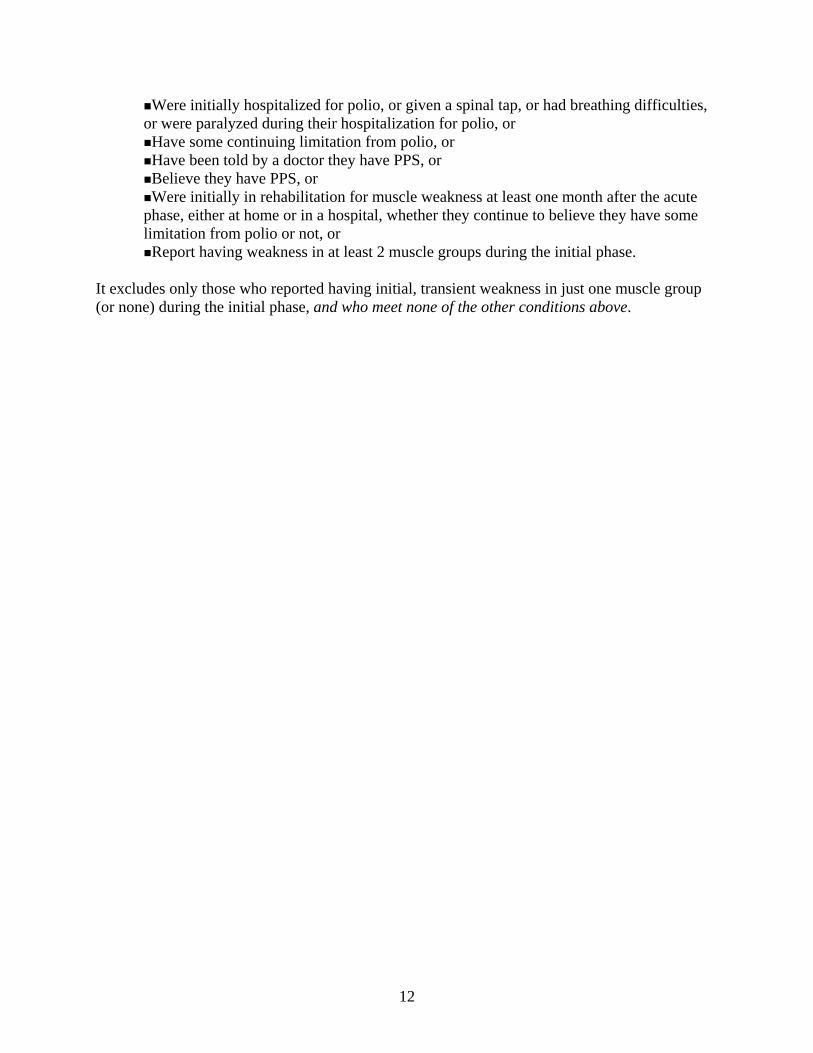
The Phase Two survey, however, doesn't really pin down the difference between "being told by a doctor" and being diagnosed by one.9 There is no direct question on this about polio simpliciter, though there is a direct one about whether the interviewees had later been "told by a doctor" that they had post-polio syndrome. Rather, people were asked to report on various things that happened "during [their] illness," or "when [they] had polio." And the few times the term ”diagnosis” is used it is used as a premise for another question. For example, "At the time you were diagnosed with polio, did you experience problems with breathing?" In the absence of a prior direct question about whether they had been diagnosed, logicians and trial lawyers would regard such questions as objectionable, because they call for a yes or no answer that does not give the respondents a chance to reject the premise. This situation isn't very tidy, for our purposes. For example: Many people who were in close contact with family members or friends who had paralytic polio were told by physicians (after the fact) that they themselves had probably had a mild or nonparalytic case of polio. This would not, of course, have risen to the level of something the physician regarded as a diagnosis, let alone a diagnosis that should be reported to the public health service. But it is pretty clear that such words can produce, over time, a firm belief in people that they have been “told by a doctor" that they had polio -- and a reluctance to challenge the premise of a question that begins "At the time you were diagnosed with polio…" For this reason, and others described at length in the "Notes on the Numbers," this report adopts a compromise: 55% of the NHIS polio sample was identified as being most likely to be of interest to us for planning purposes. That 55% figure captures all of the respondents who:
8 See case reports illustrating these two forms of mistaken belief in Julie K. Silver, Post Polio Syndrome (New Haven: Yale University Press, 2001), Pages 23-25. 9 The questionnaire begins with the interviewer saying "Earlier we were told that you had polio," and giving this instruction as a preface: "I'm going to ask some questions about... your illness. Because you may have been too young to remember much, just answer the best you can based on what your parents or other family members and friends told you."
12
Were initially hospitalized for polio, or given a spinal tap, or had breathing difficulties, or were paralyzed during their hospitalization for polio, or Have some continuing limitation from polio, or Have been told by a doctor they have PPS, or Believe they have PPS, or Were initially in rehabilitation for muscle weakness at least one month after the acute
phase, either at home or in a hospital, whether they continue to believe they have some limitation from polio or not, or
Report having weakness in at least 2 muscle groups during the initial phase. It excludes only those who reported having initial, transient weakness in just one muscle group (or none) during the initial phase, and who meet none of the other conditions above.

13
Age Distribution Data: USPHS and NHIS
Here are the “hard” numbers, calculated from the USPHS data on reported cases, 1915-2000. It begins with an overview of reported cases, shown year by year. (After 1966, when the numbers dropped near or below 100 each year, they do not show up on this chart.)
There were, in all, 580,659 officially reported "indigenous" cases of polio in the United States between 1915 and 1997 when the last such case was recorded. Of these, 521,626 survived the acute phase, and the survivor numbers from each year are the ones shown.
USPHS Reported Cases, 1915-2000: 521,626 Survivors after the Acute Phase, from among the 580,659 Total Cases Reported
0
10,000
20,000
30,000
40,000
50,000
60,000
1915
1918
1921
1924
1927
1930
1933
1936
1939
1942
1945
1948
1951
1954
1957
1960
1963
1966
1969
1972
1975
1978
1981
1984
1987
1990
1993
1996
1999
Years
Num
ber o
f Cas
es
Survivors
The largest epidemic, in terms of the percentage of cases in the total population of United States, was in 1916, when there were 27,363 cases reported, though only 20,184 survived the acute phase. The largest epidemic in terms of raw numbers is by far 1952, however, when within a much larger general population there were 57,897 reported cases, with 54,734 survivors of the acute phase. The epidemic in 1952 was also the second largest in percentage terms.
Note the significant drop in the mortality rate by 1952. The rate was 26% in 1916, and 5% in 1952.
There was also a dramatic shift in the age-of-onset numbers between 1916 and 1952 -- something that is not shown on this chart. In 1916, the Massachusetts data indicate that roughly 69% of the cases were in people under the age of 5, and only 11% were 10 or older. In 1952, only 19% were under the age of 5, while fully 53% were 10 or more.10
10 Nathanson and Martin, 676.

Now look at the age distribution of survivors, calculated on the assumption that the Massachusetts age-of-onset data are representative of the United States as a whole.
USPHS 1996: 424,310 Survivors from Reported Cases, 1915-1996
73 1212,715
23,273
60,019
74,495
113,118
65,265
22,509
13,56710,356
2,381 413 0 0
36,005
0
20,000
40,000
60,000
80,000
100,000
120,000
0-29 30-34 35-39 40-44 45-49 50-54 55-59 60-64 65-69 70-74 75-79 80-84 85-89 90-95 96-100
100+
Age Ranges
Num
ber o
f Sur
vivo
rs
Survivors
Over half -- 219,915 (52%) -- are under the age of 60. Two-thirds -- 285,181 (67%) -- are under the age of 65.
But today, 10 years later, the situation looks quite different, even with a change of scale on the y-axis. The total number of survivors is roughly 305,000, and three-quarters (some 227,000) are over the age 60. In fact 54% (165,000) are now over the age of 65.

15
304,890 Estimated Survivors in 2006 from the 521,518 Survivors of the Acute Phase Reported by the USPHS, 1915-2000
0 0 70 1162,551
21,350
53,158
62,460
87,283
44,319
20,011
9,041
3,3011,141 77 10
0
10,000
20,000
30,000
40,000
50,000
60,000
70,000
80,000
90,000
0-29 30-34 35-39 40-44 45-49 50-54 55-59 60-64 65-69 70-74 75-79 80-84 85-89 90-95 96-100 100+
Age Ranges
Num
ber o
f Sur
vivo
rs
Survivors
For 2016, with the chart drawn to the same scale as the one for 2006, the total number of survivors is reduced to 176,000, with 65% (115,000) being over the age 70, and 88% (156,000) over the age of 65.
176,077 Estimated Survivors in 2016 from the 521,518 Survivors of the Acute Phase Reported by the USPHS, 1915-2000
0 0 0 0 66 1062,260
17,901
41,017 42,414
48,511
17,802
4,869996 107 27
0
10,000
20,000
30,000
40,000
50,000
60,000
70,000
80,000
90,000
0-29 30-34 35-39 40-44 45-49 50-54 55-59 60-64 65-69 70-74 75-79 80-84 85-89 90-95 96-100 100+
Age Ranges
Num
ber o
f Sur
vivo
rs
Survivors

16
In 2021, 15 years from now, the total population is reduced to 92,000, with 83% (76,000) above the age of 70, and 98% above the age of 65.
91,677 Estimated Survivors in 2021 from the 521,518 Estimated Survivors of the Acute Phase Reported by the USPHS, 1915-2000
0 0 0 0 0 60 941,895
13,813
27,85323,574
19,486
4,332537 32 3
0
10,000
20,000
30,000
40,000
50,000
60,000
70,000
80,000
90,000
0-29 30-34 35-39 40-44 45-49 50-54 55-59 60-64 65-69 70-74 75-79 80-84 85-89 90-95 96-100 100+
Age Ranges
Num
ber o
f Sur
vivo
rs
Survivors
Finally, we look at 2026, twenty years into the future. The total population is 41,160, with 73% being over the age 75, and 96% being over the age of 70.

17
41,160 Estimated Survivors IN 2026 of the 521,518 Survivors of the Acute Phase Reported by the USPHS, 1915-2000
0 0 0 0 0 0 53 79 1,462
9,380
15,481
9,469
4,741477 17 1
0
10,000
20,000
30,000
40,000
50,000
60,000
70,000
80,000
90,000
0-29 30-34 35-39 40-44 45-49 50-54 55-59 60-64 65-69 70-74 75-79 80-84 85-89 90-95 96-100 100+
Age Ranges
Num
ber o
f Sur
vivo
rs
Survivors
These tidy charts obscure several problems with the USPHS data, however. No attempt
has been made here, or in the data themselves, to correct for underreporting, especially during the years before 1933 when the USPHS reporting system was not yet fully functional. Nor is it possible to do anything about the fact that the system counts only indigenous cases actually diagnosed and reported to the public health system by a physician. Further, nothing has been done to correct for over reporting due to misdiagnosis, or for the many difficulties involved in applying the Massachusetts age-of-onset data. All of these matters are discussed above under "Sources and Methods," and in Appendix III in the "Notes on the Numbers." It is therefore wise to compare the USPHS numbers with those that can be inferred from the representative (though small) sample of self-identified polio survivors in the National Health Interview Survey of 1994-95. That sample was drawn from two years of the NHIS, and thus from a total health information survey population of 200,000 US households. A sample of 566 self-identified polio survivors was selected from that general survey population, and given a lengthy, carefully constructed questionnaire which asked for birth year, polio year, extent of muscle weakness in the initial phase, extent of initial rehabilitation, extent of continuing physical limitation from polio, presence or absence of post-polio syndrome, living arrangements, family income, and many other things. This report follows the analysis done by the epidemiologist Nancy A. Myers in reducing the polio sample to 535, by excluding those people in the sample who could not identify the year in which they had polio, or their age when they had it.11 Myers estimates, on that basis, that in 1994-95 there were roughly 920,000 polio survivors living in households in the United States. The survey did not reach people who were institutionalized -- in nursing homes, assisted living 11 Explained in private correspondence. But see Nancy A. Myers, "Who Is Likely to Report a Diagnosis of Post-Polio Syndrome?" Post-Polio Health, 22:2 (Spring, 2006), p. 4, and "Post-Polio Syndrome: New Problems from an Epidemic of the Past," Long-Term Care Clinical Interface, June, 2006, pages 30-34.

18
facilities, hospitals, or prisons. The chart below compares, for the year 1996, the NHIS numbers (in blue) to the USPHS estimates.
Comparison of Age Distribution between the 920,000 Estimated from the NHIS in 1994-95, and the 424,310 Estimated Survivors in 1996 from the 521,500 USPHS Reported Survivors of the
Acute Phase
0
20,000
40,000
60,000
80,000
100,000
120,000
140,000
160,000
0-29 30-34 35-39 40-44 45-49 50-54 55-59 60-64 65-69 70-74 75-79 80-84 85-89 90-95 96-100 100+Age Ranges
Num
ber o
f Sur
vivo
rs
NHISUSPHS
Notice that the NHIS survivor-numbers peak five years earlier than those from the
USPHS -- between 50-54 rather than 55-59. Further, the NHIS numbers show a steeper incline toward the peak, and an uneven decline from it, spiking for the age groups 70-74 and 80-84 while the USPHS numbers descend smoothly through those periods.
Moreover, the NHIS shows no survivors at all beyond the age of 84. There were in fact 7 people in the original sample of 566 who were 85 or older, but all of these were among the 31 excluded because they could not answer questions about the year in which they had polio, or their age when they had it.
The explanation for these differences between the USPHS and the NHIS numbers is not entirely clear. It is likely that the five-year difference in the peak numbers comes from the particular method used here to obtain year-of-birth data for the USPHS cases. For example, it may be that Massachusetts is not as representative as epidemiologists once thought. Or it may be that the imputed values used here to fill in the seven years missing from the Massachusetts data between 1915 and 1952, and to extrapolate the trend-line through the rest of the century produced some or all of the difference. Or both.
As for the explanation for the absence of any NHIS survivors beyond the age of 84, it may be that polio survivors older than that tend to be institutionalized, or (like the 7 who were excluded from the sample) uncertain about their early medical history. Or it may indicate that the mortality rate for polio survivors differs significantly from the rate for the general population beyond the age of 84. Or both. Note that in the charts to follow, a small population over the age of 84 shows up in the NHIS estimates from 2006 onward, because the assumption is that mortality for polio survivors will track that of the general population.

19
The more interesting comparison is between the USPHS estimates for those years and the estimates drawn from a special subset of 55% of the NHIS sample. This subset is of a special interest to us for planning purposes. The self-reports in this subset are especially credible, given the cross-checking opportunities that are built into the survey instrument, whereas it is plausible to conclude (on the basis of the answers to many questions) that the remainder of the sample either never had paralytic polio at all, or had it to such a minor extent that they are unlikely to ever need or want our services. After all, 42.5% of the entire sample reported nothing that would confirm their having had a diagnosis of paralytic polio, and 53% reported never having had limitations at all from polio.
The question, then, is what to do with the respondents who are certain that they had polio, but who also insist that they had no initial diagnosis of it (or at least of paralytic polio), and no discernible lasting effects from it. Given the clinical experience with post-polio syndrome over the last two decades, it is plausible to think that some of these respondents actually did have polio, since such people are occasionally given a diagnosis of PPS late in life. So the number in the sample that is of most interest to us is likely to be greater than the 42.5% who reported nothing that would count as having had a diagnosis of polio, and even somewhat greater the 47% who claimed to have had some limitation from polio. But how much greater than 47% is that number?
For reasons given at length in Appendix III: "Notes on the Numbers," 55% seems the most reasonable figure. It captures all of the respondents who meet at least one of the following conditions:
an initial experience of paralytic polio, or
some continuing limitation from polio, or
a diagnosis of PPS, or
a belief that they have PPS, or
rehabilitation for at least one month immediately after the acute phase, either at home
or in a hospital, or
a report of weakness in at least 2 identified muscle groups during the initial phase. The 55% figure excludes only those who reported having no initial weakness during the initial phase, or weakness in only one muscle group, but who met none of the other very inclusive conditions above. Here are the comparisons generated by using the 55% figure for the NHIS. Estimates drawn from the 1994-95 general population estimate of 920,000 are in blue, and 55% of each such estimate is in red. The series begins in 2006.
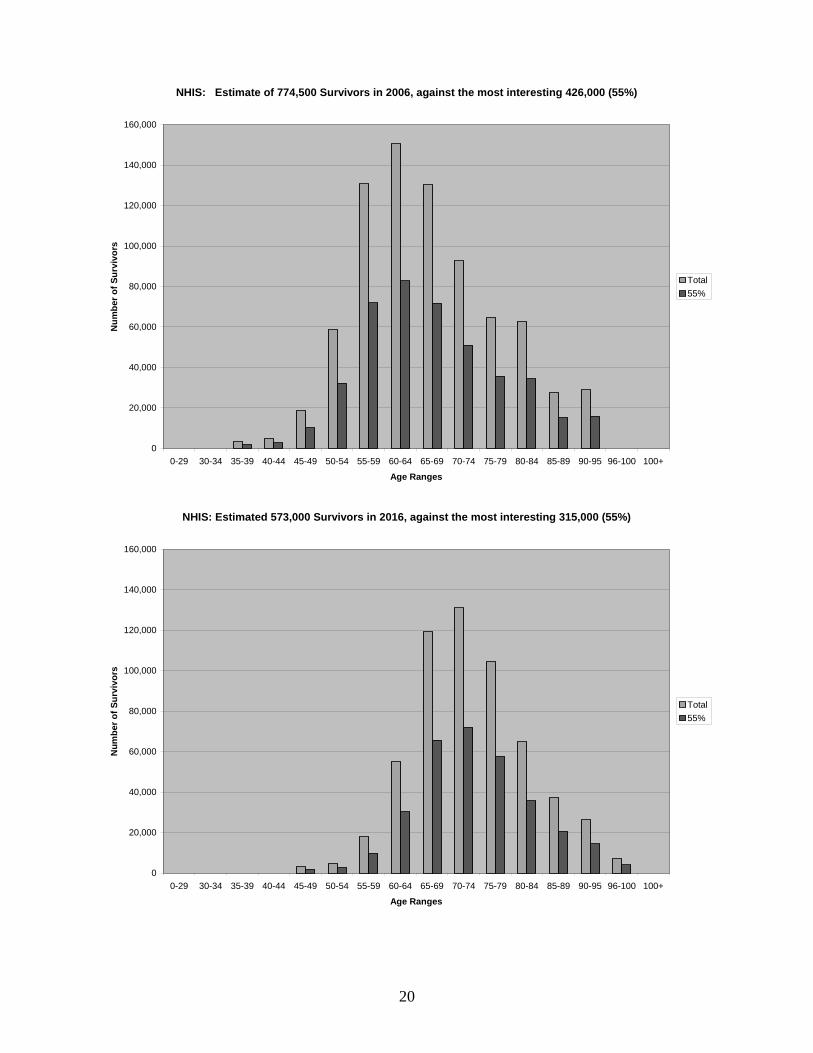
20
NHIS: Estimate of 774,500 Survivors in 2006, against the most interesting 426,000 (55%)
0
20,000
40,000
60,000
80,000
100,000
120,000
140,000
160,000
0-29 30-34 35-39 40-44 45-49 50-54 55-59 60-64 65-69 70-74 75-79 80-84 85-89 90-95 96-100 100+
Age Ranges
Num
ber o
f Sur
vivo
rs
Total55%
NHIS: Estimated 573,000 Survivors in 2016, against the most interesting 315,000 (55%)
0
20,000
40,000
60,000
80,000
100,000
120,000
140,000
160,000
0-29 30-34 35-39 40-44 45-49 50-54 55-59 60-64 65-69 70-74 75-79 80-84 85-89 90-95 96-100 100+
Age Ranges
Num
ber o
f Sur
vivo
rs
Total55%

21
NHIS: Estimated 418,000 Polios in 2021, against the most interesting 230,000 (55%)
0
20,000
40,000
60,000
80,000
100,000
120,000
140,000
160,000
0-29 30-34 35-39 40-44 45-49 50-54 55-59 60-64 65-69 70-74 75-79 80-84 85-89 90-95 96-100 100+
Age Ranges
Num
ber o
f Sur
vivo
rs
Total55%
NHIS: Estimated 286,500 Polios in 2026, against the most interesting 157,500 (55%)
0
20,000
40,000
60,000
80,000
100,000
120,000
140,000
160,000
0-29 30-34 35-39 40-44 45-49 50-54 55-59 60-64 65-69 70-74 75-79 80-84 85-89 90-95 96-100 100+
Age Ranges
Num
ber o
f Sur
vivo
rs
Total55%
And finally, here is how that most interesting 55% from the NHIS (continued in red) compares to the numbers estimated from the USPHS data (in yellow).

22
2006: 55% of NHIS against USPHS
0 01,877 2,803
10,218
32,254
71,912
82,855
71,727
51,012
35,679 34,492
15,279 15,914
0 00 0 70 1162,551
21,350
53,158
62,460
87,283
44,319
20,011
9,041
3,3011,141 77 10
0
10,000
20,000
30,000
40,000
50,000
60,000
70,000
80,000
90,000
0-29 30-34 35-39 40-44 45-49 50-54 55-59 60-64 65-69 70-74 75-79 80-84 85-89 90-95 96-100
100+
Age Ranges
Num
ber o
f Sur
vivo
rs
55% NHISUSPHS
2016: 55% of NHIS against USPHS
0 0 0 01,843 2,731
9,834
30,382
65,706
72,078
57,571
35,775
20,585
14,509
4,0220
0
10,000
20,000
30,000
40,000
50,000
60,000
70,000
80,000
90,000
0-29 30-34 35-39 40-44 45-49 50-54 55-59 60-64 65-69 70-74 75-79 80-84 85-89 90-95 96-100
100+
Age Ranges
Num
ber o
f Sur
vivo
rs
55% NHISUSPHS

23
2021: 55% of NHIS against USPHS
0 0 0 0 01,796 2,629
9,264
27,761
57,160 57,853
40,375
20,641
8,659
3,8190
0
10,000
20,000
30,000
40,000
50,000
60,000
70,000
80,000
90,000
0-29 30-34 35-39 40-44 45-49 50-54 55-59 60-64 65-69 70-74 75-79 80-84 85-89 90-95 96-100
100+
Age Ranges
Num
ber o
f Sur
vivo
rs
55% NHISUSPHS
2026: 55% of NHIS against USPHS
0 0 0 0 0 0 1,728 2,476
8,464
24,150
45,879
40,573
23,295
8,683
2,2790
0
10,000
20,000
30,000
40,000
50,000
60,000
70,000
80,000
90,000
0-29 30-34 35-39 40-44 45-49 50-54 55-59 60-64 65-69 70-74 75-79 80-84 85-89 90-95 96-100
100+
Age Ranges
Num
ber o
f Sur
vivo
rs
55% NHISUSPHS

24
THIS PAGE INTENTIONALLY BLANK

25
THIS PAGE INTENTIONALLY BLANK

26
Appendix I: Additional Demographic Charts This section contains additional demographic details from the NHIS 1994-95. The charts give percentages for the raw data that would be reflected in the general population estimates for 1996. The first concerns family income levels, the second and third focus on the male-female ratio, the fourth concerns living arrangements, the fifth is about the education levels of polio survivors, and the sixth reports the sketchy information available about the racial and ethnic composition of the sample. Some of these percentages (for example education level) would presumably remain roughly accurate through 2006 and future years. Others are likely to change. Here, for example, are the percentages for family income levels. It is probably reasonable to expect some decline in the percentages for the upper income brackets over time.
NHIS: Percentage of Polio Survivors at Various Family Income Levels, 1994-95
$30,000-$40,000, 16%
$20,000-$3000, 17%
$40,000-$50,000, 12%
$50,000+, 27% <$20,000, 28%
<20000 20-30,000 30-40,000 40-50,000 50,000+
It is more difficult to predict what has happened since 1996 with respect to the ratio of
male to female polio survivors -- and what will continue to happen to that ratio over the next 20 years. On average, at least since the midpoint of the 20th century, women in the US have lived longer than men, and that seems to be reflected in the graphs to follow. But the life expectancy gap between the sexes is narrowing. Moreover, the year-by-year ratio of male to female polio survivors is uneven, with males sometimes significantly outnumbering females. It is not easy to predict what will happen to the ratio as a greater and greater percentage of the population of polio survivors is beyond age 75.

27
NHIS: Percentage of Male, Female Polio Survivors
Male43%
Female57%
MaleFemale
NHIS: Percentage of Men to Women in Each Age Range
0.00%
2.00%
4.00%
6.00%
8.00%
10.00%
12.00%
0-29 30-34 35-39 40-44 45-49 50-54 55-59 60-64 65-69 70-74 75-79 80-84
Age Ranges
Perc
enta
ges
Series1Series2

28
NHIS: Living Arrangements of 566 Polio Survivors, 1994-95
living with spouse, 64%
w/other rel., 14%living alone, 20%
w/non-rel., 2%
living alone living w non-rel. living w/ spouse living w/ other rel.
Education Level
< HS, 17.02%
HS only, 35.99%1-3 yrs college, 22.52%
4yr coll degree, 10.64%
1+ yr grad study, 13.48%unknown, 0.35%
< HSHS only1-3 yrs college4yr coll degree1+ yr grad studyunknown

29
Race and Ethnic Data in Three Categories(6.54% also identified themselves as Hispanic)
white, 92.93%
black, 4.59%
other, 2.47%
whiteblackother

30
Appendix II: Data Files
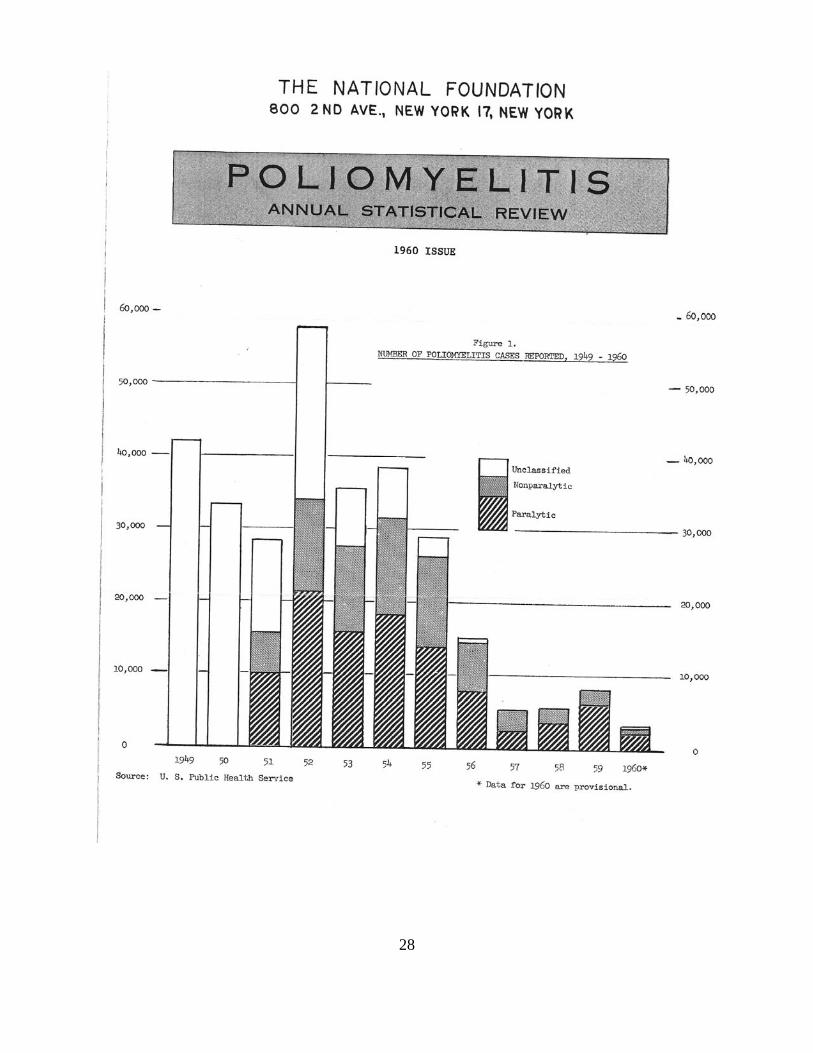
Incidence data. The first document here (page 31) gives the year by year total of cases of poliomyelitis reported to the United States Public Health Service from 1915-2000, as well as the deaths reported during the acute phase each year.
Paralytic vs. nonparalytic polio. The second document (page 32) is an image of a report issued by the March of Dimes in 1960. Until 1951, the USPHS had reported only documented instances of polio, and mortality from its acute phase. In 1951, states were asked to begin reporting a distinction between paralytic and nonparalytic polio. As you will see from the March of Dimes chart, for the first few years of such reporting, a substantial number of cases remained unclassified. The USPHS appears to have made the assumption that all such cases were nonparalytic. The March of Dimes was evidently not so certain, and continued to report unclassified cases separately until 1960. By that time -- in fact, after 1956 -- no reported cases remained unclassified. But of course by that time the polio vaccines had greatly reduced the annual number of reported cases. The data on the distinction between paralytic and nonparalytic cases is crucial for understanding the impact of the vaccines in the years from 1957 onward. And there was a dramatic change. By 1981, all reported cases were paralytic ones, probably due to infection from the "live virus" oral polio vaccine, or to contact with someone infected by it.
But it is doubtful whether one can reliably use the data from 1951-1956 to estimate the ratio of paralytic to nonparalytic cases during the epidemic years before 1951. The large number of unclassified cases between 1951 in 1956 is one problem. The other is the fairly dramatic variance in the ratio in those years, no matter how one handles the unclassified cases. One can of course take the average of five or six of those years and impute it to the earlier years, but it is hard to have confidence in that procedure. For one thing, the sample is small, and confounded by what looks like widespread confusion or noncompliance from the reporting agencies (at least in 1951-54) about making the distinction. 2003 United States Life Table. The third document (pages 33-34) gives details from the life table used in making the estimates of polio survivors for 1996, 2006, 2016, 2021, and 2026.

31
USPHS Incidence Data, 1915-2000
Year Reported Deaths in Year Reported Deaths in Cases Acute Phase Cases Acute Phase
1915 1,639 661 1916 27,363 7,179 1917 4,174 1,451 1918 2,543 1,079 1919 1,967 813 1920 2,338 855 1921 6,301 1,052 1922 2,255 847 1923 3,489 1,013 1924 5,262 1,145 1925 6,104 1,362 1926 2,750 911 1927 10,533 2,176 1928 5,169 1,436 1929 2,882 854 1930 9,220 1,427 1931 15,872 2,139 1932 3,820 882 1933 5,043 797 1934 7,510 852 1935 10,839 1,040 1936 4,523 780 1937 9,514 1,461 1938 1,705 487 1939 7,343 773 1940 9,804 1,026 1941 9,086 807 1942 4,167 561 1943 12,450 1,151 1944 19,029 1,361 1945 13,624 1,105 1946 25,698 1,845 1947 10,827 580 1948 9,726 1,895 1949 42,033 2,720 1950 33,300 1,904 1951 28,386 1,551 1952 57,879 3,145 1953 35,592 1,450 1954 38,476 1,368 1955 28,985 1,043 1956 15,140 566 1957 5,485 221 1958 5,787 225 1959 8,425 454 1960 3,190 230 1961 1,312 40 1962 910 60 1963 449 41
1964 122 171965 72 161966 113 91967 41 161968 53 241969 20 131970 33 71971 21 181972 31 21973 8 101974 7 31975 13 91976 10 161977 10 161978 8 131979 22 41980 9 61981 10 01982 12 01983 13 01984 9 01985 8 31986 10 01987 9 01988 9 11989 11 01990 6 01991 10 11992 6 01993 4 01994 8 01995 6 01996 5 01997 3 01998 1 01999 0 02000 0 0
28

33
2003 United States Life Table % surviv- deaths life Age ing to end per exp. range of range 100,000 at age 0-1 0.006865 100,000 687 77.51-2 0.000465 99,313 46 77.02-3 0.000331 99,267 33 76.13-4 0.000259 99,234 26 75.14-5 0.000198 99,209 20 74.15-6 0.000168 99,189 17 73.16-7 0.000151 99,172 15 72.17-8 0.000142 99,158 14 71.18-9 0.000139 99,143 14 70.29-10 0.000134 99,130 13 69.210-11 0.000165 99,116 16 68.211-12 0.000147 99,100 15 67.212-13 0.000176 99,085 17 66.213-14 0.000211 99,068 21 65.214-15 0.000257 99,047 25 64.215-16 0.000339 99,022 34 63.216-17 0.000534 98,988 53 62.317-18 0.000660 98,935 65 61.318-19 0.000863 98,870 85 60.319-20 0.000925 98,784 91 59.420-21 0.000956 98,693 94 58.421-22 0.000965 98,599 95 57.522-23 0.000987 98,504 97 56.523-24 0.000953 98,406 94 55.624-25 0.000955 98,313 94 54.725-26 0.000920 98,219 90 53.726-27 0.000962 98,128 94 52.827-28 0.000949 98,034 93 51.828-29 0.000932 97,941 91 50.929-30 0.000998 97,850 98 49.930-31 0.001014 97,752 99 48.931-32 0.001046 97,653 102 48.032-33 0.001110 97,551 108 47.033-34 0.001156 97,443 113 46.134-35 0.001227 97,330 119 45.235-36 0.001357 97,210 132 44.236-37 0.001460 97,079 142 43.337-38 0.001575 96,937 153 42.338-39 0.001672 96,784 162 41.4
39-40 0.001847 96,622 178 40.540-41 0.002026 96,444 195 39.541-42 0.002215 96,249 213 38.642-43 0.002412 96,035 232 37.743-44 0.002550 95,804 244 36.844-45 0.002847 95,559 272 35.945-46 0.003011 95,287 287 35.046-47 0.003371 95,000 320 34.147-48 0.003591 94,680 340 33.248-49 0.003839 94,340 362 32.349-50 0.004178 93,978 393 31.450-51 0.004494 93,585 421 30.651-52 0.004804 93,165 448 29.752-53 0.005200 92,717 482 28.853-54 0.005365 92,235 495 28.054-55 0.006056 91,740 556 27.155-56 0.006333 91,185 577 26.356-57 0.007234 90,607 655 25.557-58 0.007101 89,952 639 24.758-59 0.008339 89,313 745 23.859-60 0.009126 88,568 808 23.060-61 0.010214 87,760 896 22.261-62 0.010495 86,864 912 21.562-63 0.011966 85,952 1029 20.763-64 0.012704 84,923 1079 19.964-65 0.014032 83,845 1177 19.265-66 0.015005 82,668 1240 18.466-67 0.016240 81,428 1322 17.767-68 0.017837 80,105 1429 17.068-69 0.019265 78,676 1516 16.369-70 0.021071 77,161 1626 15.670-71 0.023226 75,535 1754 14.971-72 0.024702 73,780 1823 14.372-73 0.027419 71,958 1973 13.673-74 0.029698 69,985 2078 13.074-75 0.032349 67,906 2197 12.475-76 0.035767 65,710 2350 11.876-77 0.039145 63,360 2480 11.277-78 0.042748 60,879 2602 10.6

34
78-79 0.046289 58,277 2698 10.179-80 0.051067 55,579 2838 9.580-81 0.056846 52,741 2998 9.081-82 0.061856 49,743 3077 8.582-83 0.067173 46,666 3135 8.183-84 0.077268 43,531 3364 7.684-85 0.079159 40,168 3180 7.285-86 0.086601 36,988 3203 6.886-87 0.094663 33,785 3198 6.487-88 0.103381 30,587 3162 6.088-89 0.112791 27,425 3093 5.689-90 0.122926 24,331 2991 5.3
90-91 0.133819 21,340 2856 5.091-92 0.145499 18,485 2689 4.692-93 0.157990 15,795 2495 4.493-94 0.171312 13,300 2278 4.194-95 0.185481 11,021 2044 3.895-96 0.200502 8,977 1800 3.696-97 0.216376 7,177 1553 3.397-98 0.233093 5,624 1311 3.198-99 0.250634 4,313 1081 2.999-100
0.268969 3,232 869 2.7
100+ 1.00000 2,363 2363 2.6

35
Appendix III: Notes on the Numbers
These notes are a combination of reminders, musings, and cautionary remarks that I made for my own benefit while I was in the process of constructing the estimates in this report. There is thus a good deal of repetition here, but also some detail and perhaps a level of candor missing elsewhere. My apologies for the repetition. LCB Notes on NHIS against USPHS
1) "NHIS against USPHS” shows two things that are in need of explanation. a. One is that in the comparison chart for 1996, the NHIS data appear to show NO
polio survivors older than 84, while the USPHS data appear to show quite a few, even some up to 100 years of age. The explanation may be something like this:
i. For the USPHS reported cases: The chart treats the mortality rate of polio survivors as identical to the rate in the general population, and does not distinguish between people who are intellectually competent and living in households and people who are either institutionalized or whose competence is compromised. Moreover, I did not make mortality calculations to the USPHS case report data on a continuing, contemporaneous basis throughout the century, even though life expectancy was considerably lower early in the century than it was toward the end. Rather, I summed up the cases through 1997 (when the last one was reported) and calculated estimated mortality for the whole group at that point. This may have resulted in artificially inflating the numbers of elderly survivors. Further, age-of-onset from Massachusetts data (1912-1960) was used to set birthdates, and that introduced some arbitrariness.
ii. The NHIS, by contrast, surveyed only households, and thus excluded all people who were institutionalized. Further, although there were 7 people of age 85 or greater in the original sample of 566, all 7 were in the group of 31 who were excluded from the data analysis used here, because they could not answer any detailed questions about the onset of their polio, including the year of the infection or their age when they got polio. This may have artificially reduced the number of elderly survivors shown on the chart.
iii. Even so, however, on the assumption that the NHIS sample was genuinely representative of the general population in the US, it looks as though
1. either the mortality rate for polio survivors significantly exceeds that of the general population,
2. or those polios surviving beyond 85 years are either incompetent or institutionalized,
3. or some of both. b. The other thing needing explanation is the way the age distribution in the USPHS
is essentially shifted 5 years to the right, and progresses smoothly to a peak between the ages of 65-69 in 2006, and then just as smoothly downward, while the NHIS data peak between 60-64 in 2006, and then take a rather bumpy course downward. I believe both things can be explained by the various assumptions needed to construct the tables for reported cases, and may show the superiority of using the NHIS data.

36
i. Gaps in the Massachusetts data for several years during the period 1912-1960, and the absence of such data after 1960 meant that in the USPHS data I had to interpolate for the gaps and extrapolate for the missing numbers after 1960. I did this with a smooth, straight line function in both cases. This means that the USPHS charts might have missed some unusual transient bumps in the numbers that should have been reported.
ii. Further, for ease of calculation, I used point estimates for age-of-onset to represent the age ranges reported in the Massachusetts data. Thus for age of onset 0-4 I used age 2; for age range 5-9 I used age 7; and for age range 10+ I used age 15. These choices, when checked against the NHIS age data, looked quite defensible, but they may well have introduced a slight upward shift in the USPHS charts.
iii. Finally, and perhaps most importantly, my decision not to apply the mortality tables to the reported cases at all until 1997 may well have introduced an artificially high survival rate.
Notes on the USPHS reported cases
1) The Problem of Underreporting. There are several significant sources of underreporting in the polio data provided by the United States Public Health Service.
a. Incomplete records. As late as 1929, the USPHS was able to use information from only 20 of the 48 states in its decennial report, and the registry was not fully implemented for all 48 states until 1933.
b. Undiagnosed nonparalytic cases. Nonparalytic polio presents transient symptoms very much like a mild case of flu. People generally don't go to the doctor for such things, and even if they do, they get little more than general "wait and see" advice. During the big epidemic years, if these symptoms resolved themselves without leaving lingering muscle weakness, people might or might not have been told by physicians, or have come to believe on their own, that they had had polio. Further, it is quite probable that many cases in which there was lingering muscle weakness for a few weeks were not given an official diagnosis of polio -- either because the people were not seen by a physician, or because the physician did not see the symptoms as evidence of polio.
c. Unreported paralytic cases. It is probable that the data on reported cases systematically underreports at least mild or limited paralytic cases for people with limited access to medical care -- especially until the late 1930s when the publicity about polio was enormous nationwide, and the March of Dimes was paying for treatment. Even after that time, there was probably some underreporting for people with modest financial resources generally, as well as for people from sparsely populated regions of the country, or from isolated or segregated racial, ethnic, religious groups.
2) The Problem of Over-Reporting. Clinically, paralytic polio is sometimes difficult to distinguish from other conditions that can cause paralysis. It is known that some cases were misclassified initially, and it is probable that in other cases the misclassification was never corrected. Further, from the late 1930s to 1960 or so, when financial support for medical treatment was available from the March of Dimes and various other charitable organizations such as the Sister Kenny Foundation, the

37
Easter Seal Foundation and others, there was a financial incentive for not "officially" correcting such misclassifications.
3) The Problem of Getting Age-of-Onset Data. In order to calculate the age distribution of polio survivors, it is necessary to get good data on how old people were when they were initially infected with polio. These data were apparently not reported to the USPHS, so epidemiologists had to rely on data kept by some municipalities (notably New York City) and some states (notably Massachusetts), crosschecking it for representativeness.
4) The Problem of Distinguishing Paralytic from Nonparalytic Cases. In order to estimate the number of polio survivors who are most vulnerable to developing PPS, it is important to distinguish cases in terms of severity, since it is well-known that people with the most severe paralysis are most at risk for the most severe consequences of PPS.
a. The information needed to make these distinctions is not available in the data on reported cases.
i. The extent and duration of paralysis for those with paralytic cases is not reported in the official summaries.
1. One could probably get some estimates by a massive amount of digging through the raw data at the state level, and perhaps in the March of Dimes archives (especially about the number of cases requiring lengthy rehabilitation in hospitals, and/or the number of cases requiring lengthy respiratory assistance).
2. But that data is likely to be spotty and based on a variety of reporting standards.
ii. Until 1951, the USPHS did not even require states to distinguish between paralytic and nonparalytic cases, and the data from 1951-1997 cannot reliably be used to estimate the overall numbers for survivors from earlier years.
1. For the years following the massive administration of the vaccines, the distribution of cases is so skewed toward paralytic ones that it is not representative of earlier years.
2. The epidemics effectively ended in 1959. So we presumably have data from 1951-59. But this is not without problems, because from 1951 to 1955 a fairly significant percentage of reported cases was actually not classified as either paralytic or nonparalytic. The USPHS, when doing its summaries, simply put all of those cases into the nonparalytic category. The March of Dimes reported all three categories.
3. Finally, it is not clear what precise criteria (e.g., in terms of extent and duration of muscle weakness) states were asked to use in making that distinction, but the fact that these numbers are reported weekly, then aggregated by month and published in an annual summary shortly after the end of each year gives an indication of its limitations.
5) The Problem of Determining the Life Expectancy of Polio Survivors. The USPHS reported deaths from acute poliomyelitis, but apparently did not collect reports (if they regularly existed) about polio as an underlying cause of death. Moreover, there do not appear to be any epidemiological or actuarial studies precisely upon the point of life expectancy for polio survivors.

38
6) Assumptions Used in the Estimates Drawn Here from Reported Cases. a. Life Expectancy. In the absence of evidence to the contrary, it is reasonable to
assume that the mortality rate for polio survivors tracks the one for the general population.
i. It is, of course, reasonable to think that people who are most severely affected by polio -- especially those with severely compromised respiratory systems -- would have a life expectancy below the average for the general population.
ii. But the same is true for many other special risk categories in the general population, which we do not analyze separately unless we have good data for them.
iii. We do not have the sort of data on polio survivors generally, or even on the most severely compromised polios, that allows us to treat polio as a special actuarial risk.
iv. Thus, by default, we use the mortality rate for the general population. b. Age Distribution Data. I have used the Massachusetts data, which is fairly
complete from 1912-1960 as representative, and have interpolated values for some missing years during that run, and extrapolated a reasonable trend from 1960 on. This seems a justifiable way to deal with the reported cases because
i. the Massachusetts data have been treated as representative via reputable epidemiologists working on these numbers prior to the NHIS survey (see Sabin; Nathanson), and they did apparently make a determined effort to crosscheck these data against those from other states,
ii. and the Massachusetts data with the imputed values I provided for the missing years turns out, overall, to match fairly closely the age distribution data from the NHIS, and it is hard to believe the match is purely coincidental.
c. Underreporting, Over-Reporting, and the Distinction between Paralytic and Nonparalytic Cases. I have not made any assumptions about these things, and so reported only the raw numbers and estimates drawn from them.
NHIS Data: Things to notice about the raw numbers
1) The Representativeness of the National Health Interview Survey. The NHIS is a survey conducted annually by the National Center for Health Statistics using face-to-face interviews conducted in US households. It is conducted in two stages.
a. The first involves a general questionnaire on health status and is administered to a representative sample of about 100,000 people.
i. That sample, because it is drawn from “households,” does not include people who are institutionalized -- e.g. in prisons, hospitals, nursing homes, or assisted living facilities.
ii. The sample does, however, include legal immigrants and resident noncitizens as well as US citizens,
b. The second, or "follow-back" questionnaire goes to a representative sub-sample of about 20,000 people drawn from the original sample, and concerns topics of special interest for the year.
2) The 1994-95 Polio Survey. In 1987, the NHIS attempted to get data on polio survivors in its first? second? phase, but the data were reportedly problematic. (I could not find

39
evidence of the study on the NHIS website.) As a result of this misfire and continuing interest in the subject, polio was a special topic spanning two years of the NHIS in 1994-95. Thus the ultimate sample size in Phase I was about 200,000 people, and the follow-back survey -- which asked about all sorts of disabilities -- went to about 40,000 people over the two-year period. 566 of those 40,000 people with disabilities identified themselves as having had polio. Epidemiologists -- both those at the National Center for Health Statistics and those in academia -- seem satisfied that this sample is robust enough, and representative enough, to support general population estimates of various sorts. Nonetheless, it seems small to this amateur.
3) Cautions about Self-Reported Health Data. The NHIS polio questionnaire was quite lengthy, and the questions were carefully constructed to provide ways of cross-checking answers to various crucial questions. Some of these will be discussed below. But it should be remembered that these surveys ultimately generate self-reported data unconfirmed by medical diagnoses, medical records, or medical examination.
4) Using a Base Number of 535 rather than 566. Although there were 566 self-identified polio survivors interviewed by the NHIS in the special 1994-95 survey, the epidemiologist Nancy A. Myers argues convincingly that people who clearly had only an unsupported belief that they were polio survivors, and who either did not or could not answer questions about when they had polio should be excluded from the base number used to calculate population estimates. The number she uses is 535, and I follow her example.
5) Age Distribution in This Base Number. At the date of the survey, in 1994-95, 317 of the 535 (59%) were between the ages of 45 and 65. 167 of the 535 (31%), were between the ages of 65 and 85.
a. The survey included no interviewees over 84. There were 7 people aged 85 or older in the sample of 566, but when that was reduced to eliminate people who could not or would not give their year in which they got polio, or the age at which they got it, those 7 people were among the 31 eliminated.
b. Recall that this survey did not include anyone who was "institutionalized." 6) Extrapolating to 2006. In 2006, if mortality has tracked the general population, the
original 45-65-year-olds are now between the ages of 55 and 75, and account for 294 of the 450 surviving interviewees (65%).
a. 74 of the 450 (16%) would be between the ages of 75 and 85. b. 33 (7%) would be 85 and over.
Things to notice about the estimated numbers for 2006, 2016, etc.
1) The Assumption That Mortality Tracks the General Population. In the general population estimates I will use for 2006 and beyond, I will assume that the life expectancy of polio survivors is the same as that for the general population, as calculated annually by the National Center for Health Statistics.
a. Those average and median life expectancies are calculated for the population as a whole, including people with disabilities of many sorts.
b. Those averages of course obscure many known differences in life expectancy among various subsets of the population -- e.g. men and women, people in various occupations, people who reside in different areas of the country, people at different socioeconomic levels, and so forth.
c. But those averages seem to be increasingly reflective of the entire population (many of the known differences have been reduced over the last few decades).

40
d. Further, there does not seem to be any national data specifically on the life expectancy of polio survivors.
i. Nor is there any special reason to suppose that the life expectancy of polio survivors does not track the averages in the general population.
ii. It is certainly plausible to think that people with severe cases of paralytic polio or PPS (especially those with compromised respiratory systems) might have lower than average life expectancies. But so do people with many other disabilities.
e. In short, it seems plausible to treat life expectancy for polio survivors as something that (in general) tracks mortality in the general population.
2) The Assumption That Polios Can Survive beyond the age of 84. I will follow the practice of the US Life Tables in leaving in all of the probable survivors up to the age of 100. The life tables are arbitrarily "closed" at that point by giving a probability of 1 to death at the age of 100+.
a. I will thus not exclude, for example, those polio survivors who were in their early '80s in the 1994-95 survey data, and who would now be in their early '90s.
i. It may be that the majority of such people are now either dead, institutionalized or unable to remember when or at what age they got polio, and would be excluded from a repeat of the NHIS survey, however.
3) The Estimate of 920,000 Polio Survivors in the US in 1994-95. The epidemiologist Nancy A. Myers derives, from her analysis of the NHIS data, an estimate of 920,000 self-reported polio survivors in the general population during 1994-95. This differs from the 1,000,000 given in some estimates because Myers excludes 31 problematic questionnaires from the original sample of 566.
4) The Estimate of 506,000 Paralytic Polio Survivors in the US in 1994-95. Until 1951, case reports to the US Public Health Service did not distinguish paralytic from non-paralytic polio. The NHIS in 1994-95 asked questions of its 566 polio respondents which allow us to infer whether they had been regarded medically as paralytic polios, but the answers to those questions do not quite square with the answers to subsequent questions about the extent of muscle weakness during the initial phase, the length of physical rehabilitation, and so forth. It is thus difficult to construct a separate estimate of paralytic cases with confidence from either the USPHS case reports or the NHIS data.
a. However, if it is important to force a distinction between paralytic and non-paralytic cases of polio, then we may plausibly begin with Myers’ advice (in a private communication) that we need to look carefully at the questions in the survey designed to elicit information about length of rehabilitation after the initial infection and the number of muscle groups weakened by the initial infection.
b. When we do that, my own view (for which Dr. Myers should not be blamed) is that we get an estimate of around 506,000 paralytic polios in a total population of 920,000 polios in 1994-95. My reasoning is as follows:
i. Only 42.5% (227 of 535) of the respondents appear to have had a diagnosis of paralytic polio. That yields a general population estimate of 391,500 paralytic polios in a total population of 920,000 polios.
ii. Myers, however, thinks it is highly probable that this understates things because some people (especially young children) were probably never given a formal diagnosis of "paralytic" polio -- something that would explain the higher estimates that can be derived from analyzing other parts of the questionnaire and comparing it with the USPHS case reports.

41
iii. Take the USPHS case reports first. They yield a figure of 45.1% of paralytic cases from 1951 through 1997, thus supporting Myers' suggestion that the rate should be somewhat higher than the 42.5% given by the single direct question about paralytic polio in the NHIS survey.
1. But the case reports are actually more complicated than that 45.1% suggests. As follows:
2. There were 232,742 cases reported during those years, 104,890 of which were listed as paralytic and 125,901 of which were listed as nonparalytic.
3. It is worth noting that in the big epidemic years immediately before the 1955 Salk vaccine had its massive effect (1951-1956), the percentage of paralytic cases climbed steadily from a low of 33% in 1951 to 52% in 1956. Then after dipping inexplicably to 46% in 1957, the rate jumped the next year to 64%, then to 75% in 1959, and thereafter continued a remarkable increase over the next two decades as the number of cases dropped precipitously.
4. From 1981-1997, the rate of paralytic polio was 100%. The grand total of reported cases during those years was 126.
5. For some reason the March of Dimes, in its 1960 publication "Poliomyelitis: Annual Statistical Review" decided to report a further distinction found in the US Public Health Service data. Apparently a significant number of cases for the years 1951-1955 was not classified as either paralytic or nonparalytic by the agencies reporting to the USPHS.
a. The March of Dimes listed those cases separately as "unclassified," whereas the USPHS seemed confident in reporting them as nonparalytic.
b. Given that the reporting scheme was newly installed in 1951, and that 1952 was an overwhelmingly big national epidemic, and that by 1955 the rate of unclassified cases had dropped dramatically, the USPHS reporting scheme seems correct.
i. If we were to treat all of the unclassified cases from 1951-1955 as paralytic ones, after all, that would raise the percentage of paralytic cases for 1951-1997 to a whopping 69%, since those years in the early ‘50s were all big epidemic ones.
ii. That rate does not fit comfortably with historical and epidemiological reports from earlier in the century, and it does not have any obvious explanation, whereas the steep rise in paralytic cases after the introduction of the vaccines -- especially the OPV -- does have an obvious explanation.
iii. Finally, there isn't any obvious way of apportioning some fraction of the unclassified cases to the paralytic category and others to the nonparalytic.

42
c. For all of these reasons, it seems wise to stick with the USPHS’s assumption that all the unclassified cases were nonparalytic.
6. So the data on reported cases supports Myers’ conclusion that the rate of paralytic to nonparalytic cases over all the years from 1915 through 2000 should probably be somewhat higher than the 42.5% found in the NHIS.
a. A rate as low as 45% would not be surprising. b. A rate as high as 69%, however, would be surprising.
iv. When we look further into the survey data, however, as Myers suggests that we do, we find that 47% (251) of the respondents reported that they were still physically limited in their activities by polio in some way, long after the initial onset, though not necessarily in the form of a limitation on "major life activities."
1. Assuming that a perceived continuing physical limitation from polio is equivalent to having had a paralytic case of it, that 47% figure alone would give us a population estimate of 432,400 self-reported paralytic polios in 1994-95.
2. Additionally, we know from reports by polio clinic directors that some people who had initial muscle weakness appeared to recover completely, and showed no signs of paralysis for many years, only to show up later with post-polio syndrome. So that is a reason for thinking that something even more than 47% might be a good estimate.
v. Further, it is notable that 55% of the respondents report having been in rehabilitation (either in the hospital or at home) one month after the acute phase.
1. Conceptually, that is an indication of some initial "paralysis" in the form of significant, lingering muscle weakness, and 55% yields a population estimate of 506,000 paralytic polios in that sense.
c. The following line of reasoning provides some support for the choice of 55% as a reasonable estimate of the percentage of paralytic cases. It begins by rejecting the case for a much higher estimate, as follows:
i. When the respondents were asked to assess the extent of muscle weakness during the initial infection, only 24.2 percent (129) reported having had no muscle weakness at all. 75.8% reported having initial muscle weakness in at least one muscle group, which they specified.
1. That is, of course, conceptually consistent with the notion of a mild paralytic case, even if the symptoms all "disappeared" within one month of the acute phase.
2. It would give us a population estimate of 697,360 paralytic polios in 1994-95, out of the total population of 920,000.
3. The trouble is that this 75.8% would be substantially higher than even the 69% we would get for the years 1951-1997 by assuming that all the unclassified cases from 1951-1997 were actually paralytic ones, misclassified by the USPHS as non paralytic cases. And it would force us to assume that the rate of paralytic cases from 1915-1950 was high enough to make up the difference.

43
4. There is no evidence in the NHIS data that initial paralysis of a sort that is of continuing medical concern might even remotely reach that level.
a. Only 11% of the respondents reported a medical diagnosis of PPS.
b. Only 25% (including the 11%) reported believing that they had PPS.
c. Only 47% reported any sort of continuing physical limitation from polio, from periods ranging from 20 to 60 years following their initial rehabilitation.
d. These percentages were virtually constant across groups of respondents up to 60 years after onset, and those living beyond 60 years after onset showed significantly fewer diagnoses of PPS than other age groups.
5. Further, to go much beyond 47% as an estimate of paralytic cases, we have to have a convincing explanation for why fully 53% of the respondents reported having had no continuing limitation at all from their polio.
a. To go as high as 69 percent or 75 percent this explanation has to be very good indeed.
b. It may be that some people reporting initial or even continuing weakness in one or two isolated muscle groups might resist reporting a "limitation."
i. They might have recovered full function -- or something approximating it -- after the initial phase;
ii. they might have been able to work around such lingering weakness in a way that they can reasonably describe (at least to themselves) as not limiting.
c. But it is hard to believe that people who report more substantial amounts of muscle weakness could reasonably describe it as not (physically) limiting at all.
i. No doubt some people might construe the question as one about whether they felt limited by their self-reported physical limitation,
ii. but that construal of the question would have to be almost a standard reading of it (or plausible as a standard reading) to justify treating the question as so flawed as to be consistent with, say, a paralytic polio rate of 69% or 75%.
d. These prejudices about what 53% of the respondents might or might not have meant by claiming to have no limitation at all from their polio actually line up with material from the survey in the following way.
i. The 75.8% of the respondents reporting some initial muscle weakness broke down as follows: initial weakness in 1 Muscle group: 20.5%; in 2 Muscle groups: 22.4%; in 3-4 Muscle groups: 17.6%; in 5-9 Muscle groups: 15.3%.

44
ii. Suppose we remove the 20.5% reporting weakness in only one muscle group, on the grounds that such weakness might have been either rehabed away fairly quickly or worked around to the point where it could be ignored.
iii. We are then left with the respondents who reported initial weakness in 2-9 muscle groups. Those respondents constitute is 55.4% of the survey sample -- virtually identical to the 55% who reported that they were still in rehabilitation one month after the acute phase.
ii. All in all, using the figure 55% (506,000) for paralytic cases seems more sensible than using either the lowest or the highest possible estimates.
1. The lowest estimate (42.5%) reflects only those people reporting things consistent with an initial diagnosis of paralytic polio, and is lower than the 47% who report continuing limitation from polio, and much lower than the 55% who reported that they were still in rehabilitation one month after the acute phase.
2. The highest estimate would be pegged to the 78% who reported having had some initial muscle weakness in at least one muscle group, whether or not that required rehabilitation or caused a continuing physical limitation.
3. By contrast, the 55% figure is pegged to the combination of two important indicators: reports of substantial, initial muscle weakness in 2-9 muscle groups, and reports of being in rehabilitation for at least one month after the acute phase. This seems intuitively consistent with a distinction between weakness due to a physically challenging but non-paralytic infection and weakness due to paralysis.
4. This 55% figure includes the 42.5% who reported things consistent with an initial diagnosis of paralytic polio, and the 47% who report continued limitation from polio.
5. It recognizes that there may be a considerable additional number of people (up to 8%, or 55,200 in the population) who are either not aware of or don't care to report a subtle paralytic limitation – thus accounting for the emergence of PPS in some people who have lived without visible limitations for many years after their initial infection. (Note that the Myers data table shows that 3% of the respondents say they have a medical diagnosis of post-polio syndrome but cannot report that they had any muscle weakness during the initial phase.)
6. But it limits this upward correction to the existence of initial muscle weakness serious enough to have kept people in rehabilitation for over a month after the acute phase, whether they then appeared to be "fully recovered" or not.
a. This seems intuitively consistent with a distinction between weakness due to a physically challenging but non-paralytic infection and weakness due to paralysis.

45
5) Estimating the Percentage of Polio Survivors Who May Have PPS. This is controversial. Published estimates using competing methods range from 25% to 65% or even higher. The NHIS data support the lower figure. Something more exact awaits a reliable biomarker for PPS, or at least a reliable clinical diagnostic technique that does not depend on a diagnoses by exclusion. What follows is drawn from Nancy Myers’ analysis of the survey data.
a. Only 11.7% of the respondents (63; population estimate of 101,200) reported a physician's diagnosis of PPS, but 25% (134; 230,000) believed they had PPS.
b. The data also show, moreover, that the percentage of those having a physician's diagnosis of PPS in 1994-95 is nearly constant across the age distribution of polio survivors. (The percentages are these: 11.6% for those up to 41 years after onset; 11.3% for those between 41 and 50 years after onset; 12.1% for those 51 to 60 years after onset; and 9.5% for those 61+ years beyond onset.)
c. Thus, whatever estimates we make for the probability of increases in the number of people with post-polio syndrome, we are not justified in estimating an increase due to aging alone.
d. Rather, the increase will probably come from wider awareness of PPS in the general population of polio survivors and among their physicians. (A reliable biomarker or clinical diagnostic technique could in principle show a decrease.)
e. Moreover, the table from Nancy Myers (next page) shows that the crucial factors in producing the symptoms that drive people to be diagnosed with PPS come not from the increasing duration from onset, but rather from three other things:
i. age at onset, with the very youngest (0-2) and the oldest (19+) being most at risk
ii. extent of the initial infection as measured by the number of muscle groups involved, with a linear progression from none to 5-9 groups involved
iii. and whether or not people were hospitalized (or oddly, did not know whether they were hospitalized) for the initial infection.
f. Unlike age, all three of those crucial factors are stable over time, and in 2006, all survivors of the epidemic years through 1956 are at least 40 years beyond onset.
g. There has been significant publicity about PPS since 1994-95, both among polio survivors and physicians, and increasing recognition of it by insurance companies and Medicare.
h. It is therefore reasonable to estimate a significant increase in those diagnosed with PPS -- perhaps even up to the level of all 230,000 who believed that they had it in 1994-95.
i. But it is fairly clear that that increase, as well as future increases, will almost all come from the pool of people who qualify as paralytic polios.
6) All of this argues for using the estimate of paralytic polio survivors (55%; 506,000) as the one with which we should be most concerned.
7) When we recalculate the percentages using paralytic polios as the pool from which PPS cases are drawn, they are as follows in 1994-95: 11.7% (59,202) had a diagnosis of PPS in 1994-95; 25% (126, 500, including the 59,202) believed they had PPS. Let us assume that the full 25% are properly diagnosable with PPS. Then, after each successive correction for mortality in intervening years, let us continue to assume that 25% of the

46
surviving paralytic polios might be diagnosed -- or at least diagnosable -- with PPS, thus accounting for a continuing increase in awareness of the diagnostic criteria.
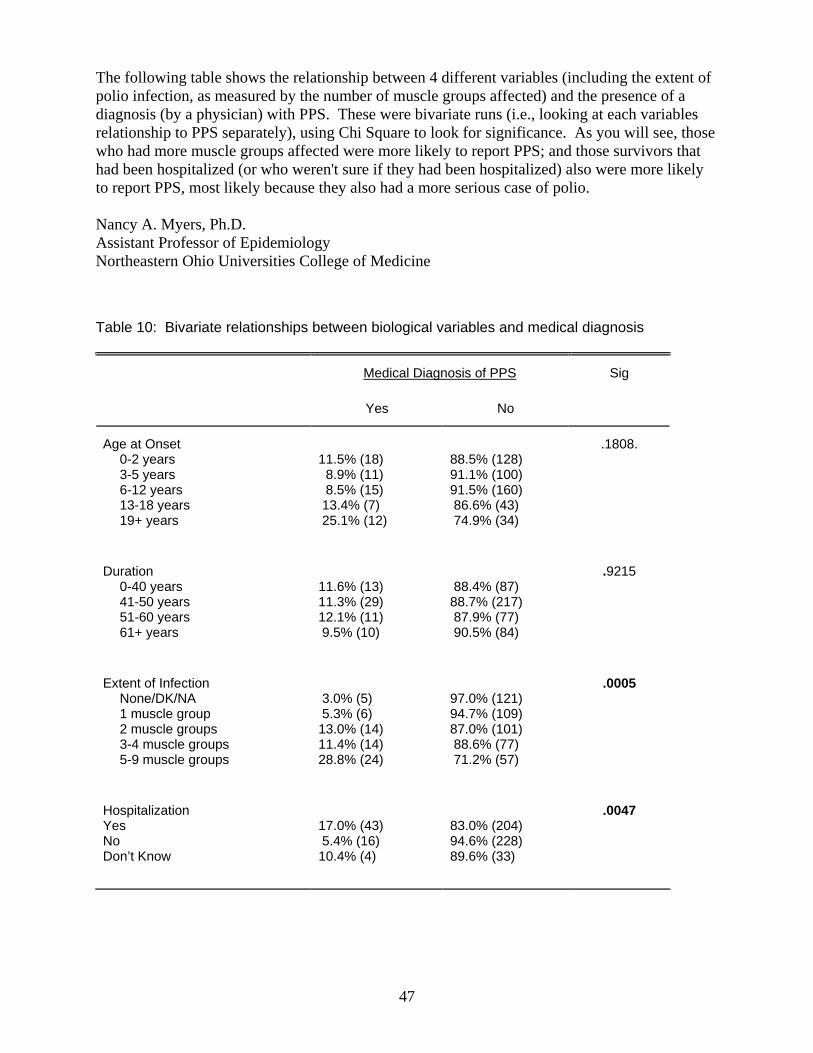
47
The following table shows the relationship between 4 different variables (including the extent of polio infection, as measured by the number of muscle groups affected) and the presence of a diagnosis (by a physician) with PPS. These were bivariate runs (i.e., looking at each variables relationship to PPS separately), using Chi Square to look for significance. As you will see, those who had more muscle groups affected were more likely to report PPS; and those survivors that had been hospitalized (or who weren't sure if they had been hospitalized) also were more likely to report PPS, most likely because they also had a more serious case of polio. Nancy A. Myers, Ph.D. Assistant Professor of Epidemiology Northeastern Ohio Universities College of Medicine Table 10: Bivariate relationships between biological variables and medical diagnosis
Medical Diagnosis of PPS
Sig
Yes
No
Age at Onset
0-2 years 3-5 years 6-12 years 13-18 years 19+ years
11.5% (18) 8.9% (11) 8.5% (15) 13.4% (7) 25.1% (12)
88.5% (128) 91.1% (100) 91.5% (160) 86.6% (43) 74.9% (34)
.1808.
Duration
0-40 years 41-50 years 51-60 years 61+ years
11.6% (13) 11.3% (29) 12.1% (11) 9.5% (10)
88.4% (87) 88.7% (217) 87.9% (77) 90.5% (84)
.9215
Extent of Infection
None/DK/NA 1 muscle group 2 muscle groups 3-4 muscle groups 5-9 muscle groups
3.0% (5) 5.3% (6) 13.0% (14) 11.4% (14) 28.8% (24)
97.0% (121) 94.7% (109) 87.0% (101) 88.6% (77) 71.2% (57)
.0005
Hospitalization Yes No Don’t Know
17.0% (43) 5.4% (16) 10.4% (4)
83.0% (204) 94.6% (228) 89.6% (33)
.0047