politecnico di torino porto institutional repository · b politecnico di torino, diati, 10129,...
TRANSCRIPT

Politecnico di Torino
Porto Institutional Repository
[Article] THE 4DILAN PROJECT (4TH DIMENSION IN LANDSCAPE ANDARTIFACTS ANALYSES)
Original Citation:Chiabrando, Filiberto; Naretto, Monica; Sammartano, Giulia; Sambuelli, Luigi; Spano’, AntoniaTeresa; Teppati Lose’, Lorenzo (2017). THE 4DILAN PROJECT (4TH DIMENSION IN LANDSCAPEAND ARTIFACTS ANALYSES). In: INTERNATIONAL ARCHIVES OF THE PHOTOGRAMMETRY,REMOTE SENSING AND SPATIAL INFORMATION SCIENCES, vol. XLII-5/W1, pp. 227-234. -ISSN 2194-9034
Availability:This version is available at : http://porto.polito.it/2675389/ since: June 2017
Publisher:Tucci G., Bonora V.
Published version:DOI:10.5194/isprs-archives-XLII-5-W1-227-2017
Terms of use:This article is made available under terms and conditions applicable to Open Access Policy Arti-cle ("Creative Commons: Attribution 3.0") , as described at http://porto.polito.it/terms_and_conditions.html
Porto, the institutional repository of the Politecnico di Torino, is provided by the University Libraryand the IT-Services. The aim is to enable open access to all the world. Please share with us howthis access benefits you. Your story matters.
(Article begins on next page)

THE 4DILAN PROJECT
(4TH DIMENSION IN LANDSCAPE AND ARTIFACTS ANALYSES)
F. Chiabrandoa, M. Narettoa, G. Sammartanoa, L. Sambuellib. A. Spanòa,*, L. Teppati Losèa
a Politecnico di Torino, DAD, 10129, Torino, Italy - (filiberto.chiabrando, monica.naretto, giulia.sammartano, antonia.spano, lorenzo
teppati)@polito.it b Politecnico di Torino, DIATI, 10129, Torino, Italy - (luigi [email protected])
WG V/1, WG V/2, WG II/8 WG IV/2
KEY WORDS: 3D modelling, UAV photogrammetry, GPR (Ground Penetrating Radar), TLS (Terrestrial laser scanning), archive
documents, knowledge for conservation project
ABSTRACT:
The project is part of the wider application and subsequent spread of innovative digital technologies involving robotic systems. Modern
society needs knowledge and investigation of the environment and of the related built landscape; therefore it increasingly requires new
types of information. The goal can be achieved through the innovative integration of methods to set new analysis strategies for the
knowledge of the built heritage and cultural landscape.
The experimental cooperation between different disciplines and the related tools and techniques, which this work suggests for the
analysis of the architectural heritage and the historical territory, are the following:
- 3D metric survey techniques with active and passive sensors - the latter operating in both terrestrial mode and by aerial point
of view. In some circumstances, beyond the use of terrestrial LiDAR, even the newest mobile mapping system using SLAM
technology (simultaneous localization and mapping) has been tested.
- Techniques of non-destructive investigation, such as geophysical analysis of the subsoil and built structures, in particular
GPR (Ground Penetrating Radar) techniques.
- Historic and stratigraphic surveys carried out primarily through the study and interpretation of documentary sources,
cartography and historical iconography, closely related to the existing data or latent material.
The experience through the application of these techniques of investigation connected to the built spaces and to the manmade
environments has been achieved with the aim of improving the ability to analyse the occurred transformations/layers over time and no
longer directly readable or interpretable on manufactured evidence.
* Corresponding author
1. INTRODUCTION
The reconstruction of the history of a building, prior to any
project of conservation, recovery, restoration treatment is an
accepted and well-established starting point of modern
approaches to preservation of cultural heritage (CH). (ICOMOS
charters and other doctrinal texts -
http://www.icomos.org/en/charters-and-texts)
The different disciplines responded by developing different
techniques and refining methods to respond to this great basic
requirement. In general terms, the surveying techniques, even
before the establishment of Geomatics, which today includes the
oldest sciences of land, built heritage and any kind of other CH
surveying, based in the past the possibility of reconstructing the
building palimpsest relying on Architectural Photogrammetry.
The images in fact set in a storable document the situation of the
moment of the shot.
The possibilities provided today by the use of integrated
Structure from Motion (SfM) technique in photogrammetric
process, together with the dense clouds production algorithms,
have provided the possibility to exploit the technological
evolution, which integrates the auto-calibration of the cameras in
the block orientation processing, to develop exponentially the
ability of using archive images even distant in time.
(Sammartano et al., 2017)
To stay longer in the field of heritage documentation using
image-based techniques, we are witnessing today the
development of theoretical studies that aim to specialize SfM
technique to get reconstructive models even in critical scenarios
(Cohen et al., 2015). Another emerging field of study and
applications aims to reconstruct lost CH caused by wars or
natural disasters, even exploiting crowdsourcing strategies.
(Stathopoulou et al., 2015, Bashar 2016)
The present research purpose indeed, aims to give emphasis to
analytical skills related to the time dimension of individual
techniques and different methods: geophisical investigations and
documentary sources reading, in connection to survey techniques.
The goal is taking advantage of the broader integrated
multidisciplinary comparison with their interaction and
collaboration. (Sambuelli et al., 2015; Arato et al. 2016, Di
Pietra et al., 2017)
A method of inquiry that has become virtually an independent
discipline is known in italian area Architecture Archeology
(Brogiolo, Cagnana, 2012). In this field of study, the use of
archaeological methods in the study of architecture aims to enrich
the knowledge base, since buildings show signs of
transformation, restoration, reconstruction, and demolition.
The International Archives of the Photogrammetry, Remote Sensing and Spatial Information Sciences, Volume XLII-5/W1, 2017 GEOMATICS & RESTORATION – Conservation of Cultural Heritage in the Digital Era, 22–24 May 2017, Florence, Italy
This contribution has been peer-reviewed. doi:10.5194/isprs-archives-XLII-5-W1-227-2017 227

The application of the stratigraphic method to archaeology hails
from Edward Harris’ experiences dating back to the mid-
twentieth century (Harris 1989). The goal is to define
construction phases of the building (chronological sequences)
within a relative chronology and subsequently, their settings in
an absolute chronology introducing dates or periods.
The project of integrating these survey techniques was called
4Dilan (4th dimension in landscape and artifacts analyses); all the
activities were developed according to another key point that was
connected to the educational purpose. Consequently, all the
preliminary studies, the data acquisition on the field, data
processing and the final interpretation of the results were carried
out with the active involvement of groups of students. This
objective was pursued to improve the knowledge of the involved
students in order to become acquainted with different disciplines
and face with different experiences that are not usually provided
in the normal educational path of the areas of Engineering and
Architecture. Moreover, this approach develops the experience of
the students increasing the competence regarding the
interdisciplinary data management to support decisions, as well
as to design interventions in the field of Cultural Heritage.
The paper deals with two applications of the proposed
methodology in the Piedmont area. The first test has been
realized in the area of the Novalesa abbey, a built complex with
extraordinary landscape and architectural richness
The second case study is the castle of Valperga overlooking a
little village at 50 km from Torino. The castle was built in a
strategic position, on the top of the hill around which, afterwards,
the settlement of Valperga was based on a semi-circular shape.
2. METHODS
2.1 Geomatics techniques
Among the many developmental perspectives of survey methods,
the one that is largely of wider interest in some years is the use of
UAV (unamanned aerial vehicle) photogrammetry. By acquiring
images at low altitudes and being able to effectively target the
object being investigated by nadiral and oblique images, it
provides a clear strength in the context of the documentation of
CH. (Wiedemann et al. 2012, Remondino et al. 2011).
Among the most investigated aspects there is certainly the
integration with terrestrial data, often of Lidar nature, to generate
multiscale and multisensor 3Dmodels, orthophotos and other
useful graphical 2D/3D products. (Lerma et al., 2011)
Another of the features that are particularly attractive in the field
of heritage documentation is the low cost of the techniques and
their expediency, which makes the process of generation the
dense and rich information 3D models particularly sustainable in
the overall preservation plan.
These cited approaches have also been used in the perspective of
the 4Dilan project, and in one of the applications, the innovative
3D mobile mapping system, the hand-held Zeb Revo system by
Geoslam. (http://geoslam.com/) has been experimented.
This system exploit a 2D lightweight time-of-flight scanner with
30 m maximum range (Hokuyo scanner) and an Inertial
Measurement Unit (IMU), which ensure roughly the position of
the device during the moving acquiring session. The continuous
revolution movement of laser sensor generates the 3D point
cloud and the mapping system is based on the Simultaneous
Localization and Mapping (SLAM) technology (Bosse, Zlot,
Flick, 2012). The innovative aspect of this technology is the
chance to use the environment to update the position of the
device (Riisgaard, Blas, 2005).
The raw trajectory enable to roughly calculate the surface
normals and potential constraints (features recognition) within a
single sweep of the scanner. Then a cloud-to-cloud registration
generate the 3D cloud using an iterative process which relies on
geometric objects and features within the constrains, essential to
align subsequent scans.
2.2 GPR (Ground Penetrating Radar) technique
The GPR method is based on sending an electromagnetic (EM)
impulse by a transmitting antenna (Tx) and receiving the echoes
by a receiving antenna (Rx). The commercial GPR systems work
in the frequency range between 10 MHz and 3 GHz. The choice
of the system frequency is essential and has to be made according
to a trade-off between penetration depth and resolution. In fact,
the earth material act as low pass filters with respect to the EM
waves. This means that lower frequencies (i.e. long wavelengths)
may go deeper in the subsoil than higher frequencies (i.e. short
wavelengths). Then, in principle, we should use low frequencies
to get higher penetration depths. On the other hand the
resolution, that is the capability to show small objects, depends
on the wavelength: the shorter the wavelength, the better the
resolution. In other words lower frequencies imply deeper signal
penetration but lower resolution, while higher frequency allow
higher resolution but lower signal penetration.
In archaeological surveys, GPR is used to find the interfaces
between the soil and the buried structures. Soil characteristics
(porosity, texture, mineral composition, pore-fluid distribution
and chemistry) determine the soil EM impedance (Zem), which is
very often different from the one of the material the buried
structures are made of. The electromagnetic discontinuities (or
dielectric interfaces) between two media with different Zem, in
fact, act as signal reflectors, refractors and diffractors (e.g. Davis
and Annan, 1989; Reynolds, 1997). Common GPR surveys are
carried out by moving the antennas along parallel profiles on the
x-y plane to obtain, pulling together the echoes (i.e. the radar
traces) , the radargram. This latter is an image which has on the
horizontal axis the running positions of the antenna (x) and on
the vertical axis the so called two-way-traveltime (twt) that is the
time the impulse takes to travel down and up in the subsoil.
Within the radargrams the echoes which come from different
depths along the profile and hence the underground
electromagnetic interfaces can be identified. Knowing the
propagation velocity of the EM impulse in the soil the
radargrams can be transformed, via the simple relation
z=v·0.5·twt in vertical EM sections (x-z plane) of the subsoil
below the profiles. Usually in the archaeological surveys the
analysis of many single parallel radargrams is not meaningful.
Much more significant are the so called time-slices (or depth-
slices) obtained by properly assembling in the space the
radargrams, in a so called data-cube, and extracting horizontal
cuts that are images on the planes x-y at different times (twt) or
depths (z).
3. THE EXERIENCES
3.1 First case study: Novalesa Abbey (Piedmont – Italy)
The Gallo-Roman rector Abbone, belonging to a prominent
family of the Merovingian aristocracy, founded the Benedictine
abbey of Novalesa, dedicated to the saints Peter and Andrea, on
January 30th 736 A.D. It is, in fact, one of the oldest and
important abbeys of the whole Alpine arch, placed in a strategic
area for the frank advance towards the Po Valley.
Its multi-century history is well-known, thanks to the long series
of archaeological investigations, begun in 1978. The data until
The International Archives of the Photogrammetry, Remote Sensing and Spatial Information Sciences, Volume XLII-5/W1, 2017 GEOMATICS & RESTORATION – Conservation of Cultural Heritage in the Digital Era, 22–24 May 2017, Florence, Italy
This contribution has been peer-reviewed. doi:10.5194/isprs-archives-XLII-5-W1-227-2017
228

now acquired allow a preliminary reconstruction of the main
phases of the monastic complex and its transformations over the
centuries, but much remains to be discovered.
For example, the relationship between the chapels around the
central core of the monastic complex and the core itself is not
clear. Moreover, historical cartography tells us that the access
was different from the present one and other documentary
sources, such as the archaeological excavations of the Chapel of
Santa Maria, tell us that this chapel was placed in a probable
area of welcome of pilgrims.
The attempt to clarify on this point was the focus of the 4dilan
project's use and comparison of investigating techniques.
3.1.1. Image and range based integrated surveys and
historical cartography
Considering the purpose of investigating a problem of spatial,
functional and temporal relations between the different artefacts
of the abbey, the approach could only be based on a comparison
between a large scale map of the complex, which was built by
UAV photogrammetry, and historical cartography.
Observing the map of figure 1 (second half of the eighteenth
century), superimposed to the regional technical map, we can see
that the ancient access way was to the west of the current, till
today coded as rural road. A second road, crossing the creek
Cenischia, downstream of the current bridge that allows access
from the center of Novalesa built-up area, is even visible (only in
the map, as we are going to see in the next UAV orthophoto).
In Novalesa we made numerous flights using two different platforms
and different flight strategies (Aicardi et al., 2016), but in this paper
we will refer only the executed flight using the eBee autonomous
flying drone bt SenseFly Company, marketed by Menci Software
https://www.sensefly.com/drones/eBee.html), which made possible
to realize the DSM and orthophoto at a smaller scale.
Figure 1. Old Cartography for the analysis of the Abbey’s
territory superimposed to the regional technical map [The great
map of the Susa Valley. AST, Court, Topographic maps and
drawings, Topographic maps for A and B, “Susa 3”]
camera: Canon PowerShot S110
number of acquired images: 417
image dimension 4000 [pixels] x 3000
[pixels]
sensor dimension 7.440 [mm] x 5.580 [mm]
Ground sampling distance 5.06 [cm]
focal distance: 5.2 [mm]
flight height (medium) 141.4624 [m]
RMS error (Root Mean Square
error): 0.004 [m]
Table 1 – Camera and Ebee flight parameters
Figure 2. (Above left) Digital Surface model processed by
Pix4Dmapper software. (Above right) Topographical network;
(below) meshed model and textured meshed model. (Patrucco,
2016)
Figure 3. Estension of orthophoto compared with regional map.
The flight has been performed according to the parameters
reported in table 1 and having previously measured 52 plane
targets with GPS / RTK technique, obviously connected to a
topographical network of vertices determined also with satellite
technique GPS / GNSS.
The first material sign of a past configuration today no longer
appreciable, which is the access route that laps the Santa Maria
chapel, has been investigated with the GPR technique, reported
in the next paragraph 3.1-2. After a series of inspections that
have been completed along the shores of the stream, the bridge
on Cenischia, though only slightly visible on the orthophoto
(Figure 3), has been identified and detected with the LiDAR
technique (Figure 4). Documentary sources report that the access
road was used by the Savoy court on visit to the abbey.
3.1.2 GPR investigations on entrance areas
Acquisition and processing, and results.
The survey was made on September 23, 2015 with a K2 IDS
GPR and a 200 MHz IDS antenna. The GPR profiles were
acquired along two perpendicular directions: N65°E (x) and
N25°W (y). The x profiles were 21, spaced 1 m and 50 m long
The International Archives of the Photogrammetry, Remote Sensing and Spatial Information Sciences, Volume XLII-5/W1, 2017 GEOMATICS & RESTORATION – Conservation of Cultural Heritage in the Digital Era, 22–24 May 2017, Florence, Italy
This contribution has been peer-reviewed. doi:10.5194/isprs-archives-XLII-5-W1-227-2017
229

Figure 4. 1:2000 scale orthomap with the ancient access route
highlighted in red.
Figure 5. The ancient collapsed bridge, (above) an excerpt from
the orthophoto and (below) a view of five scans registered cloud
while the y profiles were 100, spaced 0.5 m and 20 m long. The
trace duration was 150 ns with a sampling rate of about 6.8 GHz.
On average, along x and y, the interval between the radar traces
was 6 cm. After a standard processing (Sambuelli et al., 2014)
the timeslices were extracted and the images on the x-y plane
were placed after the GPS data collected during the acquisition.
Figure 5. (Above) GPR profiles planning, topographically
located onto the orthophoto. (Below) Superimposition of time-
slice at 0.7 m of depth on orthophoto, with main anomalies
derived from geophisical prospections highlighted.
Among the extracted timeslices the most significant seems the
one corresponding to a depth of about 0.7 m (calculated
according to an estimated propagation velocity of 15 cm/ns). At
this depth, aside the trace of the ancient pathway, a plan of a
round-like structure is quite clearly shown.
3.1.3 Results
In Novalesa project, no material source reported the presence of
built structures near the entrance area of the abbey, and
documentary sources refer to the passage of carriages on a
bridge, which has been identified and then scanned, since today it
is collapsed and disused. Many insights predicted the hypothesis
concerning a possible welcoming area; therefore, in this place we
localized the GPR surveys that identified submerged structures to
a compatible depth. Such buried structures were not yet known to
the literature of the field.
The International Archives of the Photogrammetry, Remote Sensing and Spatial Information Sciences, Volume XLII-5/W1, 2017 GEOMATICS & RESTORATION – Conservation of Cultural Heritage in the Digital Era, 22–24 May 2017, Florence, Italy
This contribution has been peer-reviewed. doi:10.5194/isprs-archives-XLII-5-W1-227-2017
230

3.2 Second case study: Valperga castle (Piedmont – Italy)
The town's urban conformation of Valperga complaint formation
around a defensive core. The town is in fact developed at the foot
of the hill on which stands the castle and is configured as a type
of centralized settlement, divided into three neighborhoods.
The history of Valperga is identical with that of the Valperga
family, which for several centuries has extended the control to
much of the Canavese area.
It is difficult to reconstruct the history of the castle also because
the spread in the sixteenth century of false documentation by the
lords who wanted to affirm the exercise of power by any means.
(Sergi, 1995).1
3.2.1. Suggestions from historical iconography
The events concerning the castle are alternate during the long
centuries of struggle for control of territory and hardly
reconstructable; the first track configuration similar to the
present one has in cartography and drawings conserved in the
“Archivio di Stato” of Turin (AST) and in the “Archivio Storico
del Castello” of Masino (ASCM), dated later the half of the
sixteenth century.
It is not our intention in this work retrace the history of the
transformations that have given rise to the current highly
stratified configuration in time of the castle, but just with the
spirit of 4Dilan project, we chose to try to shed light on an aspect
not investigated by historical literature.
At the beginning of the nineteenth century, some demolition and
restoration of portions of the so-called Thones block has been
provided. Some preserved planning drawings show the existence
of a body of the building, represented as projection on the ground
floor plan, so probably was aerial, which now no longer exists
and that could be the cause also of the problems of static stability
of the towers (figure 6). The subsequent investigations aim to
clarify just these parts of the building and the tower.
3.2.2. Image and range based integrated surveys
Since the castle is located on the top of the hill with few open
spaces available, it was decided to carry out the overall map of
the castle using a vertical take-off drone.
Obviously, this carrier, offering the opportunity to acquire
nadiral and oblique images is definitely much more suitable for
the need to resume the buildings of the castle complex, arranged
articulately and with very narrow courtyards.
Figure 6. Pianta della prosione di Castello […], 1807. ASCM,
faldone 375/n° 6637.
1 The Valperga Castle was the subject of a thesis in 2010
(Cerutti, 2010), and during these months, the following students,
who took part to the field and laboratory phases, are preparing
other Msc theses: Nany Alejandra Matamoros Torres, Vivian
Camila Pinzon Mejia, Julian David Chavez Rodriguez. All of
them joined the 4Dilan project.
Figure 7. The sheet of Cadastral France map concerning the
Valperga municipality (a multi parameters transformation
providing a spatial reference to the French map has been applied
in GIS environment – Nany Matamoros elaboration)
.
Figure 8. Automated
scheme of overlapping
stripes and images.
camera: Sony ILCE-5100
number of acquired images: 919
image dimension 6000 [pixels] x 4000 [pixels]
pixel dimension 4x4 [mm]
Ground sampling distance 2.06 [cm]
focal distance: 20 [mm]
flight height (medium) 117 [m]
RMS error (Root Mean
Square error): 0.026 [m]
Table 2 – Camera and UBIK DIATI MK01 flight parameters
The drone used is the Ubik DIATI MK01: flight planning has
provided two sets of strips perpendicular to each other in north-
south direction with footage of nadiral frames, other two sets of
perpendicular strips favourable to the prevailing orientation of
the castle buildings with oblique shots, and a last swipe with
converging streaks.
The International Archives of the Photogrammetry, Remote Sensing and Spatial Information Sciences, Volume XLII-5/W1, 2017 GEOMATICS & RESTORATION – Conservation of Cultural Heritage in the Digital Era, 22–24 May 2017, Florence, Italy
This contribution has been peer-reviewed. doi:10.5194/isprs-archives-XLII-5-W1-227-2017
231

Figure 9. Two different bird eye views of the processed dense
cloud. (18 milion points)
Figure 10. Other two views of an excerpt of the colored cloud;
0.026 m RMSE on GCP shows a good ability to represent the
dense edification.
Figure 11. (side column) The 0.212 km2 extension of the orthophoto
covering area, projected on regional DEM. (Nany Matamoros elab.);
(above) An excerpt of the 2 cm resolution orthophoto, enabling to
examine a collapsed roof.
The Thones building (see red box in figure 10), located between
two very narrow courtyards has been surveyed with terrestrial
Lidar technique, with many difficulties. The designed
topographic network, which expected the determination of two
vertices in the yard that border the structure to the north side, has
provided an accuracy totally inadequate in the calculation of the
position of the vertices.
So, the clouds from terrestrial scans were recorded by organizing
the registration into three blocks (Figures 12); the first block
(blue) was georeferenced through a series of targets measured by
total station, while the other two blocks have been registered to
the first using the shape alignment strategy.
A last phase of the test was very interesting for us since we
acquired a number of laser clouds using the hand-held ZebRevo
system; the clouds have been acquired by means of the closed
paths strategy in order to control the closing error and they
showed a good quality especially for indoor environments.
The last image of the figure 12 shows a facade of Thones
building facing the South courtyard; this portion of the point
model acquired through traditional terrestrial scans (Faro Focus
3D scanner) has been used as a ground truth for the ZebRevo
clouds alignment. The referencing of these low-resolution clouds
has been in fact processed using again the best-fit strategy.
Figure 13 shows the results of the union 4 clouds acquired with
the ZebRevo system (the courtyard cloud, the underground
icehouse, the basement floor and the mezzanine floor); all these
best-fit alignments have provided rather satisfactory results,
reaching 5÷ 6 cm of average error.
The interesting section profiles of Figure 14 show the relations
between the UAV cloud (roof), the Lidar cloud representing
buildings and courtyards and ZebRevo cloud pertaining interiors.
Finally, the figure 15 shows the accuracy of a ZebRevo cloud
concerning a façade sample compared with Lidar cloud.
Depending on type of surveyed surface, there are errors near to
1÷2cm for plane surface, 5÷7 cm for distant or articulated surfaces.
The International Archives of the Photogrammetry, Remote Sensing and Spatial Information Sciences, Volume XLII-5/W1, 2017 GEOMATICS & RESTORATION – Conservation of Cultural Heritage in the Digital Era, 22–24 May 2017, Florence, Italy
This contribution has been peer-reviewed. doi:10.5194/isprs-archives-XLII-5-W1-227-2017
232
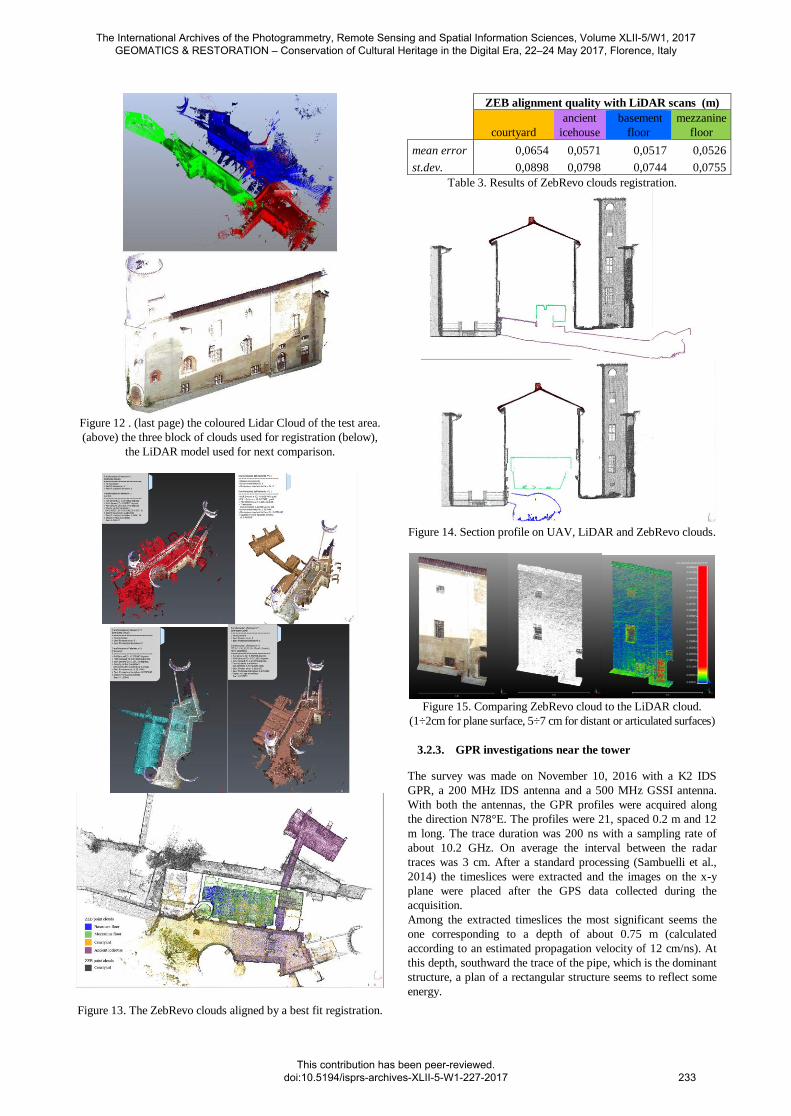
Figure 12 . (last page) the coloured Lidar Cloud of the test area.
(above) the three block of clouds used for registration (below),
the LiDAR model used for next comparison.
Figure 13. The ZebRevo clouds aligned by a best fit registration.
ZEB alignment quality with LiDAR scans (m)
courtyard
ancient
icehouse
basement
floor
mezzanine
floor
mean error 0,0654 0,0571 0,0517 0,0526
st.dev. 0,0898 0,0798 0,0744 0,0755
Table 3. Results of ZebRevo clouds registration.
Figure 14. Section profile on UAV, LiDAR and ZebRevo clouds.
Figure 15. Comparing ZebRevo cloud to the LiDAR cloud.
(1÷2cm for plane surface, 5÷7 cm for distant or articulated surfaces)
3.2.3. GPR investigations near the tower
The survey was made on November 10, 2016 with a K2 IDS
GPR, a 200 MHz IDS antenna and a 500 MHz GSSI antenna.
With both the antennas, the GPR profiles were acquired along
the direction N78°E. The profiles were 21, spaced 0.2 m and 12
m long. The trace duration was 200 ns with a sampling rate of
about 10.2 GHz. On average the interval between the radar
traces was 3 cm. After a standard processing (Sambuelli et al.,
2014) the timeslices were extracted and the images on the x-y
plane were placed after the GPS data collected during the
acquisition.
Among the extracted timeslices the most significant seems the
one corresponding to a depth of about 0.75 m (calculated
according to an estimated propagation velocity of 12 cm/ns). At
this depth, southward the trace of the pipe, which is the dominant
structure, a plan of a rectangular structure seems to reflect some
energy.
The International Archives of the Photogrammetry, Remote Sensing and Spatial Information Sciences, Volume XLII-5/W1, 2017 GEOMATICS & RESTORATION – Conservation of Cultural Heritage in the Digital Era, 22–24 May 2017, Florence, Italy
This contribution has been peer-reviewed. doi:10.5194/isprs-archives-XLII-5-W1-227-2017
233

3.2.4 RESULTS
In Valperga test, the process of analysis has been inverse compared
with Novalesa, since the written sources report the presence of no
longer visible structures, we have placed the result of the integration
techniques to hypothesize and reconstruct the original layout of a
tower. The data acquisition strategies, processing steps and analysis
are reported in the paper with a first evaluation of the proposed
approach and the final achieved results.
4. DISCUSSION AND PERSPECTIVES
Either studies are fully configured as potential anchors of
plurality, wealth and stratification of the monumental, historical
and artistic evidences. The 4dilan project represents a first
support for connecting with tangible and intangible links, cultural
systems that put in contact the fragmented parts of the historical
territory. The common threads are made of an extensive
georeferenced documentations through the integration of three-
dimensional models generated by UAV and terrestrial
photogrammetry combined with Terrestrial Laser Scanner (TLS)
acquisitions. What has distinguished the later stages was the way
to use the written and material sources and further use of non-
destructive diagnostic investigations.
ACKNOWLEDGEMENTS
The authors would like to especially thank Team Direct
(https://www.facebook.com/Team-Direct-461829537253316) and
all people involved in the data acquisition, including Andrea Lingua,
Paolo Maschio and Diego Franco from Politecnico di Torino for the
operative phase on Novalesa test. We thank furthermore Politecnico
di Torino for promoting and financing the student project 4Dilan.
REFERENCES
Aicardi, I., Chiabrando, F., Grasso, N., Lingua, A. M., Noardo, F.,
Spanò, A., 2016. UAV photogrammetry with oblique images: first
analysis on data acquisition and processing, ISPRS Archives,, XLI-B1,
835-842, doi:10.5194/isprs-archives-XLI-B1-835-2016, 2016.
Alsadik, Bashar, 2016, Crowdsource and web-published videos
for 3D documentation of cultural heritage objects", Journal of
Cultural Heritage, 25.4, 899–903.
Arato, A., Garofalo, F., Sammartano, G, Spanò, A., 2016, Gathering
GPR inspections and UAV survey in Cultural Heritage
documentation context, in proceedings of the International GISTAM
Conference, Rome. 85-91
Brogiolo G. P., Cagnana A., 2012. Archeologia dell’architettura –
metodi e interpretazioni, All’insegna del Giglio, Firenze.
Bosse M., Zlot R., Flick P., 2012, Zebedee: Design of a Spring-
Mounted 3D Range Sensor with Application to Mobile Mapping,
IEEE Transactions on Robotics, 28 (5), 1104 – 1119,
DOI:10.1109/TRO.2012.2200990.
Cerutti, E, 2010. Il castello di Valperga. Analisi delle trasformazioni
architettoniche dal XVI al XIX secolo. Thesis, tutor: C. Cuneo.
Chiabrando F., Sammartano G., Spanò A., Teppati Losè L., 2017.
UAV oblique photogrammetry and lidar data acquisition for 3d
documentation of the Hercules fountain, in VAR, 2017.
Cohen A., Sattler T., Pollefeys M., 2015, Merging the unmatchable:
stitching visually disconnected SfM Models, ICCV.
Davis, J.L., Annan, A.P., 1989. Ground-penetrating radar for high
resolution mapping of soil and rock stratigraphy. Geophysical
Prospecting 37, 531–551.
Harris E.C., 1989. Principles of Archaeological Stratigraphy.
Academic Press; 2nd edition (Jun 15, 1989).
Lerma, J. L., Seguí, A. E., Cabrelles, M., Haddad, N., Navarro, S.,
Akasheh, T., 2011. Integration of laser scanning and imagery for
photorealistic 3D architectural documentation. INTECH Open Access
Publisher. DOI: 10.5772/14534.
Patrucco, G., 2016. Tecniche innovative UAV e LiDAR per l’analisi
stratigrafica delle murature: il chiostro dell’abbazia di Novalesa. Msc
thesis, tutors Spanò, Chiabrando, Naretto.
Reynolds, J.M., 1997. An Introduction to Applied and
Environmental Geophysics. John Wiley & Sons, NY.
Remondino, F., Barazzetti, L., Nex, F., Scaioni, M., Sarazzi, D. 2011.
UAV photogrammetry for mapping and 3D modeling–current status and
future perspectives. ISPRS Archives, 38(1), C22. DOI:
10.5194/isprsarchives-XXXVIII-1-C22-25-2011
Riisgaard S., Blas M., 2005. Slam for Dummies. A Tutorial
Approach to Simultaneous Localization and Mapping, Available:
http://ocw.mit.edu/NR/rdonlyres/Aeronautics-and-Astronautics/16-
412JSpring-2005/9D8DB59F-24EC-4B75-BA7A-
F0916BAB2440/0/1aslam-blas-repo.pdf.
Sambuelli, L., Böhm, G., Colombero, C., Filipello, A., 2015.
Photogrammetry and 3-D Ultrasonic Tomography to Estimate the
Integrity of Two Sculptures of the Egyptian Museum of Turin. In:
Near Surface Geoscience 2015 - 21st European Meeting of
Environmental and Engineering Geophysics, doi: 10.3997/2214-
4609.201413675
Sambuelli L., Elia D., Meirano V., Colombero C., 2014. Case
history: a magnetic and GPR prospection on a Roman rural villa in
western Piedmont (Italy), in: 33° Conv. Naz. Gruppo Nazionale di
Geofisica della Terra Solida, Bologna, 25-27 Nov. 2014. 191-195
Sergi, G., 1995. I confini del potere. Marche e signorie fra due regni
medioeval, Einaudi, Torino, 195.
Stathopoulou, E. K., Georgopoulos A., Panagiotopoulos G.,
Kaliampakos D., 2015, Crowdsourcing Lost Cultural Heritage.
ISPRS Annals of ISPRS, Vol. II-5/W3, 295-300
Wiedemann, A., More, J. (2012). Orientation strategies for
aerial oblique images. ISPRS Archives, Vol. 39 (B1). DOI:
10.5194/isprsarchives-XXXIX-B1-185-2012
Figure 16. GPR profiles
planning, and
superimposition to the
building model of the
time-slice at 0.73 m of
depth.
The International Archives of the Photogrammetry, Remote Sensing and Spatial Information Sciences, Volume XLII-5/W1, 2017 GEOMATICS & RESTORATION – Conservation of Cultural Heritage in the Digital Era, 22–24 May 2017, Florence, Italy
This contribution has been peer-reviewed. doi:10.5194/isprs-archives-XLII-5-W1-227-2017 234