political activity of firms: the role of firm-lobbying ... · ... the role of firm-lobbying...
TRANSCRIPT
Political activity of firms: The role of firm-lobbying networks and industry trade associations
Indraneel Chakraborty, Richard Evans and Rüdiger Fahlenbrach*
This Version: March 31, 2015
Preliminary. Please do not cite or circulate.
Abstract
Most corporate political spending consists of lobbying expenditures and candidate contributions from a firm’s Political Action Committee. We examine how the political spending of industry trade associations and lobbyist’s networks of clients affect a firm’s political strategy. The political expenditures of trade associations are of the same economic importance as the expenditures of corporations, and corporations and their trade associations support the same candidates. The average lobbyist in our sample has more than 40 clients and we find evidence of coordinated political spending across those clients. Firms are more likely to support a candidate if their lobbyist also personally contributes to that candidate. Firms are more likely to support an incumbent candidate that currently serves on a committee that regulates the firm’s industry. However, a firm is also more likely to contribute to a candidate that serves on a committee that is unrelated to its industry if that candidate serves on a committee that regulates another firm in the same lobbying network. Measures of the strength and quality of the lobbyist network are positively correlated with future stock returns even after controlling for the direct political spending of the firm.
*Chakraborty ([email protected]) is Assistant Professor at Southern Methodist University. Evans ([email protected]) is Associate Professor at Darden Graduate School of Business. Fahlenbrach ([email protected]) is Associate Professor at Ecole Polytechnique Fédérale de Lausanne and is affiliated with the Swiss Finance Institute. We thank Tim Adam, Alexander Stomper, and seminar participants from the Darden School of Business and the McIntire School of Commerce at the University of Virginia, Berlin Finance Research Day, and Research Associates for their helpful comments and suggestions. We are grateful to the Center for Responsive Politics for the political contribution and lobbyist usage data which we obtained from their website OpenSecrets.org. We also wish to thank Gang Zhang who provided excellent research assistance.
1
1. Introduction
The vast majority of Americans believe that there is too much corporate money in politics and that
corporations have too much influence on the political process.1 The general perception is exacerbated by
the lack of complete disclosure of corporate political contributions (see, e.g., Bebchuk and Jackson
(2013)). Perhaps as a consequence, the Securities and Exchange Commission (SEC) received more than
one million comment letters from individuals on a rulemaking petition requesting that the SEC develop
rules requiring public companies to disclose all of their spending on politics. The academic evidence,
however, on the amount of corporate political contributions comes to a different conclusion. Tullock
(1972) first asked the provocative question of why there is so little corporate money in politics, given the
enormous stakes.2
Our paper has two objectives. First, we want to give an as complete picture as possible of the
political activity of U.S. firms. Firms that participate in the political process typically do so in a variety of
ways. The two most common (and previously studied) methods are to contribute to the election
campaigns of politicians and to employ lobbyists to represent their interests to politicians and regulators.
We have assembled a database on the political activity of S&P 1,500 firms between 1998 and 2014 that
contains, in addition to standard lobbying and campaign contributions data, information on lobbying via
both in-house and contract/external lobbyists, industry trade associations’ lobbying and contributions, and
independent expenditure only committees. Second, we contribute to a resolution of Tullock’s puzzle. We
confirm that the absolute amount of money that U.S. corporations spent on politics is small
(approximately $2.5 billion across all firms per year), but we also show that corporate donations are
important relative to other donations by individuals and unions or special interest groups. Finally, we
show a previously undocumented, but significant level of coordination across corporations in their
political activity and analyze the consequences of this coordination.
1 See, e.g., the survey described at http://corporatereformcoalition.org/?page_id=98. 2 Tullock’s puzzle has remained valid until today (see, e.g., Ansolabehere, de Figueiredo, and Snyder (2003) or Lake (2014)). De Figueiredo and Richter (2014) describe it in their review paper on lobbying across the economics, management, and political science literature as one of the most fruitful avenues for future research.
2
Previous finance research has examined the return on investment to political spending by
analyzing the impact of contributions from the firm’s PAC (Cooper, Gulen, and Ovtchinnikov (2010))
and lobbying expenditures (Chen, Parsley and Yang (2014), and Hill et al. (2013)) on stock performance
and found economically very large effects. For example, Cooper, Gulen and Ovtchinnikov (2010) find
that an additional expenditure of $150,000 on PACs increases market capitalization by approximately $41
million. These numbers make Tullock’s question even more of a puzzle: If returns to political spending
are so large, why don’t we see more of it?
Most of the analysis of the prior literature is performed at the firm level and does not account for
the interconnected nature of political contributions, the use of lobbyists and the use of industry trade
groups by corporations.3 Accounting for lobbyists, lobbying via trade associations, and lobbyist networks
could play an important role for two reasons. First, while candidate contributions from individual firm
PACs are capped, a trade association or lobbyist could direct multiple clients to contribute to the same
candidate, effectively bypassing those contribution limits. Second, while a given firm may not contribute
to a given candidate, the lobbyist they employ or the trade association they are affiliated with may have
influence with that candidate either through their own personal network or contributions directed from
other clients of the lobbyist. By pooling resources across corporate and non-corporate clients, lobbyists
can aggregate influence and the economic magnitudes between cause (=political contributions) and effect
(=increase in market capitalization) become more plausible.
To give a simple example of the potential impact of these network effects, we use the political
index measure used by Cooper, Gulen and Ovtchinnikov (2010) and calculate it for both direct and
indirect contributions. Their political index measure counts the total number of candidates that receive
contributions from a given firm’s PAC over a rolling five year window. For our sample, the average
firm’s political index is 63.8, similar to Cooper, Gulen and Ovtchinnikov (2010) estimate of 72.5.
However, if we take into account the lobbyists employed by a given firm and the contributions made by
3 Ansolabehere, Snyder, and Tripathi (2002) and Lake (2014) show a link between PAC contributions and lobbying, but do not account for the fact that lobbyists potentially play an important coordination role.
3
other clients of those lobbyists, the average firm in our sample makes, in addition to direct contributions
to 63.8 candidates, indirect contributions to another 329.7 candidates through other clients in their
lobbyist’s network. While these indirect connections to candidates are likely less important than the
firm’s direct connections, ignoring them may substantially underestimate the true extent of a firm’s
political influence network.
Our main analysis consists of three parts. First, we analyze the determinants of political
contributions by corporate PACs in a candidate-firm-election-year observation framework (see Bertrand,
Bombardini, and Trebbi (2014) for a similar strategy on the determinants of giving by lobbyists to
candidates). Firms are more likely to give to politicians’ campaigns if they hold leadership positions, sit
on important committees, represent the state where the firm’s headquarters are located, and if they belong
to the majority party. Importantly for our lobbying network conjecture, we find that firms are significantly
more likely to give to a candidate if that candidate is important to other firms in the network of the shared
lobbyist but where the candidate is unrelated to the firms’ immediate interests. Also, we find strong
evidence that firms are more likely to give to candidates that receive contributions from their lobbyists,
consistent with a joint political strategy. Second, we show that the contributions of firms cluster in time
around the contributions of their lobbyists as well as the contributions of the trade associations that they
are affiliated with. Third, we employ time-series cross-sectional return regressions to determine whether
the usage of lobbying networks contributes to firm value. We find, as Cooper, Gulen, and Ovtchinnikov
(2010), that direct contributions increase future returns, but also that indirect effects via the lobbying
network and the quality of the employed lobbyists matter for stock returns. Overall, our results point to a
political strategy of firms in which they use lobbyists to coordinate their political giving and to maximize
its impact.
We contribute to two strands of the literature. There is a sizeable literature on whether firms
attempt to buy political influence and whether this influence matters for firm performance. Several
researchers have studied the impact of direct campaign contributions and lobbying efforts on firms.
Cooper, Gulen, and Ovtchinnikov (2010) examine PAC contributions to election candidates and find that
4

the number of candidates supported by a corporate PAC is positively linked with the firm’s future stock
returns. Chen, Parsley, and Yang (2014) and Hill et al. (2013) extend the results of Cooper, Gulen, and
Ovtchinnikov (2010) and include not only PAC contributions, but also a firm’s lobbying expenditures in
the analysis. They find that lobbying expenditures are much larger than PAC contributions, that firms
lobby more frequently than they contribute to PACs and that these lobbying expenditures also have
predictive power in stock return regressions. While Chen, Parsley, and Yang (2014) and Hill et al. (2013)
include firm-level contributions (the PAC contributions) and the firm-level dollar amount paid to
lobbyists, they do not take into account how the lobbying industry typically works, and thus potentially
understate the true effect of political spending. Our contribution to this political contribution-firm
performance literature is to estimate the regression not only with the firm-level PAC contributions or
lobbying expenditure but also with the lobbyist level (aggregate all of the contributions paid by firms that
use the same lobbyist since the lobbyist is the one maintaining and exercising the influence) contributions
to see which has greater power to explain firm returns.4
Second, there is a set of papers that analyze whether lobbying expenditures matter and that
examine the economics of the lobbying industry. Adelino and Dinc (2014) find that after the 2008
financial crisis, firms with weaker financial health lobbied more and consequently had a greater
likelihood of receiving stimulus funds. Bertrand, Bombardini, and Trebbi (2014) analyze whether
lobbyists provide issue-specific information to legislators or whether they provide their clients with
greater access to politicians and find more evidence in line with the latter. Consistent with this “who you
know” is more important than “what you know” result, Blanes I Vidal, Draca, and Fons-Rosen (2012)
show that lobbyists with experience in the office of a US Senator suffer a 24% drop in generated revenue
when that Senator leaves office. These papers give interesting insight into the lobbying industry on which
4 An additional set of related papers examines whether political connections affect the environment the firm operates in. There now exists evidence that connections to politicians are associated with better access to finance, lower tax rates, government-orchestrated corporate bailouts, and more government contracts (Claessens, Feijen, and Laeven (2008), Faccio (2006), Faccio, Masulis, and McConnell (2006), Fisman (2001), and Goldman, So, and Rocholl (2013)).
5
we can draw, but they do not analyze whether firms are connected via lobbyists and whether lobbyists
pool resources strategically across firms.
The remainder of the paper is organized as follows. Section 2 describes how firms participate in
the political process. In Section 3, we discuss how lobbyist networks work and develop testable
hypotheses. Section 4 describes our data sources and how we combine them, offers summary statistics
and analyzes the determinants of being politically active. Section 5 shows the main empirical analyses
and results. Section 6 concludes.
2. Corporate Political Activity
U.S. firms that decide to participate in the political process can do so in a variety of ways. Under U.S.
law, corporations cannot directly support candidates for federal office. Instead, they can form political
action committees (hereafter PACs) to which anyone5 can contribute up to a maximum of $5,000 in each
calendar year. From these funds, the corporate PAC can contribute up to a maximum of $5,000 per
candidate for both the primary and general election. Corporate PACs cannot only contribute to candidates,
but can also contribute to other political action committees such as leadership PACs or party committees.6
Firms can hire external lobbying firms or employ in-house lobbyists to attempt to influence
political decisions. Lobbying expenditures are not limited and can be funded from the corporate treasury.
The Lobbying Disclosure Act of 1995 mandates that lobbyists, both internal and external, disclose the
amounts spent and the issues lobbied.
Companies can make contributions to any non-candidate or non-party political committee
organized under section 527 of the Internal Revenue Code. Examples include the Republican Governors’
5 Corporate PACs or the corporation itself can solicit contributions to the PAC. The contributions can be solicited from both ‘restricted’ class employees of the company (executives, directors, or other with managerial roles) and their family members’ as well as hourly employees. Solicitation for contributions from hourly employees, however, can only be made twice a year. The PAC may also accept unsolicited contributions from others. 6 A leadership PAC is formally defined as a political committee that is directly or indirectly established, financed, maintained or controlled by a candidate or an individual holding federal office, but is not an authorized committee of the candidate or officeholder and is not affiliated with an authorized committee of a candidate or officeholder. Leadership PACs support candidates for various federal and nonfederal offices. For more information, see http://www.fec.gov/data/Leadership.do. Federal Political Party Committees such as the National Republican Senatorial Committee or the Democratic Senatorial Campaign Committee spend money on close Senatorial races.
6
Association and Democratic Governors’ Association. These 527 organizations may raise unlimited sums
of money from corporations, unions, associations and individuals, and then spend unlimited sums on
influencing the selection, nomination, election or appointment of candidates for public office, as long as
they do not expressly advocate the election of a particular candidate. Companies are not required to
report their contributions to 527 groups, but groups formed under Section 527 are obligated to make
public their donors.
Corporations can contribute to other tax-exempt social welfare organizations known as
501(c)(4)s. These organizations cannot have political activity as their primary purpose. Instead, they need
to be organized with a primary focus on social welfare. Many of these groups however do actively
participate in the political process. The 501(c)(4) organizations are not required to publicly disclose their
donors, and corporations are not required to disclose their contributions. This lack of disclosure makes
these contributions the most controversial (see, e.g., Bebchuk and Jackson (2013)). Although the lack of
disclosure may be appealing to corporations that wish to camouflage their political influence, Bonica
(2014) estimates that a surprisingly small amount of corporate money flows into 501(c)(4) organizations.
Companies can contribute to independent expenditure-only committees which are better known
under the name “Super-PAC”. These groups were created in the wake of the U.S. Supreme Court’s
Citizens United vs. Federal Election Commission decision and SpeechNow.org vs. Federal Election
Commission, a Federal Appeals Court for the District of Columbia decision, both issued in 2010. These
decisions established that corporations benefit from First Amendment protection regarding freedom of
speech in the form of independent political expenditures and de facto lifted corporate contribution limits
to organizations that advocate in favor or against a political candidate on a federal election. Super-PACs
need to disclose their donors like regular PACs.7
7 There are ways, however, to effectively circumvent the disclosure requirement. The Super-PAC organized by Karl Rove, American Crossroads, for example, maintains a 501(c)(4) sister organization, Crossroads GPS. A donor could give to Crossroads GPS, and Crossroads GPS would then give to the American Crossroads Super-PAC. Disclosure requirements are fulfilled by disclosing the contribution of Crossroads GPS with the ultimate donor remaining anonymous.
7

Corporations also typically belong to various trade associations (organized under section
501(c)(6) of the Internal Revenue Code of the United States). Trade associations can and often do use a
portion of their members’ dues or payments for lobbying expenditures and political campaign
contributions. Corporations can make unlimited payments to trade associations and do not have to
disclose their contributions.
Many states allow corporate donations to state and local candidates and to political committees
including party committees and those supporting ballot initiatives. Donations are capped with allowable
amounts varying by states. These donations have to be filed and the filings are available to the public.
3. Methodology
Prior research has examined the impact of both political contributions and lobbying expenditures on firm
stock returns. To understand both our methodology and how this methodology differs from the existing
literature, we first present the notation and a stylized description of the approach of Cooper, Gulen and
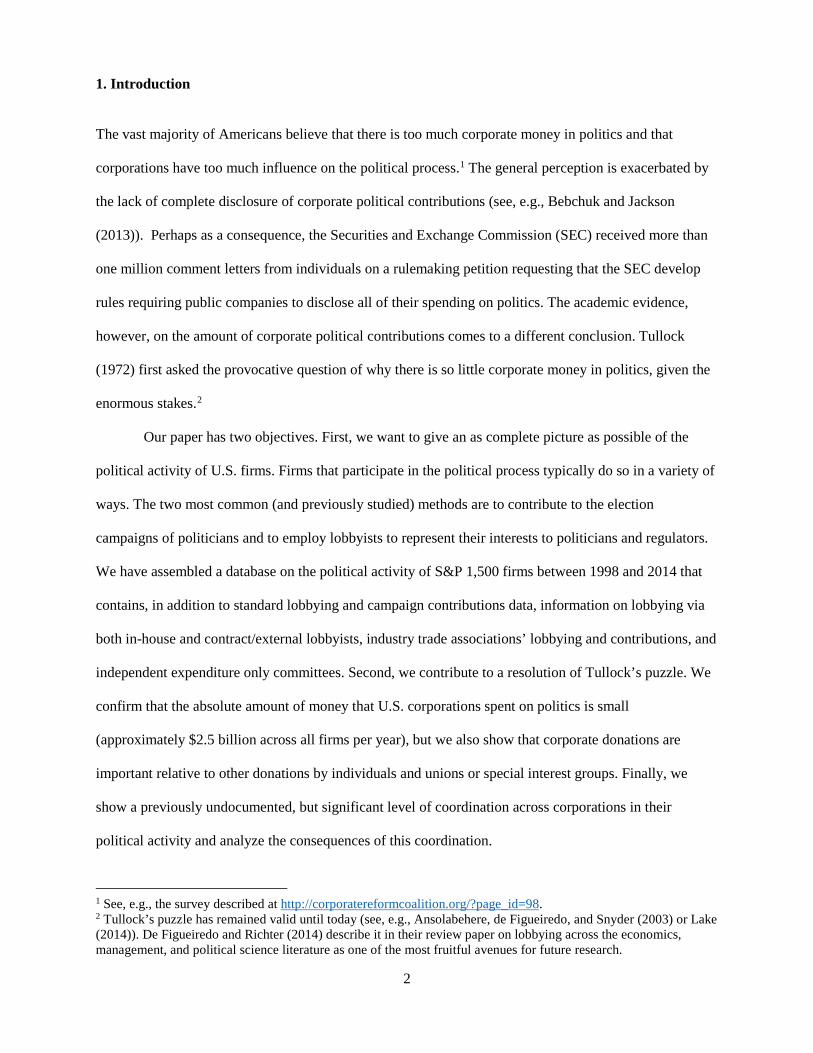
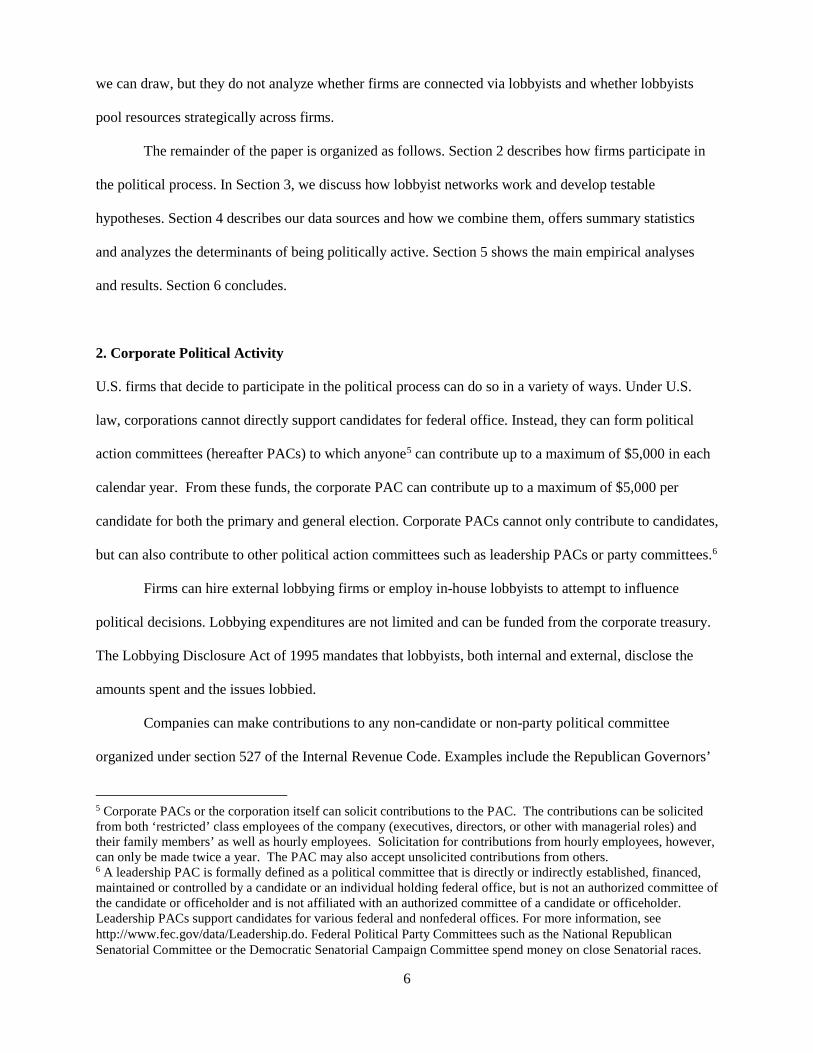
Ovtchinnikov (2010) in Figure 1. The political influence of a given firm is measured using their political
index (PIit), or the number of candidates that receive campaign contributions from firm i between time t.8
Figure 1 shows the contributions of two firms (1 and 2) to three candidates (1, 2 and 3) at a time t. The
contributions of firm i to candidate j are defined as Cij. Given this pattern of contributions, the political
index for both firm 1 (PI1t) and firm 2 (PI2t) would be equal to 2. In the case of firm 1, they directly
supported candidate 1 and 2 while firm 2 supported candidate 2 and 3.
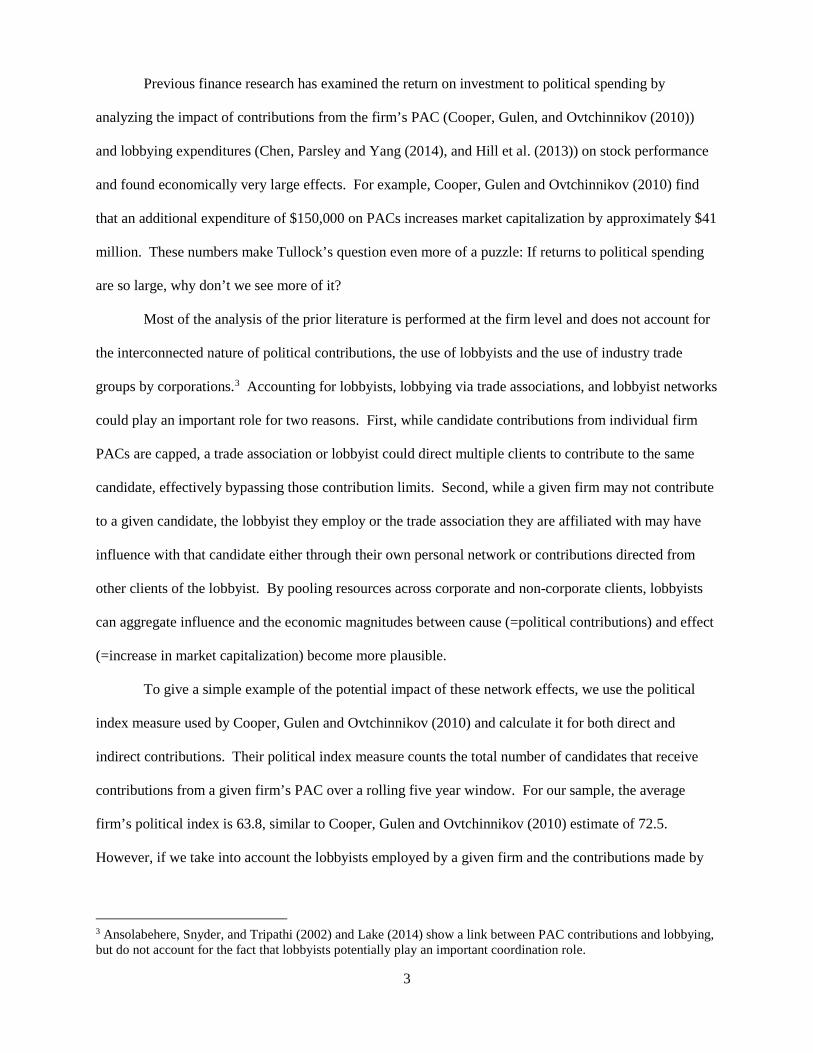
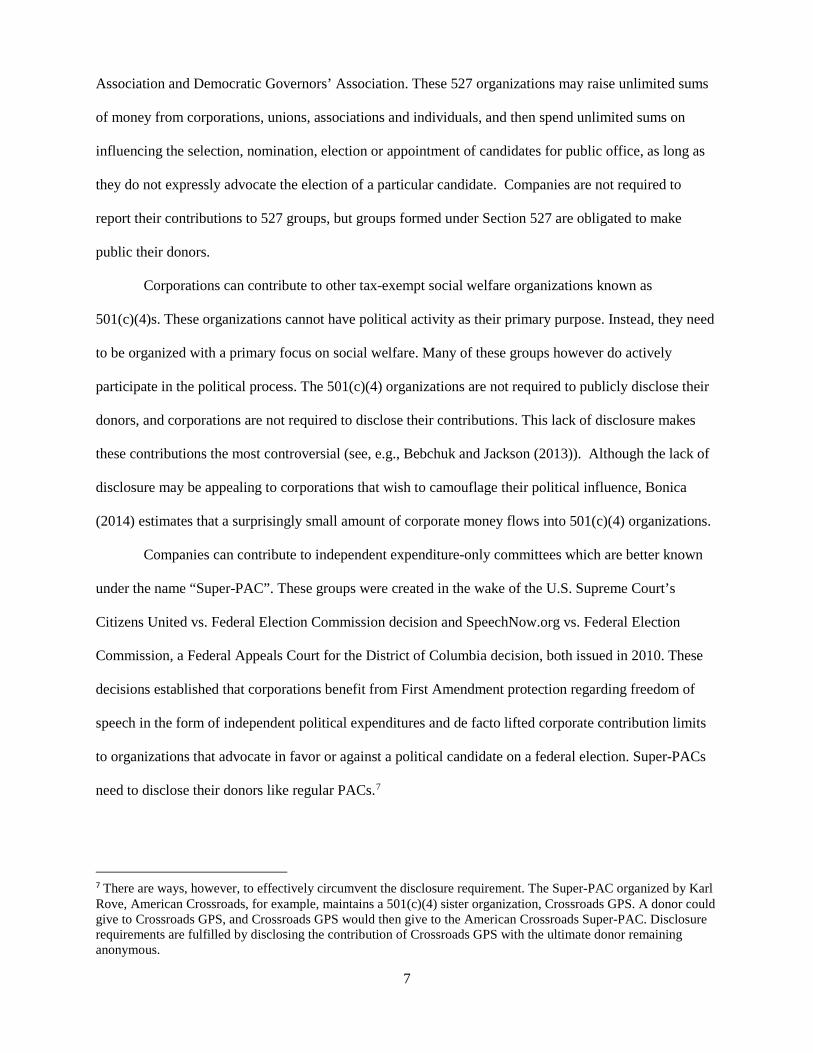
However, if the lobbyist plays an important role in the firm’s political contribution and influence
strategy, the relationship of interest is depicted in Figure 2 which displays the same set of firms and
candidates, but includes a common lobbyist employed by both firms 1 and 2, who helps to manage
governmental relations for both firms. As a result, the contributions to each candidate (Cij) still originate
from the firm, but the influence wielded on their behalf is managed by the lobbyist. This alternative
8 While we focus on a single year in this example for the sake of simplicity, Cooper et al (2010) measure these contributions over a five-year rolling window.
8
characterization differs in two important ways. First, each corporate PAC can give no more than $10,000
directly to a candidate per election cycle ($5,000 in the primary and $5,000 in the general election).
However, if influence is aggregated at the lobbyist level, both Firm 1 and Firm 2 can give the maximum
amount to Candidate 2, and the lobbyist could also give the maximum amount himself. Assuming the
magnitude of contributions translates into the level of influence of the lobbyist, that lobbyist can wield
greater influence on behalf of either Firm 1 or Firm 2. This would be particularly important in cases
where the two firms have different sets of key legislators (e.g. Senator Mary Landrieu, the (current) chair
of the Senate Committee on Energy & Natural Resources would be key for an energy company and
Senator Jay Rockefeller, the (current) chair of the Senate Committee on Commerce, Science, &
Transportation, for a trucking company). Firm 1 could contribute to both a key legislator and another
legislator who is unimportant to their political strategy, but is key for Firm 2. At the same time, Firm 2
could contribute to the latter legislator, who is key for them, but also contribute to the legislator of interest
to Firm 1. The influence generated from this effective quid-pro-quo contribution strategy would be
managed at a lobbyist level. Second, while Firm 1 did not contribute directly to Candidate 3, another
client of the lobbyist, Firm 2, has contributed. As a result, the lobbyist may be able to wield influence
with the Candidate on behalf of Firm 1. Moreover, the focus of the prior literature on the firm-level
ignores the influence wielded by the lobbyist on behalf of his or her non-corporate clients, of which there
are many.
In this alternative characterization of the firm-candidate relationship, a firm’s influence has three
different components: direct, multi-firm direct and indirect. In the case of candidate 1, employing a
lobbyist doesn’t change the nature of the firm’s influence. In the lobbyist’s network, only one client of
the lobbyist, Firm 1, contributes to the candidate. We refer to such a relationship as direct and our
measure of direct influence, the number of different candidates that a firm contributes to directly over the
previous 5 years, is the same as the measure employed in Cooper, Gulen and Ovtchinnikov (2010).
In the case of candidate 2, two clients of the lobbyist both contribute to the candidate. While the
prior literature has measured the direct effect of these contributions, the advent of ‘campaign bundling’ by
9
individuals suggests that aggregated contributions within a lobbyist network may have a non-linear effect
on influence and thereby on returns.9 With bundling instead of individuals contributing directly to a
candidate, those contributions from individuals are given to the candidate, but through the lobbyist
intermediary. While the contributions still originate from and are credited to the individuals who gave the
money, making the donation through a common intermediary is preferred. Put another way, we are
questioning if there is any difference in the influence generated if 10 individuals donate $5,000 each to a
candidate versus the same 10 individuals donating the $5,000 each, but having those donations ‘bundled’
by a common lobbyist. If so, the same ‘bundling’ effect may play a role in the contributions of
corporations who use a common lobbyist. In the case of our simplified example, because both firms
contribute to candidate 2, the influence managed by the lobbyist on behalf of either client may be greater,
so we refer to such a relationship as multi-firm direct. While we don’t differentiate between direct and
multi-firm direct political influence in our analysis of stock returns, we also examine the determinants of
a firm’s decision to contribute and show there that it is influenced both by their lobbyist’s contributions
and by the contribution decisions of other firms within their lobbying network.
In the last case of candidate 3, firm 1 does not contribute to the candidate. At the same time, the
lobbyist who works for firm 1 has another client (firm 2) that does contribute to candidate 3, so that firm
1 may have some indirect influence with candidate 3. Our measure of indirect political influence mimics
the direct measure from Cooper, Gulen and Ovtchinnikov (2010) counting the number of candidates
contributed to over the previous five years, but includes only the unique contributions (i.e. to candidates
that the firm of interest does not contribute to directly) of other firms in the same lobbying network as the
firm of interest.
9 For example, for George Bush’s 2000 Presidential campaign, this system of bundling was formalized and those individuals who were able to raise $100,000 or more by eliciting contributions from others were granted the title of campaign “Pioneers” and, as the Washington Post (“THE BUSH MONEY MACHINE: Fundraising's Rewards - Pioneers Fill War Chest, Then Capitalize”, Thomas B. Edsall, Sarah Cohen and James V. Grimaldi, Washington Post, Sunday, May 16, 2004; Page A01) explains, were recipients of other forms of recognition: “For achieving their fundraising goals, Pioneers receive a relatively modest token, the right to buy a set of silver cuff links with an engraved Lone Star of Texas (Rangers can buy a more expensive belt buckle set). Their real reward is entree to the White House and the upper levels of the administration.”
10

We have described our reasoning above using the example of lobbyists. The same logic applies as
well for bundling contributions through industry trade associations.
4. Data
The starting point for our data is the universe of firms that are members of the S&P 1500 between
1998 and 2013. Our analysis starts in 1998 because this is the first year lobbying data became publicly
available. We merge eight different databases. We obtain campaign finance data, lobbying data,
contributions to 527 organizations, house and senate committee assignments, CRSP stock returns,
Compustat firm characteristics, and Compustat segment and customer data. The campaign finance data,
lobbying data, and 527 contributions data are from the Center for Responsive Politics’ website
OpenSecrets.org. The house and senate committee assignments are from Charles Stewart III and
Jonathan Woon.10 While the stock return and firm characteristics data from the CRSP and Compustat
databases are standard in the literature, below we describe the political databases.
The campaign finance data come from filings with the Federal Election Commission and the
lobbying data come from filings with the Clerk of the House and the Secretary of the Senate. For both
databases, we obtain the cleaned and parsed version from OpenSecrets.org. Their campaign finance data
cover the election cycles from 1990 to 2014. The database identifies contributions to candidates from
both individuals and corporate PACs. To connect the PAC data with the CRSP and Compustat databases,
we compare the name of the parent organization for each PAC (variable: ultorg) with the historical
company name listed in the CRSP/Compustat combined database. The OpenSecrets.org database does
not contain unique identifiers that follow companies through time. We are hence very careful to take into
account name changes and mergers and acquisitions to correctly match the S&P 1,500 constituents with
data on political activity.
10 Charles Stewart III and Jonathan Woon. Congressional Committee Assignments, 103rd to 112th Congresses, 1993—2011. Downloaded from Stewart’s website at http://web.mit.edu/17.251/www/data_page.html#2.
11

The lobbying data cover election cycles from 1998 to 2014. The database is comprised of
quarterly reports from registered lobbyists or lobbyist firms that identify the clients that hired them, the
parent organization of those clients, the amount that was paid to the lobbying firms by the client, the
names of the specific lobbyists that worked for the firm and the areas of concern to the firm about which
they lobbied. We aggregate these quarterly reports and the amounts paid by a given parent organization
to a given lobbyist firm to an annual, and in some tests, a bi-annual or election cycle level. We identify
whether the lobbying firm is an external firm or whether they are an in-house lobbying arm of the
corporation (e.g., Charles Schwab Government Affairs). We hand-match the lobbying data to our S&P
1,500 universe using the same approach as the approach used for the PAC contributions. Of the firms that
use lobbyists, the average (median) firm employs 3 (2) lobbyists per election cycle and the average
(median) lobbyist firm employed by firms in our sample has 43.6 (20) clients, of which 9.6 (4) are
corporate and 34.0 (15) are non-corporate (unions, political, non-profit, etc.).
Companies can make contributions to any non-candidate or non-party political committee
organized under section 527 of the Internal Revenue Code. Our source for 527 data is OpenSecrets.org,
which has collected data on all contributors to 527 groups and matched them to their ultorg identifier.
Contributions to 527 groups are available from 2002 to 2014. Companies can also make contributions to
Super-PACs or independent expenditure only committees. We obtain such contributions from
OpenSecrets.org.
Corporations belong to various trade associations. Trade associations can be active participants in
the political process and have to file political contributions and lobbying reports like any other
organization. We manually search through the OpenSecrets.org list of entities that participate in the
political process and have at least $1 million of lifetime contributions, and obtain a list of industry trade
associations. We collect PAC contributions, lobbying expenditures, and 527 contributions for those firms.
Corporations can make unlimited payments to trade associations and they are not required to disclose
their contributions to trade associations, nor are trade associations required to disclose their members.
Some of our empirical tests require attributions of the aggregate political expenditures of these trade
12
associations to individual firms. To do so, we assign each trade association to one of the 48 Fama-French
industries (Fama and French (1992)). Then, we calculate the industry market share of each corporation by
dividing the corporation’s sales by the sum of industry sales. In the final step, we multiply the lobbying
expenditures or campaign contributions of a trade association with the industry market share of the
corporation.
We also need to identify those house and senate candidates that are elected and the committee or
leadership assignment during their service to construct the variables of interest in our analysis. We use
the data from Charles Stewart III and Jonathan Woon that covers the 103rd through 112th congresses to
identify these assignments. We hand match the names of senators and representatives from the two
databases to connect the assignments to the candidate contribution data. Because we are interested in
contributions made to elected officials that may be due, in part, to their contemporaneous committee
assignment (i.e. a defense contractor making a contribution to a sitting member of the House Armed
Services committee who is running for re-election), we also match the assignment data to the
contemporaneous election cycles.
Cohen, Coval, and Malloy (2014) show that there exists a surprisingly large number of firms that
rely on the government for a substantial share of their revenue. We hypothesize that business relations
with the U.S. government are an important determinant of a firm’s decision to be politically active. We
follow the method outlined in Cohen, Coval, and Malloy (2014) to calculate the fraction of sales from
government customers and also create an indicator variable equal to one if a corporation has a
government customer. The data used to identify business with the U.S. government are the Compustat
segment files.
For the definition of all other variables and the source of data, please see the variable definitions
in Appendix 1.
4.1 Summary Statistics
13
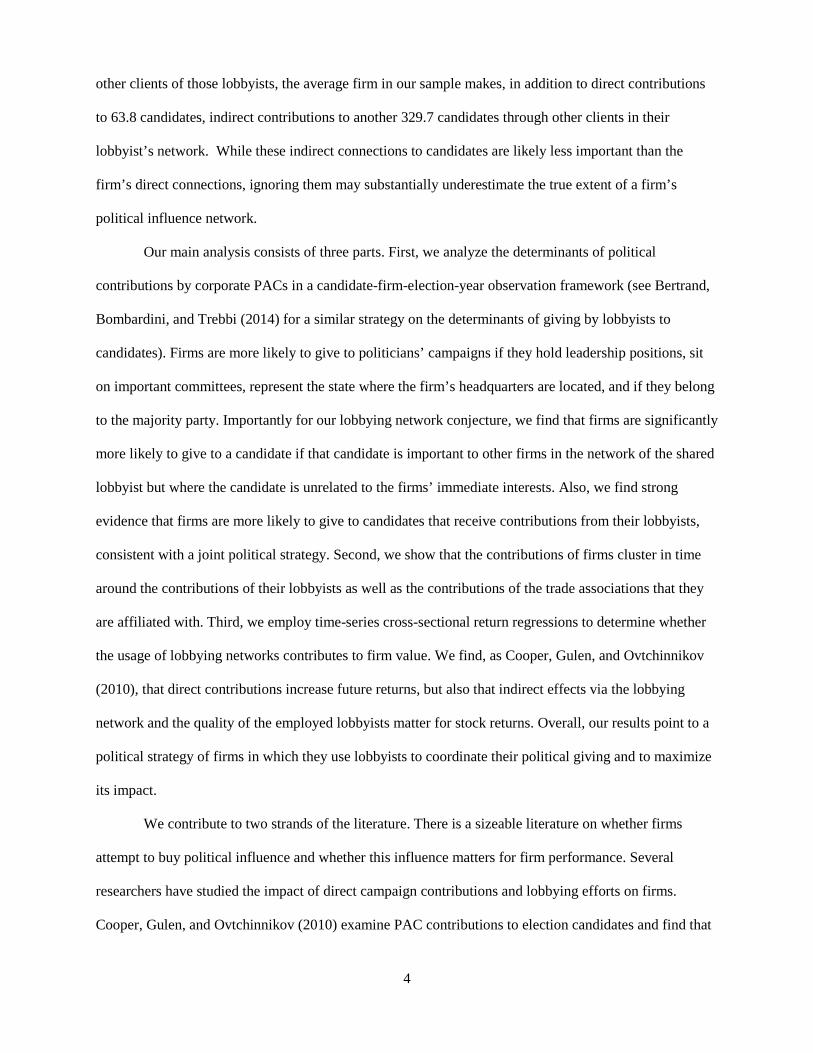
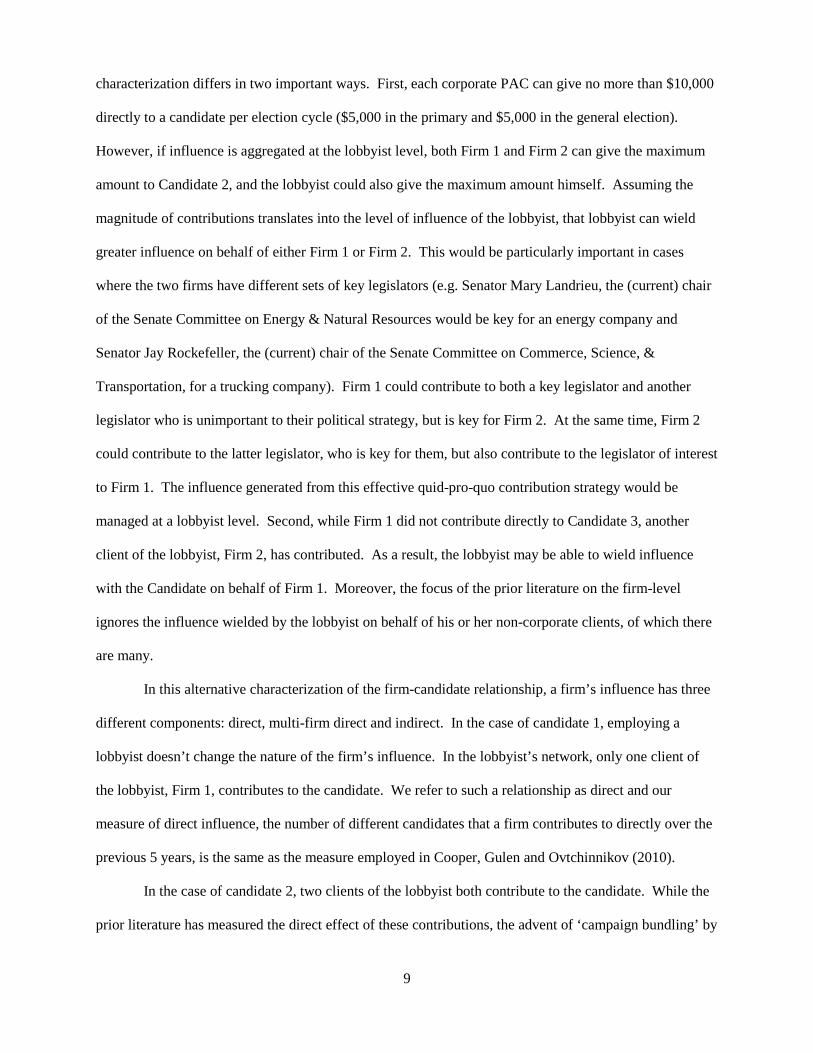
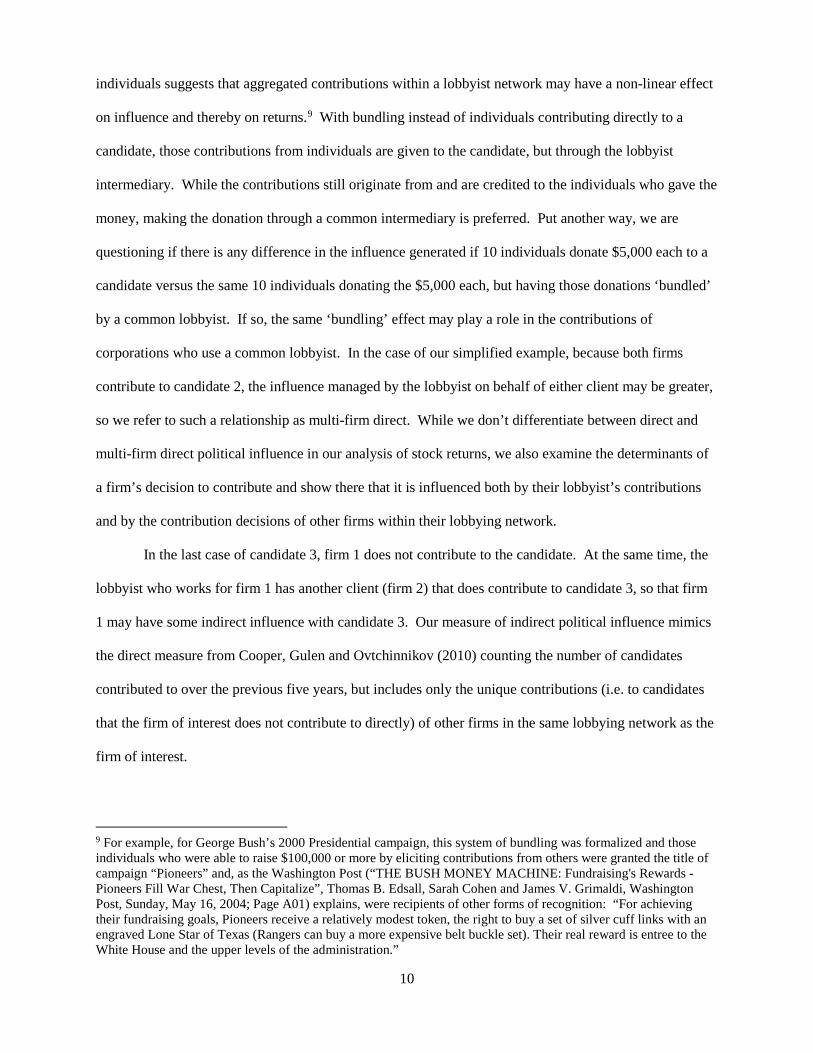
In Figures 3 and 4, we show the fraction of sample firms that use the different methods to participate in
the political process. We show summary statistics for both the entire universe of sample firms and the
larger S&P 500 firms because larger firms tend to be more politically active. Figures 1 and 2 show that
the fraction of S&P 1,500 and S&P 500 firms that participate in the political process is surprisingly stable.
About 45% of S&P 1,500 firms and about 75% of S&P 500 firms show some political activity. The most
common political activity is to hire external lobbying firms to lobby on behalf of the corporation for
specific issues (40% of S&P 1,500 firms and 70% of S&P 500 firms). About 25% of S&P 1,500 firms
and about 55% of S&P 500 firms have their own government affairs office, most often in Washington,
that represents their interests through lobbying. It is interesting to note that external and in-house
lobbying firms appear to be complements, not substitutes. Firms seem to value some services of outside
lobbying firms even if they have their own representation. One of these supplementary services could
potentially be the access to that lobbying firm’s network. Approximately 30% of S&P 1,500 firms and
60% of S&P 500 firms have their own political action committees in which they pool contributions from
employees and which make contributions to the election campaigns of politicians. Interestingly, corporate
contributions to 527 organizations, which are the most likely to be ideological or partisan, are rare. Only
5% of S&P 1,500 firms and 10% of S&P 500 firms contribute to those organizations.
Table 1 shows the overall amounts spent on political activity during our sample. The first six
columns show the dollar amounts spent by corporations, and the latter two columns show the dollar
amounts spent by trade associations. Table 1 shows that most corporate money is spent lobbying.
Lobbying expenditures are an order of magnitude larger than PAC campaign contributions which
themselves are two to three times larger than 527 contributions. In-house lobbying expenditures are
significantly higher than third-party lobbying expenditures. Dollar amounts spent on lobbying have
increased over time. In the later sample years, firms spent a total amount of approximately $1 billion per
year on in-house lobbying and roughly $300 million on external lobbying. Trade associations spent
approximately the same amount as corporations on lobbying activities and campaign contributions. The
contributions of corporate PACs to other political action committees and party committees have steadily
14
increased over time and are in recent years of the same magnitude as direct campaign contributions by
PACs. Contributions to leadership PACs, which have a sponsoring politician, may be one way for a
corporation to establish connections with such politician. Contributions to 527 groups have increased
from 1/3 of corporate PAC contributions to one-half of corporate PAC contributions in election years
after the 2010 U.S. Supreme Court’s Citizens United vs. Federal Election Commission decision 527. The
total amount of corporate donations to 527 independent expenditure only groups is however still
surprisingly low at $32 million during the last presidential elections. Corporate contributions to
independent expenditure only committees (Super-PACs) are surprisingly small at $4.4 million. Contrary
to many predictions after the Citizen’s United ruling, most corporations have been reluctant to make
sizeable contributions to either 527 groups or Super-PACs (see also Bonica (2014)).11
Table 2 shows sample summary statistics for all firm-years, split by firm-years with and without
political activity. The average (median) politically active firm spends about $370,000 and $990,000
($137,000 and $40,000) on in-house and external lobbying, respectively. Average contributions to
corporate PACs amount to $64,000. Our numbers confirm previous findings that the absolute dollar value
of corporate political expenditures is low. The next three rows show the indirect political expenditures of
firms via industry trade associations and lobbying networks. We attribute $1.12 million of the industry
trade associations’ lobbying expenditures to the average politically active firm using the firm’s market
share, and $56,000 of the trade associations’ campaign contributions. These amounts are of the same
magnitude as the direct political expenditures. The indirect campaign contributions of firms to candidates
via their lobbying network are significant at $8.5 million on average (median $119,150). The magnitude
of the indirect contributions and trade association dollars suggests a potential role for them in the political
strategy of firms.
Politically active firms are significantly more likely to be in regulated industries, to have the U.S.
government as a large customer, and also have a higher fraction of their sales coming from the U.S.
11 Many founders or wealthy corporate executives have given sizeable amounts to 527 groups (e.g., Harold Simmons, Sheldon Adelson, Bob Perry, or Larry Ellison). But these contributions came out of their private fortunes, not out of corporate treasuries.
15

government. Politically active firms are larger, more likely to be dividend payer, have lower revenue
growth, more leverage, more PPE / assets, and are more diversified (report more business segments).
4.2 Determinants of Corporate Political Activity
Table 3 shows results of probit regression on the determinants of political activity for our sample.
The dependent variable is equal to one if the firm is politically active, and zero otherwise. The table
reports marginal effects. Firm size, measured as log of total sales, is the most important determinant of
political activity. The table also shows that S&P 500 firms are 20 to 24% (depending on the specification)
more likely to be politically active. Firms in regulated industries (Finance, Utilities, Telecommunication,
Pharma) are between 14 and 20% more likely to be politically active. Firms that do business with the US
government are 40% more likely to be politically active. The coefficients on other control variables
indicate that more mature value firms are more politically active. Those firms have higher leverage, less
revenue growth, lower return on assets, more property, plant, and equipment, more cash, and are more
diversified.
Corporations can lobby either through professional firms or they can decide to have their own
Washington representation. Table 4 shows results of multinomial logit regressions where the dependent
variable is equal to zero if a firm does not lobby, one if a firm lobbies via professional firms, and two if
the firm has its own Washington representation and does lobbying in-house. The first column shows
coefficients for the decision to lobby through professional firms against the decision not to lobby, the
second column shows coefficients for the decision to lobby in-house against the decision not to lobby,
and the third column shows p-values of tests of equality across the coefficients in columns one and two.
Firm size and S&P 500 membership are strong determinants of the in-house lobbying decision. Large
firms and index members are much more likely to lobby in-house. Business relations with the US
government also make it more likely to have an in-house lobbyist. Firms that have a dominant position
within their industry are more likely to lobby via an in-house lobbying firm, as are firms that have lower
16

revenue growth and poorer returns. Interestingly, firm leverage and firm diversification do not play a role
in the decision to lobby in-house but they explain the decision to hire external lobbyists.
5. Results
To assess whether or not lobbyist networks matter and what, if any, impact they have on stock
returns we look first at the determinants of a firm’s decision to contribute to a given candidate, second
analyze whether corporate political contributions cluster in time, and third we extend the performance
analysis of Cooper, Gulen and Ovtchinnikov (2010) by including measures of both direct and indirect
political contributions.
5.1 Determinants of a Firm’s Decision to Contribute to a Candidate
As a first step in assessing the importance of lobbyist networks, we examine the determinants of a
firm’s decision to contribute to a candidate in probit regressions. The analysis in this section is carried
out on the firm-election cycle-candidate level. A firm is included in the sample if its corporate PAC made
contributions to at least one candidate in a given election cycle. For those firms, we examine who of all
possible general election candidates the firm decided to support (dependent variable equal to one) and
who it did not support (dependent variable equal to zero).12 Because the number of candidates in the
election primaries would make the estimation computationally intractable (we analyze every possible
candidate-firm pair), we focus only on those candidates remaining in the general election. We also
exclude candidates that never receive any corporate contributions. The standard errors are clustered on
two dimensions: election cycle and firm-candidate pair.
The independent variables in the regression include the natural log of the firm’s market
capitalization and indicator variables of whether the firm and the candidate both hail from the same state,
whether the candidate belongs to the majority party in the branch of congress (i.e. house or senate) to
12 Our empirical specification is similar to the setup in Bertrand, Bombardini, and Trebbi’s (2012) analysis of all possible lobbyist-legislator pairs.
17
which they are attempting to be elected, whether the candidate is an incumbent, and whether the candidate
is the chair of a standing committee or holds a senate/house leadership position.
Table 5 gives the mean and standard deviation for the variables in this analysis. Firms with active
corporate PACs contributed to the candidate in 9.1% of all firm-candidate-election cycle observations. In
4% of observations the firm’s headquarters are in the same state as the candidate The candidate belongs to
the majority party 51.7% of the time and is the incumbent 67.1% of the time. With respect to leadership,
the candidate is the committee chair in 3.2% of observations and holds a Senate or House leadership
position in 0.9% of observations.
While these variables are important controls to measure a candidate’s effectiveness and influence,
our primary concern in this analysis is whether or not the lobbyist network plays a role in the firm’s
decision to contribute to a given candidate. To assess this, we need to account first for the issues of
concern to the firm and then see if the concerns of other firms in the same lobbyist network also help to
determine the firm’s decision to contribute to a candidate. To measure whether or not the candidate of
interest is directly related to issues of concern to the firm, we first identify whether or not the candidate is
currently a member of a standing committee that is directly related to the interests of the firm. To identify
the committee assignment of an incumbent candidate, we use the Stewart and Woon dataset described in
Section 2. To identify whether or not that committee is of direct interest to the firm, we examine lobbyist
reports for the firm and classify those committees with which the firm has paid lobbyists to interact as
committees of ‘direct interest’ to the firm.
If the lobbyist network plays a role, a firm may contribute, at the direction of their lobbyist, to a
candidate that serves on a committee with which they are not directly concerned, but with which other
clients that share the same lobbyist are concerned. To measure this, we calculate an ‘indirect interest’
variable that is calculated similarly to the ‘direct interest’ variable, but the interest is determined based not
on the firm itself, but rather it is based on the other client firms that share the same lobbyist. If the
interests of clients sharing the same lobbyist play a role in the contribution decision of the firm above and
beyond their own concerns, this would be evidence consistent with the importance of lobbyist networks.
18
Another possible mechanism through which lobbyist networks may affect the decision to
contribute is through the personal connections of the lobbyist. If the lobbyist hired by the firm has
personal connections to certain candidates, this lobbyist might direct the firm to contribute to these
candidates. To measure whether or not such a personal relationship exists, we use the same variable as
Bertrand, Bombardini, and Trebbi (2014), namely we identify the personal contributions of the lobbyists
to candidates. We then include an indicator variable of whether a lobbyist employed by the firm made an
individual contribution to the candidate of interest. For completeness sake we also include an indicator
variable of whether the firm employs a lobbyist. Firms employ lobbyists in 89.4% of all observations,
and lobbyists contribute to candidates in 6.4% of all firm-candidate-election-year observations.
Table 6 contains the results of the probit analysis of a firm’s decision to contribute to a candidate
or not. The coefficients represent the marginal effect of an increase of one unit of the independent
variable of interest, holding all other independent variables constant at their mean values. While
specifications 1 to 3 do not include any fixed effects, specifications 4 to 6 include industry × date (i.e.
election cycle) fixed effects.13
The candidate effectiveness and influence variables have the anticipated signs. Firms are more
likely to give to a candidate if firms are larger, if the candidate is from the same state as the location of
the firm’s headquarter, if the candidate belongs to the majority party, if the candidate is the incumbent,
and if the candidate holds a leadership position. These variables are statistically and economically
significant. For example, if the candidate is from the same state as the firm’s headquarter, the probability
of giving to the candidate in a federal election increases by 11%. If the candidate holds a leadership
position, the probability of support increases by 7-9%.
In specifications 1 through 6 we see that the current committee assignment of the candidate and
whether or not that committee is of direct interest to the firm has a statistically and economically
13 While the use of fixed effects in panel regressions with a continuous dependent variable is common, including fixed effects in a binary response model, such as a probit regression, is subject to the ‘incidental parameters’ problem first discussed by Neyman and Scott (1948). Including fixed effects in such a model can give rise to biased estimates, but Heckman (1981) shows that the estimator performs well for samples with longer time-series (T=8) when no lagged values of the fixed effects variables are included in the estimation.
19
significant impact on the probability that a firm contributes to a candidate. If a candidate is on a
committee of direct concern to the firm, the firm is, depending on the specification, 3.2 to 5% more likely
to contribute to that candidate. Relative to the unconditional probability to contribute of 9.1%, this
number represents an economically meaningful increase in the probability of support of between 35 and
55%.
In specifications 2,3, 5 and 6, we include the lobbyist usage variable, an indicator variable equal
to one if the firm’s lobbyist personally contributed to the candidate, and zero otherwise, and an indicator
variable equal to one if a trade association of the firm’s industry contributed to the candidate. If firms use
lobbyists, they are more likely to give to candidates, which is consistent with them having a broadly
defined political strategy. Interestingly, the indicator variable for whether the lobbyist contributed to the
candidate is strongly statistically significant and economically large. If the lobbyist contributes to a
candidate, the probability that the firm contributes increases by approximately 7%. Hence, it almost
doubles the unconditional probability that a firm contributes to a candidate in an election if the lobbyist
contributes, too. If an industry trade association contributed to the candidate, the probability of the firm
contributing increases by a statistically and economically significant 5%. Both results are consistent with
a coordinated effort between lobbyists, trade associations, and firms.
In specifications 3 and 6, we also include our indirect measure of issues of concern to the firm.
This variable captures whether or not the candidate is a member of a committee of interest to other firms
in the same lobbyist network as the firm of interest. The ‘Committee of Indirect Interest’ variable is
statistically significant in both specifications and more significant when industry-fixed effects are
included. The results are consistent with the importance of lobbyist networks. If a candidate is of interest
to other firms of the lobbying network, a firm is approximately 0.6% to 0.9% more likely to give to the
candidate. Relative to the unconditional probability of supporting a candidate (9.1%), this corresponds to
an increase in the probability of support of 6-10%. We can compare the indirect effect (0.6%-0.9%
increase) with the direct effect which is approximately 5 times larger (3.2%-5% increase). The magnitude
of the difference seems economically plausible. Firms are more likely to give to their own candidates, but
20
they recognize the importance of giving to other firms in the network. Hence, our evidence shows that
contributions from clients within the same lobbyist network seem to be mutually supportive. Given the
contribution limit of $5,000 in the general election, a given firm may max out in what they give to the
candidates of greatest influence and importance to their interests. However, if two clients of the same
lobbyist had different key legislators, they could contribute the maximum to their key legislator and to the
key legislator for the other firm. Coordination through the lobbyist network and aggregation of the
influence at a lobbyist level would enable them to effectively double their contributions.
Overall, the evidence in Table 6 is consistent with firms having a political strategy, using
lobbyists and trade associations to coordinate their political contributions, and strategically helping other
firms in the same lobbying network.
5.2 Clustering of corporate contributions and contributions by lobbyists and trade associations
The evidence in Table 6 shows that corporations are more likely to give to candidates if affiliated trade
associations and external lobbying firms support the candidate as well. We now examine whether the
contributions of corporate PACs and trade associations cluster in time. The idea behind this test is that
lobbyists or trade associations may have easier access to politicians if they represent many corporate
clients. One way to demonstrate this is to coordinate with lobby network firms or trade association
member firms and to coordinate contributions. We carry out the following test. We benchmark corporate
giving on the personal contribution of a lobbyist or the campaign contribution of a trade association to a
given candidate. We then calculate, for each corporate PAC that makes a contribution to the same
candidate, the absolute value of the difference in time between the corporate contribution and the lobbyist
or trade association contribution. We compare this difference with the average and median absolute
distance for all other non-corporate contributions to the candidate. We find evidence for clustering in
time. Corporate PAC contributions are closer in time to contributions of affiliated trade associations and
lobbyists than contributions from unaffiliated entities or individuals.
21
5.3 Past Firm Contributions and Future Stock Return Performance
We follow the methodology of Cooper, Gulen, and Ovtchinnikov (2010), and conduct panel (cross-
sectional time series) regressions of annual abnormal stock return on the political activity of firms through
the direct channel and additional firm characteristics. In addition, we also include our indirect
contribution channel in the analysis to compare the benefits of both channels to firm equity-holders.
To conduct the analysis, we calculate a firm’s abnormal return in year t as the difference in
monthly total returns compounded from November of year t to October of year t+1, and the total market’s
annual return in the same period.
Firm level controls include the firm characteristics that have been identified in the literature as
important predictors of firm stock returns (see, e.g., Fama and French (1992) and Jegadeesh and Titman
(1993)). These include firm size, a firm’s book value of equity to market value of equity ratio, and firm
buy-and-hold returns for the last year. Firm size is calculated as the product of the closing prices of a
security in the month of October and the number of shares outstanding. Firm book value of equity is
calculated as stockholder’s book equity, plus deferred taxes and investment credit minus book value of
preferred stock. This is the definition from Davis, Fama, and French (2000). Market value of equity is the
closing share price multiplied by shares outstanding at the end of the calendar year.
In addition to the above controls, it is important to address a potential selection bias. Firms
choose to participate in the political process, and it is conceivable that this choice depends on potentially
unobservable characteristics of the firm that also influence future returns. Hence, we utilize a two-step
process as in Heckman (1979), where the first stage calculates the likelihood for a firm to participate in
political activity, and the second stage estimates the abnormal returns from political activity controlling
for selection bias introduced by the endogenous choice of the firm to participate. The exact control of the
selection bias is achieved using the inverse Mills ratio, which is calculated from the estimated probability
of a firm participating in the first stage. We use the specification of Table 4, column (4) as our first stage
determining a corporation’s political activity.
22

Table 7 reports the results of the second stage, where we estimate the abnormal return to a firm’s
political activity controlling for firm characteristics and selection bias. Column (1) confirms the findings
of Cooper, Gulen, and Ovtchinnikov (2010) that firms that contribute to political candidates enjoy a
higher abnormal return in the year after the elections. Column (2) includes an indicator variable equal to
one if the firm employs a lobbyist and zero otherwise, and the indirect contributions to candidates (the
count measure of candidates receiving contributions from other corporate clients that share a lobbyist with
the firm, but to whom the firm itself does not directly contribute). We find that these two variables are
economically and statistically significant. Column (3) adds back the direct contribution measure, and
shows that the indirect channel remains separately important in explaining abnormal returns. Column (3)
shows that for a 1% increase from the mean in terms of the indirect contribution to candidate measure, the
annual abnormal returns increase by 0.51%. This is a statistically and economically significant return.
Columns (4) and (5) include value-weighted and equal-weighted lobbyist compensation as additional
variables to capture the quality of the lobbyists. To calculate these lobbyist compensation measures, we
calculate the number of lobbyists from each lobby firm hired by the corporation (the names of each
lobbyist actively engaged in lobbying for the corporation are identified the lobbying disclosure filings),
the total compensation paid to the lobbying firm, and the average compensation paid per lobbyist as the
ratio of the two. Blanes I Vidal, Draca, and Fons-Rosen (2012) show that this compensation is a proxy
for the value, skill or quality of the lobbyist.
The quality of the lobbyist seems important. Hiring higher quality lobbyists is associated with
significantly higher returns. The indirect channel remains robust to these additional controls, even though
the direct contribution channel becomes statistically insignificant. The inverse Mill’s ratio is statistically
significantly negative in all regressions. The results indicate that the unobserved variables that have a
positive impact on the decision to be politically active are negatively related to future firm returns. It is
easy to think about some of those variables (e.g., concerns about future legislation, break-up of
monopolies or oligopolies, or reduction of tariffs).
23
As a robustness test, we also calculate abnormal stock returns using monthly benchmark returns
from Daniel, Grinblatt, Titman and Wermers (1997), and Wermers (2004). The impact of our mechanism,
i.e. the indirect contribution channel, remains robust, and is statistically and economically significant with
similar magnitudes.
6. Conclusion
We construct a database that enables us to track the corporate network of lobbyists and trade
associations and to link lobbying expenditures and contributions to political campaigns. We establish the
link via the issues on which firms lobby (disclosed in lobbying reports) and the committee assignments of
politicians whose campaigns were supported. We show that firms that share the same lobbyist seem to
coordinate their political spending. Firms are more likely to give to candidates whose assigned committee
regulates their industry, but they are also more likely to give to candidates whose assigned committee
does not regulate their industry, but regulates the industry of another firm that shares the same lobbyist.
These indirect additional expenditures and the quality of the employed lobbying firm are positively
correlated with future stock returns.
24
References: Adelino, M., and S. Dinc, 2014, Corporate distress and lobbying: Evidence from the Stimulus Act, Journal of Financial Economics 114, 256-272. Ansolabehere, S., J. M. Snyder Jr., and M. Tripathi, 2002, Are PAC contributions and lobbying linked? New evidence from the 1995 Lobby Disclosure Act, Business and Politics 4, 131-155. Ansolabehere, S., J. M. de Figueiredo, and J. M. Snyder Jr., 2003, Why is there so little money in US politics? Journal of Economic Perspectives 17, 105-130. Bebchuk, L. A., and R. J. Jackson, Jr., 2013, Shining light on corporate political spending, The Georgetown Law Journal 101, April 2013, 923-967. Bertrand, M., M. Bombardini, and F. Trebbi, 2014, Is it whom you know or what you know? An empirical assessment of the lobbying process, American Economic Review 104, 3885-3920. Blanes I Vidal, J., M. Draca, and C. Fons-Rosen, 2012, Revolving door lobbyists, American Economic Review 102, 3731-3748. Bonica, A., 2014, Avenues of influence: On the political expenditures of corporations and their directors and executives, working paper, Stanford University. Chen, H., D. Parsley, and Y. Yang, 2014, Corporate lobbying and financial performance, forthcoming, Journal of Business, Finance, and Accounting. Claessens, S., E. Feijen, and L. Laeven, 2008, Political connections and preferential access to finance: The role of campaign contributions, Journal of Financial Economics 88, 554-580. Cooper, M., H. Gulen, and A. Ovtchinnikov, 2010, Corporate political contributions and stock returns, Journal of Finance 65, 687-724. Cohen, L., J. Coval, and C. Malloy, 2014, Mini West Virginias: Corporations as government dependents, working paper, Harvard Business School. Daniel, K, M. Grinblatt, S. Titman, and R. Wermers, 1997, Measuring mutual fund performance with characteristic-based benchmarks, Journal of Finance 52, 1-33. Davis, J.L., E.F. Fama, and K.R. French, 2000, Characteristics, covariances, and average returns: 1929 to 1997, Journal of Finance 55, 389-406. De Figueiredo, J. M., and B. Kelleher Richter, 2014, Advancing the empirical research on lobbying, Annual Review of Political Science 17, 163-185. Faccio, M., 2006, Politically connected firms, American Economic Review 96, 369-385. Faccio, M., R. Masulis, and J. McConnell, 2006, Political connections and corporate bailouts, Journal of Finance 61, 2597-2635. Fama, E., and K. French, 1992, The cross-section of expected stock returns, Journal of Finance 47, 427-465.
25
Fisman, R., 2001, Estimating the value of political connections, American Economic Review 91, 1095-1102. Goldman, E., J. So, and J. Rocholl, 2013, Politically connected boards of directors and the allocation of procurement contracts, Review of Finance 17, 1617-1648. Heckman, J.J., 1979, Sample selection bias as a specification error, Econometrica 47, 153-161. Heckman, J.J., 1981, "The Incidental Parameters Problem and the Problem of Initial Conditions in Estimating a Discrete Time-Discrete Data Stochastic Process" in C. Manski and D. McFadden, eds., Structural Analysis of Discrete Data with Econometric Applications, MIT Press, 179-195. Hill, M., G. Kelly, G. Lockhart, and R. Van Ness, 2013, Determinants and effects of corporate lobbying, Financial Management 42, 931-957. Jegadeesh, N., and S. Titman, 1993, Returns to buying winners and selling losers: Implications for stock market efficiency, Journal of Finance 48, 65-91. Lake, J., 2014, Revisiting the link between PAC contributions and lobbying expenditures, working paper, Southern Methodist University. Neyman, J. and E. Scott, 1948, Consistent estimates based on partially consistent observations, Econometrica 16, 1-32. Tullock, G., 1972, The purchase of politicians, Western Economic Journal 10, 354-355. Wermers, R., 2004, Is money really 'smart'? New evidence on the relation between mutual fund flows, manager behavior, and performance persistence, working paper, University of Maryland.
26
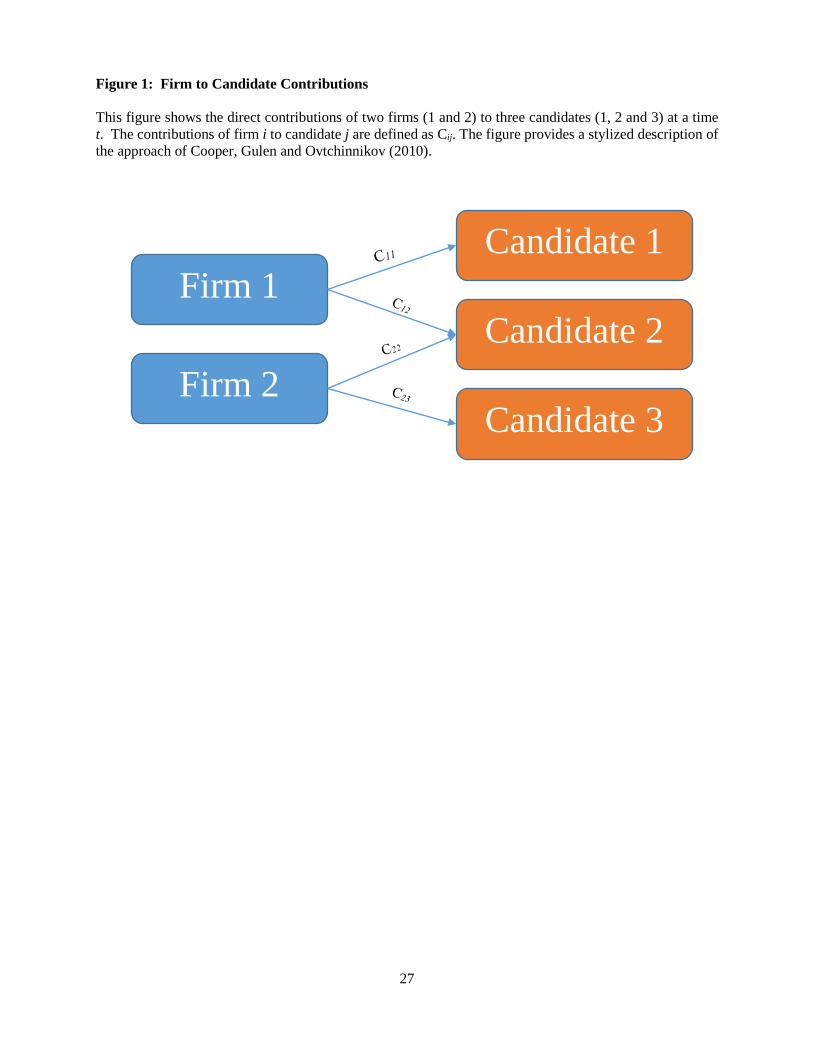
Figure 1: Firm to Candidate Contributions This figure shows the direct contributions of two firms (1 and 2) to three candidates (1, 2 and 3) at a time t. The contributions of firm i to candidate j are defined as Cij. The figure provides a stylized description of the approach of Cooper, Gulen and Ovtchinnikov (2010).
Candidate 1
Candidate 2
Candidate 3
Firm 2
Firm 1
27

Figure 2: Firm to Candidate Contributions through a Lobbyist Network This figure provides a stylized description of the relationship of interest in our paper, where lobbyists may play an important part in the firm’s political contribution and influence strategy. The contributions of firm i to candidate j are defined as Cij. The figure displays the same contributions by the same firms (1 and 2) to the same candidates (1, 2 and 3) as in Fig. 1. However, there is a common lobbyist employed by both firms 1 and 2, who helps to intermediate governmental relations for both firms. As a result, the contributions to each candidate (Cij) still originate from the firm, but the influence wielded on their behalf is managed by the lobbyist.
Candidate 1
Candidate 2
Candidate 3 Firm 2
Firm 1 C12 + C22 Lobbyist
28
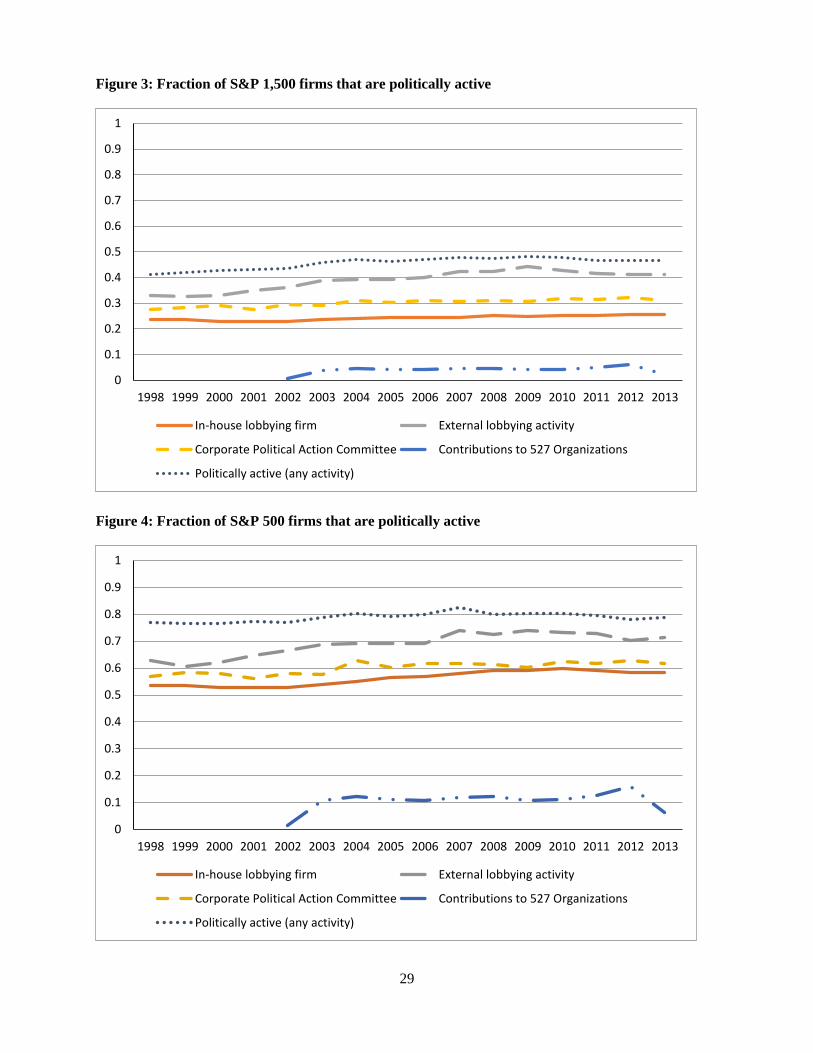
Figure 3: Fraction of S&P 1,500 firms that are politically active
Figure 4: Fraction of S&P 500 firms that are politically active
0
0.1
0.2
0.3
0.4
0.5
0.6
0.7
0.8
0.9
1
1998 1999 2000 2001 2002 2003 2004 2005 2006 2007 2008 2009 2010 2011 2012 2013
In-house lobbying firm External lobbying activity
Corporate Political Action Committee Contributions to 527 Organizations
Politically active (any activity)
0
0.1
0.2
0.3
0.4
0.5
0.6
0.7
0.8
0.9
1
1998 1999 2000 2001 2002 2003 2004 2005 2006 2007 2008 2009 2010 2011 2012 2013
In-house lobbying firm External lobbying activity
Corporate Political Action Committee Contributions to 527 Organizations
Politically active (any activity)
29

Table 1: Aggregated political expenditures by sample firms and trade associations The table shows total dollar spent by sample firms and industry trade associations on politics. The sample consists of all corporations that were constituents of the S&P 1,500 between 1998 and 2013. The table also shows the political expenditures of all trade organizations on the opensecrets.org database which had lifetime contributions in excess of $1 million. In-house lobbying characterizes lobbying expenditures through a firm’s own representation in Washington. External lobbying are the expenditures for third-party, professional lobbying firms. PACs to candidates means campaign contributions via corporate political action committees to candidates running for federal office. PACs to others means contributions to leadership PACs, party committees, or other corporate PACs. 527 groups are the contributions of firms to any non-candidate or non-party political committee organized under section 527 of the Internal Revenue Code.
Corporate political spending ($ millions)
Trade association political spending ($
millions)
year In-house lobbying
External lobbying
PACs to candidates
PACs to
others 527
groups Super-PACs
Lobbying
PACs
1998 467.23 138.54 32.82 12.9 377.45 11.38 1999 418.33 156.33 21.49 15.1 409.98 23.20 2000 445.49 159.81 39.63 18.6 445.94 9.63 2001 429.87 176.41 23.09 16.4 444.60 16.48 2002 474.63 195.17 44.98 21.6 1.53 500.43 21.99 2003 512.93 225.65 29.61 26.1 11.49 524.49 19.82 2004 544.38 249.60 48.74 37.6 17.75 559.47 26.40 2005 573.51 262.37 33.46 37.8 11.47 592.45 22.86 2006 646.48 277.23 53.28 44.9 17.33 783.84 47.57 2007 713.44 305.68 40.21 37.1 16.40 877.98 39.11 2008 884.69 313.49 58.42 46.3 22.90 982.47 57.38 2009 931.94 321.57 39.92 37.2 16.93 1105.08 41.11 2010 982.37 333.36 65.19 44.9 34.47 1169.49 93.74 2011 942.73 335.98 45.73 47.0 22.07 1108.62 45.80 2012 937.57 309.12 72.71 70.7 36.13 4.4 1208.93 87.52 2013 938.92 304.08 52.43 47.8 16.91 1189.58 50.74
30

Table 2: Summary statistics
The table reports summary statistics for variables measuring corporate political activity and firm characteristics. Columns (1) through (3) report mean, median, and standard deviation for firm-years without political activity, and columns (4) through (6) report the same statistics for firms with political activity. A firm is politically active in a given firm-year if a firm has either in-house lobbying firm expenditure, third-party lobbying firm expenditures, makes campaign contributions via corporate political action committees, or supports 527 groups. Variable definitions can be found in Appendix A.
No political activity Politically active
Mean Median Stdev Mean Median Stdev
In-house lobbying (yes/no) 53.2% 49.9%
Third-party lobbying (yes/no) 85.2% 35.5%
Corporate PAC (yes/no) 66.1% 47.3%
Contribution to 527 groups (yes/no) 6.6% 24.8%
In-house lobbying ($) $371,076 $137,000 $765,713
Third-party lobbying ($) $990,094 $40,000 $2,397,111
Corporate PAC ($) $64,066 $13,000 $141,488
Contribution to 527 groups ($) $3,396 $0 $100,635
Imputed amount of trade association lobbying $1,121,227 $283,180 $3,145,667
Imputed amount of trade association PACs $56,123 $7,442.58 $226,446
Indirect PAC contrib. via connected lobbyists $8,417,162 $119,150 $21,130,000
Regulated Industry (yes/no) 0.23 0.00 0.42 0.31 0.00 0.46
US Gov. is large customer (yes/no) 0.03 0.00 0.18 0.11 0.00 0.32
US Gov. sales / total sales 0.01 0.00 0.06 0.04 0.00 0.14
Total revenue ($million) $1,762.97 $773.25 $3,824.34 $10,291.45 $3,934.63 $17,187.75
SP 500 member (yes/no) 13% 34% 58% 49%
Dividend payer (yes/no) 51% 50% 68% 47%
Asset growth 11.0% 6.6% 24.5% 10.6% 5.8% 24.4%
Revenue growth 9.5% 7.4% 22.2% 8.9% 6.6% 21.6%
Return on assets 13.6% 13.0% 10.0% 13.7% 12.7% 8.6%
Leverage 0.20 0.17 0.18 0.25 0.24 0.17
Property, Plant, and Equipment / Assets 0.24 0.17 0.23 0.28 0.20 0.24
Cash and ST investments / Assets 0.15 0.08 0.17 0.12 0.06 0.14
R&D expenditures / Assets 0.03 0.00 0.05 0.02 0.00 0.04
Advertising expenditures / Assets 0.01 0.00 0.03 0.01 0.00 0.03
Book-to-market ratio 0.59 0.51 0.41 0.57 0.48 0.42
Herfindahl index 0.05 0.04 0.06 0.06 0.04 0.07
Number of business segments 2.09 1 1.43 2.76 3 1.82
31
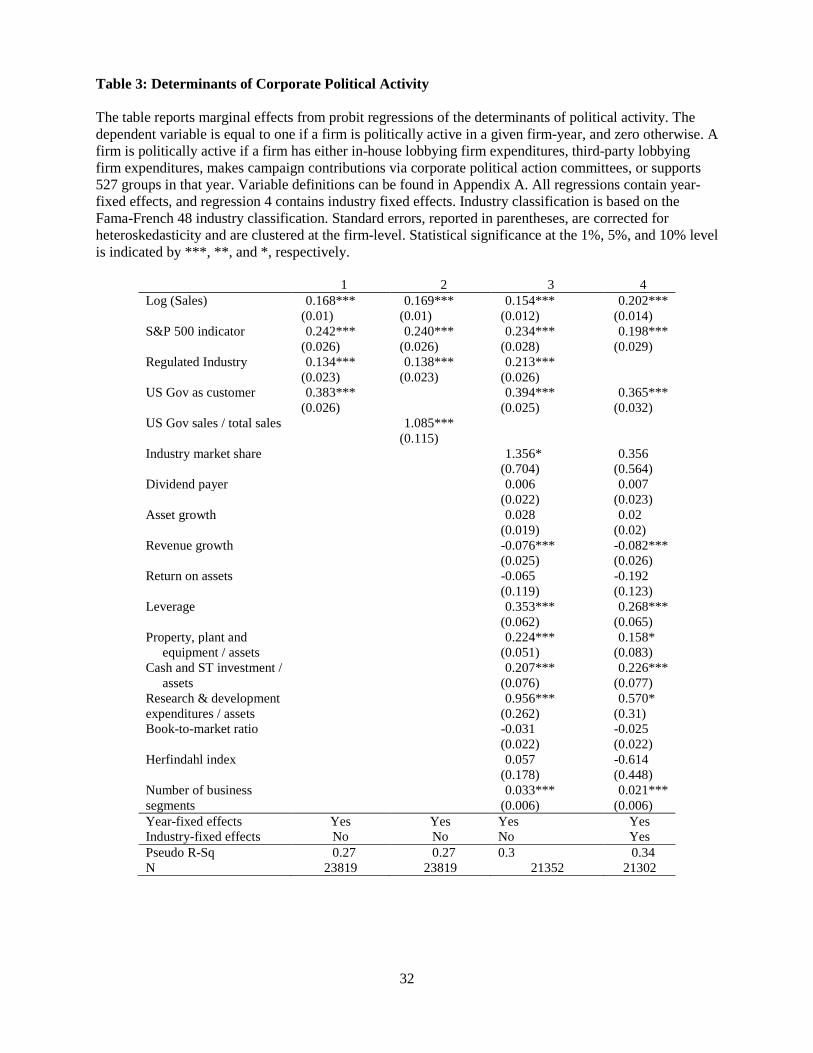
Table 3: Determinants of Corporate Political Activity
The table reports marginal effects from probit regressions of the determinants of political activity. The dependent variable is equal to one if a firm is politically active in a given firm-year, and zero otherwise. A firm is politically active if a firm has either in-house lobbying firm expenditures, third-party lobbying firm expenditures, makes campaign contributions via corporate political action committees, or supports 527 groups in that year. Variable definitions can be found in Appendix A. All regressions contain year-fixed effects, and regression 4 contains industry fixed effects. Industry classification is based on the Fama-French 48 industry classification. Standard errors, reported in parentheses, are corrected for heteroskedasticity and are clustered at the firm-level. Statistical significance at the 1%, 5%, and 10% level is indicated by ***, **, and *, respectively.
1 2 3 4 Log (Sales) 0.168*** 0.169*** 0.154*** 0.202*** (0.01) (0.01) (0.012) (0.014) S&P 500 indicator 0.242*** 0.240*** 0.234*** 0.198*** (0.026) (0.026) (0.028) (0.029) Regulated Industry 0.134*** 0.138*** 0.213*** (0.023) (0.023) (0.026) US Gov as customer 0.383*** 0.394*** 0.365*** (0.026) (0.025) (0.032) US Gov sales / total sales 1.085*** (0.115) Industry market share 1.356* 0.356 (0.704) (0.564) Dividend payer 0.006 0.007 (0.022) (0.023) Asset growth 0.028 0.02 (0.019) (0.02) Revenue growth -0.076*** -0.082*** (0.025) (0.026) Return on assets -0.065 -0.192 (0.119) (0.123) Leverage 0.353*** 0.268*** (0.062) (0.065) Property, plant and 0.224*** 0.158* equipment / assets (0.051) (0.083) Cash and ST investment / 0.207*** 0.226*** assets (0.076) (0.077) Research & development 0.956*** 0.570* expenditures / assets (0.262) (0.31) Book-to-market ratio -0.031 -0.025 (0.022) (0.022) Herfindahl index 0.057 -0.614 (0.178) (0.448) Number of business 0.033*** 0.021*** segments (0.006) (0.006) Year-fixed effects Yes Yes Yes Yes Industry-fixed effects No No No Yes Pseudo R-Sq 0.27 0.27 0.3 0.34 N 23819 23819 21352 21302
32

Table 4: In-house vs. External Lobbying
The table reports results from a multinomial logit regression of the determinants of lobbying expenditures. The dependent variable is equal to zero if a firm does not lobby in a given year, one if a firm hires an external lobbying firm, and 2 if a firm has an in-house lobbying firm. Coefficients in column 1 (column 2) are changes in the odds ratio of external lobbying expenditures vs. no lobbying expenditures (in-house lobbying expenditures vs. no lobbying expenditures). Column 3 contains the p-values of a chi-square test of statistical equality of the odds ratios in columns 1 and 2. Variable definitions can be found in Appendix A. The regression contains year and industry fixed effects. Industry classification is based on the Fama-French 48 industry classification. Standard errors, reported in parentheses, are corrected for heteroskedasticity and are clustered at the firm-level. Statistical significance at the 1%, 5%, and 10% level is indicated by ***, **, and *, respectively.
External lobbying vs. no lobbying
In-house lobbying vs. no lobbying
Test of equality external vs in-house
Log (Sales) 0.545*** 1.32*** 0.000*** (0.062) (0.09) S&P 500 indicator 0.425*** 1.25*** 0.000*** (0.135) (0.16) US Gov as customer 1.480*** 2.68*** 0.000*** (0.211) (0.29) Industry market share -1.928 4.77 0.033** (2.599) (3.66) Dividend payer -0.014 -0.04 0.87 (0.097) (0.15) Asset growth 0.053 0.26** 0.070* (0.094) (0.11) Revenue growth -0.259** -0.67*** 0.008*** (0.121) (0.15) Return on assets 0.094 -2.27*** 0.002*** (0.553) (0.78) Leverage 1.306*** 0.41 0.02** (0.273) (0.40) Property, plant and -0.081 1.59*** 0.001*** equipment / assets (0.350) (0.52) Cash and ST investment / 0.849** 1.03*** 0.683 assets (0.344) (0.45) Research & development 0.435 5.11*** 0.019** expenditures / assets (1.408) (1.97) Book-to-market ratio -0.128 -0.06 0.625 (0.108) (0.13) Herfindahl index -2.401 -5.21* 0.408 (2.197) (3.08) Number of business 0.067** 0.12 0.156 segments (0.029) 0.04 Year-fixed effects Yes Yes Industry-fixed effects Yes No
33
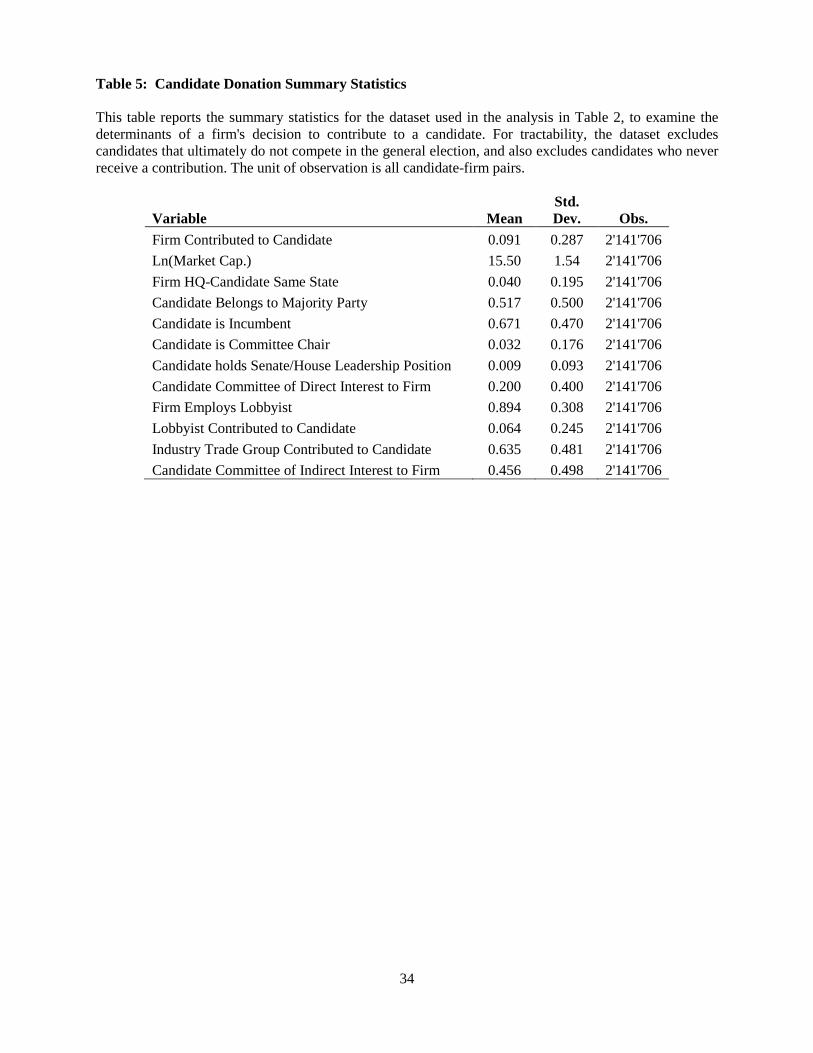
Table 5: Candidate Donation Summary Statistics This table reports the summary statistics for the dataset used in the analysis in Table 2, to examine the determinants of a firm's decision to contribute to a candidate. For tractability, the dataset excludes candidates that ultimately do not compete in the general election, and also excludes candidates who never receive a contribution. The unit of observation is all candidate-firm pairs.
Variable Mean Std. Dev. Obs.
Firm Contributed to Candidate 0.091 0.287 2'141'706 Ln(Market Cap.) 15.50 1.54 2'141'706 Firm HQ-Candidate Same State 0.040 0.195 2'141'706 Candidate Belongs to Majority Party 0.517 0.500 2'141'706 Candidate is Incumbent 0.671 0.470 2'141'706 Candidate is Committee Chair 0.032 0.176 2'141'706 Candidate holds Senate/House Leadership Position 0.009 0.093 2'141'706 Candidate Committee of Direct Interest to Firm 0.200 0.400 2'141'706 Firm Employs Lobbyist 0.894 0.308 2'141'706 Lobbyist Contributed to Candidate 0.064 0.245 2'141'706 Industry Trade Group Contributed to Candidate 0.635 0.481 2'141'706 Candidate Committee of Indirect Interest to Firm 0.456 0.498 2'141'706
34
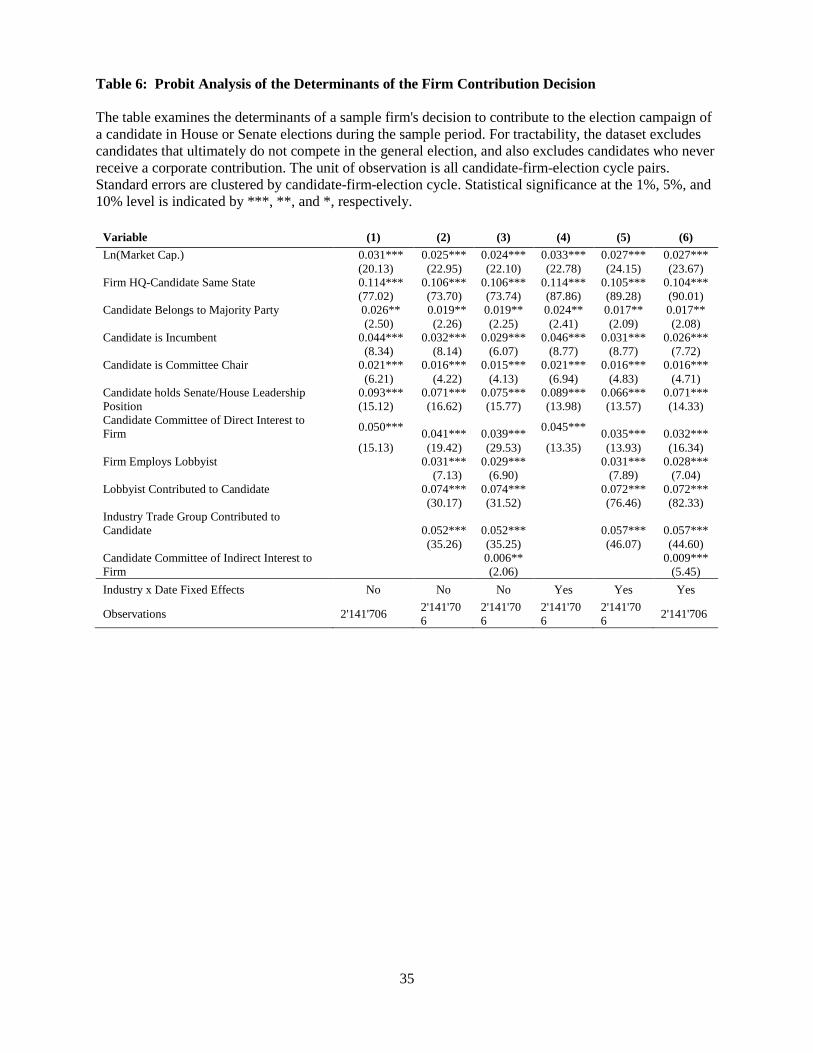
Table 6: Probit Analysis of the Determinants of the Firm Contribution Decision The table examines the determinants of a sample firm's decision to contribute to the election campaign of a candidate in House or Senate elections during the sample period. For tractability, the dataset excludes candidates that ultimately do not compete in the general election, and also excludes candidates who never receive a corporate contribution. The unit of observation is all candidate-firm-election cycle pairs. Standard errors are clustered by candidate-firm-election cycle. Statistical significance at the 1%, 5%, and 10% level is indicated by ***, **, and *, respectively.
Variable (1) (2) (3) (4) (5) (6) Ln(Market Cap.) 0.031*** 0.025*** 0.024*** 0.033*** 0.027*** 0.027*** (20.13) (22.95) (22.10) (22.78) (24.15) (23.67) Firm HQ-Candidate Same State 0.114*** 0.106*** 0.106*** 0.114*** 0.105*** 0.104*** (77.02) (73.70) (73.74) (87.86) (89.28) (90.01) Candidate Belongs to Majority Party 0.026** 0.019** 0.019** 0.024** 0.017** 0.017** (2.50) (2.26) (2.25) (2.41) (2.09) (2.08) Candidate is Incumbent 0.044*** 0.032*** 0.029*** 0.046*** 0.031*** 0.026*** (8.34) (8.14) (6.07) (8.77) (8.77) (7.72) Candidate is Committee Chair 0.021*** 0.016*** 0.015*** 0.021*** 0.016*** 0.016*** (6.21) (4.22) (4.13) (6.94) (4.83) (4.71) Candidate holds Senate/House Leadership 0.093*** 0.071*** 0.075*** 0.089*** 0.066*** 0.071*** Position (15.12) (16.62) (15.77) (13.98) (13.57) (14.33) Candidate Committee of Direct Interest to Firm 0.050*** 0.041*** 0.039*** 0.045*** 0.035*** 0.032*** (15.13) (19.42) (29.53) (13.35) (13.93) (16.34) Firm Employs Lobbyist 0.031*** 0.029*** 0.031*** 0.028*** (7.13) (6.90) (7.89) (7.04) Lobbyist Contributed to Candidate 0.074*** 0.074*** 0.072*** 0.072*** (30.17) (31.52) (76.46) (82.33) Industry Trade Group Contributed to Candidate 0.052*** 0.052*** 0.057*** 0.057*** (35.26) (35.25) (46.07) (44.60) Candidate Committee of Indirect Interest to 0.006** 0.009*** Firm (2.06) (5.45) Industry x Date Fixed Effects No No No Yes Yes Yes
Observations 2'141'706 2'141'706
2'141'706
2'141'706
2'141'706 2'141'706
35
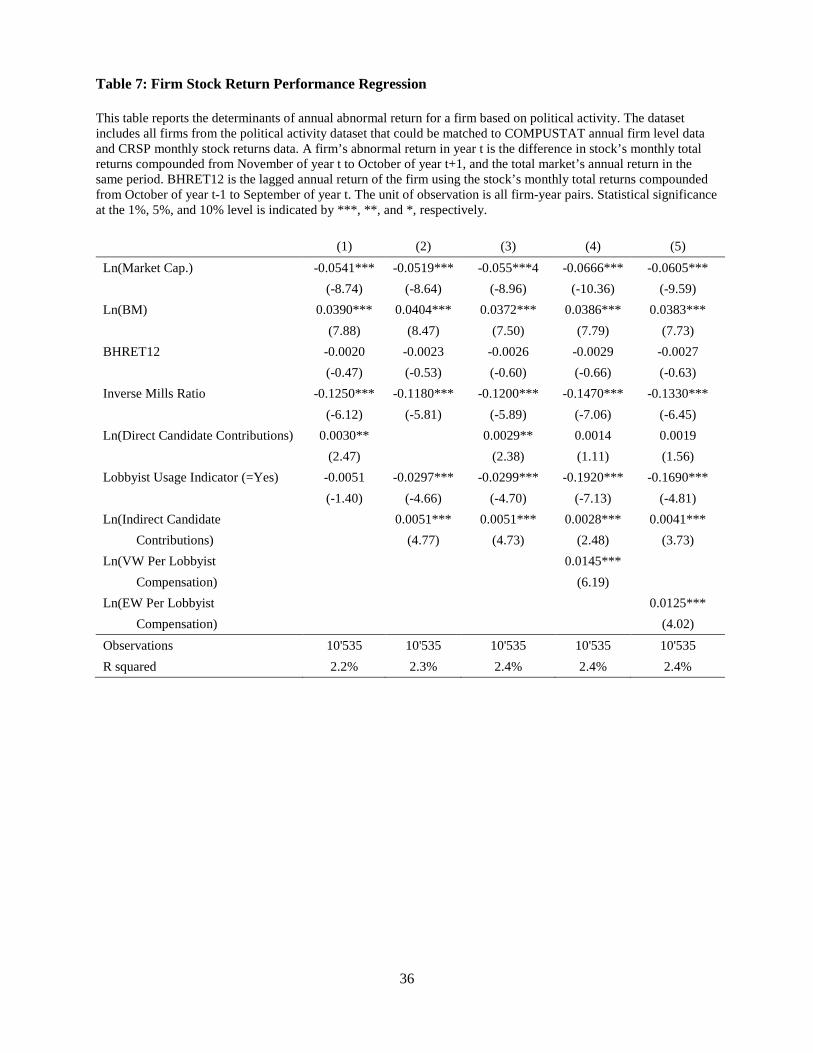
Table 7: Firm Stock Return Performance Regression This table reports the determinants of annual abnormal return for a firm based on political activity. The dataset includes all firms from the political activity dataset that could be matched to COMPUSTAT annual firm level data and CRSP monthly stock returns data. A firm’s abnormal return in year t is the difference in stock’s monthly total returns compounded from November of year t to October of year t+1, and the total market’s annual return in the same period. BHRET12 is the lagged annual return of the firm using the stock’s monthly total returns compounded from October of year t-1 to September of year t. The unit of observation is all firm-year pairs. Statistical significance at the 1%, 5%, and 10% level is indicated by ***, **, and *, respectively.
(1) (2) (3) (4) (5) Ln(Market Cap.) -0.0541*** -0.0519*** -0.055***4 -0.0666*** -0.0605*** (-8.74) (-8.64) (-8.96) (-10.36) (-9.59) Ln(BM) 0.0390*** 0.0404*** 0.0372*** 0.0386*** 0.0383*** (7.88) (8.47) (7.50) (7.79) (7.73) BHRET12 -0.0020 -0.0023 -0.0026 -0.0029 -0.0027 (-0.47) (-0.53) (-0.60) (-0.66) (-0.63) Inverse Mills Ratio -0.1250*** -0.1180*** -0.1200*** -0.1470*** -0.1330*** (-6.12) (-5.81) (-5.89) (-7.06) (-6.45) Ln(Direct Candidate Contributions) 0.0030** 0.0029** 0.0014 0.0019 (2.47) (2.38) (1.11) (1.56) Lobbyist Usage Indicator (=Yes) -0.0051 -0.0297*** -0.0299*** -0.1920*** -0.1690*** (-1.40) (-4.66) (-4.70) (-7.13) (-4.81) Ln(Indirect Candidate 0.0051*** 0.0051*** 0.0028*** 0.0041*** Contributions) (4.77) (4.73) (2.48) (3.73) Ln(VW Per Lobbyist 0.0145*** Compensation) (6.19) Ln(EW Per Lobbyist 0.0125*** Compensation) (4.02) Observations 10'535 10'535 10'535 10'535 10'535 R squared 2.2% 2.3% 2.4% 2.4% 2.4%
36