political attitudes, social capital, and … political attitudes, social capital, and political...
TRANSCRIPT

POLITICAL ATTITUDES, SOCIAL CAPITAL,
AND POLITICAL PARTICIPATION:
THE UNITED STATES AND MEXICO COMPARED
Joseph L. Klesner
Department of Political Science Kenyon College
Gambier, Ohio 43022
TEL: 1-740-427-2274 FAX: 1-740-427-5306
June 7, 2001

1
Political Attitudes, Social Capital, and Political Participation:
The United States and Mexico Compared
Political values matter when they shape political behavior. We care about instilling
democratic values in our children because we expect that socialization to democratic attitudes will
lead them to participate democratically— they will want to participate in collective decision-
making and they will be content to participate through democratic institutions and in a democratic
way. Holding democratic views means little if one does not act on those democratic beliefs.
Early political culture research suggested that Mexicans did not hold democratic values to
anywhere near the extent that their neighbors to the north did. Among other dimensions of their
analysis in The Civic Culture, Gabriel Almond and Sidney Verba categorized the respondents to
their surveys into holders of differing types of political attitudes, including “parochials,” those
who expect nothing from the political system; ? subjects,? those who look to government for the
outputs they can get from it; and ?participants,? those more inclined to be actively involved on
the input side of government (1963: 17-19). Participants would be expected to form the basis of
an active civil society and hence the foundation of democracy. However, few participants could
be found in Mexico, where about one-quarter of respondents were parochials and two-thirds were
subjects. In contrast, North Americans1 were much more participative, although not to such a
level that their participation threatened democratic stability. They held the balance of parochial,
subject, and participant attitudes that made up the ? civic culture,? in Almond and Verba? s
memorable phrase.

2
Without citizens with democratic attitudes, who really embraced citizen roles,
authoritarian practices naturally would be easily implemented by the ruling party, for who would
oppose those practices? Since few independent organizations could be found in Mexican civil
society, one might chalk up that absence to the lack of participant citizens to lead and to join
them.. In the United States, in contrast, the strength of democracy may be seen as due to the
associative and participative behavior of North Americans, as Tocqueville recognized long ago.
However, the situation may have been more complex than The Civic Culture suggested.
For example, observers frequently cited the tendency to petition government officials for favors as
a manifestation of Mexicans? ? subject? political culture. So long as people saw the government
as a dispenser of individualized benefits via the clientelist networks promoted by the Institutional
Revolutionary Party (PRI) and by government agencies, they would not likely organize viable
civic organizations or opposition parties to oppose the PRI and the captive organizations it had
created (like the official labor and peasant movements). However, perhaps a more fruitful way of
explaining Mexicans? “subject? political attitudes is to argue that the structures of government
and the official party had been created precisely to encourage individualized contacting of elected
officials and bureaucratic agencies because distributing individualized benefits (extension of a
water line to a petitioner? s house or help in obtaining a government job, for example) was
cheaper than extending benefits to large groups of mobilized people and at the same time less
challenging to the PRI? s rule. Mexicans who tended to see themselves as ? subjects? instead of
?participants? were simply reacting rationally to the clientelist institutions that had been created in
the 1930s and 1940s. Indeed, in research based on surveys conducted in the 1970s, John Booth
and Mitchell Seligson (1983) concluded that Mexicans held democratic attitudes; if Mexico
3
remained authoritarian and Mexicans engaged in modes of participation other than those regarded
as ?participative,? that authoritarianism had to be attributed to factors other than the political
culture, such as institutions like the presidency, at the national level, and the PRI and caciquismo,
at the local level.2
Even taking account of the structurally-imposed constraints on participation identified by
the critics of The Civic Culture, the connection Almond and Verba drew between political culture
and participation remains a significant concern for research, especially in this time of political
transition for Mexico.3 To the extent that different national communities hold varying degrees of
commitment to democracy or different conceptions of democracy (Camp 2001), cross-national
comparison offers fruitful opportunities to gain insight into the role of political attitudes in
shaping patterns of participation. This survey of Mexicans and North Americans promises to
provide us with insight into the attitudinal differences between citizens of the world? s oldest
democracy and those of one of its newest. In addition, because the survey oversamples Mexican-
Americans and Mexicans resident in the United States, we can gain some perspective on the
processes by which the attitudes of North Americans have come to be shared by Mexicans and
those of Mexican descent as well as whether those attitudes lead to different rates of political
participation.
Measuring Political Participation: The Data
The Democracy through Mexican Lenses survey was designed primarily to allow
researchers to explore the process of political learning and the acquisition of democratic values.4
It does not attempt to provide the extensive set of questionnaire items typically posed to
respondents in surveys such as those conducted by Sidney Verba and his collaborators (e.g.,

4
Verba and Nie 1972; Verba, Nie, and Kim 1971, 1978; Verba, Schlozman, and Brady 1995) to
explore political participation. However, it does pose questions about non-electoral forms of
political participation and membership in political organizations that allow us to tap patterns of
political activity by Mexicans and North Americans.
In particular, the Democracy through Mexican Lenses survey asked respondents whether
they had ever taken part in one of the following modes of political participation and, if not,
whether they would consider doing so: asking a favor of a politician or public official, signing a
petition, attending a demonstration, taking part in an unofficial strike, occupying land or buildings,
and joining a boycott. In addition, the survey asked whether respondents belonged to a political
organization.5 The survey did not ask respondents whether they had voted recently or regularly;6
thus we must confine our attention to non-electoral participation in this study. To provide a
comprehensive measure of non-electoral political participation, I constructed an index in which
each respondent was given one point for each mode of participation in which she indicated she
had taken part, including belonging to a political organization. The index thus ranged from 0 to 7.
Attitudes and Political Participation: Cross-National Differences and Similarities
In this democratic age, respondents to surveys rarely admit openly that they prefer
alternative political regimes. Yet, some respondents will admit that in some circumstances they
might prefer an authoritarian regime. Table 1 indicates that when given a choice between always
embracing a democracy and occasionally preferring an authoritarian regime, both North
Americans and Mexicans overwhelmingly choose democracy. Indeed, in 2000, Mexicans did not
differ significantly from their northern neighbors in the degree to which they espoused a
preference for democracy.

5
Table 1 about here
However, democratic values must run more deeply than a willingness to choose
democracy over authoritarianism when asked a preference between those two labels, one having a
strongly positive meaning, the other a negative connotation. Table 1 also shows that when asked
about one of the major components of modern democratic regimes— the rule of law and whether
the government should be made to follow its own laws— the depth of commitment to democracy
may be more shallow in Mexico. Both Mexicans and Mexican-Americans were much more
inclined to allow authorities to violate the law in order to punish wrongdoers than North
Americans generally. Other studies associated with this project will indicate that the
understanding of democracy in Mexico differs from conceptions held in the United States.
If democracy is of the people and by the people as well as for the people, then political
participation is at the center of the democratic experience. To what extent do North Americans
and Mexicans differ in their political behavior? Specifically, do Mexicans and North Americans
differ in the extent of political participation? Aggregate data on electoral participation in the two
presidential elections of 2000 would indicate that Mexicans participate at a higher rate than
people in the U.S., for 64 percent of Mexicans registered to vote turned out on July 2. In contrast
about 51 percent of North Americans of voting age cast ballots in November. However, as most
students of political participation suggest, voting is only one mode of participation, and not a
particularly challenging form of involvement at that (Asher, Richardson, and Weisberg, 1984: 50-
2). Indeed, Mexico? s efforts in the past decade to register its electorate and to encourage turnout
has been much more pro-active and significant than measures taken in the U.S. to lower barriers
to voting, such as the National Voter Registration Act (otherwise known as Motor Voter).

6
Figure 1 about here
Political participation can take many other forms in democracies. As mentioned above,
the data from this survey allow us to explore the following other modes of participation:
contacting politicians and public officials to ask favors, signing petitions and protest letters,
attending demonstrations or marches, participating in an unauthorized strike, occupying a building
or land, participating in boycotts, and belonging to political organizations. Figure 1 illustrates the
patterns of participation of Mexicans, Mexican-Americans, and the general U.S. sample. It clearly
shows that participation rates for these non-electoral modes of participation are significantly
higher for the U.S. than for Mexico, and within the U.S., the general population participates at a
much higher rate than does the Mexican-American population. The U.S. respondents to this
survey even reported engaging in political acts such as asking politicians for favors, a mode of
participation ordinarily associated more with clientelistic regimes such as Mexico than the more
voluntaristic U.S. regime, at a higher rate than Mexicans. Figure 2 provides another illustration of
differences in the volume of participation, this time by showing the distribution of the participation
index among the three major population groups we are studying.
Not only do these data indicate that residents of the US engage in political activities at a
much higher rate than residents of Mexico, but they generally confirm the findings of past studies
of Latino participation. As Rodney Hero, F. Chris Garcia, John Garcia, and Harry Pachon (2000:
529) summarize:
Latinos have lower overall participation rates than the general population, have generally
positive participatory orientations (but actual participation does not follow), have lower
rates of organizational memberships and activities, and lower rates of voter registration

7
and turnout. Also, a significant proportion of the Latino community is foreign-born, and
noncitizens report feelings of distance and disinterest from the political life of the U.S.
How can we explain differences in levels of political participation across the two countries
and between Mexican-Americans and others in the US? The literature on participation has
focused on four major groups of factors that shape political participation: institutional
opportunities and constraints, political values, resources, and social capital. I will explore each
sequentially, and then I will examine the interaction of these factors in a multivariate analysis of
political participation.
Figure 2 about here
Institutional Opportunities and Constraints
A survey focusing on political attitudes provides very little in the way of direct evidence
about institutional opportunities and constraints that might shape patterns of political
participation. Yet in a cross-national study we must recognize that there exist constraints on
participation that operate differentially across national settings. Studies of political participation
have placed heavy emphasis on the role of institutional constraints and opportunities in shaping
the modes of participation pursued and the volume of that participation (Verba, Nie, and Kim,
1978; Asher, Richardson, and Weisberg, 1984). Without relying on the direct testimony of either
frustrated or empowered participants, we can nevertheless discuss some of the key institutional
dimensions of the United States and Mexico that may structure political involvement.
In particular, to the extent that the Mexican regime has only imperfectly protected its
citizens? civil and political rights, all acts of voluntary participation entail accepting some risk of
retribution by those officials who have been offended or by those partisan opponents who are

8
threatened by citizen involvement. During the heyday of the PRI, the regime did not discourage
clientelistic behavior, such as asking politicians, public officials, and local strongmen for favors
(Cornelius 1975). Indeed, it encouraged this form of participation because it reinforced vertical
links between elites and the citizenry and headed off the formation of mass movements that could
emerge from horizontal linkages among Mexican citizens. In contrast, voluntaristic political acts
that the PRI could not coopt or control were regarded as threats to regime stability and often met
with repression. Such characteristics of the Mexican institutional context are not relics of distant
times either. In the 1980s and 1990s, political violence directed against the militants of the
Democratic Revolutionary Party (PRD) and against journalists caught the world? s attention. In
this context, occupying land or buildings to make a political statement entailed much risk.
Those Mexicans who live in the border region have faced the additional constraint that
many of them are new to their places of residence. Indeed, many of the population centers near
the border have grown so rapidly that calling them communities may stretch the meaning of the
term unduly. Because many border area residents are recently arrived to the border region and
likely more preoccupied with finding and keeping employment than Mexicans in other regions, we
might expect that they would be less likely to find time to participate in politics and that the social
networks by which people become involved in politics would be less likely to function there.
In the United States, voluntary acts of political involvement do not entail the risks that
they have in Mexico. However, Mexican-Americans face some constraints. Many Mexican-
Americans retain Spanish as their primary (in some cases, their only) language, which can limit the
activities in which they might engage (writing petition letters to non-Spanish-speaking authorities
or agencies, for example). Many Mexican-Americans do not have US citizenship, and hence

9
cannot engage in many political acts.7 For some Mexicans resident in the US, lack of papers can
completely constrain even non-electoral modes of participation. For some Mexican-Americans
and Mexicans resident in the US, the recency of residence in a community may so hamper their
appreciation of political issues in their new locality that political participation has no meaning.
The differential rates of political participation shown in Figures 1 and 2 may have of their
basis in these institutional differences. However, they may also be explained by other variables to
be explained below. We must wait for a multivariate analysis to completely account for the
independent effects of such institutional differences (see below).
Socioeconomic Status and Demographic Factors
Many past studies of political participation found the causal bases of political activity in
class and other socioeconomic and demographic variables.8 For instance, older citizens have
regularly been identified as more likely to engage in political activities than the young because
those who are older have more experience and, typically, a greater stake in society that they need
to defend. Those with greater socioeconomic resources, as evidenced by higher income levels,
can apply those resources to their political activity (for instance, they can make greater
contributions to political campaigns) and, of course, they have a greater property stake at risk in
the political sphere that they may wish to protect by participating in the political sphere. More
educated citizens are usually found to participate more in politics than their less educated fellow
citizens. As Sidney Verba, Kay Lehman Schlozman, Henry Brady, and Norman Nie (1993: 466-
7) summarize the results of numerous studies:
Education enhances participation more or less directly by developing skills that are
relevant to politics— the ability to speak and write, knowledge of how to cope in an

10
organizational setting— by imparting information about government and politics, and by
encouraging attitudes such as a sense of civic responsibility or political efficacy that
predispose an individual to political involvement. In addition, education affects activity
indirectly: those who have high levels of education are much more likely to command jobs
that are lucrative and to develop politically relevant skills at work, in church and in
voluntary organizations.
In addition to age, income, and education, students of political participation also typically
examine the role of urban and rural residency in promoting political activity. Those studies have
reached mixed conclusions: while modernization theorists had argued that urbanization would
likely make political participation easier, hence encouraging higher participation rates in cities,
others have noted that in large cities the lack of connectedness among citizens discourages them
from engaging in collective endeavors, including participating in politics (Asher, Richardson, and
Weisberg 1984: 42-3).
Table 2 shows the zero-order Pearson correlation coefficients between two different
measures of political participation and the basic socioeconomic variables mentioned above. As
Table 2 indicates, age, education, and index of material prosperity, and urbanization are all
positively associated with actual political participation, although urbanization is only weakly
associated with participation, as our discussion above would have suggested. When we consider
both actual and potential participation, the coefficients for education and the index of material
possessions rise— the better educated and the well-off who don’t participate are inclined to say
they might participate, whereas the less well-educated and the poor don’t say they’re likely to
participate if in fact they don’t. The urbanization coefficient declines to statistical insignificance,

11
which may suggest that those in rural areas who don’t participate would do so if they felt they had
the opportunity. Finally, the age coefficient even changes direction, an indication that the younger
respondents who don’t participate may be willing to do so in the future.
Table 2 about here
Political Attitudes and Participation
That the differences in rates of political participation are not solely due to structural
conditions is suggested by Figure 3. The Democracy through Mexican Lenses study asked not
only whether respondents had engaged in particular modes of political participation, but also
whether they might do so. Figure 3 shows the distribution of combined responses to that
question. When compared to the responses in Figure 1, Figure 3 clearly indicates that the gap
between the general US sample and the both Mexican-Americans and Mexicans narrows when
aspirations are considered rather than actual behavior.
Figure 3 about here
How do political attitudes shape political participation? Broadly, four different
dimensions of political attitudes can conceivably shape political behavior: those related to
fundamental political values (preference for democracy or authoritarianism, for example), to
political efficacy, to political engagement, and to the evaluation of the political context in which
one lives. Let us explore sequentially each of these dimensions and their implications for political
participation .
Fundamental Political Values. Do those who profess to prefer democracy to any other
political regime participate more than those who are willing to accept an authoritarian regime
under some circumstances? We might expect, a priori, that those more committed to a

12
democratic regime would be more apt to see democracy as government by the people. Hence, we
might hypothesize that confirmed democrats would be more committed to participate in politics
than those who see authoritarianism as a viable alternative to democracy.
Table 3 about here
Table 3 illustrates the cross-tabulation of regime preference and the participation index,
controlling for the major population groups that live in different institutional contexts. Although
these contingency tables may suggest a relationship between regime preference and participation,
in fact no statistically significant relationship emerges in any of the subsets of our sample.
Similarly, if we examine another variable that taps into regime preference, viz., the willingness to
allow the authorities to use whatever means necessary to prosecute wrongdoers, no statistically
significant relationship surfaces. In short, there seems to be no bivariate association between
fundamental regime preferences and political participation. Embracing democracy apparently
does not cause one to participate more frequently.
Political Efficacy. Past work on political participation has identified political efficacy as a
key explanatory variable. Almond and Verba (1963) made the concept of citizen competence a
centerpiece of their work, and others have built on their work. For example, in their study of
participation in the United States, Verba and Nie (1972) found efficacy to be a factor for
predicting the different modes of political participation a respondent might follow.
In our sample, the bivariate relationship between political efficacy and political
participation holds for all groups except Mexican-Americans. As Table 4 suggests, the
association between efficacy and participation is not particularly strong, but those non-Mexican-
Americans in the US and Mexicans who feel that politics is not too complicated for the ordinary

13
person to understand are somewhat more involved in political activities. Conversely, those who
regard politics as complicated tend to participate less. Mexican-Americans, however, do not
manifest this relationship. One possible reason is that language constraints and legal barriers can
stand in the way of even the most self-assured person.
Table 4 about here
Interestingly, within the Mexican-American portion of the sample, those Mexican-
Americans who claimed American “nationality” did not evidence greater political efficacy than
those who asserted they held “Mexican” nationality, or both nationalities. Similarly, those who
reported having US working papers were no more likely to report that they felt able to have
influence in political affairs than those who did not. That is, some of the typical structural
vulnerabilities of Mexican-Americans do not seem to have impact on their sense of political
efficacy. However, among Mexican-Americans, there is a weak but significant relationship
between the number of years one has lived in the US and one’s political participation, including
one? s aspirations to participate, as Table 5 shows.9 Likewise, there is a weak but significant
relationship between a Mexican-American’s professed nationality and the number of forms of
political participation in which he engages (those expressing American nationality participate
more) and those who have US working papers report participating more often (see Table 5). So,
if Mexican-Americans participate in politics less than do non-Mexican-Americans, that behavior
seems to have little to do with their sense of political efficacy.
Table 5 about here
Political Engagement. By political engagement, I mean the psychological dimension of
involvement in politics. While some scholars have suggested that following politics in the media

14
and discussing politics with acquaintances constitutes one mode of political participation,10 here I
am distinguishing between a subjective engagement in political affairs which remains on the
sidelines and an active participation in politics that requires going into the public sphere in one
way or another. Major elements of political engagement include the level of one’s interest in
politics, the importance one attributes to politics, and the extent to which one discusses politics
with others. Major studies of political participation have found that political involvement plays a
role as an intervening variable between socioeconomic status and political participation (e.g., Nie,
Powell, and Prewitt 1969).
Table 6 about here
Table 6 displays the relationship between one indicator of political engagement, the level
of interest in politics, and our political participation index. A casual glance will suffice to
demonstrate the strong relationship between political interest and the volume of political
participation. Indeed, for all four groups of respondents, the association between these two
variables is very strong and linear: those who are much more interested participate more
frequently in politics. At the same time, Table 6 shows that the level of political interest varies
considerably from group to group. Mexicans resident in the border region show far less interest
in politics than does the general US population, hence their frequency of participation is much
less.
Evaluation of the Political Context. It may stand to reason that those who perceive the
political regime in which they live to be undemocratic will conclude that their political
participation will be meaningless. Thus, they may be deterred from participating in political
activities of various sorts. Of course, this relationship may hold more strongly for the modes of

15
participation most associated with democracy— e.g., voting and campaign activities. Similarly,
those who feel strongly that their political system is democratic will be more likely to conclude
that their own political participation can have impact on policy makers. Hence, those who believe
they live under a democratic regime should be more likely to participate.
Table 7 about here
Table 7 reports the cross-tabulation of the participation index and one measure of the
respondents’ evaluation of the extent to which they live in a democracy, viz., their responses to
the question, “How democratic would you say this country is?” The sub-tables in Table 7 indicate
that among the general populations of the US and Mexico, there is a weak but significant
relationship between the evaluation of the democraticness of their political system and their
propensity to participate politically. The relationship does not hold either for Mexican resident in
the border region or for Mexican-Americans.
Social Capital
In recent years scholars have placed significant attention on the role of social capital in
promoting the effectiveness of democratic systems (e.g., Putnam 1993, 1995). Social capital,
understood to mean “features of social life— networks, norms, and trust— that enable participants
to act together more effectively to pursue shared objectives” (Putnam 1995: 664-5), may be
closely related to political participation, although the two concepts are not synonymous. Indeed,
Robert Putnam argues that we must distinguish between political participation— “or relations with
political institutions”— and social capital— our relations with one another.” (Putnam 1995: 665)
Whether social capital influences the propensity to participate politically is an empirical question,
although Putnam (1995, 2000) has marshalled considerable evidence to argue that declining rates

16
of political participation in the United States are associated with the erosion of social capital. In a
similar vein, Henry E. Brady, Sidney Verba, and Kay Lehman Schlozman (1995) have
demonstrated that for acts of political participation requiring time, respondents who have acquired
civic skills from their organizational or church memberships or from their jobs are more likely
participate (see also Verba, Schlozman, and Brady 1995 and the early study by Nie, Powell, and
Prewitt 1969).
To operationalize the concept of social capital, from our survey we can use one attitudinal
variable— social trust— and one set of behavioral variables, viz., membership in organizations.
Putnam characterizes membership in organizations as a major element civic engagement. He
suggests that social trust is essential for effective civic engagement (1995).
For this paper, I have constructed an index of organizational involvement by summing the
number of types of organizations to which a respondent reports belonging. The survey asked
respondents if they were members of the following types of organizations: sports, religious, union,
neighborhood, PTA, and political. Membership in a political organization can be regarded as a
form of political participation, so when exploring the relationship of organization membership to
political participation, I drop political organization membership from the index.
Figure 4 about here
Figure 4 shows the distribution of types of organizational membership for Mexicans,
Mexican-Americans in the US, and non-Mexican-Americans in the US. That Mexicans belong to
social organizations of all forms at a considerably lower rate than people in the United States
stands out in Figure 4. Even the neighborhood associations often touted as a new form of
participation central to democratizing Mexican society involve only a small percentage of Mexican

17
respondents (Craig and Foweraker 1990). Figure 5 shows the distribution of the volume of
organization memberships across the three groups (with political organization memberships
included in the index for this chart).11 This form of social capital is clearly more developed in the
United States than in Mexico. Fully 64 percent of Mexicans belong to no organizations of the
types shown in Figure 4. In contrast, 71 percent of non-Mexican-American US respondents and
62 percent of Mexican-Americans in the US reported belonging to at least one type of
organization.
Figure 5 about here
Do these organization memberships have impact on one? s political participation? Perhaps
the easiest way to demonstrate the relationship is by considering the simple correlation coefficient
relating the organizational membership index and the participation index. That Pearson’s
correlation coefficient is .387, which is relatively high for individual-level data (see the last row of
Table 2). If we consider the relationship between both actual and aspired participation, on one
hand, and organizational membership, on the other, the correlation is only slightly weaker at .369
(again, see Table 2).
Table 8 about here
To explore the attitudinal dimension of social trust, consider Table 8. In the general US
sample, there exists a clear, although not overly strong, relationship between trust and the volume
of participation. Similarly, for the general Mexican sample, a weak but significant relationship
exists between trust and participation. No statistically significant relationship holds for either
Mexican-Americans or those Mexicans from the border region.
Values, Social Capital, and Participation: A Multivariate Model

18
Of course, the political attitudes and dimensions of social trust discussed above are by no
means unrelated to each other. Consequently, to gain a clearer understanding of the relationship
of political attitudes, social capital, socioeconomic resources, and contextual (institutional) factors
to political participation, controlling for the effects of each of these variables, I conducted a
multiple regression analysis of the predictors of participation, using an alternative participation
index as the dependent variable.12 Table 9 lists the variables incorporated into the model as
independent, explanatory variables.
Table 9 about here
Because analysts of political participation have long recognized socioeconomic status
variables to be strong predictors of participation, I incorporated the following variables into the
model: age, gender, educational level, the level of urbanization of the city in which the respondent
lives, and an index of material possessions.13 In addition, because religiosity tends to predict
participation, I included the frequency of church attendance with the demographic and
socioeconomic variables. All except gender would be expected to have a positive relationship on
participation: older, better educated urban dwellers would be expected to engage in more political
activities than younger, less educated, rural residents. Those who attend church more often
would be expected to engage in more political activities.
Social capital is tapped by three variables: the organization index, social trust, and the
number of hours per day one watches television. I added the latter variable to the model because
Putnam (1995) identifies television viewing as a substitute for engaging in the civic activities he
associates with social capital: instead of joining bowling leagues, playing in bridge clubs, or
working with the PTA, increasingly North Americans are spending their time in front of the tube.

19
While the organization index and social trust would be expected to have a positive impact on
participation, television watching should be negatively related to political activities.
Under political attitudes, three variables can tap political engagement: one? s self-professed
interest in politics, the amount of time spent talking about politics with others, and one? s
assessment of the importance of politics. All should be positively related to participation
(although the coefficients in the analysis should be negative because the scales are inverse). Two
variables measure the evaluation of the regime: an assessment of how democratic the country is
and the level of satisfaction with the functioning of democracy. The former we would expect to
be positively related to participation. The latter’s association with participation is unclear: those
being more dissatisfied with democracy might choose to participate more (especially in protest
activities) in order to encourage change in a democratic direction; at the same time, those very
satisfied with democracy’s functionality might be more inclined to take advantage of democratic
institutions to participate more. Two variables explore regime preference: the direct question
about whether one prefers democracy in all situations or authoritarianism under some conditions,
and the respondent’s opinion about whether authorities should be made to adhere to the rule of
law when prosecuting wrongdoers or not. A priori, we would expect these variables to be
positively associated with participation. Political competence is represented by the simple efficacy
question, whether one considers politics too complicated for the average person or not. More
efficacious respondents should be more willing to participate (however, the scale, as recoded, is
inverse, so the coefficient should be negative). Risk propensity may influence political
participation too: those more inclined to take risks may be more willing to become involved in
political activities, especially those that require a greater effort than simply turning out to vote.

20
Finally, left-right placement (on a 0-10 scale) is included as a control for political ideology.
To capture contextual differences, such as those associated with political and other
institutional factors, two dichotomous variables appear under the label “group.” The first divides
the survey respondents into Mexicans and Americans. The second divides the US sample into
Mexican-Americans and the non-Mexican-American population. We expect that the US portion
of the sample will participate more than Mexicans because of the institutional constraints
historically faced by Mexicans. Within the US, Mexican-Americans are expected to participate
less frequently than the rest of the population owing to language limitations and lack of
citizenship, as discussed above.
Table 10 about here
Table 10 reports the results of this multiple regression model. Two strong positive
findings emerge in Table 10 and one negative finding. The positive findings are, first, that the
social capital variables prove to be strong predictors of political participation. In particular, the
index of organizational membership14 proves to be the strongest predictor of participation of all of
the variables in this full model (see the standardized coefficient— or beta weight— for organization
mean in Table 10). Social trust is an independently significant predictor of participation— more
trusting individuals participate more frequently in politics. Further, those who spend their free
time watching television do not participate as much in politics as those who abstain from
television viewing.
Secondly, even after the socioeconomic, attitudinal, and social capital variables are
accounted for in the model, the contextual (institutional) factors captured by the dummy variables
for country (Mexico or US) and for Mexican-American ethnicity in the US remain strong

21
predictors of participation. Each is a relatively strong predictor of participation (again, see the
standardized coefficients) in the expected direction— i.e., Mexicans participate less often in
politics than residents of the US, controlling for the many other variables in the model, and
Mexican-Americans are less involved than other US residents.
The negative finding in this multivariate analysis comes from the attitudinal variables.
Except for those variables measuring political involvement— interest in politics, the perception of
the importance of politics, and the frequency of discussing politics— only one other attitudinal
variable proves to be statistically significant predictors of participation (other than social trust,
which I have grouped with social capital, but which could arguable be placed with the attitudinal
variables). That variable taps the respondent— s view about authority— whether those in charge
of prosecuting crime should be held to the same standards of obedience to the law as those they
are seeking to prosecute. That variable is only marginally significant (significance=.05). It
appears that one’s views about democracy, one’s sense of efficacy, and other general political
attitudes do not influence whether one participates in politics. However, the extent to which a
respondent thinks politics matters very strongly shapes the volume of his political participation.
Finally, we should note that the socioeconomic variables reported in Table 10 mostly
confirm our hypotheses about the roles of socioeconomic and demographic factors in influencing
political participation. Older people, those living in urban areas, and those with higher levels of
education participate more than younger folks, those living in the countryside, and the more
poorly educated. However, these variables are not strong predictors of the volume of political
participation (as shown by the relatively low betas). There seems to be no significant difference in
participation between men and women. After controlling for other variables, those with more

22
material possessions (hence, more likely to be materially better off) are not significantly more
likely to participate than those with less. Interestingly, those who attend church more regularly
participate less in politics, a somewhat counterintuitive finding.15
To enrich the analysis, I ran alternative specifications of the model reported in Table 10. I
dropped the statistically insignificant attitudinal variables from the model, along with one of the
political involvement variables (frequency of discussing politics, since it is more of a behavioral
variable than an attitudinal variable). I then estimated four alternative specifications of the model:
the first used the same dependent variable as the model in Table 10, without the explanatory
variables mentioned earlier in this paragraph; the second disaggregated the organizational
membership index, replacing it with dichotomous variables for each of the possible organizational
types in an attempt to determine which types of organization matter most for stimulating political
participation; the third and the fourth replicate the first and the second, but a participation index
that incorporates both actual and potential participation replaces the participation mean.16 Table
11 reports just the standardized coefficients produced by estimating those four alternative models.
(The full statistical information from those estimations is reported in appendix tables A1 to A4.)
A casual glance at Table 11 will show that many of the variables in the four alternative
models retain roughly the same explanatory power in each estimation. Social capital remains the
strongest set of explanatory factors, and contextual matters (as captured by the dummy variables
for country and Mexican-American ethnicity) also contribute much predictive power. When we
move from an analysis of actual participation to an exploration of actual and potential
participation, gender becomes a statistically significant predictor as men increasingly report that
they might participate. The index of material possessions also becomes a powerful explanatory

23
variable when we examine actual and potential participation. One is tempted to suggest that
materially better off men who don’t participate in politics are simply unwilling to say that they
would never consider participating even when their past behavior indicates otherwise.
When we disaggregate organizational involvement, all forms of organizational membership
are positively related to political participation, with the possible exception of membership in
religious organizations, which is statistically insignificant (although the sign is in the correct
direction) for actual participation and weakly related to actual and potential participation.17
Whether a respondent belongs to a sports club, a PTA, or a union, that membership is likely to
encourage her to participate politically. However, when we examine actual political participation,
membership in a union or a neighborhood association is more likely to encourage participation
than involvement with other types of organizations.18
The estimates reported in Tables 10 and 11 confirm our initial hunch that there remain
differences in the volume of political participation between Mexico and the United States, and that
within the United States, Mexican-Americans participate less often than other ethnic groups.
Above I suggested that institutional constraints probably account for these different participation
rates for non-electoral participation. We cannot, of course, directly measure these institutional
(or any other contextual) differences directly with a survey of attitudes and perceptions.
However, these survey data have confirmed our hypothesis that social capital plays a large role in
promoting non-electoral political participation. Because social capital looms so large in
explaining political participation rates, and because social capital is so disproportionately
distributed among the population groups studied here (see Figures 4 and 5), it behooves us to
give a brief exploration of the sources of the differences in social capital.
24
Explaining Social Capital: Some Exploratory Notes
In the same way that it is not primarily designed to examine political participation, the
Democracy through Mexican Lenses survey was not intended for a thorough examination of the
development of social capital. However, we can use the survey data from the Democracy through
Mexican Lenses project to gain some preliminary insights into sources of the discrepancies in
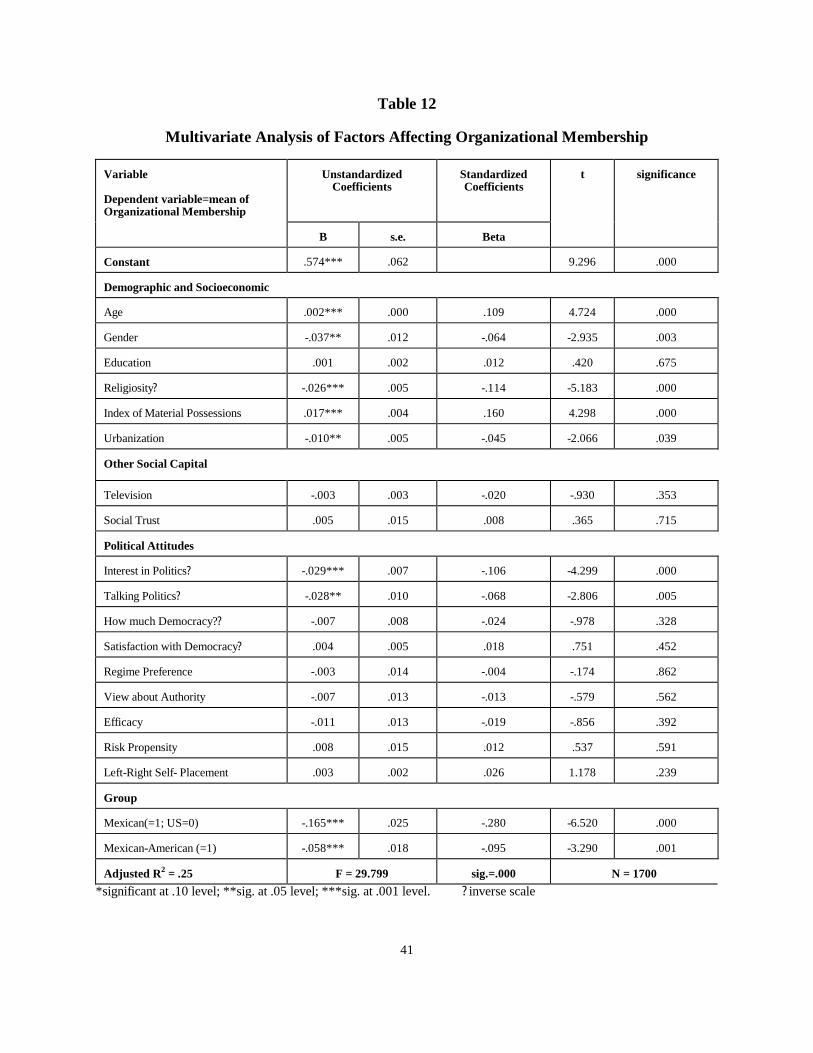
social capital observed in Figures 4 and 5. To undertake that preliminary examination, I regressed
the mean of organizational involvement on the same set of socioeconomic and attitudinal
variables used in the examination of political participation, including the social capital variables
other than organizational memberships, as well as the variables introduced to control for country
and Mexican-American ethnicity. The results of that multiple regression analysis are displayed in
Table 12.
Table 12 about here
The overall differences in organizational membership between Mexicans and North
Americans and between Mexican-Americans and others living in the US observed in Figures 4 and
can be attributed in no small way to socioeconomic and demographic differences. Among the
strongest predictors (see the standardized coefficients) of organizational membership are age and
the index of material possessions. Older people belong to more organizations. Those who are
wealthier belong to more organizations. Mexicans are generally younger and poorer than North
Americans. Mexican-Americans are likewise generally younger and poorer than the general US
population. To the extent, then, that political participation is shaped by other organizational
involvements, i.e., that one’s stock of social capital permits one’s participation in politics,
Mexicans and Mexican-Americans are hindered by their relative youth and poverty compared to

25
the general US population. As Mexico’s young population ages, and if it becomes materially
better-off and thus acquires a stake in keeping its possessions, it may become more involved in
social organizations and then more active politically. The same may be true for Mexican-
Americans within the US.
The other socioeconomic and demographic variables offer more mixed messages about
differences between the US and Mexico. Men have more organizational involvements than
women, but the sexes are evenly distributed across countries and ethnic groups. Controlling for
other factors, those in more rural areas belong to more organizations than those in more urban
zones, but that variable is not particularly powerful as a predictor (see the low beta). Those who
attend church more often have more organizational memberships (note that the variable is inverse,
hence the negative coefficient actually means that the relationship is direct). Controlling for other
factors, the education variable washes out.
Most political attitudes— including social trust— do not predict organizational
membership. However, those attitudinal (and behavioral) variables that tap the disposition to
political involvement— interest in politics and the frequency of discussing politics— prove to be
significant predictors of organizational involvement just as they did for political participation. In
short, some people think politics matters a lot, they discuss political matters with their friends,
families, and coworkers, and they are joiners— they join a variety of organizations. Their
organizational involvements probably reinforce their propensity to engage in political activities.
Again, the distribution of people who are somewhat or very interested in politics is weighted
against Mexicans and Mexican-Americans. In the general US population, 59% of respondents
find politics somewhat or very interesting. Among Mexican-Americans, that percentage falls to

26
46%. Among Mexicans it is 39%. To the extent that interest in political matters disposes one to
membership in social organizations (it is, perhaps, one of the main attitudinal manifestations of
being a joiner), Mexicans and Mexican-Americans are disadvantaged compared to the general US
population.
Finally, even taking account of these attitudinal and social structural factors, the strongest
explanatory variable in the model displayed in Table 12 remains one’s residence in Mexico. For
reasons that apparently do not relate to political attitudes (since none of those variables was
significant other than interest in politics), Mexicans join social organizations at a much lower rate
than North Americans, including Mexican-Americans. The organizational landscape in which
Mexico’s stock of social capital must be built is not that conducive to actually constructing that
social capital. Mexicans are simply less disposed to join social organizations than their North
American neighbors, perhaps because fewer organizations exist south of the border. Whether the
absence of such organizations owes to a history of efforts by the former ruling party to co-opt
such organizations or to a tendency to non-associativeness by Mexicans is difficult to say with the
data available for this research. However, whatever the reason, Mexicans and, to a lesser extent,
Mexican-Americans suffer from a relative dearth of social capital.
Conclusions
Nearly four decades ago, Almond and Verba identified a “civic culture” to be a principal
factor sustaining a healthy democracy in the United States and Britain and they worried about
how the absence of a civic culture in other nations could inhibit success with democratic practices
there. Insufficient numbers of participative individuals in Mexico helped to explain for Almond
and Verba the anemic character of democratic practice there. The data analyzed in this paper do

27
suggest that Mexicans are less participative than their North American neighbors and that
Mexican-Americans participate less in politics than the general US population. While I have not
sought to argue that this propensity to political inactivity in Mexico and among Mexican-
Americans hinders the functioning of democracy in either country— Mexicans just ousted the
long-ruling PRI, after all— concerns about the implications of this non-participativeness for the
long-term health of Mexican democracy could justifiably be raised.
Rather than engage in a lengthy discourse on the consequences of lower rates of political
participation for the health of Mexican democracy and for the place of Mexican-Americans in the
US political system, I will close this article with two comments, one more optimistic, the other
more pessimistic about Mexican democracy in light of the research presented here. First, the
more pessimistic note: Putnam’s initial observations about the importance of social capital for the
health of a democracy came from his study of regional governments in Italy (1993). His principal
conclusion about the effectiveness of different regional governments in Italy’s decentralization
experiment was that those places in which regional government proved most successful were
places with a long history of citizens’ active involvement in civic affairs— i.e., in places where
social capital had been developed over the course of decades and even centuries, new experiments
in regional government succeeded; where no stock of social capital existed, they tended to
flounder, despite the fact that the structure of governmental institutions was formally the same
throughout the country. Putnam’s concern in that study of Italy focused not on whether people
participated in political affairs, but what the consequences of their participation would be for
public policy. He concluded that good government depended on a citizenry with an abundance of
social capital, hence his concerns about the decline of social capital, as manifested in the

28
disappearance of bowling leagues and other forms of social organization, for the health of US
democracy (Putnam 2000).
As Mexico grapples with democratic policy formation and implementation in the aftermath
of the PRI’s fall from power, the nation’s dearth of social capital may make governing the nation
more difficult. The PRI wanted organizations it could control and political activists who would
happily follow the national party’s directives. One of the consequences of this preference by the
former ruling party was that many people just stayed home and what the federal government
could not accomplish— which became a lot after the debt crisis of the 1980s led to a downsizing
of government— just didn’t get done. One response to the overcentralization of power was a
choice to decentralize government that began in the 1980s and has accelerated since then
(Rodríguez 1997). Local governments have been given more money to spend and more latitude
in how to spend it. However, if municipal governments have more to do and more revenue with
which to do what they deem important for their localities, the successful expenditure of those
funds will depend much on local citizens’ capacity to make demands on their municipal
governments, on their willingness to serve in locally-elected government positions, and their
willingness to pitch in to accomplish collective tasks. The relative dearth of social capital in
Mexico, as manifested in the relative absence of organizational memberships and high levels of
mistrust, poses significant challenges for Mexico’s new experiment in democracy, at the local
level perhaps more than the national level.
On a more optimistic note, neither the low rates of political activity nor the absence of
associational memberships in Mexico and among Mexican-Americans seem to be due to
fundamental political values. Rather, they seem to be due to the relative youth of the Mexican
29
population, its lack of economic prosperity, and some important institutional constraints that
plagued Mexico under PRI rule, most notably, the history of clientelism and the selective
repression of political activists. Indeed, when Mexicans move to the United States and as they
live longer in the US, they begin to join organizations and to participate in politics. Context
rather than fundamental political values seems to matter most for the development of social
capital and the emergence of a propensity to participate politically. If Mexico can consolidate its
democracy and enjoy some years of stable democratic life, the prospects that Mexicans will come
to have the opportunities to join social organizations and to become more active in political life
should increase. Then Mexicans may come to approximate participative behavior that
characterized the civic culture.

30
Table 1
Regime Preferences
With which of the following phrases do you agree most?
Non-Mexican-
American United States
Mexican-
Americans
Mexicans
Democracy is preferable to any other form of government.
78
65
75
In some circumstances, an authoritarian government can be preferable to a democracy.
22
35
25
With which of the following phrases do you agree most?
Authorities should apply the law strictly, even at the cost of not punishing a wrongdoer.
52
38
39
Authorities should try to punish wrongdoers even at the cost of not strictly following the law.
37
56
55
Table 2
Correlations between Participation, Organization Membership, and Socioeconomic Variables
Participation Mean
Actual only
Participation Mean Actual and Potential
Organization Mean
Age
.115***
-.038**
.203***
Education
.288***
.346***
.183***
Index of Material Possessions
.298***
.368***
.398***
Urbanization
.039**
.023
-.085***
Organization Mean
.387***
.369***
---
*significant at .10 level; **sig. at .05 level; ***sig. at .001 level.

31
Table 3
Regime Preference and Political Participation
With which of these statements do you most agree: ?Democracy is preferable to any other form of government,? or ? In some circumstances, an authoritarian government can be preferable to a democracy.?
Number of Modes of Political
Participation
N
0
1
2
3 or more
Non-Mexican-American US
Always Democracy
34
26
19
21
516
Sometimes Authoritarianism
43
19
21
19
146
Mexican-Americans
Always Democracy
61
20
10
9
422
Sometimes Authoritarianism
70
17
6
7
224
Mexico
Always Democracy
78
13
5
5
754
Sometimes Authoritarianism
83
12
3
2
255
Border Region (within Mexico)
Always Democracy
78
13
4
6
379
Sometimes Authoritarianism
75
16
6
4
135
NB: None of the sub-tables are statistically significant.

32
Table 4
Political Efficacy and Political Participation
Which is closest to your way of thinking: ?Politics is very complicated and hard to understand,? or ?Politics is not very complicated and one can understand it.?
Number of Modes of Political
Participation
N
0
1
2
3 or more
Non-Mexican-American US
Politics is complicated
45
26
15
15
377
Politics is not too complicated
31
23
24
23
338
Mexican-American US
Politics is complicated
69
17
7
7
347
Politics is not too complicated
61
20
10
9
374
Mexico
Politics is complicated
86
9
3
3
628
Politics is not too complicated
75
15
6
4
541
Border Region (within Mexico)
Politics is complicated
83
9
4
3
339
Politics is not too complicated
71
17
4
7
219
NB: Sub-table for Mexican-Americans is not statistically significant. Others significant at .01 level.

33
Table 5
Institutional Constraints and Political Participation Among Mexican Americans
Number of Modes of Political
Participation
N
0
1
2
3 or more
What is your nationality? Mexican
82
11
4
3
544
American
71
13
8
8
76
Both
75
9
12
4
117
Do you have US working papers? Yes
78
11
6
5
498
No
83
13
4
0
137
Years living in the US Fewer than 5
76
18
5
2
67
5-10
80
14
6
3
104
More than 10
61
20
9
10
521

34
Table 6
Political Engagement and Political Participation
How much does politics interest you?
Number of Modes of Political Participation
N
0
1
2
3 or more
Non-Mexican-American US
A lot
22
22
22
34
179
Somewhat
35
25
22
18
262
Very little
44
28
15
14
174
Not at all
57
26
11
6
128
Mexican-Americans
A lot
42
28
12
18
145
Somewhat
57
21
10
12
204
Very little
72
18
8
3
212
Not at all
83
10
4
2
187
Mexico
A lot
56
27
7
10
156
Somewhat
76
15
6
3
304
Very little
88
9
2
2
381
Not at all
89
5
3
3
350
Border Region (within Mexico)
A lot
51
27
8
14
49
Somewhat
82
10
5
4
115
Very little
75
14
7
4
159
Not at all
85
10
2
3
241
NB: All sub-tables significant at the .001 level.

35
Table 7
Evaluation of the Regime and Political Participation
How democratic would you say this country is?
Number of Modes of Political Participation
N
0
1
2
3 or more
Non-Mexican-American US
Very
35
22
21
23
289
Somewhat
35
30
18
16
306
A little
44
24
19
13
88
Not at all
58
11
5
26
19
Mexican-Americans
Very
63
19
9
10
292
Somewhat
64
21
7
9
233
A little
60
20
13
7
146
Not at all
82
6
6
6
17
Mexico
Very
77
17
2
4
167
Somewhat
79
14
4
3
309
A little
79
12
6
4
405
Not at all
85
7
3
5
164
Border Region (within Mexico)
Very
77
15
9
0
34
Somewhat
81
11
2
7
170
A little
78
12
7
4
187
Not at all
74
18
2
6
103
NB: Non-Mexican-American US sub-table significant at the .05 level, Mexico sub-table at the .10 level; others not significant.

36
Table 8
Trust and Political Participation
Would you say that most people can be trusted or that you need to be very careful about trusting other people?
Number of Modes of Political
Participation
N
0
1
2
3 or more
Non-Mexican-American US
Most can be trusted
30
24
21
26
229
Need to be very careful
42
26
18
15
502
Mexican-Americans
Most can be trusted
60
19
8
14
145
Need to be very careful
66
18
9
7
590
Mexico
Most can be trusted
75
14
5
6
211
Need to be very careful
82
11
4
3
974
Border Region (within Mexico)
Most can be trusted
70
21
6
3
113
Need to be very careful
81
10
4
5
453
NB: Only the Non-Mexican-American sub-table is significant at the .01 level; Mexico sub-table significant at the .10 level; others not statistically significant.

37
Table 9
Expected Relationships of Socioeconomic, Social Capital and Attitudinal Variables to Political Participation
Variable
Hypothesized Relationship
Demographic and Socioeconomic Age
positive
Gender†
positive
Education
positive
Religiosity?
positive*
Index of Material Possessions
positive
Urbanization
positive
Social Capital Television
negative
Organization Index
positive
Social Trust (0=cautious; 1=trusting)
positive
Political Attitudes Interest in Politics?
positive*
Talking Politics?
positive*
Importance of Politics?
positive*
How much Democracy??
positive*
Satisfaction with Democracy?
unclear
Regime Preference (0=authoritarian; 1=democracy)
positive
View about Authority (0=prosecute how ever ; 1=obey law)
positive
Efficacy (0=efficacy; 1=low efficacy)
negative
Risk Propensity (0=risk averse; 1=risk taker)
positive
Left-Right Self- Placement (0=left; 10=right)
unclear
Group Mexican (=1; US=0)
negative
Mexican-American (=1; non-Mexican-American=0)
negative

38
*Because the scale of the variable is inverse, coefficient should be negative ? inverse scale

39
Table 10
Multivariate Analysis of Factors Affecting Political Participation
Variable Dependent variable= Participation Mean
Unstandardized
Coefficients
Standardized Coefficients
t
significance
B
s.e.
Beta
Constant
.086*
.046
1.872
.061
Demographic and Socioeconomic Age
.001**
.000
.049
1.970
.049
Gender
.003
.009
.008
.335
.738
Education
.004**
.002
.073
2.584
.010
Religiosity?
.007**
.004
.047
2.023
.043
Index of Material Possessions
.005
.003
.068
1.454
.146
Urbanization
.006*
.003
.040
1.726
.085
Social Capital Television
-.004*
.002
-.042
-1.851
.064
Organization Mean
.189***
.017
.291
11.228
.000
Social Trust
.023**
.010
.056
2.397
.017
Political Attitudes Interest in Politics?
-.011**
.005
-.062
-2.197
.028
Talking Politics?
-.032***
.007
-.119
-4.736
.000
Importance of Politics?
-.014**
.006
-.069
-2.526
.012
How much Democracy??
-.001
.005
-.003
-.100
.920
Satisfaction with Democracy?
.003
.003
.023
.891
.373
Regime Preference
.002
.010
.005
.213
.832
View about Authority
.017**
.009
.045
1.959
.050
Efficacy
.002
.009
.005
.201
.840
Risk Propensity
-.008
.010
-.018
-.758
.448
Left-Right Self- Placement
-.001
.002
-.013
-.578
.563
Group
Mexican (=1)
-.048**
.020
-.128
-2.421
.016
Mexican-American (=1)
-.043***
.012
-.105
-3.491
.000
Adjusted R2 = .29
F = 28.491
sig.=.000
N = 1442
*significant at .10 level; **sig. at .05 level; ***sig. at .001 level. ? inverse scale

40
Table 11
Multivariate Analysis of Factors Affecting Political Participation Alternative Models
Variable
Participation Mean
Actual only
Participation Mean Actual and Potential
Beta
Beta
Beta
Beta
Demographic and Socioeconomic Age
.036*
.051**
-.106***
-.109***
Gender
.005
-.006
-.048**
-.036*
Education
.075***
.100***
.097***
.088***
Religiosity?
.035*
.030
.068***
.052**
Index of Material Possessions
.040
.114**
.134***
.141***
Urbanization
.039**
.021
-.015
-.019
Social Capital
Television
-.043**
-.044**
-.042**
-.044**
Organizational Membership
.260***
.243***
Sports Organization
.078***
.085***
Religious Organization
.017
.037*
Union
.173***
.168***
Neighborhood Association
.117***
.070***
PTA
.076***
.049**
Social Trust
.066***
.082***
.053**
.054**
Political Attitudes
Interest in Politics?
-.116***
-.123***
-.159***
-.161***
Importance of Politics?
-.129***
-.052**
-.116***
-.113***
Group
Mexican (=1)
-.170***
-.057
-.130***
-.132***
Mexican-American (=1)
-.164***
-.092***
-.102***
-.094***
Adjusted R2
.29
.27
.32
.33
*significant at .10 level; **sig. at .05 level; ***sig. at .001 level. ? inverse scale
41
Table 12
Multivariate Analysis of Factors Affecting Organizational Membership
Variable Dependent variable=mean of Organizational Membership
Unstandardized
Coefficients
Standardized Coefficients
t
significance
B
s.e.
Beta
Constant
.574***
.062
9.296
.000
Demographic and Socioeconomic Age
.002***
.000
.109
4.724
.000
Gender
-.037**
.012
-.064
-2.935
.003
Education
.001
.002
.012
.420
.675
Religiosity?
-.026***
.005
-.114
-5.183
.000
Index of Material Possessions
.017***
.004
.160
4.298
.000
Urbanization
-.010**
.005
-.045
-2.066
.039
Other Social Capital
Television
-.003
.003
-.020
-.930
.353
Social Trust
.005
.015
.008
.365
.715
Political Attitudes Interest in Politics?
-.029***
.007
-.106
-4.299
.000
Talking Politics?
-.028**
.010
-.068
-2.806
.005
How much Democracy??
-.007
.008
-.024
-.978
.328
Satisfaction with Democracy?
.004
.005
.018
.751
.452
Regime Preference
-.003
.014
-.004
-.174
.862
View about Authority
-.007
.013
-.013
-.579
.562
Efficacy
-.011
.013
-.019
-.856
.392
Risk Propensity
.008
.015
.012
.537
.591
Left-Right Self- Placement
.003
.002
.026
1.178
.239
Group Mexican(=1; US=0)
-.165***
.025
-.280
-6.520
.000
Mexican-American (=1)
-.058***
.018
-.095
-3.290
.001
Adjusted R2 = .25
F = 29.799
sig.=.000
N = 1700
*significant at .10 level; **sig. at .05 level; ***sig. at .001 level. ? inverse scale

42
APPENDIX
Multivariate Analysis of Factors Affecting Political Participation
Table A1
Unstandardized
Coefficients
Standardized Coefficients
Variable Dependent variable= Participation Mean
B
s.e.
Beta
t
significance
Constant
.134
.030
4.417
.000
Demographic and Socioeconomic Age
.000*
.000
.036
1.869
.062
Gender
.002
.007
.005
.258
.797
Education
.004***
.001
.075
3.258
.001
Religiosity†
.005*
.003
.035
1.880
.060
Index of Material Possessions
.003
.002
.040
1.254
.210
Urbanization
.006**
.003
.039
2.119
.034
Social Capital Television
-.004**
.002
-.043
-2.386
.017
Organization Mean
.161***
.013
.260
12.548
.000
Social Trust
.027***
.008
.066
3.554
.000
Political Attitudes Interest in Politics†
-.020***
.003
-.116
-5.593
.000
Importance of Politics†
-.033***
.003
-.129
-6.242
.000
Group Mexican (=1)
-.062***
.013
-.170
-4.721
.000
Mexican-American (=1)
-.063***
.009
-.164
-6.795
.000
Adjusted R2 = .29
F = 71.010
sig.=.000
N = 2186
*significant at .10 level; **sig. at .05 level; ***sig. at .001 level. †inverse scale

43
Table A2
Unstandardized
Coefficients
Standardized Coefficients
Variable Dependent variable= Participation Mean
B
s.e.
Beta
t
significance
Constant
.042
.029
1.433
.152
Demographic and Socioeconomic Age
.001**
.000
.051
2.463
.014
Gender
-.020
.006
-.006
-.318
.751
Education
.004***
.001
.100
4.403
.000
Religiosity†
.004
.003
.030
1.506
.132
Index of Material Possessions
.007**
.002
.114
2.964
.003
Urbanization
.003
.002
.021
1.095
.274
Social Capital Television
.004**
.002
-.044
-2.350
.019
Organizational Membership Sports Organization
.027***
.007
.078
3.838
.000
Religious Organization
.006
.007
.017
.821
.412
Union
.075***
.008
.173
8.909
.000
Neighborhood Association
.043***
.008
.117
5.459
.000
PTA
.027***
.007
.076
3.681
.000
Social Trust
.032***
.007
.082
4.372
.000
Political Attitudes Interest in Politics†
-.020***
.004
-.123
-5.455
.000
Importance of Politics†
-.009**
.004
-.052
-2.345
.019
Group Mexican (=1)
-.020
.014
-.057
-1.340
.180
Mexican-American (=1)
-.034***
.009
-.092
-3.745
.000

44
Adjusted R2 = .27
F = 51.147
sig.=.000
N = 2191
Table A3
Unstandardized Coefficients
Standardized Coefficients
Variable Dependent variable= Participation Mean, actual and potential
B
s.e.
Beta
t
significance
Constant
.657***
.067
9.857
.000
Demographic and Socioeconomic Age
-.003***
.000
-.106
-5.471
.000
Gender
-.038**
.014
-.048
-2.640
.008
Education
.010***
.002
.097
4.480
.000
Religiosity†
.022***
.006
.068
3.696
.000
Index of Material Possessions
.021***
.006
.134
3.621
.000
Urbanization
-.005
.006
-.015
-.809
.419
Social Capital Television
-.009**
.004
-.042
-2.344
.019
Organization Mean
.342***
.028
.243
12.129
.000
Social Trust
.050**
.017
.053
2.928
.003
Political Attitudes Interest in Politics†
-.062***
.008
-.159
-7.386
.000
Importance of Politics†
-.047***
.009
-.116
-5.398
.000
Group Mexican (=1)
-.103***
.032
-.130
-3.187
.001
Mexican-American (=1)
-.090***
.020
-.102
-4.409
.000
Adjusted R2 = .32
F = 81.700
sig.=.000
N = 2191
*significant at .10 level; **sig. at .05 level; ***sig. at .001 level. †inverse scale

45
Table A4
Unstandardized
Coefficients
Standardized Coefficients
Dependent variable= Participation Mean, actual and potential
B
s.e.
Beta
t
significance
Constant
.681***
.067
10.155
.000
Demographic and Socioeconomic Age
-.003***
.000
-.109
-5.508
.000
Gender
-.029*
.015
-.036
-1.945
.052
Education
.009***
.002
.088
4.072
.000
Religiosity†
.017**
.006
.052
2.758
.006
Index of Material Possessions
.022***
.006
.141
3.839
.000
Urbanization
-.006
.006
-.019
-1.034
.301
Social Capital Television
-.010**
.004
-.044
-2.476
.013
Organizational Membership Sports Organization
.070***
.016
.085
4.358
.000
Religious Organization
.029*
.016
.037
1.802
.072
Union
.174***
.019
.168
9.081
.000
Neighborhood Association
.062***
.018
.070
3.410
.001
PTA
.041**
.017
.049
2.474
.013
Social Trust
.052**
.017
.054
3.046
.002
Political Attitudes Interest in Politics†
-.062***
.008
-.161
-7.516
.000
Importance of Politics†
-.046***
.009
-.113
-5.290
.000
Group Mexican (=1)
-.105***
.032
-.132
-3.243
.001
Mexican-American (=1)
-.083***
.021
-.094
-4.002
.000

46
Adjusted R2 = .33
F = 65.485
sig.=.000
N = 2191
Works Cited
Almond, Gabriel A., and Sidney Verba. 1963. The Civic Culture: Political Attitudes and Democracy in Five Nations. Princeton: Princeton University Press. Asher, Herbert B., Bradley M. Richardson, and Herbert F. Weisberg. 1984. Political Participation. Frankfurt: Campus Verlag. Booth, John A., and Mitchell A. Seligson. 1983. “The Political Culture of Authoritarianism in Mexico: A Reexamination.” Latin American Research Review, 19, 1: 106-124. Brady, Henry E., Sidney Verba, and Kay Lehman Schlozman. 1995. “Beyond SES: A Resource Model of Political Participation.” American Political Science Review, 89, 2 (June): 271-94. Camp, Roderic A., ed. 2001. Democracy through Latin American Lenses. Pittsburgh: University of Pittsburgh Press.
Cornelius, Wayne A. 1975. Politics and the Migrant Poor in Mexico City. Stanford: Stanford University Press. Craig, Ann L., and Wayne A. Cornelius. 1980. “Political Culture in Mexico: Continuities and Revisionist Interpretations.” In The Civic Culture Revisited, ed. Gabriel A. Almond and Sidney Verba. Boston: Little, Brown. Craig, Ann L. and Joe Foweraker. Eds. 1990. Popular Movements and Political Change in Mexico. Boulder: Lynne Rienner. Garcia, John A. 1997. “Political Participation: Resources and Involvement among Latinos in the American Political System.” In F. Chris Garcia (ed.), Pursuing Power: Latinos and the Political System. Notre Dame: University of Notre Dame Press. Hero, Rodney, F. Chris Garcia, John Garcia, and Harry Pachon. 2000. “Latino Participation, Partisanship, and Office Holding.” PS: Political Science and Politics, 33, 3 (September): 529-34. McDonough, Peter, Doh C. Shin, and JosJ ; lvaro MoisJs. 1998. “Democratization and Participation: Comparing Spain, Brazil, and Korea.” Journal of Politics, 60, 4 (November): 919-53. Nie, Norman H., G. Bingham Powell, and Kenneth Prewitt. 1969. “Social Structure and Political Participation: Developmental Relationships.” American Political Science Review, 63: 361-78, 808-32. Putnam, Robert D. 1993. Making Democracy Work: Civic Traditions in Modern Italy. Princeton:

47
Princeton University Press. Putnam, Robert D. 1995. “Tuning In, Tuning Out: The Strange Disappearance of Social Capital in America.” PS: Political Science and Politics, 28, 4 (December). Putnam, Robert D. 2000. Bowling Alone: The Collapse and Revival of American Community. New York: Simon and Schuster. Rodríguez, Victoria. 1997. Decentralization in Mexico: From Reforma Municipal to Solidaridad to Nuevo Federalismo. Boulder: Westview. Seligson, Amber. 1999. “Civic Association and Democratic Participation in Central America: A Test of the Putnam Thesis.” Comparative Political Studies, 32, 3 (May): 342-62. Verba, Sidney, and Norman H. Nie. 1972. Participation in America. New York: Harper and Row. Verba, Sidney, Norman H. Nie, and Jae-On Kim. 1971. The Modes of Democratic Participation: A Cross-National Analysis. Beverly Hills: Sage Professional Papers in Comparative Politics, no. 01-013. Verba, Sidney, Norman H. Nie, and Jae-On Kim. 1978. Participation and Political Equality. Cambridge: Cambridge University Press. Verba, Sidney, Kay Lehman Schlozman, and Henry E. Brady. 1995. Voice and Equality: Civic Voluntarism in Amercan Politics. Cambridge: Harvard University Press. Verba, Sidney, Kay Lehman Schlozman, Henry E. Brady, and Norman H. Nie. 1993. “Race, Ethnicity and Political Resources: Participation in the United States.” British Journal of Political Science, 23: 453-97.
48
Notes
1 English has no equivalent to estadounidense (as if that were a satisfactory term to refer
to those who live in the United States). Hence, I will use the term ?North American? to refer to
the general U.S. population, understanding as I do that Mexicans and Canadians have every right
to object to the appropriation of the term which is, at least, more specific than ?American.?
2See the review of factors shaping Mexican political participation in Craig and Cornelius
(1980), esp. pp. 362-71.
3The recent resurgence of attention to political culture suggests that many scholars regard
attitudinal factors as central determinants of political behavior.
4The Democracy through Mexican Lenses survey was given to 1204 randomly selected
respondents in Mexico and 1506 respondents in the United States in September 2000. The U.S.
sample includes 755 Mexican-Americans or Mexicans resident in the U.S. and 751 from the
general U.S. population. In addition, 445 Mexicans living near the U.S. border were added to the
study as an oversample to allow statistically meaningful comparisons of those living near the
border and other groups in the overall sample. For simplicity, I will refer to both Mexican-
Americans and Mexicans resident in the U.S. as Mexican-Americans.
5The modes of political participation about which this survey asked thus differ from those
posed by Verba and his collaborators. Their modes of participation are identified as campaign
activity, voting, communal activity, and citizen-initiated contacting. E.g., see Verba and Nie
(1972). They thus focus more heavily on activities that would be regarded as democratic acts
49
(voting, participating in a campaign, attending a rally) than I can. The Democracy through
Mexican Lenses questionnaire directed attention to a variety of behaviors that can be undertaken
in both democratic and non-democratic regimes, with an emphasis on protest-oriented activities.
6The survey did ask those respondents living in Mexico but near the border and Mexicans
resident in the United States whether they were able to vote and who they had voted for in July
2000.
7Lack of citizenship is the greatest constraint to voter turnout among Mexican-Americans,
as John A. Garcia (1997) has shown.
8For an argument about the need to transcend socioeconomically-based arguments about
political participation, see Brady, Schlozman, and Verba 1995.
9The zero-order Pearson correlation coefficient between the mean of the participation
variables for actual participation (where 1.0 would equal having participated in all forms of
political activity and 0.0 would equal no political participation at all) and years lived in the US
was .091; the coefficient measuring correlation between the mean of actual and potential
participation (where 2.0 would equal having participated in all forms of political activity and 0.0
would equal neither participating nor indicating any desire to do so) and years lived in the US was
.113. Both coefficients are significant at the .05 level.
10See the discussion in Asher, Richardson, and Weisberg, 1984: 48-49.
11Figure 5 illustrates an index of organization membership constructed by giving each
respondent one point for an affirmative response to the question of whether he belonged to each

50
type of organization? sports team or organization, religiously-based organization, union,
neighborhood association, political organization, or the PTA (Padres de Familia in Mexico). The
organization index thus ranges from 0 to 6. The mean number of organizational memberships for
the US and Mexico combined was 1.67. For the total US sample, it was 1.78, compared to 1.22
for the Mexican sample. Mexican-Americans mean score on the organization index was 1.70,
compared to 1.83 for the general US sample. Those Mexicans in the oversample from the border
region had a 1.09 mean number of organizational memberships.
12Ordinary least-squares regression, using pair-wise deletion. The alternative index of
participation used for the multiple regression analysis was constructed by coding each form of
participation as 1 if the respondent reported having participated, 0 if not (even if the respondent
indicated that she might participate) and then calculating the mean of those participation variables.
The index thus ranges from 0 (no participation) to 1 (those participating in all modes of political
activity).
13The survey had no single measure of income that could apply to respondents in both
countries. It did ask whether respondents possessed particular consumer durables, homes, and
other major possessions indicative of wealth (coded 1 if the respondent has the item, 0 if not).
The index was produced by adding the responses on those items.
14The index of organizational membership used in this multiple regression estimatation was
constructed in the same way as the alternative index of participation: each membership category
was coded 1 if the respondent reported membership, 0 if not, and the mean of the categories was
calculated. The index thus ranges from 0 (membership in no organizations) to 1 (membership in

51
at least one organization in each category).
15A number of recent studies of political participation, both within the United States
(Verba, Schlozman, Brady, and Nie 1993) and in comparative perspective (McDonough, Shin,
and Moisés 1998), have pointed to the role of organized religion in promoting political activism.
Those studies generally conclude, however, that the context and the type of church with which
one is associated matter significantly in determining whether church membership and/or frequency
of attending religious services will promote or discourage political participation.
16In this case, the participation questions are recoded so that any reported participation is
coded 2, the answer “might participate” is coded 1, and the response “would never participate” is
coded zero. The index is created by calculating the mean of the seven types of participation. The
index thus ranges from 0 to 2. Regressing the full set of variables reported in Table 10 on this
index that incorporates potential and actual participation yielded roughly the same results as when
the index that only measured actual participation was used as the dependent variable, hence I am
not reporting those estimates.
17The statistical insignificance of the religious organization variable may be due to
collinearity with the variable measuring the frequency of church attendance (labeled “religiosity”).
18The finding that almost all organizational memberships promote political participation is
at variance with the conclusions of a recent study of political activism in Central America
conducted by Amber Seligson (1999), who found that involvement only in community
development organizations consistently predicted demand making in the six nations of Central

52
America.