political, demographic, and institutional …
TRANSCRIPT

POLITICAL, DEMOGRAPHIC, AND INSTITUTIONAL CLASSIFICATIONS ATLASOF AFRICAN AGRICULTURE RESEARCH & DEVELOPMENT
POLITICAL, DEMOGRAPHIC, AND INSTITUTIONAL CLASSIFICATIONS
Administrative Boundaries � � � � � � � � � � � � � � � � � � � � � � � � � � � � � � � � � � � � � � � � � � � � � � � � � � � � � 2
Statistical Groupings � � � � � � � � � � � � � � � � � � � � � � � � � � � � � � � � � � � � � � � � � � � � � � � � � � � � � � � � � � � � 4
Public Agriculture R&D Investments � � � � � � � � � � � � � � � � � � � � � � � � � � � � � � � � � � � � � � � � � 6
Africa’s Agricultural Research Pool � � � � � � � � � � � � � � � � � � � � � � � � � � � � � � � � � � � � � � � � � � � 8
CGIAR Research Program on Dryland Systems � � � � � � � � � � � � � � � � � � � � � � � � � � � 10
Works Cited � � � � � � � � � � � � � � � � � � � � � � � � � � � � � � � � � � � � � � � � � � � � � � � � � � � � � � � � � � � � � � � � � � � � � 12
1

POLITICAL, DEMOGRAPHIC, AND INSTITUTIONAL CLASSIFICATIONS
Administrative BoundariesKate Sebastian
WHAT IS THIS MAP TELLING US? The most common ways to present data for research, demo-graphic, political, and other reporting purposes is by admin-istrative unit or the unit of measure that recognizes the political boundaries and area of a country� The map shows Africa divided into nation equivalent (zero-level) units� The majority of these zero-level units represent countries that are further divided into smaller subnational (first-level) units, such as departments or states, which vary in size and num-ber per country�
Drawing boundary lines is often easier said than done� Discrepancies occasionally occur due to faulty input data or, on occasion, disputed land areas� An example of this is the Hala’ib Triangle, a small area of land over which both Egypt and Sudan claim sovereignty� Most of the reporting in this atlas is done at a regional level and both Egypt and Sudan fall in the northern region so the regional reporting is not affected� Additionally, South Sudan gained its independence as a country in 2011 so it is shown separately on the maps unless the data reported are country-level statistical data that predate 2011� In such cases South Sudan is not separately designated (for example, p� 75)�
WHY IS THIS IMPORTANT?As more aid is dispensed and research decisions are made based on the visualization and mapping of data, it is increas-ingly important that the boundaries be both accurate and precise� In creating this atlas, for consistency’s sake, it was imperative that each map use the same administra-tive boundaries� There are a number of publicly available worldwide boundary datasets but the Food and Agriculture Organization of the United Nations’ (FAO) Global Administrative Unit Layers (GAUL) is the standard used in the atlas, because it constantly revises and updates adminis-trative boundaries to present the most up-to-date data avail-able, and it has the highest boundary accuracy rate for the developing countries of Africa (Figure 1) when compared to the Global Administrative Boundaries (GADM) and the UN’s Second Administrative Level Boundaries� Using con-sistent boundaries allows users to easily compare data by region and even identify patterns� For example, a quick look at cropland area by region (p� 16) and the average value of staple food crop production by region (p� 30) shows that southern Africa not only has the smallest share of total area devoted to cropland but also the lowest productivity�
Knowing that the same boundaries were used across the maps gives the reader confidence that these values are based on the same area totals and thus can be analyzed together�
WHAT ABOUT THE UNDERLYING DATA?GAUL country boundaries and disputed areas are from the UN Cartographic Section (FAO 2013)� The secondary boundaries are based on information gathered from both international and national sources� Data are continuously being updated and corrected and are released yearly� The data are licensed strictly for noncommercial use by FAO, which cannot be held accountable for the accuracy, reliabil-ity, or content of the information provided� This is important to note due to the political nature of the data� Thus, by pre-senting these boundaries, FAO, and subsequently the orga-nizations involved in this atlas, are not expressing an opinion concerning the legal status of any area or its authorities or concerning the delimitation of its boundaries�
WHERE CAN I LEARN MORE?
GAUL 2013 boundaries: www�fao�org/geonetwork/
GADM boundaries: www�gadm�org
UNSALB boundaries: http://bit�ly/RJ12kD
FIGURE 1 Accuracy of different administrative boundary datasets
0
5
10
15
20
25
30
35
Num
ber
of c
ount
ries
wit
h co
rrec
t sub
nati
onal
bou
ndar
ies
UNSALBGADM ADM1
& GADM ADM2
GAUL ADM1
& GAUL ADM2
GADM ADM2
GAUL ADM1
Source: Adapted from Brigham, Gilbert, and Xu 2013.Note: GADM = Global Administrative Boundaries; GAUL = Global Administra-tive Unit Layers (FAO); UNSALB = UN Second Administrative Level Boundaries; ADM1 = First-level administrative boundaries; ADM2 = Second-level administrative boundaries.
2

Data source: FAO 2013.
POLITICAL, DEMOGRAPHIC, AND INSTITUTIONAL CLASSIFICATIONS ATLASOF AFRICAN AGRICULTURE RESEARCH & DEVELOPMENT
Algeria
LibyaEgypt
MaliMauritania
Morocco
Tunisia
Niger
Nigeria
Chad
BeninTogo
São Tomé and Principe
Seychelles
Ghana
Senegal
Guinea�eGambia
Sudan
SouthSudan
Liberia
SierraLeone
Guinea-Bissau
WesternSahara
Central AfricanRepublic
Democratic Republic
of the Congo
Ethiopia
Eritrea
Djibouti
Somalia
KenyaUganda
Tanzania
Rwanda
BurundiRepublic of Congo
EquatorialGuinea
Gabon
Côte d’Ivoire
Cameroon
AngolaZambia
Malawi
Zimbabwe
BotswanaNamibia
South Africa
Mozambique
Lesotho
Swaziland
Mad
agas
car
BurkinaFaso
Comoros
Country boundaries
First-level boundaries
Contested areas
MAP 1 Country and first-level administrative boundaries
3
POLITICAL, DEMOGRAPHIC, AND INSTITUTIONAL CLASSIFICATIONS
Statistical GroupingsStanley Wood and Kate Sebastian
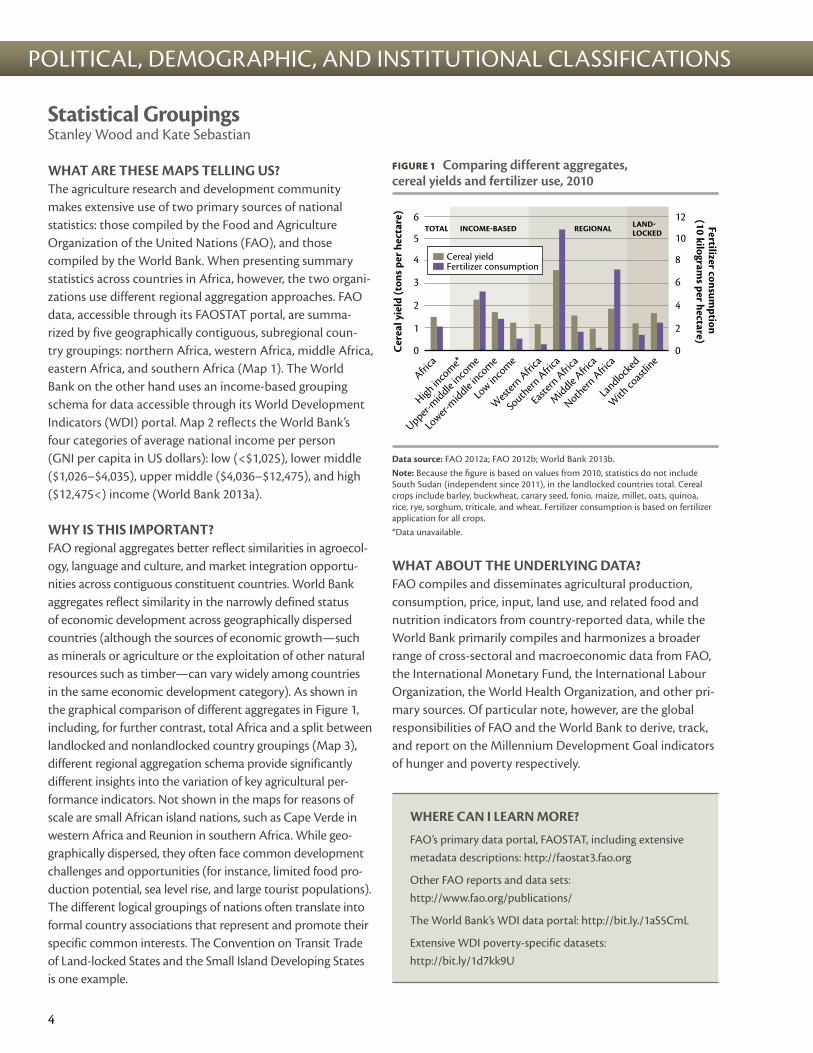
WHAT ARE THESE MAPS TELLING US?The agriculture research and development community makes extensive use of two primary sources of national statistics: those compiled by the Food and Agriculture Organization of the United Nations (FAO), and those compiled by the World Bank� When presenting summary statistics across countries in Africa, however, the two organi-zations use different regional aggregation approaches� FAO data, accessible through its FAOSTAT portal, are summa-rized by five geographically contiguous, subregional coun-try groupings: northern Africa, western Africa, middle Africa, eastern Africa, and southern Africa (Map 1)� The World Bank on the other hand uses an income-based grouping schema for data accessible through its World Development Indicators (WDI) portal� Map 2 reflects the World Bank’s four categories of average national income per person (GNI per capita in US dollars): low (<$1,025), lower middle ($1,026–$4,035), upper middle ($4,036–$12,475), and high ($12,475<) income (World Bank 2013a)�
WHY IS THIS IMPORTANT?FAO regional aggregates better reflect similarities in agroecol-ogy, language and culture, and market integration opportu-nities across contiguous constituent countries� World Bank aggregates reflect similarity in the narrowly defined status of economic development across geographically dispersed countries (although the sources of economic growth—such as minerals or agriculture or the exploitation of other natural resources such as timber—can vary widely among countries in the same economic development category)� As shown in the graphical comparison of different aggregates in Figure 1, including, for further contrast, total Africa and a split between landlocked and nonlandlocked country groupings (Map 3), different regional aggregation schema provide significantly different insights into the variation of key agricultural per-formance indicators� Not shown in the maps for reasons of scale are small African island nations, such as Cape Verde in western Africa and Reunion in southern Africa� While geo-graphically dispersed, they often face common development challenges and opportunities (for instance, limited food pro-duction potential, sea level rise, and large tourist populations)� The different logical groupings of nations often translate into formal country associations that represent and promote their specific common interests� The Convention on Transit Trade of Land-locked States and the Small Island Developing States is one example�
WHAT ABOUT THE UNDERLYING DATA?FAO compiles and disseminates agricultural production, consumption, price, input, land use, and related food and nutrition indicators from country-reported data, while the World Bank primarily compiles and harmonizes a broader range of cross-sectoral and macroeconomic data from FAO, the International Monetary Fund, the International Labour Organization, the World Health Organization, and other pri-mary sources� Of particular note, however, are the global responsibilities of FAO and the World Bank to derive, track, and report on the Millennium Development Goal indicators of hunger and poverty respectively�
WHERE CAN I LEARN MORE?
FAO’s primary data portal, FAOSTAT, including extensive metadata descriptions: http://faostat3�fao�org
Other FAO reports and data sets: http://www�fao�org/publications/
The World Bank’s WDI data portal: http://bit�ly�/1aS5CmL
Extensive WDI poverty-specific datasets: http://bit�ly/1d7kk9U
FIGURE 1 Comparing different aggregates, cereal yields and fertilizer use, 2010
0
1
2
3
4
5
6
0
2
4
6
8
10
12
Africa
High inco
me*
Upper-middle
income
Lower-
middle inco
me
Low in
come
West
ern A
frica
South
ern A
frica
Eastern
Afric
a
Middle
Africa
Nothern
Afric
a
Landlock
ed
With
coast
line
Cer
eal y
ield
(ton
s per
hec
tare
)
Fertilizer consumption
(10 kilograms per hectare)
Cereal yieldFertilizer consumption
INCOMEBASEDTOTAL REGIONAL LANDLOCKED
Data source: FAO 2012a; FAO 2012b; World Bank 2013b.Note: Because the figure is based on values from 2010, statistics do not include South Sudan (independent since 2011), in the landlocked countries total. Cereal crops include barley, buckwheat, canary seed, fonio, maize, millet, oats, quinoa, rice, rye, sorghum, triticale, and wheat. Fertilizer consumption is based on fertilizer application for all crops.*Data unavailable.
4
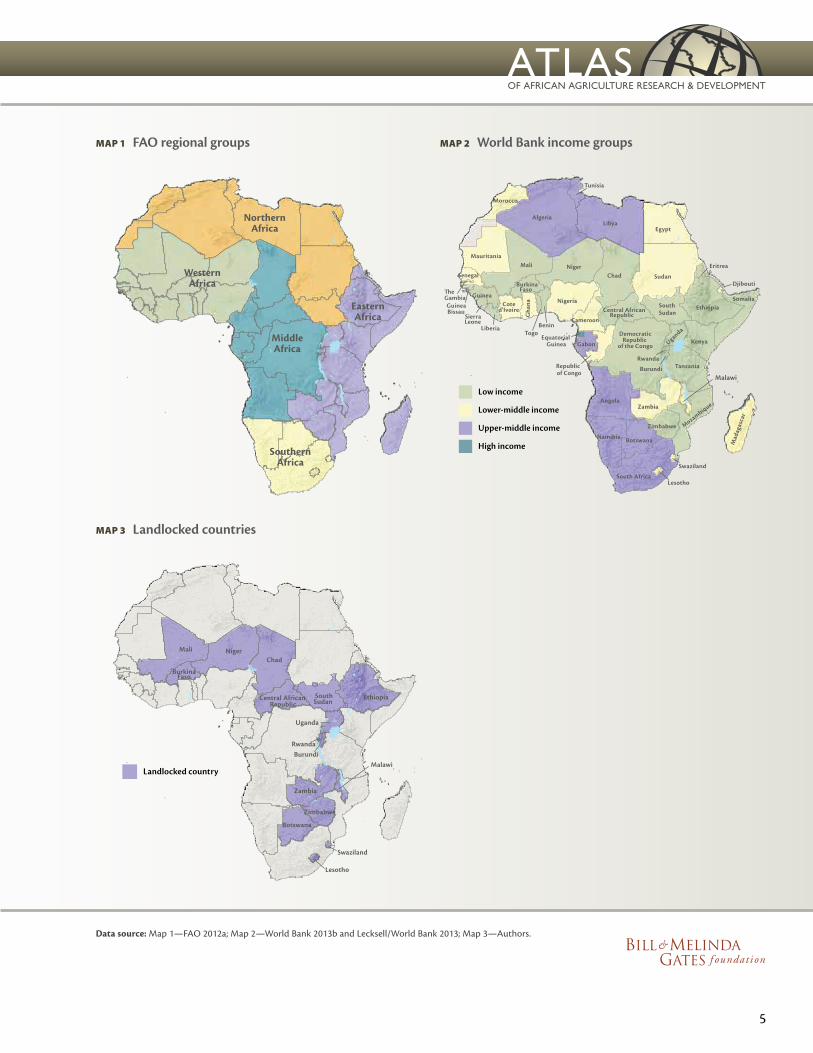
Data source: Map 1—FAO 2012a; Map 2—World Bank 2013b and Lecksell/World Bank 2013; Map 3—Authors.
POLITICAL, DEMOGRAPHIC, AND INSTITUTIONAL CLASSIFICATIONS ATLASOF AFRICAN AGRICULTURE RESEARCH & DEVELOPMENT
WesternAfrica
NorthernAfrica
EasternAfrica
MiddleAfrica
SouthernAfrica
AlgeriaLibya
Egypt
MaliMauritania
Morocco
Tunisia
Niger
Nigeria
Chad
BeninTogo
Gha
na
Senegal
Guinea�eGambia
Sudan
SouthSudan
Liberia
SierraLeone
GuineaBissau Central African
RepublicEthiopia
Eritrea
Somalia
Djibouti
KenyaUganda
TanzaniaRwanda
BurundiRepublic
DemocraticRepublic
of the Congo
of Congo
EquatorialGuinea Gabon
Cameroon
AngolaZambia
Zimbabwe
BotswanaNamibia
South Africa
Mozambique
Lesotho
Swaziland
Mad
agas
car
Coted'Ivoire
BurkinaFaso
Malawi
Mali NigerChad
Ethiopia
Uganda
RwandaBurundi
Zambia
Zimbabwe
Botswana
Lesotho
Swaziland
SouthSudanCentral African
Republic
BurkinaFaso
Malawi
Low income
Lower-middle income
Upper-middle income
High income
Landlocked country
R180G46B52
R154G58B32
R255G204B104
R52G51B22
R227G137B27
R198G113B41
MAP 1 FAO regional groups MAP 2 World Bank income groups
MAP 3 Landlocked countries
5

POLITICAL, DEMOGRAPHIC, AND INSTITUTIONAL CLASSIFICATIONS
Public Agriculture R&D InvestmentsGert-Jan Stads, Nienke Beintema, and Kathleen Flaherty
WHAT ARE THESE MAPS TELLING US?Growth in public agriculture research and development (R&D) spending levels in Africa south of the Sahara (SSA) varied widely from 2008 to 2011 (Map 1)� Continent- wide growth was driven by a handful of larger countries� However, 13 of the 39 countries for which Agricultural Science and Technology Indicators (ASTI) data are avail-able experienced negative annual growth in public agricul-tural R&D spending during 2008/09–2011�1 Another way of comparing commitment to public agricultural R&D invest-ment across countries is to measure intensity (Map 2)—that is, total public agricultural R&D spending as a percentage of agricultural output (AgGDP)� Overall investment lev-els in most countries are still well below the levels required to sustain agricultural R&D needs� In 2011, SSA as a whole invested 0�51 percent of AgGDP on average� Just 10 of the 39 countries met the investment target of one percent of AgGDP set by the African Union’s New Partnership for Africa’s Development (NEPAD)� Some of the smallest coun-tries in Africa, such as Lesotho, Swaziland, Burundi, Eritrea, and Sierra Leone, have such low and declining levels of investment that the effectiveness of their national agricul-tural R&D is questionable� In addition, compared with other developing regions, agricultural R&D is highly dependent on funding from donor organizations and development banks such as the World Bank (Figure 1)� This type of funding has been highly volatile over time, leaving research programs vul-nerable and making long-term planning difficult�
WHY IS THIS IMPORTANT?A closer look at growth in public agricultural R&D invest-ment levels over time reveals important cross-country differ-ences and challenges� While the intensity ratio of investment (measured as a share of AgGDP) provides a relative measure of a country’s commitment to agricultural R&D, monitoring investments is also key to understanding agriculture R&D’s contribution to agricultural growth� Research managers and policymakers can use agricultural R&D spending information to formulate policies and make decisions about strategic plan-ning, priority setting, monitoring, and evaluation� The data are also needed to assess the progress of the Comprehensive Africa Agriculture Development Program (CAADP), which is designed to boost investments in agricultural growth through research, extension, education, and training�
WHAT ABOUT THE UNDERLYING DATA?The data are from primary surveys of 39 countries in SSA conducted during 2012–2013 by ASTI and national partners� ASTI provides comprehensive datasets on agricultural R&D investment and capacity trends and institutional changes in low- and middle-income countries� The datasets are updated at regular intervals and accessible online�
WHERE CAN I LEARN MORE?
ASTI datasets, publications, and other outputs by country: www�asti�cgiar�org/countries
ASTI methodology and data collection procedures: www�asti�cgiar�org/methodology
FIGURE 1 Donor funding as a share of total agriculture R&D funding, 2011
0 10 20 30 40 50 60 70 80
MadagascarMali
Burkina FasoMozambique
RwandaEritreaLiberiaMalawiSenegal
�e GambiaBenin
BurundiCentral Afr Rep
MauritaniaTogo
EthiopiaTanzania
UgandaMauritius
Congo, Dem RepGuinea-Bissau
GuineaKenya
Côte d'IvoireSudan
Percent
Source: ASTI 2013.Note: Donor funding includes loans from development banks and funding from subregional organizations. Figure excludes countries with donor shares of less than 5 percent.
1 Due to scale, not all ASTI countries are visible on the maps.
6
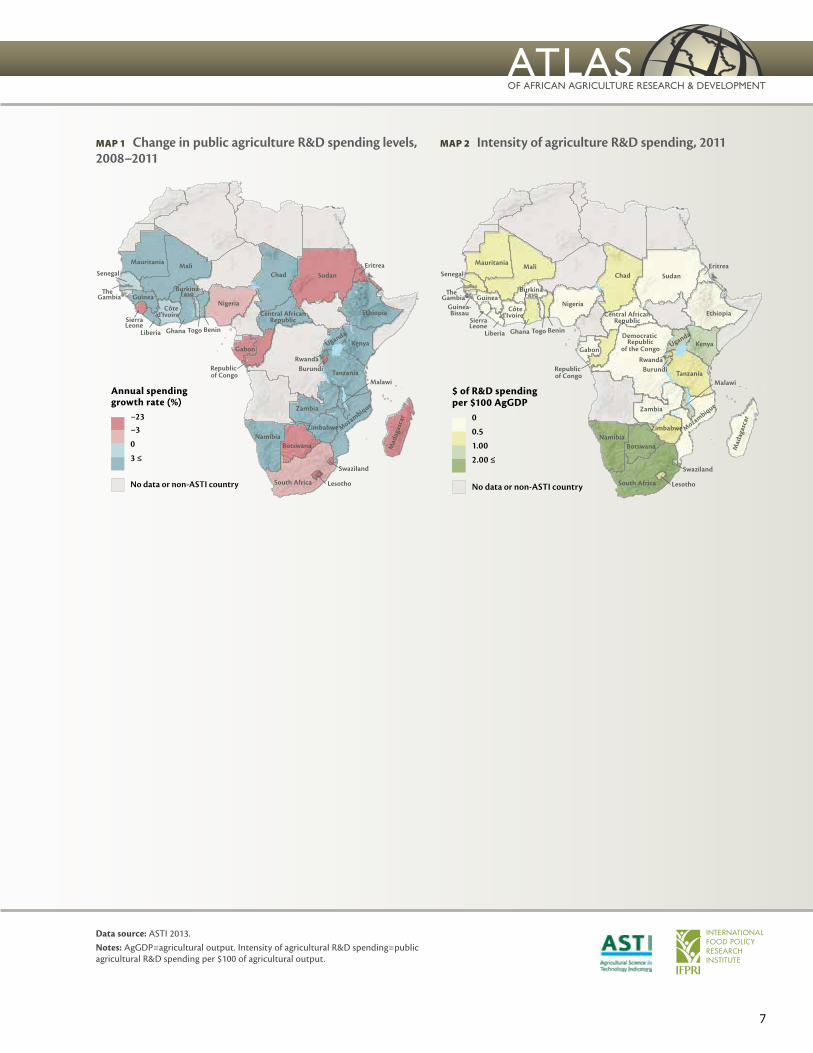
Data source: ASTI 2013. Notes: AgGDP=agricultural output. Intensity of agricultural R&D spending=public agricultural R&D spending per $100 of agricultural output.
POLITICAL, DEMOGRAPHIC, AND INSTITUTIONAL CLASSIFICATIONS ATLASOF AFRICAN AGRICULTURE RESEARCH & DEVELOPMENT
MaliMauritania
Chad
BeninTogoGhana
Senegal
GuineaGambia
Sudan
Liberia
Ethiopia
Eritrea
KenyaUganda
Tanzania
RwandaBurundi
Gabon
Zambia
Malawi
Zimbabwe
BotswanaNamibia
South Africa
Mozambique
Lesotho
Swaziland
Mad
agas
car
Côted'Ivoire
SierraLeone
Central AfricanRepublic
Republicof Congo
BurkinaFaso�e
Nigeria
MaliMauritania
Chad
BeninTogoGhana
Senegal
GuineaGambia
Sudan
Liberia
Ethiopia
Eritrea
KenyaUganda
Tanzania
RwandaBurundi
Gabon
Zambia
Malawi
Zimbabwe
BotswanaNamibia
South Africa
Mozambique
Lesotho
Swaziland
Mad
agas
car
Côted'Ivoire
SierraLeone
Guinea-Bissau Central African
Republic
Republicof Congo
Democratic Republic
of the Congo
BurkinaFaso�e
Nigeria
−3−23
0
3 ≤
No data or non-ASTI country
Annual spending growth rate (%)
0
0.5
2.00 ≤
1.00
No data or non-ASTI country
$ of R&D spending per $100 AgGDP
INTERNATIONAL FOOD POLICY RESEARCH INSTITUTE
IFPRI
MAP 1 Change in public agriculture R&D spending levels, 2008–2011
MAP 2 Intensity of agriculture R&D spending, 2011
7
POLITICAL, DEMOGRAPHIC, AND INSTITUTIONAL CLASSIFICATIONS
Africa’s Agricultural Research PoolNienke Beintema, Gert-Jan Stads, and Kathleen Flaherty
WHAT ARE THESE MAPS TELLING US?Absolute levels of staffing in public agriculture research and development (R&D) vary considerably across the 39 countries in Africa south of the Sahara participat-ing in the Agricultural Science and Technology Indicator (ASTI) survey (Map 1)� In 2011, Ethiopia, Ghana, Kenya, Nigeria, South Africa, Sudan, and Tanzania each employed more than 500 full-time equivalent (FTE) researchers� In contrast, 11 countries employed fewer than 100 FTE researchers each�1 Despite recent challenges, many west-ern African countries have maintained relatively large pools of well-qualified researchers (those holding PhD and MSc degrees) (Map 2)� In contrast, less than half of researchers in Botswana, the Democratic Republic of the Congo, Eritrea, Ethiopia, Guinea, Guinea-Bissau, Lesotho, Liberia, Mozambique, and Zimbabwe hold graduate degrees� Map 3 shows the number of FTE researchers per 100,000 people who are economically active in agricul-ture� While the overall average for ASTI countries is 7 FTE researchers per 100,000, only Botswana, Cape Verde, Gabon, Mauritius, Namibia, Nigeria, and South Africa each employ more than 20 FTEs per 100,000 agriculture sector workers�
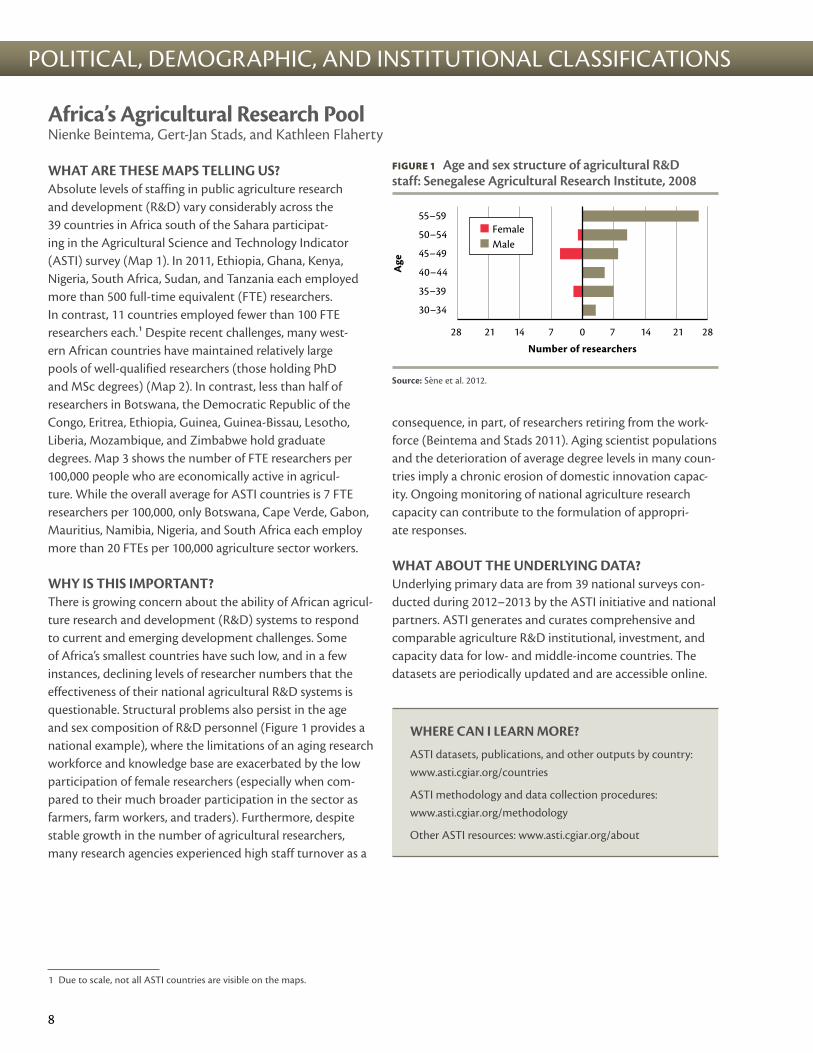
WHY IS THIS IMPORTANT?There is growing concern about the ability of African agricul-ture research and development (R&D) systems to respond to current and emerging development challenges� Some of Africa’s smallest countries have such low, and in a few instances, declining levels of researcher numbers that the effectiveness of their national agricultural R&D systems is questionable� Structural problems also persist in the age and sex composition of R&D personnel (Figure 1 provides a national example), where the limitations of an aging research workforce and knowledge base are exacerbated by the low participation of female researchers (especially when com-pared to their much broader participation in the sector as farmers, farm workers, and traders)� Furthermore, despite stable growth in the number of agricultural researchers, many research agencies experienced high staff turnover as a
consequence, in part, of researchers retiring from the work-force (Beintema and Stads 2011)� Aging scientist populations and the deterioration of average degree levels in many coun-tries imply a chronic erosion of domestic innovation capac-ity� Ongoing monitoring of national agriculture research capacity can contribute to the formulation of appropri-ate responses�
WHAT ABOUT THE UNDERLYING DATA?Underlying primary data are from 39 national surveys con-ducted during 2012–2013 by the ASTI initiative and national partners� ASTI generates and curates comprehensive and comparable agriculture R&D institutional, investment, and capacity data for low- and middle-income countries� The datasets are periodically updated and are accessible online�
WHERE CAN I LEARN MORE?
ASTI datasets, publications, and other outputs by country: www�asti�cgiar�org/countries
ASTI methodology and data collection procedures: www�asti�cgiar�org/methodology
Other ASTI resources: www�asti�cgiar�org/about
FIGURE 1 Age and sex structure of agricultural R&D staff: Senegalese Agricultural Research Institute, 2008
28 21 14 7 0 7 14 21 28
30–34
35–39
40–44
45–49
50–54
55–59FemaleMale
Age
Number of researchers
Source: Sène et al. 2012.
1 Due to scale, not all ASTI countries are visible on the maps.
8

Data source: Maps 1 and 2—ASTI 2013; Map 3— ASTI 2013 and FAO 2013.Notes: Maps 1 and 3—FTE = full-time equivalent. FTE values take into account only the proportion of time spent on research and development; Map 2—Researchers with postgraduate degrees earned PhDs or MScs; Map 3—Farmers include all agricultural sector workers.
POLITICAL, DEMOGRAPHIC, AND INSTITUTIONAL CLASSIFICATIONS ATLASOF AFRICAN AGRICULTURE RESEARCH & DEVELOPMENT
MaliMauritaniaNiger
Chad
BeninTogoGhana
GuineaGambia
Sudan
Liberia
Ethiopia
Eritrea
KenyaUganda
Tanzania
RwandaBurundi
Gabon
Zambia
Malawi
Zimbabwe
BotswanaNamibia
South Africa
Mozambique
Lesotho
Swaziland
Mad
agas
car
Democratic Republic
of the Congo
Côted'Ivoire
SierraLeone
Guinea-Bissau Central African
Republic
Republicof Congo
BurkinaFaso�e
Nigeria
SenegalMaliMauritania
Chad
BeninTogoGhana
GuineaGambia
Sudan
Liberia
Ethiopia
Eritrea
KenyaUganda
Tanzania
RwandaBurundi
Gabon
Malawi
Zimbabwe
BotswanaNamibia
Mozambique
Lesotho
Swaziland
Mad
agas
car
Democratic Republic
of the Congo
SierraLeone
Guinea-Bissau Central African
Republic
Republicof Congo
BurkinaFaso�e
Nigeria
Senegal
MaliMauritaniaNiger
Chad
BeninTogoGhana
GuineaGambia
Sudan
Liberia
Ethiopia
Eritrea
KenyaUganda
Tanzania
RwandaBurundi
Gabon
Zambia
Malawi
Zimbabwe
BotswanaNamibia
South Africa
Mozambique
Lesotho
Swaziland
Mad
agas
car
Democratic Republic
of the Congo
Côted'Ivoire
SierraLeone
Guinea-Bissau Central African
Republic
Republicof Congo
BurkinaFaso�e
Nigeria
Senegal
0100200500 ≤
No data or non-ASTI country
Total FTE researchers0507590 ≤
No data or non-ASTI country
Percent of total
2102040 ≤
No data or non-ASTI country
FTEs per 100,000 farmers
INTERNATIONAL FOOD POLICY RESEARCH INSTITUTE
IFPRI
MAP 1 Number of agricultural researchers, 2011 MAP 2 Share of agricultural researchers with postgraduate degrees, 2011
MAP 3 Concentration of agricultural researchers, 2011
9

POLITICAL, DEMOGRAPHIC, AND INSTITUTIONAL CLASSIFICATIONS
CGIAR Research Program on Dryland SystemsChandrashekhar Biradar
WHAT IS THIS MAP TELLING US?The map shows the distribution of dryland agricultural production systems (also known as the CGIAR Research Program on Dryland Systems) in Africa� Dryland systems are characterized by low and erratic precipitation, persistent water scarcity, extreme climatic variability, high susceptibil-ity to land degradation, including desertification, and higher than average loss rates for natural resources, such as biodiver-sity� The lack of water is the main factor that limits profitable agricultural production� Dryland systems consist of combina-tions of plant and animal species and management practices farmers use to pursue livelihood goals based on several fac-tors including climate, soils, markets, capital, and tradition� Dryland Systems is a multidisciplinary research program that aligns the research of CGIAR research centers and partners� It aims to tackle complex development issues in two key stra-tegic research themes known as intermediate development outcomes (IDOs)� The first IDO focuses on low-potential and marginal drylands and developing strategies and tools to minimize risk and reduce vulnerability� The second IDO focuses on higher-potential dryland regions and supporting sustainable intensification of agricultural production systems� Within each large target area, a number of representative action sites and complementary satellite sites serve as test sites where most of the research will be conducted� These sites—which include the Kano-Katsina-Maradi Transect in Nigeria and Niger; Wa-Bobo-Sikasso Transect in Ghana, Burkina Faso, and Mali; Tolon-K and Cinzana along West African Sahel and dryland savannas in Ghana and Mali; the Nile Delta in Egypt; Béni Khedache-Sidi Bouzid inTunisia; the Ethiopian Highlands; and Chinyanja Triangle in Malawi, Zambia, and Mozambique—were identified based on crite-ria relating to aridity index, length of growing period, market access, hunger and malnutrition, poverty, environmental risk, land degradation, and demography�
WHY IS THIS IMPORTANT?The goal of the Dryland Systems research program is to iden-tify and develop resilient, diversified, and more productive
combinations of crop, livestock, rangeland, aquatic, and agroforestry systems that increase productivity, reduce hun-ger and malnutrition, and improve quality of life for the rural poor� The research program aims to reduce the vulnerabil-ity of rural communities and entire regions across the world’s dry areas by sustainably improving agricultural productivity� The map provides a starting point for implementing inter-ventions for intermediate development outcomes� It also can help researchers extrapolate from the research outcomes at action sites to target areas and scale up better interventions to target regions over time�
WHAT ABOUT THE UNDERLYING DATA? The Remote Sensing (RS)/Geographic Information Systems (GIS) Units of the participating CGIAR centers characterized dryland systems to delineate target areas, action sites, and complementary satellite sites, using various spatial layers, such as aridity index (p� 55), length of growing period (p� 57), access to markets (p� 66), environmental risk, land degradation, and additional criteria from regional and representative target region perspectives (CGIAR 2012)�
WHERE CAN I LEARN MORE?
Dryland Systems: http://drylandsystems�cgiar�org
ICARDA Geoinformatics: http://gu�icarda�org
Dryland Systems and Other CGIAR Research Programs: http://bit�ly/1eQnJdC
TABLE 1 Dryland Systems sites in Africa, 2013
Action Sites IDO1 IDO2
Area (ha) 32,861,151 60,865,568
Population 924,092 18,621,053
Households 184,818 3,724,211
Source: Author.Note: IDO = intermediate development outcomes.
10
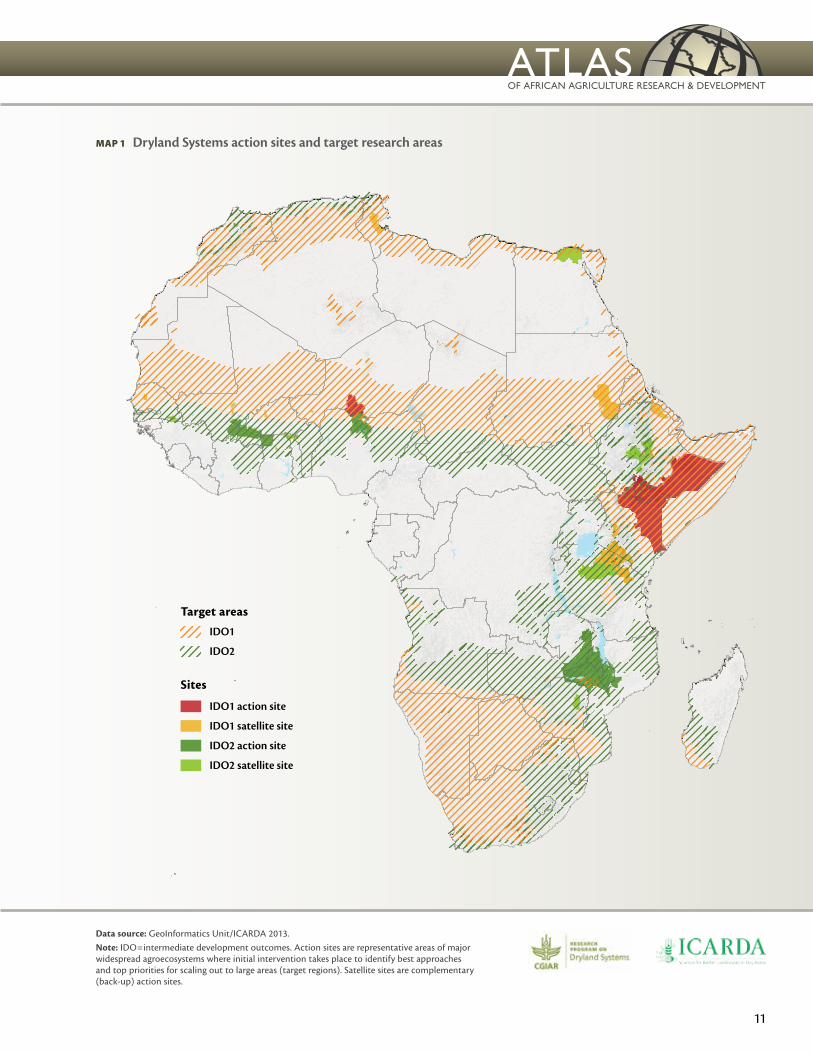
Data source: GeoInformatics Unit/ICARDA 2013.Note: IDO = intermediate development outcomes. Action sites are representative areas of major widespread agroecosystems where initial intervention takes place to identify best approaches and top priorities for scaling out to large areas (target regions). Satellite sites are complementary (back-up) action sites.
POLITICAL, DEMOGRAPHIC, AND INSTITUTIONAL CLASSIFICATIONS ATLASOF AFRICAN AGRICULTURE RESEARCH & DEVELOPMENT
IDO1
IDO2
IDO1 action site
IDO1 satellite site
IDO2 action site
IDO2 satellite site
Target areas
Sites
MAP 1 Dryland Systems action sites and target research areas
11

POLITICAL, DEMOGRAPHIC, AND INSTITUTIONAL CLASSIFICATIONS
Works CitedADMINISTRATIVE BOUNDARIESBrigham, C�, S� Gilbert, and Q� Xu� 2013� “Open Geospatial Data: An Assessment of Global
Boundary Datasets�” The World Bank� Accessed November 11, 2013� http://bit�ly/1cxvTnE�
FAO (Food and Agriculture Organization of the United Nations)� 2013� Political Boundaries: Global Administrative Unit Layers (GAUL)�” www�fao�org/geonetwork/�
STATISTICAL GROUPINGSFAO (Food and Agriculture Organization of the United Nations)� 2012a� FAOSTAT data-
base� Accessed October 15, 2012� http://faostat�fao�org/site/291/default�aspx�—� 2012b� FAOSTAT database� Accessed December 2, 2012�
http://faostat�fao�org/site/291/default�aspx�Lecksell, J�/ World Bank� 2013� Personal communication regarding world boundaries for
2013, Nov� 26� Lecksell is lead World Bank cartographer�World Bank� 2013a� World Development Indicators 2013� Washington, DC: World Bank�
http://bit�ly/1pW4Rzc�—� 2013b� World Development Indicators (Income Levels)� Accessed December 22,
2013� http://bit�ly/1aS5CmL�
PUBLIC AGRICULTURE R&D INVESTMENTSASTI (Agricultural Science & Technology Indicators)� 2013� “ASTI Countries�” Accessed
October 14, 2013� www�asti�cgiar�org/countries�
AFRICA’S AGRICULTURAL RESEARCH POOLASTI (Agricultural Science and Technology Indicators)� 2013� ASTI database� Accessed
January 17, 2013� www�asti�cgiar�org/data/�Beintema, N�, and G�-J� Stads� 2011� African Agricultural R&D in the New Millennium: Progress
for Some, Challenges for Many� Food Policy Report 24� Washington, DC: International Food Policy Research Institute�
FAO� 2013� FAOSTAT Database� http://faostat�fao�org/site/291/default�aspx�Sène, L�, F� Liebenberg, M� Mwala, F� Murithi, S� Sawadogo, and N� Beintema� 2011� Staff
Aging and Turnover in African Agricultural R&D: Lessons from Five National Agricultural Research Institutes. Conference Working Paper No� 17� Washington, DC: International Food Policy Research Institute and Forum for Agricultural Research in Africa�
CGIAR RESEARCH PROGRAM ON DRYLAND SYSTEMSCGIAR� 2012� “Research Program on Dryland Systems�” Accessed November 19, 2013�
http://drylandsystems�cgiar�org�ICARDA (International Center for Agricultural Research in the Dry Areas)� 2013�
GeoInformatics Unit� http://gu�icarda�org�
12