political effects of the great · pdf file1 political effects of the great recession 1 in the...
TRANSCRIPT
POLITICAL EFFECTS OF THE GREAT RECESSION
Larry M. Bartels
ABSTRACT
America’s political response to the Great Recession was surprising to pundits, but mostly consistent with patterns familiar to political scientists. Ordinary citizens assessed politicians and policies primarily on the basis of visible evidence of success or failure. Thus, in 2008, the president’s party was punished at the polls for the dismal state of the election-year economy. The successful challenger, Barack Obama, pushed policy significantly to the left, as Democratic presidents typically do, provoking a predictable “thermostatic” shift to the right in the public’s policy mood. In 2010, slow economic recovery and public qualms about ideological overreach exacerbated the losses normally suffered by a president’s party in midterm elections. In 2012, Obama was reelected—as incumbents almost always are when their party has held the White House for just four years—thanks in part to a modest but timely upturn in the income growth rate.
Working Paper: 6-2013 Research Concentration: Elections and Electoral Rules
POLITICAL EFFECTS OF THE GREAT RECESSION
Larry M. Bartels
Vanderbilt University
DRAFT: 20 March 2013
ABSTRACT
America’s political response to the Great Recession was surprising to pundits, but
mostly consistent with patterns familiar to political scientists. Ordinary citizens
assessed politicians and policies primarily on the basis of visible evidence of success
or failure. Thus, in 2008, the president’s party was punished at the polls for the dismal
state of the election-year economy. The successful challenger, Barack Obama, pushed
policy significantly to the left, as Democratic presidents typically do, provoking a
predictable “thermostatic” shift to the right in the public’s policy mood. In 2010, slow
economic recovery and public qualms about ideological overreach exacerbated the
losses normally suffered by a president’s party in midterm elections. In 2012, Obama
was reelected—as incumbents almost always are when their party has held the White
House for just four years—thanks in part to a modest but timely upturn in the income
growth rate.
1
POLITICAL EFFECTS OF THE GREAT RECESSION 1
In the wake of the 2008 Wall Street meltdown, pundits from across the ideological
spectrum seemed to be in considerable agreement regarding the likely political
ramifications of the economic crisis. On the right, a Wall Street Journal (2008) editorial
just a month after the collapse of Lehman Brothers worried that “the current financial
panic” might provide a “pretext” for “a period of unchecked left-wing ascendancy”
comparable to past “heydays of welfare-state liberalism.” On the left, Robert Kuttner
had already published a book premised on the notion that the economic crisis offered
Barack Obama an opportunity to be “a transformative progressive president” (Kuttner
2008, 1). Obama’s subsequent election impelled John Judis to posit that “liberal views
have re-emerged … with a vengeance, and can be expected to shift further leftward—
especially on economic questions—in the face of coming recession” (Judis 2008).
Of course, nothing of the sort actually happened. Public opinion moved—insofar as
it moved at all—to the right, not to the left.2 The primary manifestation of mass
mobilization in response to the recession, the Tea Party movement, harnessed right-
wing populism in opposition to big government, bailouts, high taxes, and public debt.
1 Portions of this essay draw upon previously published work (Bartels 2012a; 2012c; 2012d). An
earlier version was presented at a conference on “The Effects of the Great Recession,” Ann
Arbor, MI, January 17-18, 2013. I am grateful to conference participants and to three unusually
diligent and thoughtful anonymous reviewers for critical feedback, to Christopher Achen and
Nancy Bermeo for stimulating collaboration on related projects, to John Sides and Lynn Vavreck
for sharing data from the 2012 Cooperative Campaign Analysis Project, and to Vanderbilt
University’s May Werthan Shayne Chair in Public Policy and Social Science for financial support
of the research reported here.
2 An accumulation of dozens of Gallup Polls showed conservatives outnumbering liberals in the
U.S. public by 19 points in 2009, up from 15 points in 2008—and that margin would remain
undiminished through 2010 and 2011 (Saad 2012).
2
Obama’s Democratic base in Congress was decimated in the 2010 midterm election, a
result the president himself referred to as a “shellacking.”
Perhaps not surprisingly, some of the same liberal commentators who had badly
misread the political implications of the economic crisis and the 2008 election were
prominent among those expressing surprise and disappointment at the political
trajectory of Obama’s first term. Kuttner (2011), who had expected “a transformative
progressive president,” now argued that Obama’s presidency was “shaping up as one
of American history’s epic missed moments.” Judis (2010) published a much-talked-
about analysis of Obama’s “Unnecessary Fall.”
The Great Recession brought political disappointments to progressives in other
affluent democracies around the world as well. In elections to the European
Parliament, The Economist (2009) reported, “The centre-left failed to capitalize on an
economic crisis tailor-made for critics of the free market.” Left-of-center governments
in Portugal, New Zealand, and Britain suffered significant losses at the polls. Prominent
political consultant Stanley Greenberg (2011) found it “perplexing” that “many voters
in the developed world are turning away from Democrats, Socialists, liberals and
progressives. … When unemployment is high, and the rich are getting richer, you
would think that voters of average means would flock to progressives, who are
supposed to have their interests in mind—and who historically have delivered for
them.”
Greenberg’s perplexity is understandable if one supposes that voters are animated
by the same ideological perceptions that are commonplace among politicians, pundits,
and political operatives. A romantic view of democracy would suggest that citizens in
the midst of an economic crisis should monitor and evaluate the policy proposals
offered by competing political elites, then use their voices and their votes to
communicate meaningful preferences regarding the future course of public policy.
However, the fact of the matter is that ordinary citizens are mostly uninterested in
3
ideological manifestos and economic theories, and skeptical of assertions about which
parties “historically have delivered for them.” They are much more attentive to ends
than to means, and they tend to reward or punish incumbent governments based on
simple assessments of immediate success or failure. Recognizing these facts makes
the political response to the Great Recession—in the U.S. and elsewhere—a good deal
less perplexing than it would otherwise be.
Over the past five years, dozens of incumbent governments around the world have
faced their voters under conditions of varying economic distress. The results of these
elections show little evidence of any consistent shift in favor of either left-wing or
right-wing parties in response to the Great Recession. While left-of-center governments
(in Portugal, New Zealand, Britain, Spain, and Slovenia) suffered significant losses, so
did right-of-center governments (in Iceland, Japan, and Greece)—and centrist coalitions
(in the Netherlands, Austria, Germany, and Finland) fared even worse.3 The most
consistent pattern in these election results is that voters have simply, and even simple-
mindedly, punished incumbents of every stripe for economic hard times.
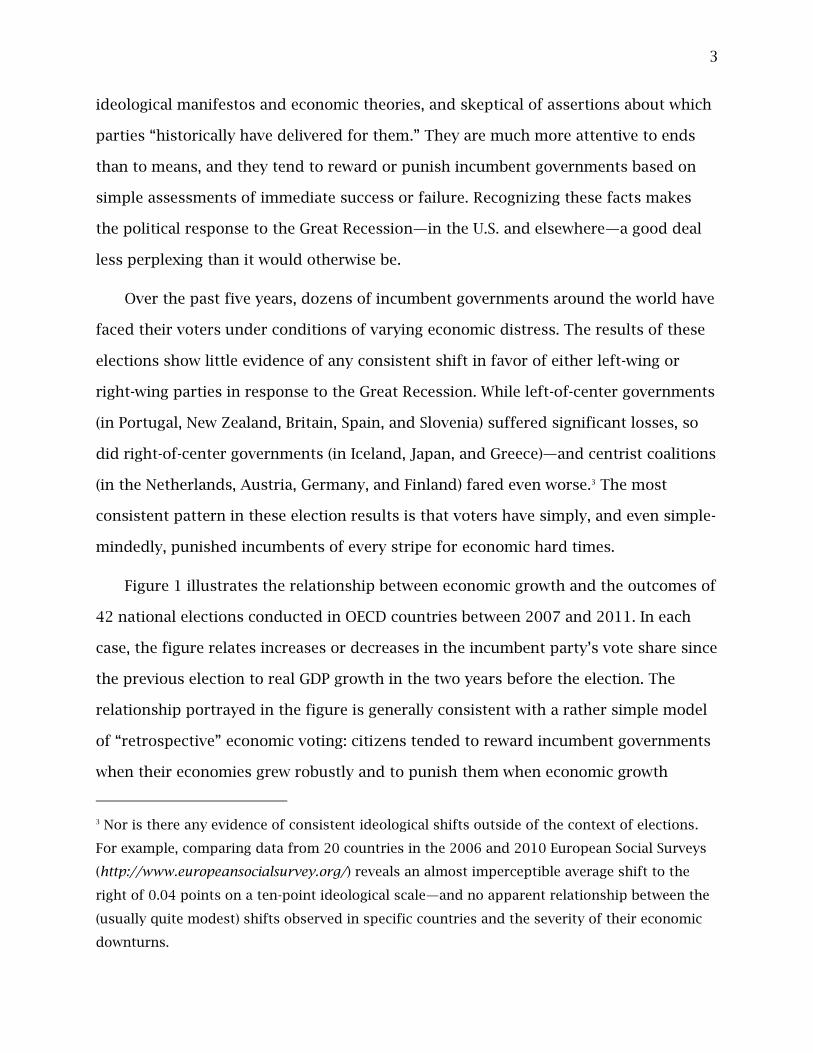
Figure 1 illustrates the relationship between economic growth and the outcomes of
42 national elections conducted in OECD countries between 2007 and 2011. In each
case, the figure relates increases or decreases in the incumbent party’s vote share since
the previous election to real GDP growth in the two years before the election. The
relationship portrayed in the figure is generally consistent with a rather simple model
of “retrospective” economic voting: citizens tended to reward incumbent governments
when their economies grew robustly and to punish them when economic growth
3 Nor is there any evidence of consistent ideological shifts outside of the context of elections.
For example, comparing data from 20 countries in the 2006 and 2010 European Social Surveys
(http://www.europeansocialsurvey.org/) reveals an almost imperceptible average shift to the
right of 0.04 points on a ten-point ideological scale—and no apparent relationship between the
(usually quite modest) shifts observed in specific countries and the severity of their economic
downturns.
4
slowed.4 The magnitude of these rewards and punishments was substantial, with
differences in expected vote shares of 24 percentage points over the observed range of
GDP growth. Of course, there is much more to elections than economic voting. In
Hungary in 2010 and Ireland in 2011, for example, hard times were compounded by
major political scandals. Nevertheless, it is clear that elections in the Great Recession
era have been significantly shaped by voters’ consistent inclination to reward or
punish incumbent governments based on economic growth rates in the months leading
up to an election (Bartels 2012c).
*** Figure 1 ***
My aim here is to provide an overview of American politics since the beginning of
the Great Recession, focusing primarily on public opinion and electoral politics, but
also touching more superficially upon the political causes and consequences of
significant shifts in public policy. In each of these realms, I will argue, Americans
responded to the extraordinary circumstances of the Great Recession in ways that
were, for the most part, quite ordinary. While this interpretation of recent political
history may be surprising in light of the magnitude of the economic crisis—and
perhaps even disillusioning to those with a romantic view of American democracy and
its capacity for epic moments—it has the virtue of accounting parsimoniously for
much that would otherwise be perplexing in the political experience of the past five
years.
4 Voters seem to have been mostly focused on economic conditions in the immediate run-up to
each election rather than on the incumbent government’s overall economic performance; the
measure of “weighted GDP growth” employed in Figure 1 attaches almost twice as much weight
to growth in the year just before the election as to growth in the preceding year—and no weight
at all to growth earlier in the incumbents’ tenure. Moreover, there is no evidence that voters
made any allowance for the impact of global economic forces by comparing their own
economy’s performance with that of similar economies elsewhere; election outcomes are more
closely related to unadjusted national GDP growth rates than to variously defined relative
growth rates.
5
The 2008 Election and “The New New Deal”
The historic election of Barack Obama in 2008 was consistent both with the global
pattern of electoral responses to the Great Recession and with familiar American
electoral patterns. While liberal pundits viewed Obama’s victory as the dawning of
“The New Liberal Order” (Beinart 2008) and “the culmination of a Democratic
realignment that began in the 1990s” (Judis 2008), sober analysis suggests that the
election result was very much in keeping with the usual response of electorates to
short-term economic distress. In that sense, Obama’s presidency itself ranks as the
most important political effect of the Great Recession.
The impact of economic conditions on election outcomes has been the focus of a
great deal of scholarship over the past half-century. Presidential election outcomes, in
particular, have been subjected to scores of statistical analyses which differ in detail,
but consistently demonstrate a strong relationship between economic conditions and
the incumbent party’s success at the polls. Consider, for example, the following very
simple regression analysis:
Incumbent Party Margin = 9.93 + 5.48 × Income Growth – 1.76 × Years in Office.
Incumbent Party Margin represents the incumbent party’s national popular vote
margin (in percentage points). Income Growth is measured by the change in real
disposable personal income per capita between the first and third quarters of the
election year (also in percentage points). Years in Office is a counter indicating how
long the incumbent party has held the White House. The regression parameters are
estimates based on data from the 17 presidential elections since the end of World War
II.5
5 This is an updated version of a regression model first proposed by Achen and Bartels (2004,
Table 3, column 5). Including the three additional presidential elections that have occurred
6
This very simple regression model “explains” more than three-quarters of the
observed variation in election outcomes, with an average discrepancy in the incumbent
party’s vote share of less than 3 percentage points.6 While it is not intended as an
election forecasting model,7 it does provide a striking indication of the extent to which
presidential election outcomes are shaped by two basic factors: the state of the
election-year economy and the incumbent party’s tenure in office. In both cases the
effects are substantial: each additional percentage point of mid-year income growth
increases the incumbent party’s expected vote margin by more than five percentage
points, while each additional term in office reduces the incumbent party’s expected
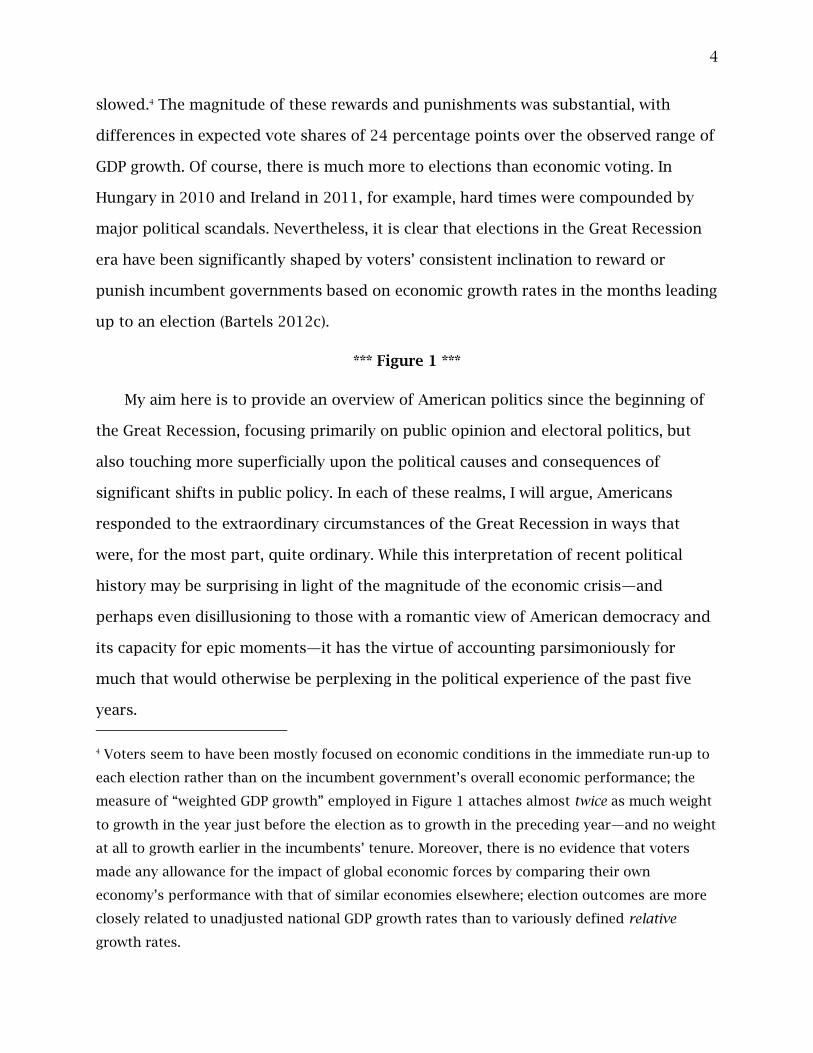
vote margin by seven percentage points. Figure 2 combines these two factors by
relating election outcomes to tenure-adjusted income growth, which simply subtracts
1.29 from the actual income growth rate for each consecutive term (beyond the first)
that the incumbent party has held the White House. The summary line in Figure 2
shows how the incumbent party’s expected vote margin varies with tenure-adjusted
income growth.
*** Figure 2 ***
Statistical analyses of this sort provide useful benchmarks for interpreting the
result of any specific presidential election. For example, the 2008 election outcome
(near the lower-left corner of the figure) turns out to be almost precisely consistent
since then improves the fit of the model slightly, but leaves the parameter estimates essentially
unchanged.
6 The adjusted R-squared statistic is .77, and the standard error of the regression is 5.10. The
standard errors of the regression parameter estimates are 2.46, 0.92, and 0.29, respectively;
thus, they are easily “statistically significant” by conventional standards.
7 The relevant data on income growth are not available soon enough to be useful for
forecasting; in any case, an analysis aiming merely to maximize predictive accuracy would
incorporate additional information such as contemporaneous polling data, and would focus on
state-by-state rather than national results.
7
with the usual historical pattern. McCain trailed Obama in the popular vote by 7.3
percentage points—slightly better than expected, given the dismally low −0.8% mid-
year income growth rate (which translates into a tenure-adjusted income growth rate of
−2.1). Tracing upward along the summary line in Figure 2 suggests an interesting
might-have-been: if mid-year income growth in 2008 had been just +0.6%—a rate still
well below the historical average of 1.4%—Obama would probably not have been
elected. Ironically, the new president owed his presidency to the Great Recession he
would spend most of his first term (at least) struggling to overcome.
It is worth underlining that the economic data employed in the analysis
summarized in Figure 2 come from the second and third quarters of the election year,
before the acute financial crisis symbolized by the collapse of Lehman Brothers in mid-
September could have had much effect on income growth. Thus, the close
correspondence between the 2008 outcome and the historical pattern of presidential
election results reinforces the notion that, “For ordinary Americans, the Wall Street
meltdown was not a turning point, but rather one more sign of the dire condition of
the economy and the failure of the Bush Administration’s policies” (Abramowitz 2009).
Remarkably, even in the midst of an historic economic crisis, voters’ economic
concerns in 2008 seem to have been more focused on the past and present than on the
future. The American National Election Studies survey conducted between Labor Day
and Election Day found 90% of the public saying that the national economy had gotten
worse over the past year, but only 30% predicting that it would get worse over the
coming year—while 27% expected it to get better.8
8 Expectations were virtually identical among the subset of respondents interviewed in the last
30 days of the campaign, two to six weeks after the collapse of Lehman Brothers; 28% expected
the economy to get worse over the next year, while 27% expected it to get better. Author’s
tabulations based on data from the American National Election Studies 2008 Time Series Study
(http://www.electionstudies.org/).
8
Scholars of American voting behavior were pointing out within days of Obama’s
victory that, from an electoral standpoint, nothing very unusual had happened—and
that pundit-talk of realignment was “much-overblown” (Bartels 2008b; Sides 2008). The
aggregate national vote swing from 2004 to 2008 was no larger than has been typical
in presidential elections over the past thirty years—and only about one-third as large
as the electoral tide that swept Franklin Roosevelt into the White House in 1932. Nor
was there a greater-than-usual amount of “realigning” of specific states or regions or a
greater-than-usual erosion of previous partisan voting patterns.
Nevertheless, Obama’s historic election in the midst of an economic crisis raised
irresistible parallels with the dramatic accession of Roosevelt in the midst of the Great
Depression. The cover of Time magazine pictured Obama as FDR, complete with iconic
fedora, cigarette holder, and an evocative title: “The New New Deal.” A cover story by
Peter Beinart (2008) argued that if Obama “can do what F.D.R. did—make American
capitalism stabler and less savage—he will establish a Democratic majority that
dominates U.S. politics for a generation. And despite the daunting problems he
inherits, he’s got an excellent chance.”
Notwithstanding the ubiquity of this historical parallel, the comparison between
Obama and FDR was always highly fanciful. For one thing, the Great Recession was
simply much less severe than the Great Depression had been. For example, real
disposable income per capita fell by almost five percent between the first quarter of
2008 and the fourth quarter of 2009—but the percentage drop in real income during
the Great Depression had been more than four times that size. For another thing, as
Theda Skocpol (2012, 15) has noted, “Roosevelt took office several years into the Great
Depression, when the U.S. economy was at a nadir,” whereas “Obama took office amid
a sudden financial seizure that was just beginning to push the national economy into a
downturn of as-yet-undetermined proportions.” Finally, Roosevelt’s 1932 landslide
swept into office huge Democratic majorities in the House and Senate, whereas Obama
9
began his first term with just 58 Democratic senators and a disciplined Republican
opposition willing and able to filibuster anything that moved.9
Nevertheless, Obama did move swiftly to stem the economic crisis. Only a few
weeks after his inauguration, Congress passed a massive $787 billion stimulus bill, the
American Recovery and Reinvestment Act, providing new federal spending on
infrastructure and other programs, tax cuts, and grants to state governments. The
existing Troubled Asset Relief Program was deployed to recapitalize banks through a
Capital Purchase Program, subsidize private investment in “toxic assets” of financial
institutions, fund bailouts of General Motors and Chrysler, and provide grants to
reduce the rate of home mortgage foreclosures. A series of “stress tests” was devised
to certify the financial health of major banks, and work began on a major overhaul of
financial regulations—an effort that would lead, a year later, to the passage of the
Dodd-Frank Wall Street Reform and Consumer Protection Act.
Within a few months following Obama’s inauguration, as the financial crisis
seemed to be ebbing, the administration turned its attention to a sustained push for
substantial reform of the health care system. Much of the next twelve months would
be consumed with the legislative wrangling that led to the passage in March 2010 of
the landmark Patient Protection and Affordable Care Act—“the most sweeping piece of
federal legislation since Medicare was passed in 1965” (Leonhardt 2010). In the
meantime, the administration also pursued an ambitious energy policy, comprehensive
immigration reform, and other measures. As Skocpol (2012, 44) put it, “Obama’s
ambitious agenda for policy change progressed quite remarkably—to institute
comprehensive health reform, reform higher education loans, tighten regulation of
financial institutions, and tweak many other realms of law and regulation. A new New
9 Arlen Specter (R-PA) joined the Democratic caucus in late April, and Al Franken (D-MN) was
seated in early July when a court finally upheld his disputed razor-thin election margin.
10
Deal of sorts was successfully launched by President Obama and Congressional
Democrats in 2009 and 2010.”
In all of these cases, the ambitiousness of the administration’s policy initiatives
was tempered by strong opposition from Republicans—and by significant hesitation
among some Democrats—in Congress. With the filibuster having evolved “from an
extraordinary expression into a routine obstructive tactic” (Skocpol 2012, 26), the
simple fact was that a Democratic president could only be as liberal as the 60th-most-
liberal senator allowed him to be. While it was seldom entirely clear in advance how
liberal that would be, the most striking aspect of the major legislative battles of 2009
and 2010 was how, time after time, Obama and his allies in Congress pushed precisely
to the filibuster limit. The economic stimulus bill passed with 61 votes in the Senate,
health care reform and financial regulation with exactly 60; in each case, pivotal
senators extracted significant concessions in exchange for their support.
In the case of the Recovery Act, winning a few Republican votes required shrinking
the size of the economic stimulus package and including hundreds of billions of
dollars in tax cuts. Passing the Affordable Care Act required a completely unified
Democratic caucus in the Senate, which in turn required months of haggling and the
eventual jettisoning of the “public option” favored by most Democrats. Maine’s
Republican senators, Olympia Snowe and Susan Collins, crossed over once again to
support the White House’s plan for financial regulation—but when a purist gesture by
Democrat Russ Feingold left the bill still one vote short, additional concessions were
necessary to win a third Republican vote from newcomer Scott Brown (McCarty 2012).
Other major policy initiatives—most notably in the areas of energy and
immigration—were stymied by opposition in the Senate. Politicians on both sides of
the aisle were well aware that the public’s taste for ambitious policy initiatives was
limited. While most Democrats in Congress nonetheless supported most or all of
Obama’s major policy initiatives, the resulting string of significant legislative
11
achievements had a significant political price tag attached—and the bill came due in
the 2010 midterm election.
The 2010 Midterm Election
Having punished Republicans for an ongoing recession in 2008, American voters
were equally willing to punish Democrats for a slow economic recovery in 2010.
Forecasts employing a variety of economic indicators, poll results, and other political
considerations suggested that the incumbent party would probably lose 40 seats in the
House.10 In fact, it turned out to be even worse than that—a net loss of 63 seats, and
control of the chamber.
The result was widely interpreted as an adverse judgment by voters on the policies
of the Obama administration. The New York Daily News called it “a stinging rebuke.” In
his election night victory speech, new Republican Speaker of the House John Boehner
argued that the American people had sent an “unmistakable message” to the president
to “change course” by cutting spending, reducing the size of government, and “helping
small businesses get people back to work.” Obama himself interpreted the election
“shellacking” as primarily a reflection of economic frustration: “If right now we had 5
percent unemployment instead of 9.6 percent unemployment, then people would have
more confidence in those policy choices.” However, even he grudgingly conceded that
voters might have perceived his administration’s responses to the economic crisis as
amounting to “a huge expansion of government.”
Indeed, ordinary Americans by 2010 were a good deal more likely to see
Democrats and Obama as “very liberal” than they were to see Republicans as “very
10 A roundup of nine different forecasts available several weeks before the election suggested
that Democrats would probably lose 30 to 50 seats (Sides 2010). Analyses incorporating poll
results were generally more pessimistic than those relying solely on economic indicators and
structural political factors such as the number of seats being defended by each party.

12
conservative.”11 Moreover, statistical analyses of district-by-district election results
provide solid evidence that public perceptions of ideological overreach contributed to
the Democrats’ midterm losses. Democratic incumbents who voted for the Recovery
Act probably did two or three points worse than they otherwise would have.12
Supporting the Affordable Care Act probably cost a typical Democrat about five or six
percentage points, and perhaps even more in swing districts.13 Some analysts have
suggested that supporting the abortive cap-and-trade energy bill and the Dodd-Franks
financial reform bill may also have cost Democrats votes.14
Some of these effects are arguably consistent with my emphasis on visible
evidence of success or failure as the primary focus of voters’ policy assessments. In
the case of the stimulus package, for example, the electoral rebuke seems to have
reflected widespread public skepticism about its economic effectiveness.15 As a USA
11 A fall 2010 survey conducted by the American National Election Studies team found 31% of
the respondents rating Republicans as “very conservative”; 41% rated Democrats as “very
liberal” and 43% rated Obama as “very liberal.” Author’s tabulations based on data from the
American National Election Studies 2010 Panel Recontact Study
(http://www.electionstudies.org/).
12 An early analysis by McGhee (2010) estimated that congressional Democrats who supported
the American Recovery and Reinvestment Act did 2.8% worse in 2010, other things being equal.
A subsequent analysis by Nyhan et al. (2012) put the effect at 1.7%. A study by Jacobson (2011)
limited to 44 Democratic incumbents in Republican-leaning districts put the cost of a vote in
favor of the stimulus package at 3.0%.
13 McGhee (2010), Jacobson (2011), and Nyhan et al. (2012) put the cost of supporting the
Affordable Care Act at 4.5%, 4.9%, and 6.5%, respectively.
14 McGhee (2010) and Nyhan et al. (2012) estimated additional penalties of 2.1% and 1.7%,
respectively, for supporting the cap-and-trade bill, while Jacobson (2011) estimated that
supporting the Dodd-Frank bill cost Democrats in competitive districts an additional 3.7% of
the midterm vote.
15 For example, an ABC News/Washington Post poll conducted a month before the midterm
election found 68% of the public saying that the money the federal government spent on the
13
Today story reporting the findings of Blinder and Zandi’s (2010) study of its economic
benefits wryly noted, “If President Obama expected anyone to say, ‘Thank you,’
however, he’s been disappointed. … In the partisan war over the economy’s
performance, the word ‘stimulus’ has became [sic] synonymous with ‘boondoggle,’
making the notion of a repeat any time soon highly unlikely” (Lynch 2010).
Despite the unpopularity of the Recovery Act, the direct political cost to
Democrats of supporting the package was almost surely more than offset by the
indirect political benefit of more robust economic growth. If we accept Blinder and
Zandi’s (2010, Table 7) estimates that the stimulus package added 1.3% to real GDP
growth in 2009 and 1.9% in 2010, then economic conditions at the time of the midterm
election were distinctly more favorable to the incumbent party as a result of the
stimulus than they otherwise would have been. The cross-national relationship
depicted in Figure 1 suggests that that additional GDP growth probably added two or
three percentage points to the aggregate Democratic vote share in 2010. Thus, the net
result was probably close to zero in districts where Democratic incumbents supported
the stimulus bill, and a significant gain in districts held by Republicans or by
Democrats (disproportionately in competitive seats) who did not support the bill.
These calculations suggest that the Recovery Act very likely “paid for itself” even
in strictly electoral terms. That was certainly not true of the Affordable Care Act,
whose concrete benefits to prospective voters were both distant and uncertain.
Sweeping health care reform had been an aspiration of Democrats for six decades; but,
even with a (fleetingly) “filibuster-proof” majority in the Senate, Obama and his allies
lacked sufficient political support to do it quickly, cleanly, and in a way that delivered
substantial immediate benefits to their constituents. In the end, however, they proved
to be sufficiently determined to do it slowly, messily, and in a way that left them
economic stimulus had been “mostly wasted,” while only 29% said the money had been “mostly
well spent” (http://www.washingtonpost.com/wp-srv/politics/polls/postpoll_10052010.html).
14
vulnerable to substantial public backlash. Sometimes that is how significant policy
change occurs.
Simulations based on statistical analyses of district-by-district election results
suggested that if every vulnerable Democrat (those in seats where Obama received less
than 60% of the two-party vote in 2008) had refrained from voting for health care
reform, the party would have lost about 25 fewer seats in 2010, bringing the election
outcome into close agreement with forecasts based on “fundamentals”—and probably
preserving a slim Democratic majority (McGhee 2010; Nyhan et al. 2012, 19).
These findings suggest that the Democrats’ midterm “shellacking” was attributable
in significant part to having pursued—and enacted—what many Americans saw as a
“very liberal” policy agenda extending well beyond what seemed relevant and
necessary to the task of economic recovery. Of course, this apparent ideological
backlash may have been prompted, in part, by popular dissatisfaction with the state of
the economy. Nevertheless, it constitutes a notable exception to the general pattern of
voters assessing policies pragmatically rather than ideologically.
As for the recovery itself, the electoral response was Janus-faced. Voters clearly
punished the incumbent party in 2010 for failing to produce a robust recovery, and
mostly disapproved of the policies that seemed to be implicated in that failure.
However, unpopular means—most notably, bank bailouts and stimulus spending—
probably staved off an even worse electoral debacle, because they staved off an even
worse economic debacle.
The Impact of the Recession on Policy Preferences
Social scientists setting out to examine the impact of economic distress on political
attitudes and policy preferences have repeatedly been surprised to find much less than
they expected. For example, Kenworthy and Owens (2011) titled a recent review of
evidence from four decades of opinion surveys “The Surprisingly Weak Effect of
15
Recessions on Public Opinion.” However, the general tenor of their findings was clearly
foreshadowed more than three decades earlier in Schlozman and Verba’s (1979) book-
length study of the political impact of unemployment in the 1970s.
Schlozman and Verba (1979, 351) found that “the effects of unemployment are
severe but narrowly focused, manifest in ways that are proximate to the joblessness
itself. Many of the connections we had originally expected between unemployment and
political beliefs and conduct simply were not made.” In particular, they found no
tendency for unemployment to produce “general disenchantment with American life,
wholesale changes in social ideology, or adoption of radical policy positions”
(Schlozman and Verba 1979, 349). Moreover, “the unemployed as a group contributed
less significantly to the electoral outcome in 1976 than the common wisdom would
have suggested. … Political activity is more a function of beliefs about politics than of
specific personal experiences; political beliefs, in turn, are more a function of general
social beliefs than of personal experiences. Once again, the severe economic strain of
job loss has little direct impact on political life” (Schlozman and Verba 1979, 330, 332).
Kenworthy and Owens’ broader survey of opinion data over the past four decades
suggested that “recent economic recessions have had real but mostly temporary
effects on American attitudes on key economic, political, and social issues” (Kenworthy
and Owens 2011, 198). However, they found “no indication of any increase in support
for policies that enhance opportunity, support for the poor, or support for
redistribution. … Economic downturns, including the Great Recession, have had
surprisingly little impact on Americans’ views of government, even in the short run”
(Kenworthy and Owens 2011, 216-217, 204).
A narrower but more detailed study by Margalit (2013) examined changes in policy
preferences using a panel survey in which the same people were interviewed before,
during, and after the crisis phase of the Great Recession. Comparing responses from
July 2007 and April 2009, he found some decline in public support for “an increase in
16
the funding of government programs for helping the poor and the unemployed with
education, training, employment, and social services, even if this might raise your
taxes.” However, that decline mostly reflected a preponderance of support for such
spending increases before the onset of the crisis; among both supporters and
opponents, 75% maintained their pre-crisis positions in 2009, while 11 or 12% switched
sides.
Among people who actually became unemployed during this period, Margalit
(2013) found a significant increase in support for “funding of government programs
for helping the poor and the unemployed with education, training, employment, and
social services.” Given the explicit mention of “the unemployed” in the question, this
effect may be seen as echoing Schlozman and Verba’s (1979, 349) finding that
unemployment was associated with support for specific “policies designed to
ameliorate the situation,” though not for “wholesale changes in social ideology.”
Moreover, even this narrow effect was of rather modest magnitude: 59% of those who
lost their jobs during the course of Margalit’s panel study supported increased funding
of these programs, as compared with 47% of those who kept their jobs. And even over
the course of a severe recession, the number of people who lost their jobs was much
too small for this shift in views to make a substantial dent in the overall distribution of
public opinion.
Moreover, Margalit’s analysis of people who became reemployed over the course of
his panel study suggests that the effect of unemployment was quite transitory: only
49% of them supported increased spending on programs for the poor and
unemployed—a figure barely higher than among people who remained employed
throughout the recession. Republicans were especially likely to become more favorable
toward increased spending on programs for the poor and unemployed when they lost
their jobs, but also more likely to revert to their former views when they became
reemployed.
17
Schlozman and Verba’s (1979, 351) emphasis on opinion change that is “narrowly
focused” and “proximate” rather than broadly ideological also seems to apply to
Americans’ views about the specific policy tools employed to address the Great
Recession. A summer 2009 BBC World Service Poll measured public support for three
of the most salient policy responses to the economic crisis: “giving financial support to
banks in trouble,” “increasing government regulation and oversight of the national
economy,” and “significantly increasing government spending to stimulate the
economy.” None of these programs was particularly popular; the results presented in
the first row of Table 1 show that the balance of public opinion was slightly negative in
the cases of increasing government regulation and stimulus spending, and strongly
negative in the case of support for troubled banks.
*** Table 1 ***
These results underline the political pitfalls facing the Obama administration as it
grappled with the Great Recession, especially in the period following the first months
of acute economic crisis. Of the six other affluent democracies included in the
survey—Australia, Canada, France, Germany, Japan, and the United Kingdom—only
Germany showed a similar lack of public enthusiasm for all three of these policy
options.16
In a follow-up survey conducted the following summer, the same pollsters asked
about the same three possible government responses to the crisis. Strikingly, the
American public’s support for all three policies was markedly lower in 2010 than it
had been a year earlier. Presumably, these shifts in public opinion reflected the
tendency of ordinary Americans to assess policies in terms of apparent success or
failure rather than abstract ideology. Having experienced bailouts, bank stress tests,
and a seemingly massive stimulus program, and seeing no dramatic improvement in
16 http://www.globescan.com/news_archives/bbc2009_globalPoll-04/.
18
tangible economic conditions as a result, most Americans were in no mood for
counterfactual arguments that, in fact, these “comprehensive policy responses saved
the economy from another depression” (Blinder and Zandi 2010, 10). Tellingly, this
decline in popular support for the most salient policy responses to the crisis was by no
means limited to the U.S.; support for aiding troubled banks and increasing
government spending declined from 2009 to 2010 in every one of the six countries
included in both surveys.17
The 2010 BBC World Service Poll also included an additional policy option: “taking
steps to reduce the government’s budget deficit and debt, by cutting some spending or
increasing some taxes.” That option was distinctly more popular than any of the
original three, with 52% of Americans favoring steps to reduce government deficit and
debt (28% “strongly”) and only 32% opposing (19% “strongly”). When asked which of
two possible approaches to deficit reduction their government should “focus on more,”
the survey respondents overwhelmingly chose “cutting spending on government
services, including ones you use” over “increasing taxes” (64% to 23%, the rest choosing
neither or both or something else).
It is tempting to interpret this public support for budget-cutting as a reflection of
Americans’ deep-seated suspicion (at least in the abstract) of big government.
However, the public sentiment in favor of budget-cutting seems to have been widely
shared throughout the developed world. At least slight pluralities in five of the six
other affluent democracies included in the survey (all except Spain) favored deficit
reduction measures, with cutting services always substantially more popular than
increasing taxes. Of course, it is not all that hard to favor austerity before you have
17 http://www.globescan.com/news_archives/bbc2010_economics/. The average decline in net
support was 18 points in the case of support for troubled banks and 16 points in the case of
increasing government spending. Changes in support for increasing government regulation
were more mixed, with big declines in Australia and the U.S. balanced by increases in Germany
and France.
19
actually tried it; whether public support for budget-cutting can survive significant cuts
in actual spending will probably depend on whether those cuts seem to lead to robust
economic growth.
Explaining the Limited Impact of the Recession
If the impact of the Great Recession on political attitudes and policy preferences
has been “surprisingly weak,” why is that? Four lines of explanation seem promising.
First, the very success of government policy in limiting the economic damage from
the crisis also tended to limit its political impact. In the six months following the
collapse of Lehman Brothers in September 2008, the “stunning range of initiatives”
improvised by the Federal Reserve, the Treasury Department, and the Obama White
House stabilized the financial system and stimulated the economy. By one estimate
(Blinder and Zandi 2010, Table 4), these initiatives boosted real GDP by 4.9% in 2009
and by 6.6% in 2010. Although a long period of painfully slow economic recovery
consumed President Obama’s entire first term, this was nothing like the “Depression
2.0” that Fed chairman Ben Bernanke and other policy-makers had feared.
Of course, the millions of Americans who had lost their jobs or their homes were
unlikely to be cheered by the fact that things might have been much worse. However,
from a political perspective, what may be most remarkable about the Great Recession
is the starkness of the division between casualties and non-combatants. While victims
of the economic crisis in Greece, France, and Britain took to the streets, America’s
millions of unemployed and foreclosed were virtually invisible. A majority of
respondents in a 2010 survey said that they did not know “anyone who has had their
home foreclosed or fallen behind in their mortgage payments in the past year.”18 For
18 “Do you know anyone who has had their home foreclosed or fallen behind in their mortgage
payments in the past year?” Yes, 36%; No, 54%; Not sure, 9%. YouGov/Polimetrix survey, October
2010.
20
most Americans, a few months of genuine panic fairly quickly faded into the more
familiar economic strain of recession and slow recovery.
Second, the pundits’ expectation that Americans would either push or follow their
new Democratic president to the political left flew in the face of considerable historical
evidence suggesting that the public is much more likely to react against perceived
shifts in policy than to reinforce them.
Figure 3 tracks overall trends in public opinion over the past six decades using
James Stimson’s measure of “public policy mood”—an aggregation of hundreds of
polls gauging public opinion on a wide variety of domestic policy issues.19 Liberal shifts
in opinion appear as upticks in the figure, while conservative shifts appear as
downticks. Matching these movements with shifts in control of the White House
reveals a strong counter-cyclical tendency in public opinion. The public grew much
more liberal over the eight years of Eisenhower’s presidency; much more conservative
while Kennedy, Johnson, and Carter were in office; more liberal under Reagan; more
conservative during Bill Clinton’s first term; and more liberal again from the advent of
Newt Gingrich’s Republican House in 1995 through the end of George W. Bush’s
presidency in 2008. The downtick in liberalism under Obama, at the very end of the
time series, is simply the latest instance of this six-decade pattern.
*** Figure 3 ***
Christopher Wlezien (1995) nicely likened the public to a thermostat, with
attentive citizens controlling their elected officials by responding to increases in
government activism with pressure for decreases and to decreases in government
activism by demanding increases. I would temper the optimism of the metaphor by
emphasizing that perceived increases or decreases in government activism may have
19 For explications of the statistical analysis underlying this measure, see Stimson (1998) and
Erikson et al. (2002, chapter 6). Updated data through 2011 are available from the Policy Mood
website: http://www.unc.edu/~cogginse/Policy_Mood.html.
21
rather little to do with the actual content of policy; some important policy shifts are
largely ignored by the public, while modest changes may be inflated by political
opponents into harbingers of socialism or social Darwinism. Nevertheless, insofar as
the public does respond to actual shifts in the ideological content of public policy, it is
likely to be as a restraining force rather than as a propelling force.
Third, the increasing partisan polarization of the American political system over
the past three decades (Levendusky 2009) has probably decreased the scope for
substantial shifts in public preferences, at least on issues central to partisan conflict.
Democrats and Republicans routinely disagree not only about political leaders and
policies, but even about such seemingly objective matters as whether unemployment
has increased or decreased—and these disagreements are often sharpest among those
who are generally well-informed about politics (Bartels 2012b).20 Given the complexity
of elite policy debates and the ambiguity of available evidence regarding the actual
effects of most policies, attention to elite discourse may simply provide partisans on
both sides with arguments and “evidence” that bolster their preexisting beliefs.
Even when “experts” come to considerable agreement about how the world works,
their views may have little sway over people to whom they speak inconvenient truths.
For example, a 2012 survey of prominent economists found strong agreement
20 Even views about junk food are not immune to partisan biases. In 2011, Herman Cain, the
former head of Godfather’s Pizza, was a prominent candidate for the Republican presidential
nomination. Over the course of the year, a survey tracking public assessments of the company’s
quality, value, and reputation revealed significant polarization along partisan lines. At the
beginning of the year, before Cain’s emergence, Republicans and Democrats had identical,
slightly positive views of Godfather’s Pizza; in November, shortly before Cain dropped out of
the presidential race, Republicans had become substantially more favorable, while Democrats
had become distinctly unfavorable (Marzilli 2011).
22
regarding the effectiveness of the 2009 stimulus package.21 However, a Pew survey of
the public conducted the same month found Republicans disapproving of the stimulus
by a margin of 76% to 12% (Pew Research Center for the People & the Press 2012).
Finally, observers who expected Obama to rally the public in support of an
ambitious progressive policy response to the economic crisis—or of an even broader
progressive agenda unrelated to the crisis—drastically overestimated the ability of this
(or any other) president to shape public opinion to suit his political taste.
Much of the criticism from the left of Obama’s first-term performance hinged on
the belief that, through a “potent combination of insider leadership, mobilization of
public opinion, and alliance with social movements on the ground,” he should have
been able to engineer policy changes comparable in magnitude to those produced by
Franklin Roosevelt and Lyndon Johnson (Kuttner 2011). Skocpol (2012, 44-45)
attributed the “endless political controversy and electoral blowback” of Obama’s first
term primarily to the “incomprehension and anxiety of everyday Americans” faced
with bewildering policy debates, and to “a veritable explosion of political pushback”
from “[b]usiness interests and many wealthy conservatives.” Nevertheless, she, too,
viewed “Obama’s failure to engage more consistently in high-profile public leadership
on the economy” as an instance of “democratic political malpractice.” Although the
president “travelled the country highlighting economic initiatives and progress in
selected areas,” she argued, “such efforts lacked the galvanizing, agenda-setting effect
of a major speech or sustained national communications strategy; and their
21 The survey was conducted in February 2012 with 41 “distinguished experts with a keen
interest in public policy from the major areas of economics” as part of the University of
Chicago Business School’s IGM Forum; 33 agreed that the unemployment rate at the end of
2010 was lower than it would have been without the 2009 stimulus package, while only two
disagreed; 19 agreed that “the benefits of the stimulus will end up exceeding its costs,” while
five disagreed (http://www.igmchicago.org/igm-economic-experts-panel/poll-
results?SurveyID=SV_cw5O9LNJL1oz4Xi).
23
fragmented focus inherently restricted the White House’s ability to present a coherent
economic plan” (Skocpol 2012, 37-38, 36).
Arguments of this sort put undue stock in the power of the “bully pulpit” to sway
public opinion—a mythical power that has mostly failed to withstand systematic
scholarly scrutiny (Edwards 2003). They also fail to account for the fact that the most
costly “electoral blowback” against the president’s congressional allies in 2010 seems
not to have come in reaction to his misunderstood economic plan, but in reaction to
his ambitious health care reform—the very policy area in which, by Skocpol’s (2012,
35) account, “Obama gave major speeches and orchestrated theatrically effective issue
forums at key intervals during 2009 and early 2010, displaying presidential leadership
and offering framings that proved influential beyond as well as within the Beltway.” If
this was an example of the “bully pulpit” in action, it is hardly surprising that
Democrats in Congress were not eager to stake their careers on further exercises of
progressive presidential leadership.
Kuttner’s notion that Obama might have advanced a more ambitious progressive
policy agenda through “alliance with social movements on the ground” seems even
more farfetched. The most visible manifestation of progressive activism in the wake of
the Great Recession, the Occupy Wall Street movement, was credited by political
journalists with “turning the national conversation towards inequality” (Klein 2011).
However, it would be more accurate to say that Occupy Wall Street “impacted the
debate in Washington” and the narrative of Obama’s own reelection campaign (Berman
2011) without making any significant dent on the views of ordinary Americans.
For example, a 2012 survey found 70% of Americans believing that the difference
in incomes between rich people and poor people in the United States had gotten larger
over the past 30 years, while only 4% believed that it had gotten smaller. This sounds
like a clear endorsement of the primary premise of the Occupy Wall Street movement.
However, comparisons with past surveys suggest that the public perception of
24
increasing inequality was actually less broadly shared in 2012 than it had been four
years—or even a full decade—earlier.22
Nor is there any evidence of a significant shift in public views regarding the most
momentous concrete policy issue addressed (insofar as any concrete policy issue was
addressed) by the Occupy Wall Street movement—the fate of the Bush tax cuts. In
October 2012, after more than a year of media attention and an intense presidential
campaign, 40% of the public favored President Obama’s long-standing proposal to
restore the Clinton-era tax rates for households earning more than $250,000 per year
(while another 15% favored letting all the Bush tax cuts expire). However, that was
slightly less support than Obama’s proposal had had two years earlier, at the time of
the Republicans’ midterm sweep. Indeed, the repeated measures of views about the
Bush tax cuts reported in Table 2 provide remarkably little evidence that the public as
a whole moved to the left at any point since at least 2008 on this issue—or even that
the public became increasingly engaged in the debate over the months in which the
Occupy Wall Street movement is supposed to have focused the “national conversation”
on the issue of economic inequality (Bartels 2012a).
*** Table 2 ***
The 2012 Election: More Politics as Usual
When American voters went to the polls in November 2012, objective economic
indicators suggested that they were not much better off than they had been when
President Obama was inaugurated. Real per capita GDP was almost 5% higher than it
22 The 2012 results are from YouGov surveys of registered voters conducted in March and June
as part of the Cooperative Campaign Analysis Project. In the 2008 American National Election
Studies survey, 79% of respondents said that the current income gap was larger than it had
been 20 years earlier, while 6% said it was smaller. In the 2002 and 2004 American National
Election Studies surveys, 76% said that the current income gap was larger, while 3% said it was
smaller (Bartels 2008a, 144).
25
had been in the winter of 2009; but real incomes were less than 1% higher, and the
official unemployment rate stood at 7.8%, just as it had in January 2009. More
importantly from a political perspective, there was little evidence of economic
momentum through most of the election year. Month-to-month real income growth—
represented by the top line in Figure 4—declined raggedly but significantly through the
first eight months of the year. Public perceptions of whether the economy was getting
better or worse grew increasingly pessimistic over the same period, and remained
firmly in negative territory throughout the year—especially among undecided voters,
represented by the bottom line in the figure.
*** Figure 4 ***
As prospective voters’ perceptions of the economy became more pessimistic
through the spring and summer of 2012, they also became more influential in shaping
vote intentions.23 Table 3 reports the results of statistical analyses tracking the impact
of economic perceptions on vote intentions over the course of the campaign using the
same survey data as in Figure 4, from the 2012 Cooperative Campaign Analysis Project.
For each two-month campaign period, the table shows the estimated impact of
economic perceptions—whether respondents thought the economy was getting better
or worse—on current vote intentions. Because all of these respondents completed a
baseline survey in December 2011, they can be partitioned into three distinct subsets
based on their predispositions at the beginning of the 2012 campaign: those who
reported supporting Obama in the baseline interview (43%), those who reported
supporting Romney (38%), and those who reported being unsure who they would
23 Bartels (2006) provided similar but more fragmentary evidence of the “priming” of economic
perceptions over the course of previous presidential campaigns. Vavreck (2009) provided a
more extensive theoretical and empirical analysis of the role of the economy in presidential
campaigns.
26
support (15%).24 Table 3 reports the results of separate analyses for these three distinct
groups.25
*** Table 3 ***
The results for 2011 undecided voters, in the top panel of Table 3, provide strong
evidence of an increasing effect of economic perceptions on vote intentions over the
course of the campaign. In the first four months of the election year—roughly, during
the competitive phase of the Republican primary campaign—Obama’s expected
preference share among previously undecided voters who saw the economy as
improving was about 15 points higher than among those who thought the economy
was getting worse. However, once Romney emerged as the presumptive Republican
nominee, the impact of economic perceptions on vote intentions increased markedly,
and that impact remained substantially higher through the summer and fall than it
had been earlier in the election year. After Labor Day, Obama’s expected vote share
among previously undecided voters who saw the economy as improving was about 24
points higher than among those who thought the economy was getting worse.
24 My analysis excludes the remaining 4% of the baseline survey respondents, who volunteered
that they supported some other candidate.
25 The estimates presented in Table 3 are derived from regression analyses including party
identification, ideology, education, income, church attendance, labor union membership,
homeownership, sex, race, and Hispanic origin as control variables. Since contemporaneous
economic perceptions, party identification, and ideology are measured with error—and since
they may be contaminated by shifts in vote intentions stemming from other sources—I employ
instrumental variables regression analyses using pre-campaign measures of these variables
from the December 2011 baseline wave of the CCAP survey as instruments for the
contemporaneous measures. On average, the instrumental variables estimates reported in Table
3 are 12% larger than the corresponding ordinary least squares estimates; however, the
increasing weight of economic perceptions evident in the table also appears clearly in the
ordinary least squares estimates.
27
Economic perceptions also seem to have become increasingly consequential over
the course of the campaign among prospective voters who reported supporting
Romney or Obama in the December 2011 baseline survey. Although most of them
stuck by their original vote intentions through the campaign season, those who
defected were disproportionately those whose economic perceptions were incongruent
with their original vote intentions. And that was increasingly true as the campaign
wore on—though the impact of economic perceptions was always more modest for
Romney supporters (in the middle panel of Table 3) and for Obama supporters (in the
bottom panel) than for those who had begun the election year undecided.
If pessimistic perceptions of the economy became increasingly consequential over
the course of the 2012 campaign, how is it that Obama nevertheless managed to win
reelection? Part of the answer is that prospective voters’ perceptions of the economy
became significantly less pessimistic in the fall than they had been in the summer—a
shift coinciding with the beginning of a rebound in the actual income growth rate in
September. The statistical analyses summarized in Table 3 suggest that this upturn in
economic perceptions probably boosted Obama’s popular vote margin by about a
percentage point.26 Thus, an election held a few months sooner might have been even
closer.
What was even more important for Obama, however, was the structural advantage
of running as a first-term incumbent. American voters have consistently held
26 The average improvement in economic perceptions between July-August and October-
November was about 12 points. The average impact of economic perceptions implied by the
parameter estimates in the last column of Table 3 (each weighted by the proportion of survey
respondents in the corresponding baseline preference group) is .072. Multiplying these two
quantities produces an estimated increase in Obama’s vote share of 0.9 percentage points. A
similar calculation comparing the estimated average perceptions on Election Day in Figure 4
with the more pessimistic perceptions three months earlier produces an estimated increase in
Obama’s vote share of 1.1 percentage points.

28
incumbent parties to higher standards the longer they have been in power. The
summary line in Figure 2, which shows the expected popular vote margin for first-term
incumbents in post-war elections, suggests that any income growth at all is likely to be
sufficient for reelection when a party has held the White House for only four years.
Indeed, the only incumbent party candidate in more than a century to have lost in that
circumstance was Jimmy Carter, who ran for reelection in the midst of an election-year
recession even more severe than the Republicans’ in 2008.
As it turned out, the 2012 election outcome was almost precisely consistent with
the historical pattern of post-war presidential election results—a correspondence
indicated by its position just below the summary line near the center of Figure 2.27
Obama’s popular vote margin was 3.8%, whereas his expected vote margin (given 0.3%
growth in real disposable income per capita during the second and third quarters of
the election year) was 4.6%.28 However, the same historical pattern suggests that Obama
would probably not have won if his party had already been in power for eight years, as
John McCain’s party had been in 2008.29 Another way of putting the same point is to
say that Democrats will probably not succeed in holding the White House in 2016—
regardless of who the competing candidates turn out to be—unless the election-year
economy is significantly more robust than it was in 2012.
27 Most of the statistical forecasts produced by political scientists before the election (e.g.,
Abramowitz 2012; Erikson and Wlezien 2012; Sides 2012) likewise suggested that Obama would
be narrowly reelected. The most notable exception was Douglas Hibbs’s (2013) “bread and
peace” model, which places significant weight on early-term income growth, and which forecast
a seven-point Republican victory.
28 Subsequent revision of income tabulations by the Bureau of Economic Analysis may push the
2012 data point in Figure 2 to the left or right, but is unlikely to move it far away from the
expected outcome indicated by the summary line.
29 The statistical analysis on which the summary line in Figure 2 is based suggests that four
additional years in office would have reduced the Democratic vote margin by 7 percentage
points, more than enough to erase Obama’s actual margin of 3.8%.
29
Economic Crises and Political Change: Was the New Deal So Different?
To Theda Skocpol (2012, 44), Obama’s first term was marked by a disjuncture
between successful policies and unsuccessful politics: “A new New Deal of sorts was
successfully launched by President Obama and Congressional Democrats in 2009 and
2010. But much of what happened was either invisible or ominously incomprehensible
to the majority of American citizens.” Skocpol (2012, 42) contrasted this state of
affairs with the New Deal era: “Back in the 1930s, American citizens could see that big,
new things were being proposed and debated in Washington DC.”
Were the policy changes championed by Roosevelt really so much more visible and
comprehensible—or, for that matter, more popular—than those pursued by Obama?
Newman and Jacobs (2010, 15) have suggested that FDR, like Obama, had plenty of
disappointed political supporters: “Though we remember Roosevelt today as the man
who did more for the poor and dispossessed than any president before, and arguably
anyone since, in his own day leftists and labor liberals often complained that
Roosevelt’s actions were too little, too late, and too tepid.” Four years into the New
Deal, and a year after Roosevelt’s landslide reelection, the editors of The Economist
(1937, 147) offered just such a tepid appraisal: “Relief there has been, but little more
than enough to keep the population fed, clothed and warmed. Recovery there has been,
but only to a point still well below the pre-depression level. The great problems of the
country are still hardly touched.”
Political polarization in the 1930s was less strictly along partisan lines than it is
today, but it would be a mistake to jump to the conclusion that it was any less severe.
In a Gallup survey conducted in 1936, at the height of FDR’s popularity, Americans
were asked, “Do you believe the acts and policies of the Roosevelt Administration may
lead to dictatorship?” A remarkable 45% of the respondents—and 83% of
Republicans—said yes (Key 1961, 246).
30
Moreover, the political disputes of the 1930s dredged up many of the same
cultural and racial tensions evident in contemporary Tea Party politics. One of
Roosevelt’s unhappy constituents (quoted by Newman and Jacobs 2010, 45) wrote,
Do you recall the fate of that great “purger” of the French Revolution,
Robespierre? Well, the voters of these United States still possess the right to
change the complexion of Congress every two years and can politically “purge”
most effectively. We mean to do this without the aid of bought Negro reliefers,
WPA-ers, subsidized non-producers, pampered Alien and Labor Union hangers-
on, or that misguided coterie surrounding you who have so amiably and so
senselessly squandered our billions. We prefer to link up with the yearly
increment of American-born new voters who will remember their heritage and
keep it clean.
In the conventional understanding of the electoral politics of the 1930s, the
forging of a durable new partisan alignment hinged crucially on popular responses to
the policies and personality of FDR. V. O. Key, Jr. (1958, 578-579) claimed that the
Democratic landslide of 1936 had “a special significance. … The result could only be
interpreted as a popular ratification of the broad features of new public policy.” James
Sundquist (1983, 214) wrote that voters were “attracted by the Democratic program
and the Rooseveltian personality and leadership.” Even the authors of The American
Voter, who downplayed the importance of ideology for most voters most of the time,
attributed the “profound realignment of party strength” in the 1930s to “the program
of welfare legislation of the New Deal and the extraordinary personality of its major
exponent, Franklin D. Roosevelt” (Campbell et al. 1960, 534).
In fact, though, Roosevelt’s political fate was probably just as dependent as
Obama’s has been on voters’ assessments of immediate economic progress.
Christopher Achen and I (Achen and Bartels 2005) have shown that Roosevelt’s historic
landslide in 1936—the pivotal electoral event in what came to be called the New Deal
era—was heavily concentrated in states with high income growth rates over the course
31
of the election year. However, even in the midst of a long recovery from a catastrophic
depression, voters seem to have been stubbornly focused on short-term economic
assessments; thus, robust income growth in 1934 and 1935 had no discernible impact
in 1936.30 Thus, our analysis suggests that if the recession of 1938 had happened to
occur two years earlier, FDR would probably have been a one-term president. In that
case, the New Deal era would have been just as evanescent as the “New Liberal Order”
proclaimed by Peter Beinart in 2008.
That is not to deny that many of Roosevelt’s policy initiatives were quite popular,
but to suggest that their popularity—and, for that matter, Roosevelt’s personal
popularity—hinged much more than is generally realized on the dramatic
improvement in economic conditions that began shortly after he took office. Thus, it is
misleading to suppose that voters rendered a considered verdict on the New Deal, as
distinct from the economic recovery that happened to coincide with it. Indeed, there is
surprisingly little trace in the electoral politics of the 1930s of any coherent ideological
realignment of the sort taken for granted by many subsequent scholars. For example,
states with large numbers of poor, black, foreign-born, or rural people were not
significantly more supportive of Roosevelt or of Democratic congressional candidates,
once differences in election-year income growth are taken into account.
30 Comparing Roosevelt and Obama, Skocpol (2012, 150) argued that “FDR and the Democrats
did not preside over any quick economic recovery in 1933 and 1934, but they nevertheless
gained rather than lost congressional seats in 1934. Obama and the Democrats almost certainly
did at least as much to buoy a sagging economy in 2009 and 2010 as Democrats did back in
1933 and 1934.” While the contribution of policy to economic recovery in each era is debatable,
basic economic data belie Skocpol’s premise: real disposable income per capita grew by 9.1% in
1934 versus 1.0% in 2010—a difference more than large enough to account for the difference
between gaining seats in the first instance and substantial midterm losses in the second. Real
incomes grew by an additional 8.9% in 1935. However, the geographical distribution of income
growth in 1934 and 1935 is uncorrelated with shifts in Roosevelt’s electoral support between
1932 and 1936, once 1936 income growth is taken into account.
32
In other democracies around the world, voters in the depths of the Great
Depression showed a notable willingness to replace incumbents of every ideological
stripe with an equally diverse range of alternatives, including conservatives, socialists,
Irish nationalists, Nazis, and (in the Canadian prairie province of Alberta) a radio
preacher running on a platform of distributing free money. As David Mayhew (2002,
161) put it, “academics have tended to dismiss campaign slogans of the past like ‘the
full dinner pail’ and ‘a chicken in every pot’ on the grounds that something deeper
must have been going on in these elections. But perhaps it wasn’t.”
The dramatic recovery of the American economy over the course of Roosevelt’s
presidency did produce a gradual but substantial shift in partisan loyalties—as did the
parallel recoveries in many other places around the world (Achen and Bartels 2005;
2008). If the Great Recession turns out to produce any similar shift in the balance of
partisan loyalties, it will significantly affect American politics for a long time to come.
So far, however, that has not happened. The Democratic plurality in party
identification, which increased fairly steadily through most of George W. Bush’s
presidency, was not much different at the end of President Obama’s first term than it
had been at the beginning. Huffpost Pollster’s aggregation of hundreds of separate
opinion surveys, summarized in Figure 5, shows a modest decline in identification with
both parties during Obama’s first year in office, but virtually no net movement since
then. Nevertheless, Obama’s reelection offers an opportunity for the Democratic Party
to make more lasting gains in mass allegiance—especially among younger voters with
relatively weak partisan predispositions—if economic conditions improve markedly
over the course of his second term.
*** Figure 5 ***
Interpreting public opinion and election outcomes is not merely a scholarly
pursuit. For better or worse, perceptions of what ordinary citizens think and want can
33
alter practical political discourse and action. American political culture in the 20th
century was significantly shaped by the conventional belief that the 1936 election
produced “a popular ratification of the broad features of new public policy.”
Similarly—though less dramatically—an over-interpretation of the ideological
significance of Barack Obama’s historic victory in 2008 almost surely bolstered
Democrats’ determination to pursue an ambitious legislative agenda unrelated to the
economic crisis in the first half of Obama’s first term. When the reports of a “New
Liberal Order” turned out to be premature, the Democrats’ midterm “shellacking” was
interpreted—and not only by John Boehner—as an “unmistakable message” to “change
course,” significantly altering the subsequent political standing and strategies of both
the president and his Republican opponents. Nevertheless, the day after Obama won
reelection by a narrow margin—precisely in keeping with historical precedent—one
enthusiastic commentator declared it “an inflection point in American political
history” (Creamer 2012).
When interpretations of this sort are mistaken—as they often are—political trouble
may ensue. The truth of the matter is that ideological mandates are exceedingly rare in
American politics, even in times of economic crisis. Indeed, what may be most striking
about the politics of the Great Recession is how ordinary they look. In bad times, as in
good times, ordinary citizens have a stubborn tendency to judge politicians and
policies not on the basis of ideology or economic doctrine, but of perceived success or
failure.
34
References
Abramowitz, Alan I. 2009. “Did the Wall Street Meltdown Change the Election?”
Sabato’s Crystal Ball, February 5
(http://www.centerforpolitics.org/crystalball/articles/aia2009020501/).
Abramowitz, Alan I. 2012. “Forecasting in a Polarized Era: The Time for Change Model
and the 2012 Presidential Election.” PS: Political Science & Politics 45: 618-619.
Achen, Christopher H., and Larry M. Bartels. 2004. “Musical Chairs: Pocketbook Voting
and the Limits of Democratic Accountability.” Unpublished paper presented at the
Annual Meeting of the American Political Science Association, Chicago
(https://my.vanderbilt.edu/larrybartels/working-papers/).
Achen, Christopher H., and Larry M. Bartels. 2005. “Partisan Hearts and Gall Bladders:
Retrospection and Realignment in the Wake of the Great Depression.” Unpublished
paper presented at the Annual Meeting of the Midwest Political Science
Association, Chicago (https://my.vanderbilt.edu/larrybartels/working-papers/).
Achen, Christopher H., and Larry M. Bartels. 2008. “Myopic Retrospection and Partisan
Realignment in the Great Depression.” Unpublished paper presented at the Annual
Meeting of the American Political Science Association, Boston
(https://my.vanderbilt.edu/larrybartels/working-papers/).
Bartels, Larry M. 2006. “Priming and Persuasion in Presidential Campaigns.” In Henry E.
Brady and Richard Johnston, eds., Capturing Campaign Effects. Ann Arbor, MI:
University of Michigan Press.
Bartels, Larry M. 2008a. Unequal Democracy: The Political Economy of the New Gilded
Age. New York and Princeton, NJ: Russell Sage Foundation and Princeton University
Press.
Bartels, Larry M. 2008b. “Election Debriefing.” CSDP Election 2008, November 6
(http://blogs.princeton.edu/election2008/2008/11/election-debriefing.html).
Bartels, Larry. 2012a. “Occupy’s Impact Beyond the Beltway.” Bill Moyers World of Ideas,
January 18 (http://billmoyers.com/2012/01/18/has-the-occupy-movement-altered-
public-opinion/).
Bartels, Larry. 2012b. “Our Own Facts.” Model Politics, March 12
(http://today.yougov.com/news/2012/03/12/our-own-facts/).
Bartels, Larry. 2012c. “Elections in Hard Times.” Public Policy Research 19: 44-50
(http://onlinelibrary.wiley.com/doi/10.1111/j.1744-540X.2012.00681.x/pdf).
35
Bartels, Larry M. 2012d. “A New Deal Fantasy Meets Old Political Realities.” In Theda
Skocpol, Obama and America’s Political Future. Cambridge, MA: Harvard University
Press, 91-110.
Beinart, Peter. 2008. “The New Liberal Order.” Time, November 13
(http://www.time.com/time/magazine/article/0,9171,1858873,00.html).
Berman, Ari. 2011. “In Osawatomie, Obama Embraces New Populist Moment.” The
Nation, December 6 (http://www.thenation.com/blog/164996/osawatomie-obama-
embraces-new-populist-moment).
Blinder, Alan S., and Mark Zandi. 2010. “How the Great Recession Was Brought to an
End.” Princeton University and Moody’s Analytics, July 27
(http://www.Economy.com/mark-zandi/documents/End-of-Great-Recession.pdf).
Campbell, Angus, Philip E. Converse, Warren E. Miller, and Donald E. Stokes. 1960. The
American Voter. New York: John Wiley & Sons.
Creamer, Robert. 2012. “6 Reasons Why the 2012 Election Will Be Considered Historic.”
HuffPost Politics, November 7 (http://www.huffingtonpost.com/robert-creamer/six-
reasons-why-the-2012_b_2091038.html).
The Economist. 2009. “The European Elections: Swing Low, Swing Right.” June 11
(http://www.economist.com/node/13832286).
Editors of The Economist. 1937. The New Deal: An Analysis and Appraisal. New York:
Alfred A. Knopf.
Edwards, George C., III. 2003. On Deaf Ears: The Limits of the Bully Pulpit. New Haven,
CT: Yale University Press.
Erikson, Robert S., Michael B. MacKuen, and James A. Stimson. 2002. The Macro Polity.
New York: Cambridge University Press.
Erikson, Robert S., and Christopher Wlezien. 2012. “The Objective and Subjective
Economy and the Presidential Vote.” PS: Political Science & Politics 45: 620-624.
Greenberg, Stanley B. 2011. “Why Voters Tune Out Democrats.” New York Times, July
31, SR1.
Hibbs, Douglas A. 2013. “The Bread and Peace Model: 2012 Presidential Election
Postmortem.” PS: Political Science & Politics 46: 41.
Jacobson, Gary C. 2011. “The Republican Resurgence in 2010.” Political Science
Quarterly 126: 27-52.
Judis, John B. 2008. “America the Liberal.” The New Republic, November 19
36
(http://www.tnr.com/article/politics/america-the-liberal#).
Judis, John B. 2010. “The Unnecessary Fall: A Counter-History of the Obama
Presidency.” The New Republic, August 12
(http://www.tnr.com/article/politics/magazine/76972/obama-failure-polls-populism-
recession-health-care).
Kenworthy, Lane, and Lindsay A. Owens. 2011. “The Surprisingly Weak Effect of
Recessions on Public Opinion.” In David B. Grusky, Bruce Western, and Christopher
Wimer, eds., The Great Recession. New York: Russell Sage Foundation.
Key, V. O., Jr. 1958. Politics, Parties, and Pressure Groups, 4th ed. New York: Thomas Y.
Crowell.
Key, V. O., Jr. 1961. Public Opinion and American Democracy. New York: Alfred A.
Knopf.
Klein, Ezra. 2011. “Occupy Wall Street Occupies Obama’s 2012 Campaign.” Washington
Post Wonkblog, December 7
(http://www.washingtonpost.com/blogs/wonkblog/post/wonkbook-occupy-wall-
street-occupies-obamas-2012-campaign/2011/12/07/gIQAZVN0bO_blog.html).
Kuttner, Robert. 2008. Obama’s Challenge: America’s Economic Crisis and the Power of
a Transformative Presidency. White River Junction, VT: Chelsea Green.
Kuttner, Robert. 2011. “Unequal to the Moment.” American Prospect, February 9
(http://prospect.org/article/unequal-moment-0).
Leonhardt, David. 2010. “In Health Bill, Obama Attacks Wealth Inequality.” New York
Times, March 24, page A1
(http://www.nytimes.com/2010/03/24/business/24leonhardt.html?_r=0).
Levendusky, Matthew. 2009. The Partisan Sort: How Liberals Became Democrats and
Conservatives Became Republicans. Chicago: University of Chicago Press.
Lynch, David J. 2010. “Economists Agree: Stimulus Created Nearly 3 Million Jobs.” USA
Today, August 30 (http://www.usatoday.com/money/economy/2010-08-30-
stimulus30_CV_N.htm).
Margalit, Yotam. 2013. “Explaining Social Policy Preferences: Evidence from the Great
Recession.” American Political Science Review (forthcoming).
Marzilli, Ted. 2011. “Cain’s Candidacy Splits Pizza Scores.” YouGov BrandIndex, 15
November (http://www.brandindex.com/article/cains-candidacy-splits-pizza-scores).
Mayhew, David R. 2002. Electoral Realignments: A Critique of an American Genre. New
37
Haven, CT: Yale University Press.
McCarty, Nolan. 2012. “The Politics of the Pop: The U.S. Response to the Financial
Crisis and the Great Recession.” In Nancy Bermeo and Jonas Pontusson, eds.,
Coping with Crisis: Government Reactions to the Great Recession. New York: Russell
Sage Foundation.
McGhee, Eric. 2010. “Which Roll Call Votes Hurt the Democrats?” The Monkey Cage,
November 9
(http://themonkeycage.org/blog/2010/11/09/which_roll_call_votes_hurt_the/).
Newman, Katherine S., and Elisabeth S. Jacobs. 2010. Who Cares? Public Ambivalence
and Government Activism from the New Deal to the Second Gilded Age. Princeton,
NJ: Princeton University Press.
Nyhan, Brendan, Eric McGhee, John Sides, Seth Masket, and Steven Greene. 2012. “One
Vote Out of Step? The Effects of Salient Roll Call Votes in the 2010 Election.”
American Politics Research 40: 844-879.
Pew Research Center for the People & the Press. 2012. “Auto Bailout Now Backed,
Stimulus Divisive.” February 23 (http://www.people-press.org/2012/02/23/auto-
bailout-now-backed-stimulus-divisive/).
Saad, Lydia. 2012. “Conservatives Remain the Largest Ideological Group in U.S.” Gallup
Politics, January 12 (http://www.gallup.com/poll/152021/conservatives-remain-
largest-ideological-group.aspx).
Schlozman, Kay Lehman, and Sidney Verba. 1979. Injury to Insult: Unemployment,
Class, and Political Response. Cambridge, MA: Harvard University Press.
Sides, John. 2008. “Truths and Myths about the 2008 Election.” The Monkey Cage,
November 5-6 (http://www.themonkeycage.org/2008/11/).
Sides, John. 2010. “Midterm Forecast Update.” The Monkey Cage, September 12
(http://themonkeycage.org/blog/2010/09/12/midterm_forecast_update/).
Sides, John. 2012. “Where the Presidential Race Stands Now.” The Monkey Cage,
August 23 (http://themonkeycage.org/blog/2012/08/23/where-the-presidential-
race-stands-now/).
Skocpol, Theda. 2012. Obama and America’s Political Future. Cambridge, MA: Harvard
University Press.
Stimson, James A. 1998. Public Opinion in America: Moods, Cycles, and Swings, 2nd ed.
Boulder, CO: Westview Press.
38
Sundquist, James L. 1983. Dynamics of the Party System, revised ed. Washington, DC:
Brookings Institution.
Time. 2008. “The New New Deal: What Barack Obama Can Learn from F.D.R.—And
What the Democrats Need to Do.” November 24
(http://www.time.com/time/covers/0,16641,20081124,00.html).
Vavreck, Lynn. 2009. The Message Matters: The Economy and Presidential Campaigns.
Princeton, NJ: Princeton University Press.
Wall Street Journal. 2008. “A Liberal Supermajority.” October 17
(http://online.wsj.com/article/SB122420205889842989.html).
Wlezien, Christopher. 1995. “The Public as Thermostat: Dynamics of Preferences for
Spending.” American Journal of Political Science 39: 981-1000.

39
Table 1: Public Support for Government Actions, 2009 and 2010
“In our current economic conditions, do you favor or oppose the [COUNTRY] government doing each of the following?
Giving financial support to banks in trouble
Increasing government regulation and oversight of the national economy Significantly increasing government spending to stimulate the economy Taking steps to reduce the government’s budget deficit and debt, by cutting some
spending or increasing some taxes” Net support ranges from +100 (“strongly favor”) to −100 (“strongly oppose”)
Financial
support to troubled banks
Increasing government regulation
Increasing government
spending
Reducing government deficit/debt
United States 2009 2010
−31 −42
−1 −18
−6 −22
---
+14
Australia 2009 2010
−10 −14
+24 +2
+30 +16
---
+14
Canada 2009 2010
−18 −50
+22 +24
+26 +3
--- +6
France 2009 2010
−26 −39
+28 +39
−12 −29
--- +2
Germany 2009 2010
−44 −61
+1
+22
−8 −27
--- +6
Japan 2009
−6
0
+8
---
Spain 2010
−28
−6
−8
−7
United Kingdom 2009 2010
+3 −26
+10 +6
+14 +10
---
+17
Source: BBC World Service Poll conducted by GlobeScan, June-August 2009 and June-September 2010.
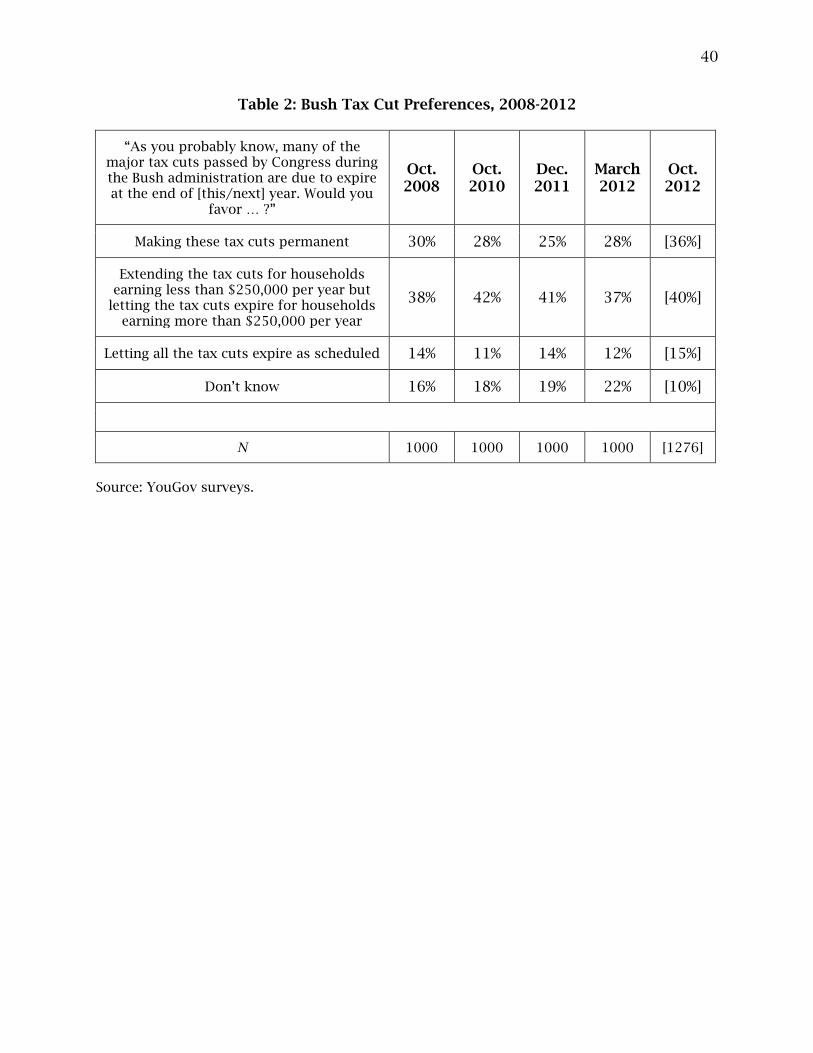
40
Table 2: Bush Tax Cut Preferences, 2008-2012
“As you probably know, many of the major tax cuts passed by Congress during the Bush administration are due to expire at the end of [this/next] year. Would you
favor … ?”
Oct. 2008
Oct. 2010
Dec. 2011
March 2012
Oct. 2012
Making these tax cuts permanent 30% 28% 25% 28% [36%]
Extending the tax cuts for households earning less than $250,000 per year but
letting the tax cuts expire for households earning more than $250,000 per year
38% 42% 41% 37% [40%]
Letting all the tax cuts expire as scheduled 14% 11% 14% 12% [15%]
Don’t know 16% 18% 19% 22% [10%]
N 1000 1000 1000 1000 [1276]
Source: YouGov surveys.
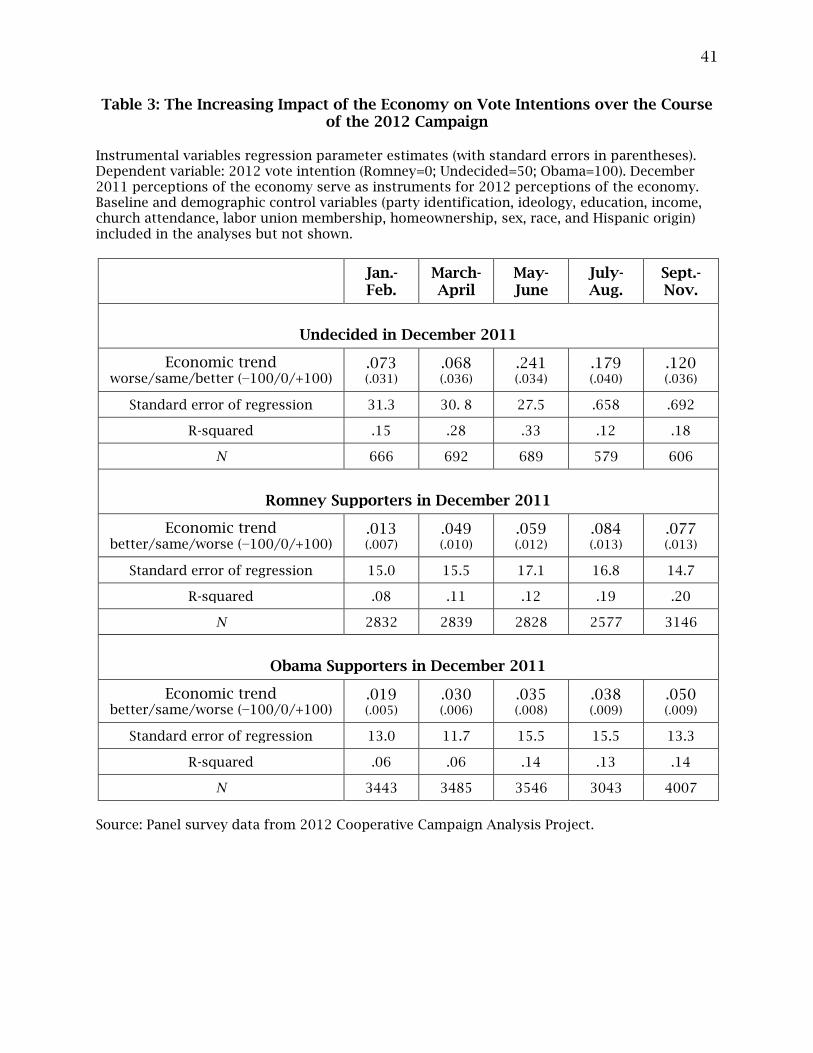
41
Table 3: The Increasing Impact of the Economy on Vote Intentions over the Course of the 2012 Campaign
Instrumental variables regression parameter estimates (with standard errors in parentheses). Dependent variable: 2012 vote intention (Romney=0; Undecided=50; Obama=100). December 2011 perceptions of the economy serve as instruments for 2012 perceptions of the economy. Baseline and demographic control variables (party identification, ideology, education, income, church attendance, labor union membership, homeownership, sex, race, and Hispanic origin) included in the analyses but not shown.
Jan.- Feb.
March-April
May-June
July-Aug.
Sept.-Nov.
Undecided in December 2011
Economic trend worse/same/better (−100/0/+100)
.073 (.031)
.068 (.036)
.241 (.034)
.179 (.040)
.120 (.036)
Standard error of regression 31.3 30. 8 27.5 .658 .692
R-squared .15 .28 .33 .12 .18
N 666 692 689 579 606
Romney Supporters in December 2011
Economic trend better/same/worse (−100/0/+100)
.013 (.007)
.049 (.010)
.059 (.012)
.084 (.013)
.077 (.013)
Standard error of regression 15.0 15.5 17.1 16.8 14.7
R-squared .08 .11 .12 .19 .20
N 2832 2839 2828 2577 3146
Obama Supporters in December 2011
Economic trend better/same/worse (−100/0/+100)
.019 (.005)
.030 (.006)
.035 (.008)
.038 (.009)
.050 (.009)
Standard error of regression 13.0 11.7 15.5 15.5 13.3
R-squared .06 .06 .14 .13 .14
N 3443 3485 3546 3043 4007
Source: Panel survey data from 2012 Cooperative Campaign Analysis Project.
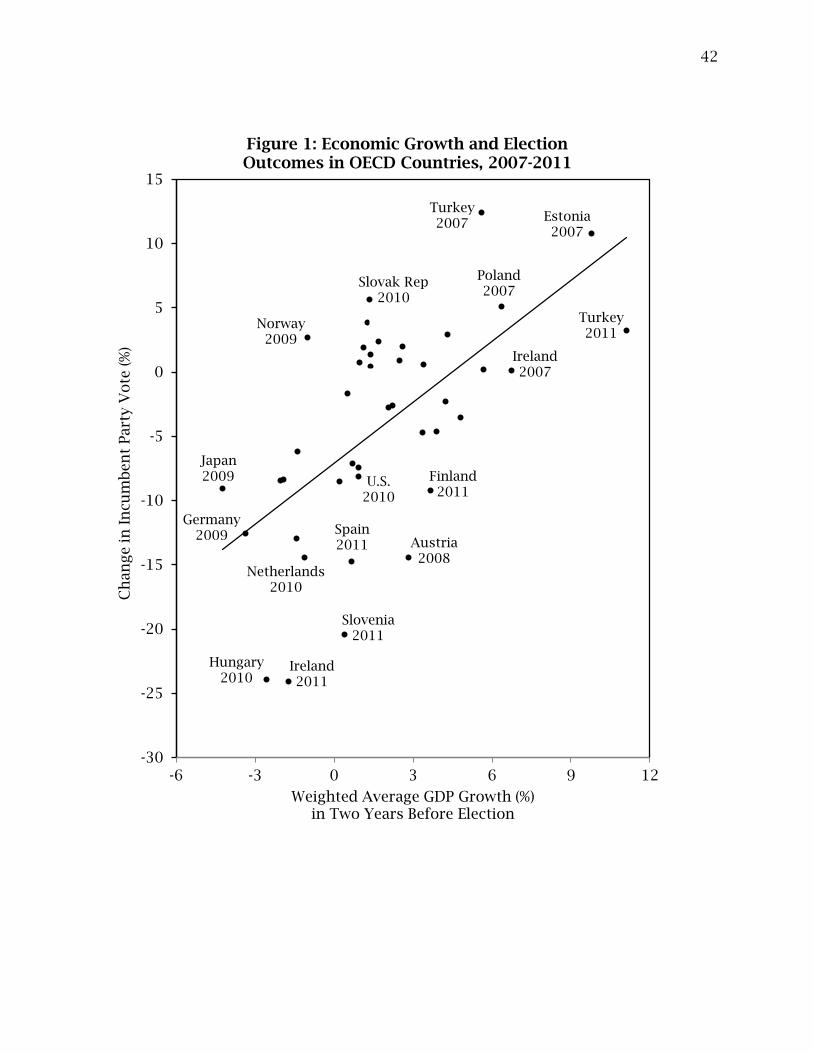
42
-30
-25
-20
-15
-10
-5
0
5
10
15
-6 -3 0 3 6 9 12
Ch
an
ge in
In
cu
mben
t Part
y V
ote
(%
)
Weighted Average GDP Growth (%) in Two Years Before Election
Figure 1: Economic Growth and Election Outcomes in OECD Countries, 2007-2011
Hungary 2010
Ireland 2011
Turkey 2011
Slovak Rep 2010
Norway 2009
Japan 2009
Poland 2007
Estonia 2007
U.S. 2010
Slovenia 2011
Ireland 2007
Spain 2011 Austria
2008
Germany 2009
Turkey 2007
Finland 2011
Netherlands 2010
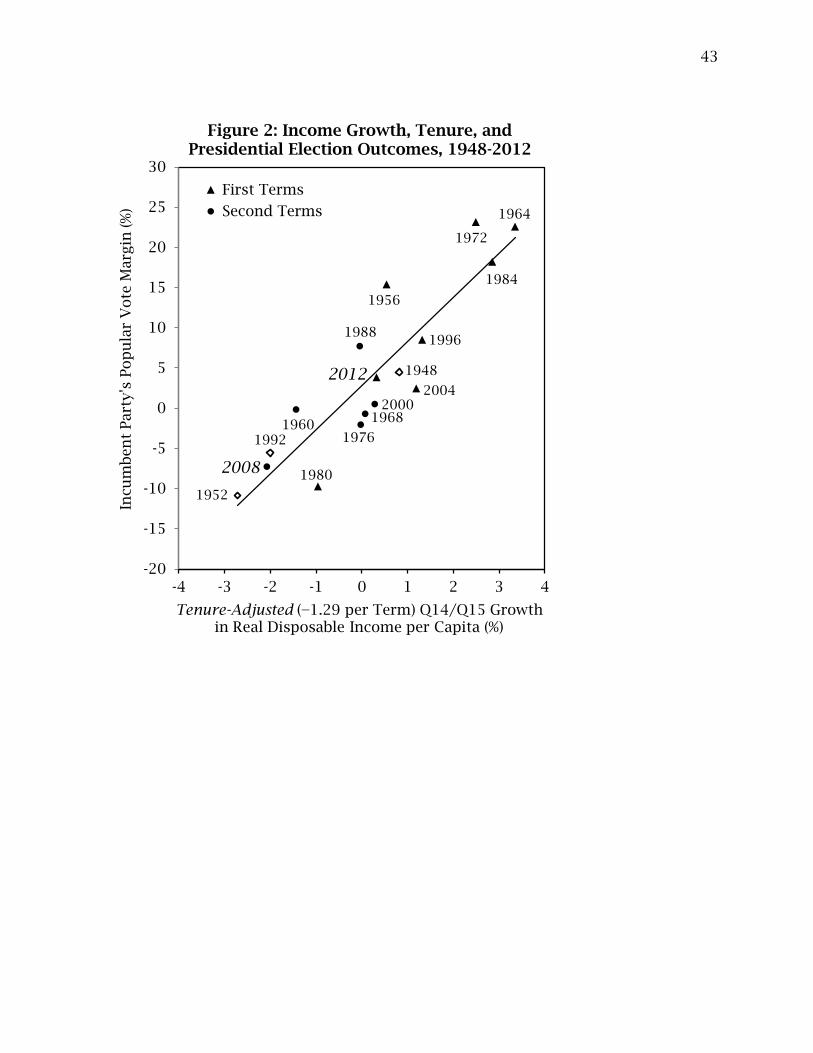
43
-20
-15
-10
-5
0
5
10
15
20
25
30
-4 -3 -2 -1 0 1 2 3 4
Incu
mben
t Part
y's
Pop
ula
r V
ote
Marg
in (%
)
Tenure-Adjusted (−1.29 per Term) Q14/Q15 Growth in Real Disposable Income per Capita (%)
Figure 2: Income Growth, Tenure, and Presidential Election Outcomes, 1948-2012
First Terms
Second Terms
2012
2008
1948
1952
1992
1980
1956
1972
1964
1984
1988 1996
1960 1976
2004 2000
1968

44
40
45
50
55
60
65
70
75
1950 1960 1970 1980 1990 2000 2010
Poli
cy M
ood
Lib
era
lism
Figure 3: Public Policy Mood, 1952-2011
Eisenhower Nixon/Ford Reagan/Bush GW Bush
Clinton Carter Obama JFK/LBJ
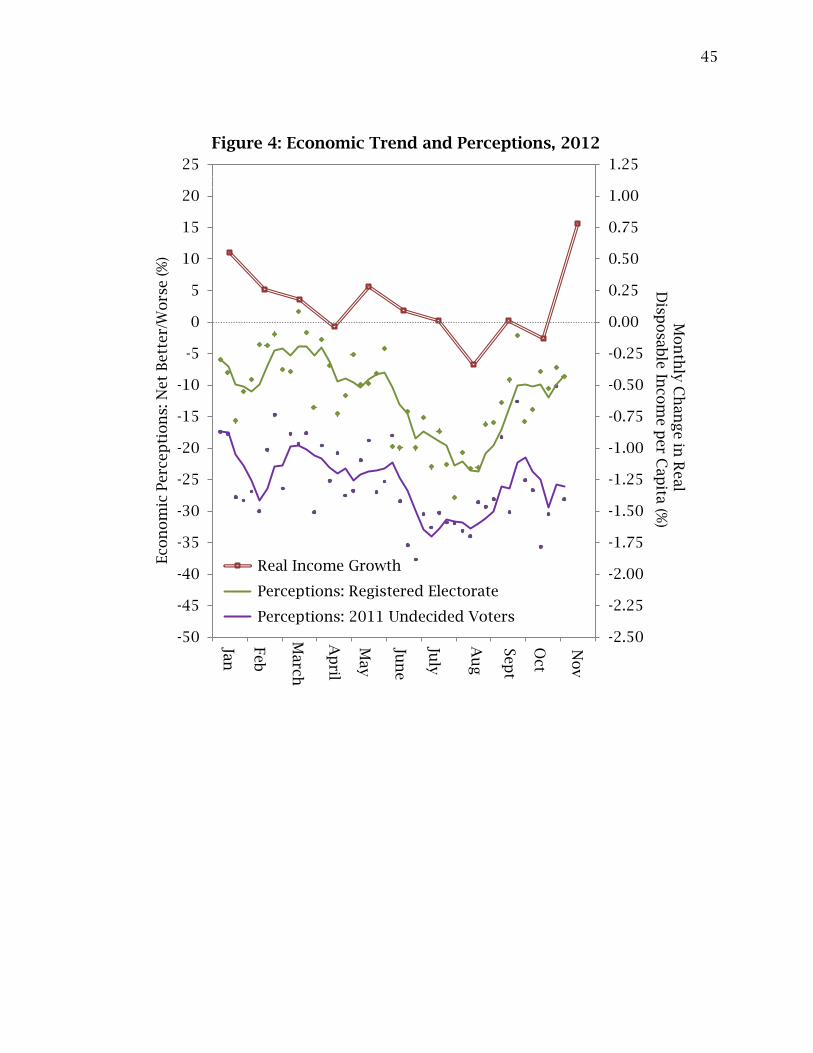
45
0.5 1.5 2.5 3.5 4.5 5.5 6.5 7.5 8.5 9.5 10.5 11.5-2.50
-2.25
-2.00
-1.75
-1.50
-1.25
-1.00
-0.75
-0.50
-0.25
0.00
0.25
0.50
0.75
1.00
1.25
-50
-45
-40
-35
-30
-25
-20
-15
-10
-5
0
5
10
15
20
250 49
Mon
thly
Ch
an
ge in
Real
Dis
posable
Incom
e p
er C
ap
ita (%
) Econ
om
ic P
erc
ep
tion
s: N
et
Bett
er/
Wors
e (%
)
Figure 4: Economic Trend and Perceptions, 2012
Real Income Growth
Perceptions: Registered Electorate
Perceptions: 2011 Undecided Voters
Jan
Feb
Marc
h
Ap
ril
May
Jun
e
July
Au
g
Sep
t
Oct
Nov
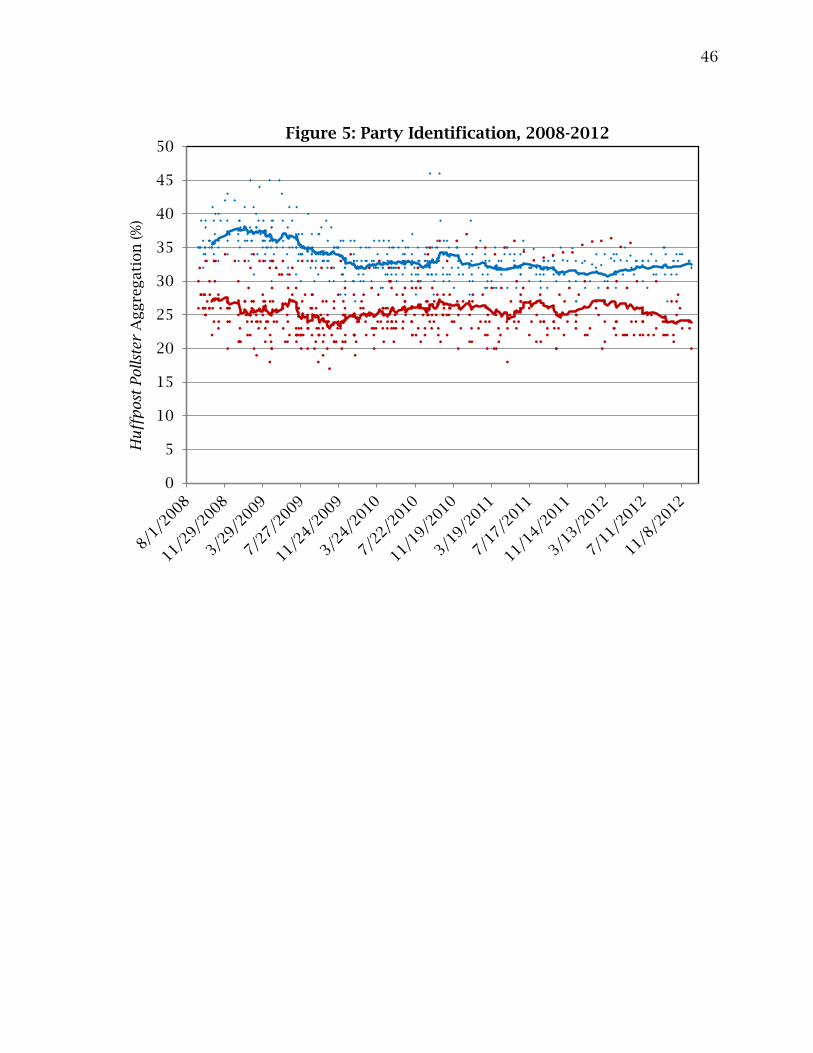
46
0
5
10
15
20
25
30
35
40
45
50H
uff
post
Pollst
er
Aggre
gati
on
(%
) Figure 5: Party Identification, 2008-2012