political investment: remittances and elections angela o’mahony university of british columbia
Post on 21-Dec-2015
218 views
TRANSCRIPT

Political Investment: Remittances and Elections
Angela O’Mahony
University of British Columbia
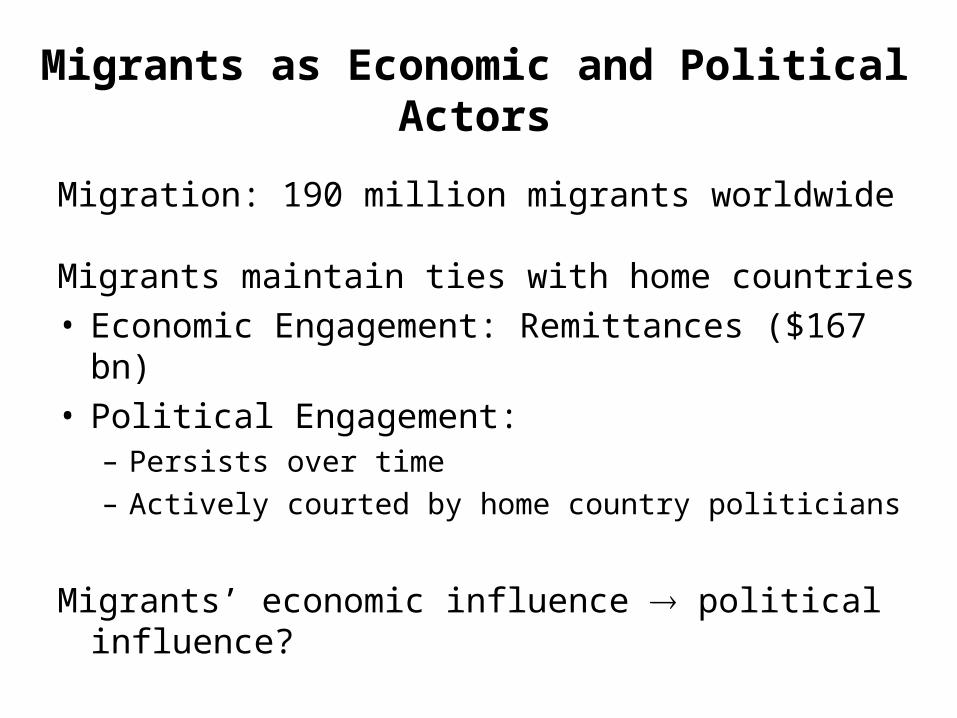
Migrants as Economic and Political Actors
Migration: 190 million migrants worldwide
Migrants maintain ties with home countries• Economic Engagement: Remittances ($167 bn)• Political Engagement:
– Persists over time– Actively courted by home country politicians
Migrants’ economic influence political influence?
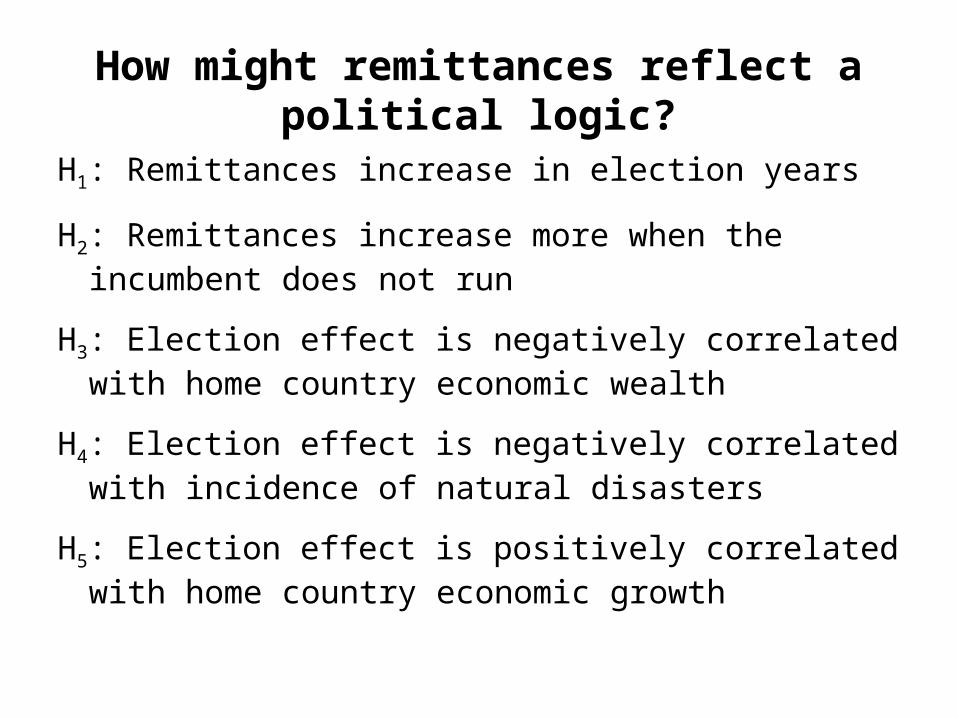
How might remittances reflect a political logic?
H1: Remittances increase in election years
H2: Remittances increase more when the incumbent does not run
H3: Election effect is negatively correlated with home country economic wealth
H4: Election effect is negatively correlated with incidence of natural disasters
H5: Election effect is positively correlated with home country economic growth
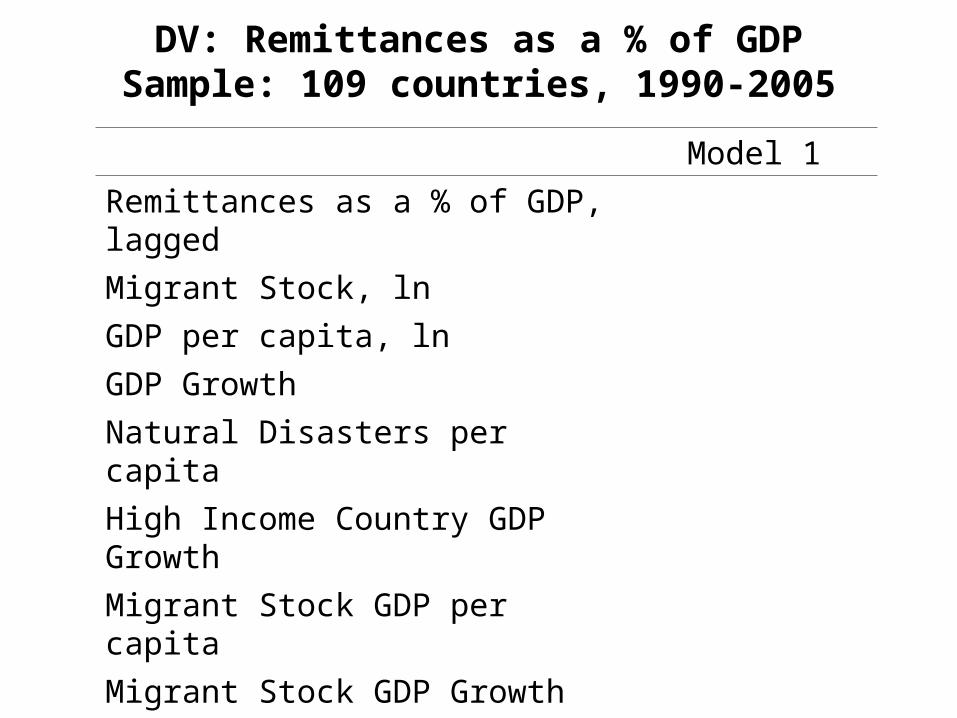
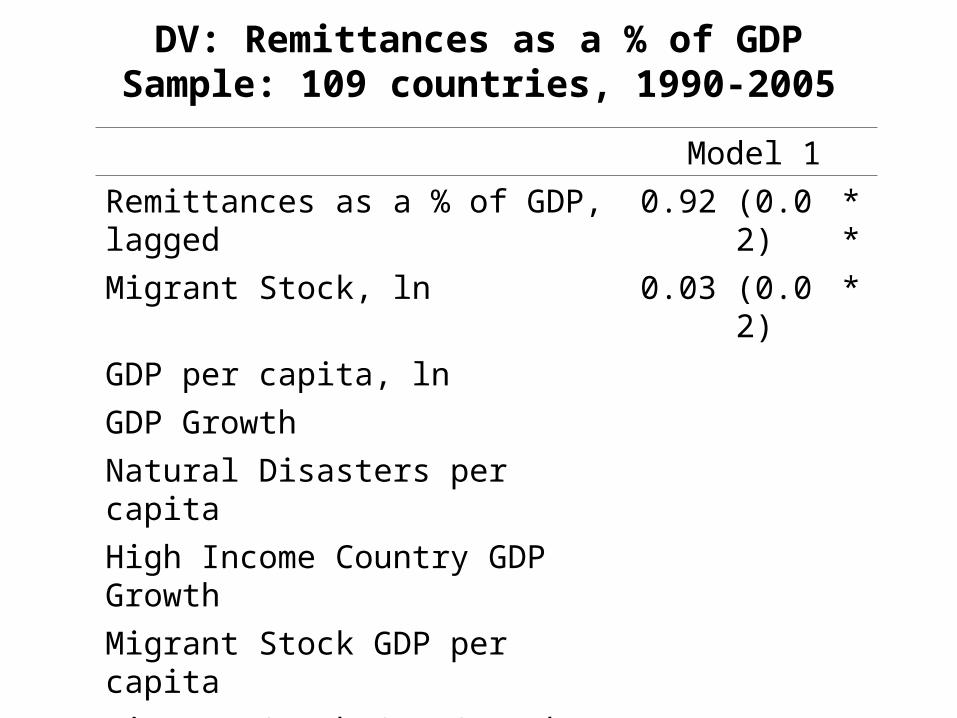
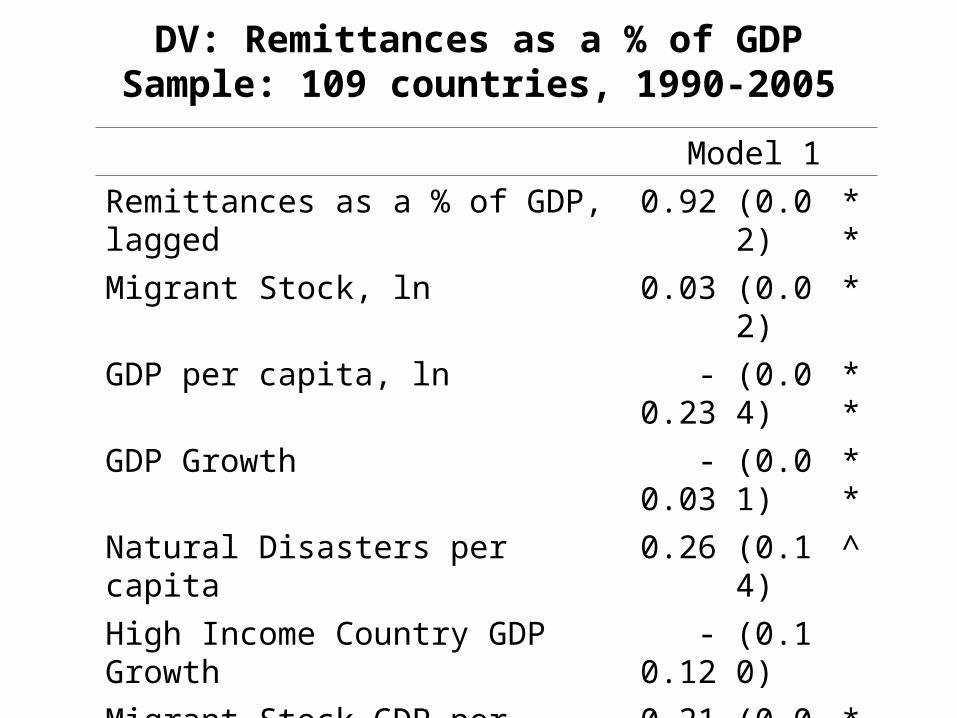
DV: Remittances as a % of GDPSample: 109 countries, 1990-2005
Model 1
Remittances as a % of GDP, lagged
Migrant Stock, ln
GDP per capita, ln
GDP Growth
Natural Disasters per capita
High Income Country GDP Growth
Migrant Stock GDP per capita
Migrant Stock GDP Growth
Constant
R2 0.93
Observations 1424
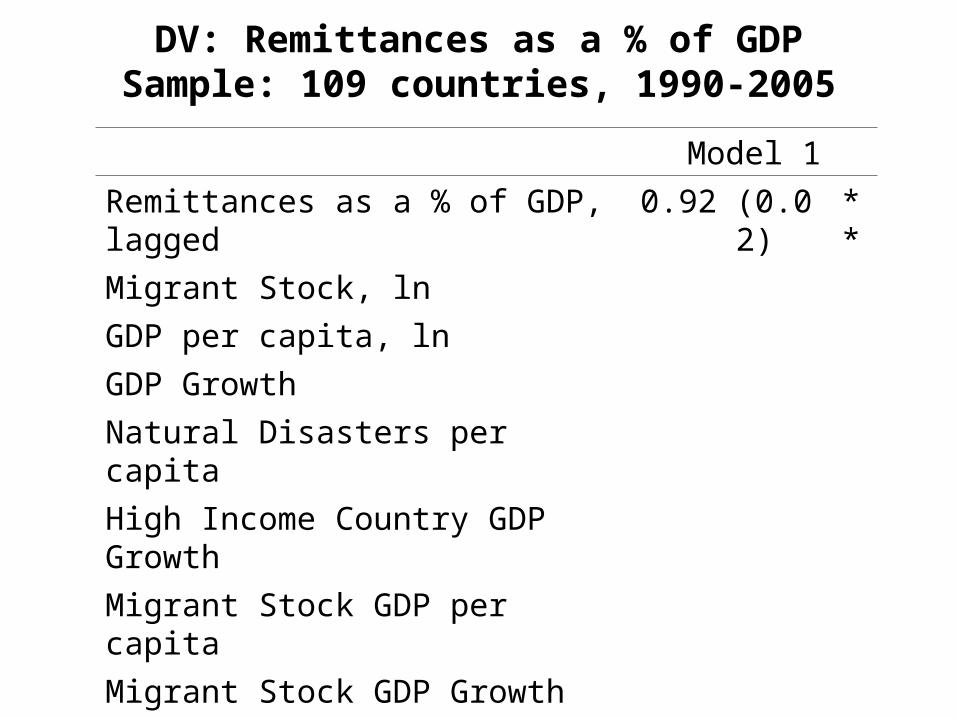
DV: Remittances as a % of GDPSample: 109 countries, 1990-2005
Model 1
Remittances as a % of GDP, lagged 0.92 (0.02) **
Migrant Stock, ln
GDP per capita, ln
GDP Growth
Natural Disasters per capita
High Income Country GDP Growth
Migrant Stock GDP per capita
Migrant Stock GDP Growth
Constant
R2 0.93
Observations 1424
DV: Remittances as a % of GDPSample: 109 countries, 1990-2005
Model 1
Remittances as a % of GDP, lagged 0.92 (0.02) **
Migrant Stock, ln 0.03 (0.02) *
GDP per capita, ln
GDP Growth
Natural Disasters per capita
High Income Country GDP Growth
Migrant Stock GDP per capita
Migrant Stock GDP Growth
Constant
R2 0.93
Observations 1424
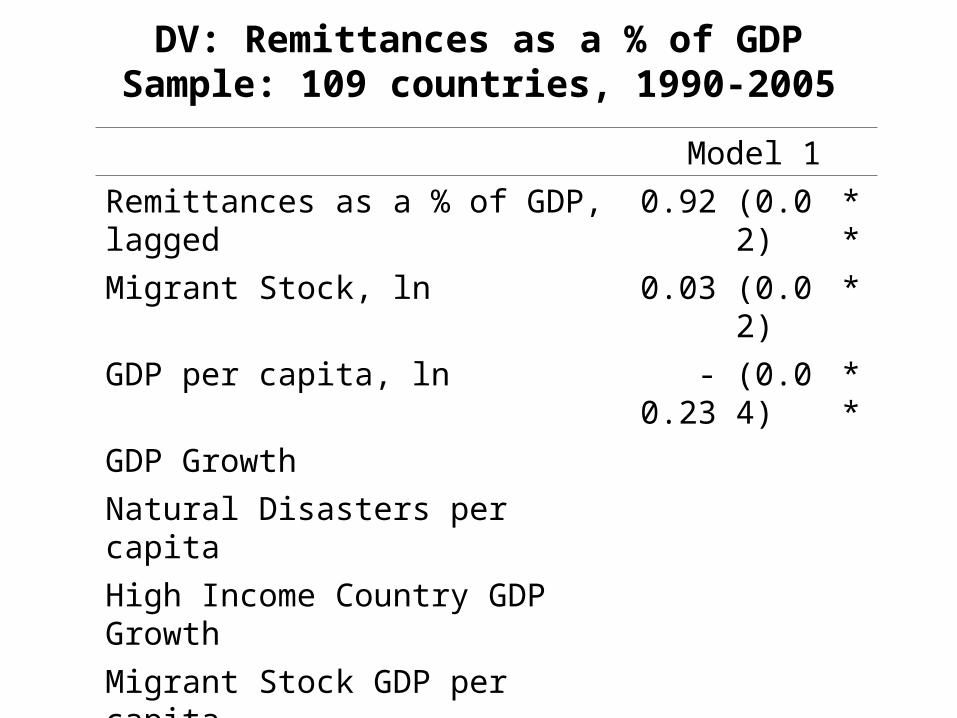
DV: Remittances as a % of GDPSample: 109 countries, 1990-2005
Model 1
Remittances as a % of GDP, lagged 0.92 (0.02) **
Migrant Stock, ln 0.03 (0.02) *
GDP per capita, ln -0.23 (0.04) **
GDP Growth
Natural Disasters per capita
High Income Country GDP Growth
Migrant Stock GDP per capita
Migrant Stock GDP Growth
Constant
R2 0.93
Observations 1424
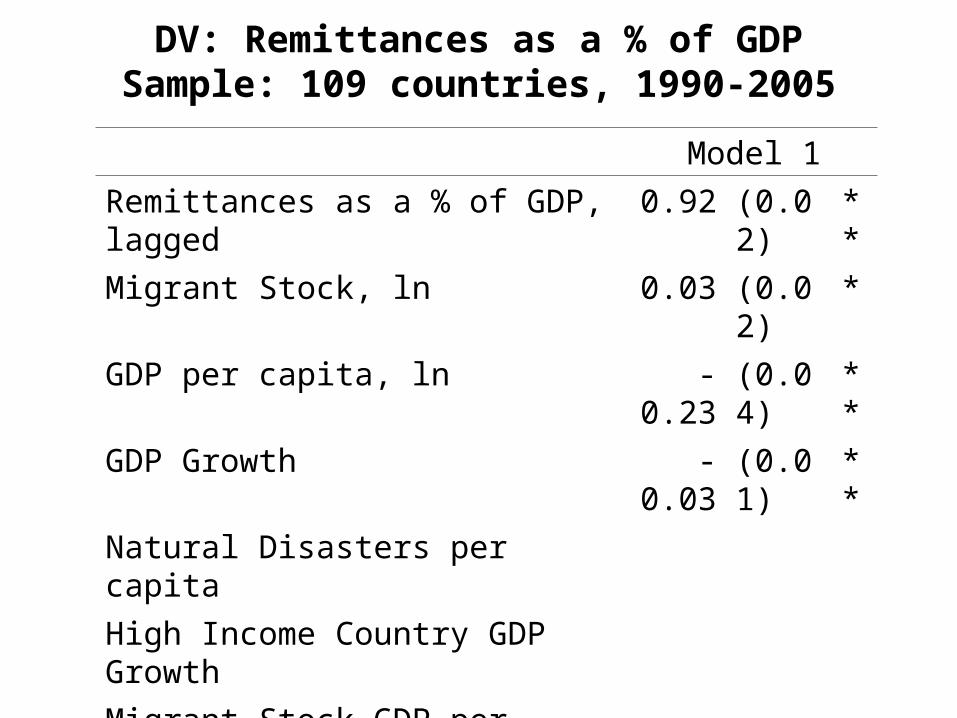
DV: Remittances as a % of GDPSample: 109 countries, 1990-2005
Model 1
Remittances as a % of GDP, lagged 0.92 (0.02) **
Migrant Stock, ln 0.03 (0.02) *
GDP per capita, ln -0.23 (0.04) **
GDP Growth -0.03 (0.01) **
Natural Disasters per capita
High Income Country GDP Growth
Migrant Stock GDP per capita
Migrant Stock GDP Growth
Constant
R2 0.93
Observations 1424

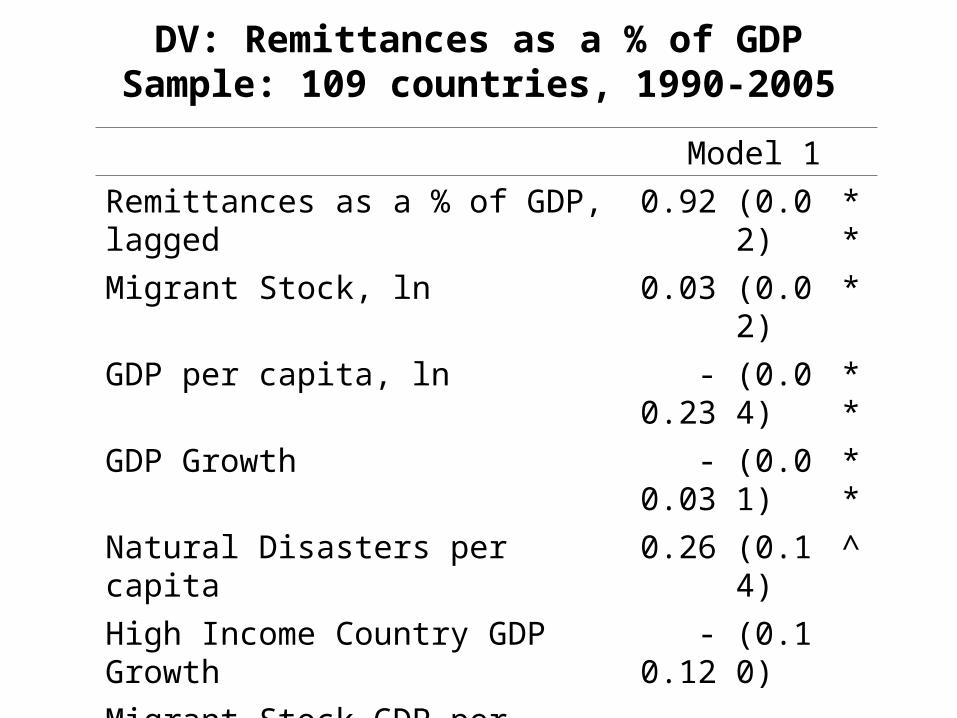
DV: Remittances as a % of GDPSample: 109 countries, 1990-2005
Model 1
Remittances as a % of GDP, lagged 0.92 (0.02) **
Migrant Stock, ln 0.03 (0.02) *
GDP per capita, ln -0.23 (0.04) **
GDP Growth -0.03 (0.01) **
Natural Disasters per capita 0.26 (0.14) ^
High Income Country GDP Growth
Migrant Stock GDP per capita
Migrant Stock GDP Growth
Constant
R2 0.93
Observations 1424
DV: Remittances as a % of GDPSample: 109 countries, 1990-2005
Model 1
Remittances as a % of GDP, lagged 0.92 (0.02) **
Migrant Stock, ln 0.03 (0.02) *
GDP per capita, ln -0.23 (0.04) **
GDP Growth -0.03 (0.01) **
Natural Disasters per capita 0.26 (0.14) ^
High Income Country GDP Growth -0.12 (0.10)
Migrant Stock GDP per capita
Migrant Stock GDP Growth
Constant
R2 0.93
Observations 1424

DV: Remittances as a % of GDPSample: 109 countries, 1990-2005
Model 1
Remittances as a % of GDP, lagged 0.92 (0.02) **
Migrant Stock, ln 0.03 (0.02) *
GDP per capita, ln -0.23 (0.04) **
GDP Growth -0.03 (0.01) **
Natural Disasters per capita 0.26 (0.14) ^
High Income Country GDP Growth -0.12 (0.10)
Migrant Stock GDP per capita 0.21 (0.04) **
Migrant Stock GDP Growth
Constant
R2 0.93
Observations 1424
DV: Remittances as a % of GDPSample: 109 countries, 1990-2005
Model 1
Remittances as a % of GDP, lagged 0.92 (0.02) **
Migrant Stock, ln 0.03 (0.02) *
GDP per capita, ln -0.23 (0.04) **
GDP Growth -0.03 (0.01) **
Natural Disasters per capita 0.26 (0.14) ^
High Income Country GDP Growth -0.12 (0.10)
Migrant Stock GDP per capita 0.21 (0.04) **
Migrant Stock GDP Growth 0.04 (0.03)
Constant
R2 0.93
Observations 1424

DV: Remittances as a % of GDPSample: 109 countries, 1990-2005
Model 1
Remittances as a % of GDP, lagged 0.92 (0.02) **
Migrant Stock, ln 0.03 (0.02) *
GDP per capita, ln -0.23 (0.04) **
GDP Growth -0.03 (0.01) **
Natural Disasters per capita 0.26 (0.14) ^
High Income Country GDP Growth -0.12 (0.10)
Migrant Stock GDP per capita 0.21 (0.04) **
Migrant Stock GDP Growth 0.04 (0.03)
Constant 0.11 (0.30)
R2 0.93
Observations 1424
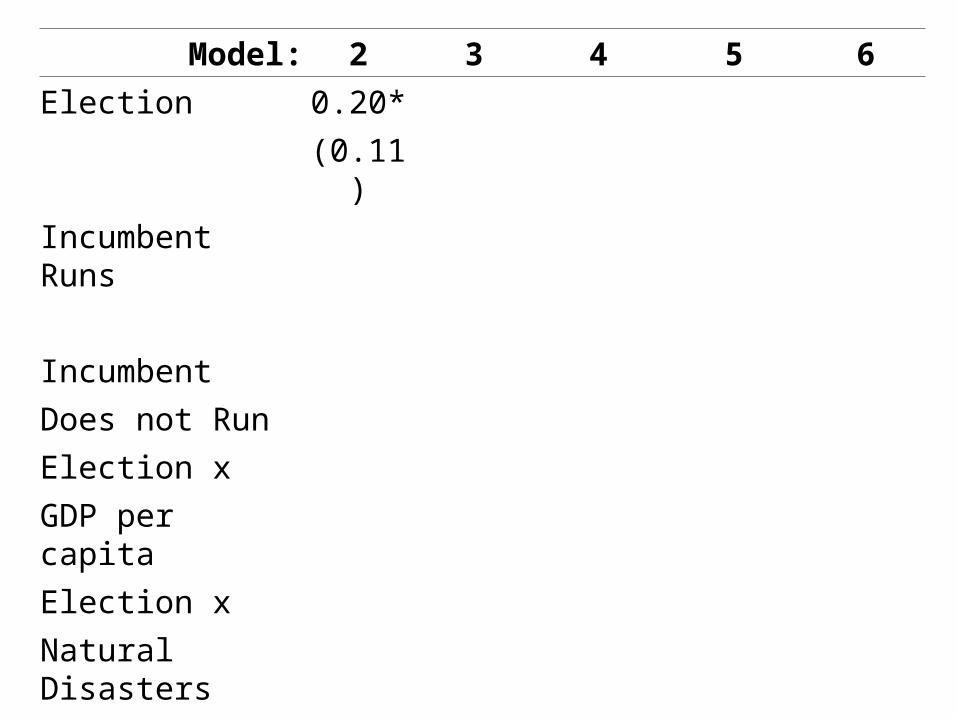
Model: 2 3 4 5 6
Election 0.20*
(0.11)
Incumbent Runs
Incumbent
Does not Run
Election x
GDP per capita
Election x
Natural Disasters
Election x
GDP Growth
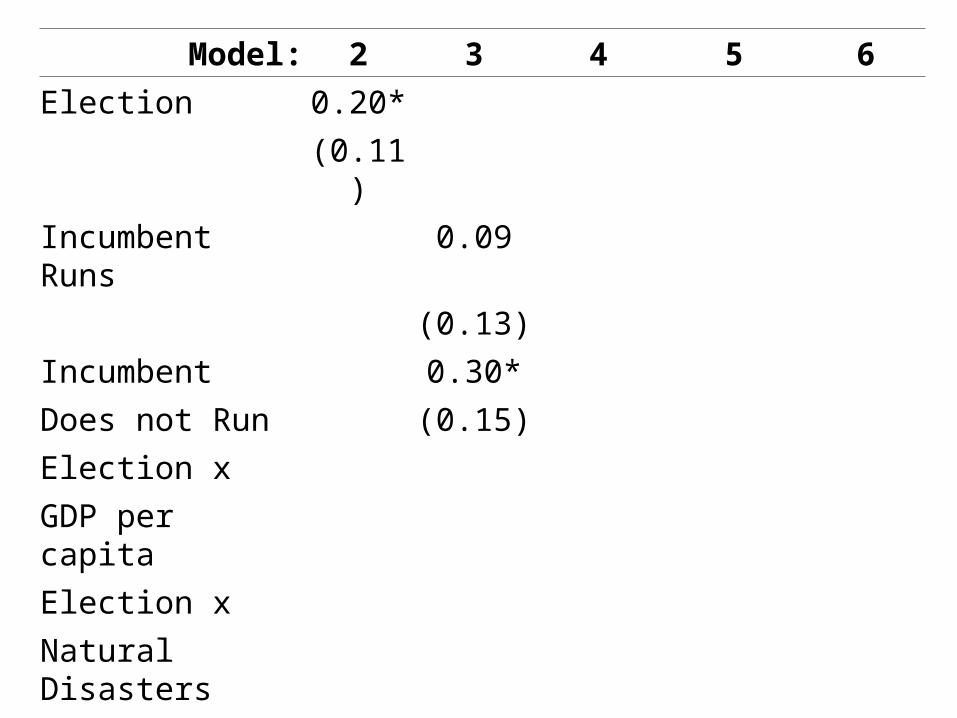
Model: 2 3 4 5 6
Election 0.20*
(0.11)
Incumbent Runs 0.09
(0.13)
Incumbent 0.30*
Does not Run (0.15)
Election x
GDP per capita
Election x
Natural Disasters
Election x
GDP Growth
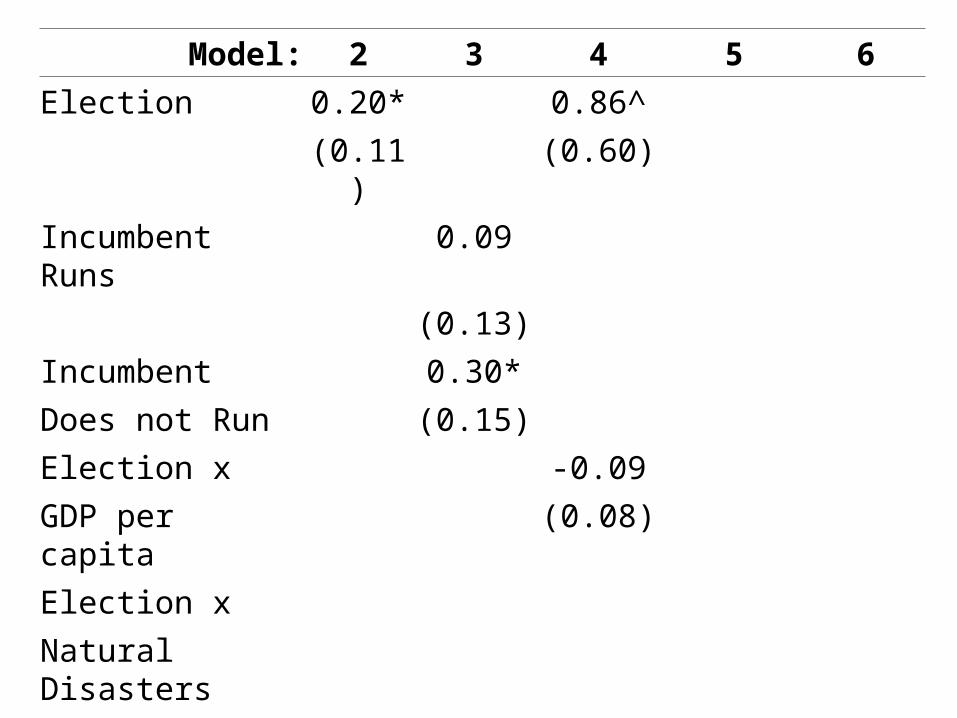
Model: 2 3 4 5 6
Election 0.20* 0.86^
(0.11) (0.60)
Incumbent Runs 0.09
(0.13)
Incumbent 0.30*
Does not Run (0.15)
Election x -0.09
GDP per capita (0.08)
Election x
Natural Disasters
Election x
GDP Growth
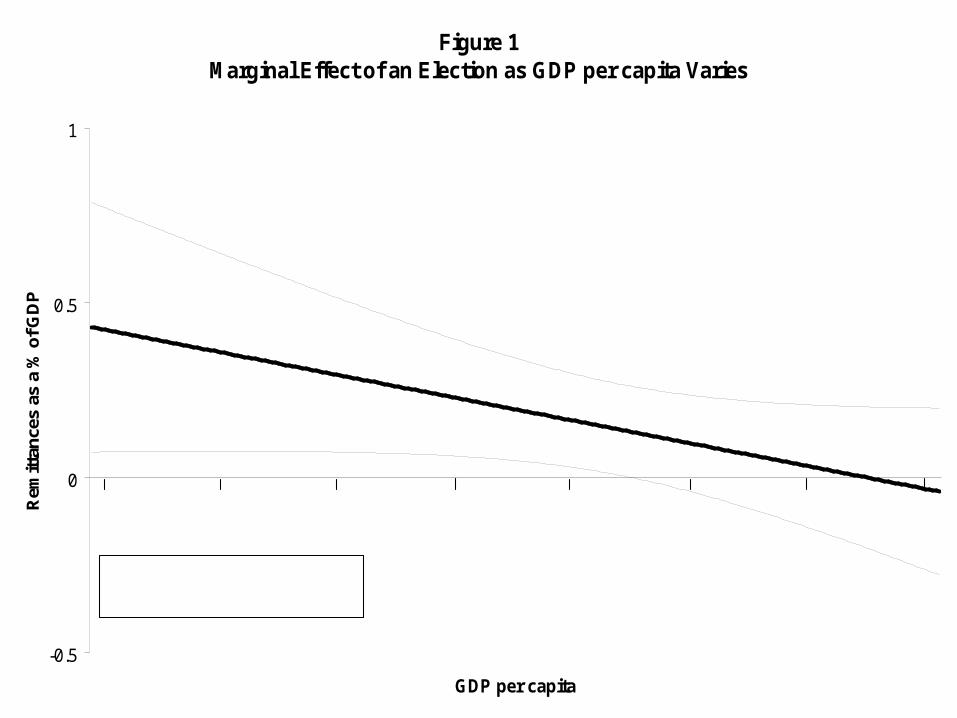
Figure 1Marginal Effect of an Election as GDP per capita Varies
-0.5
0
0.5
1
GDP per capita
Rem
ittan
ces
as a
% o
f GD
P
100 200 400 800 1600 3200 6400 1280
__ Remittances as a % of GDP- - - 90% Confidence Intervals
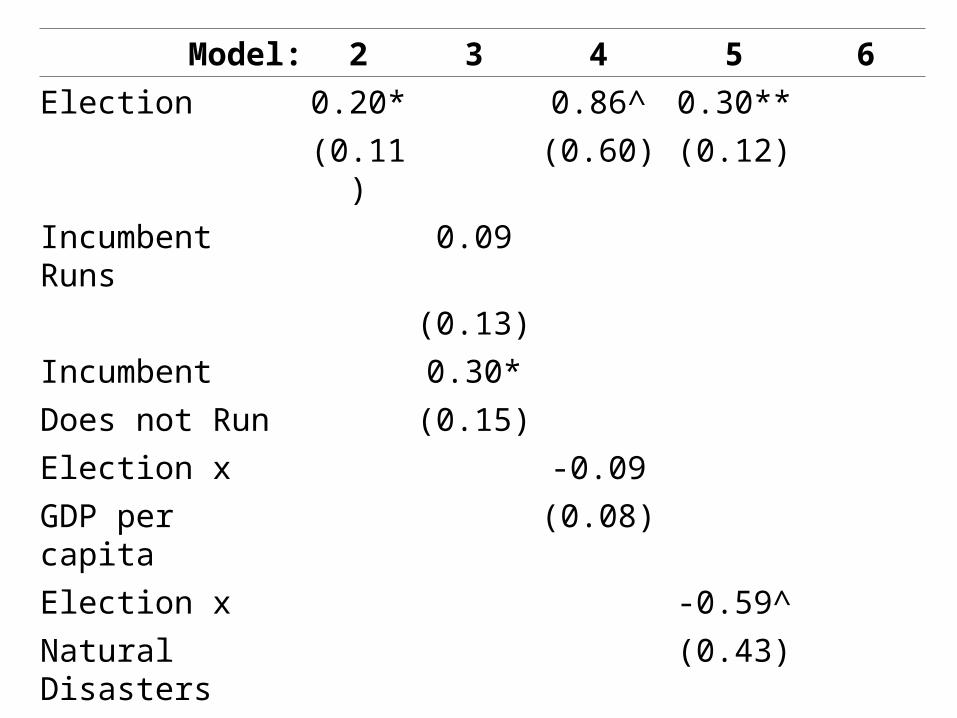
Model: 2 3 4 5 6
Election 0.20* 0.86^ 0.30**
(0.11) (0.60) (0.12)
Incumbent Runs 0.09
(0.13)
Incumbent 0.30*
Does not Run (0.15)
Election x -0.09
GDP per capita (0.08)
Election x -0.59^
Natural Disasters (0.43)
Election x
GDP Growth
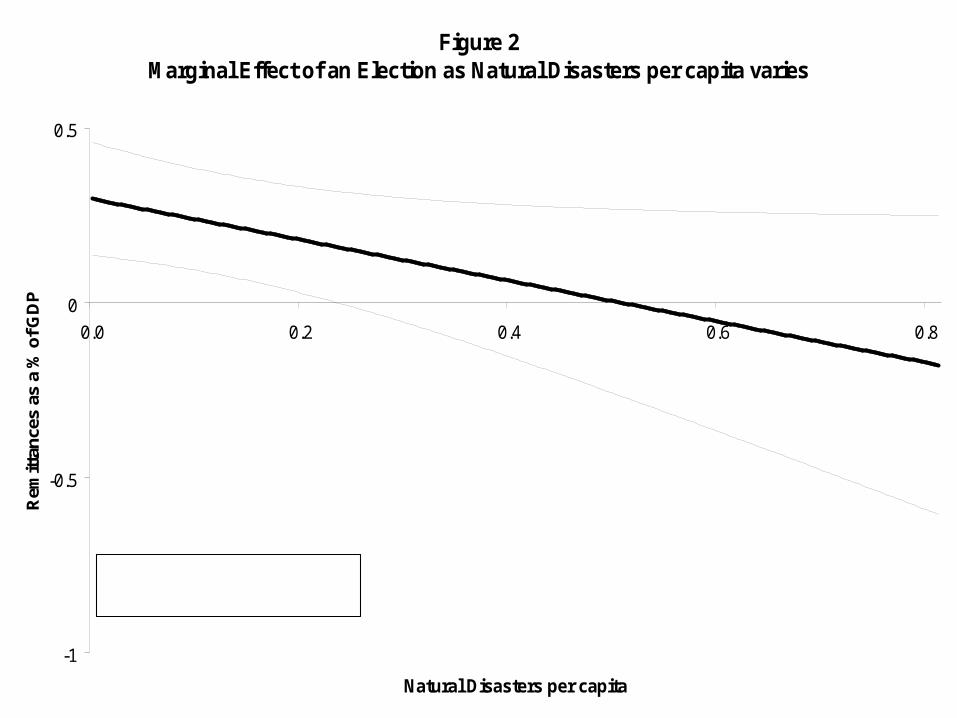
Figure 2Marginal Effect of an Election as Natural Disasters per capita varies
-1
-0.5
0
0.5
0.0 0.2 0.4 0.6 0.8
Natural Disasters per capita
Rem
ittan
ces
as a
% o
f GD
P
__ Remittances as a % of GDP- - - 90% Confidence Intervals
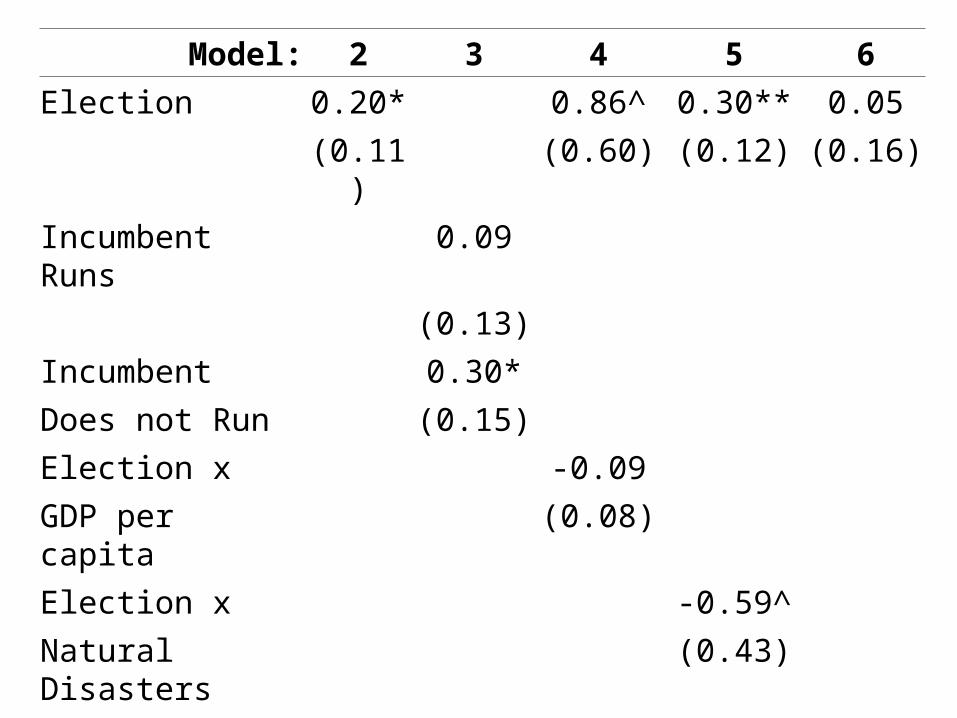
Model: 2 3 4 5 6
Election 0.20* 0.86^ 0.30** 0.05
(0.11) (0.60) (0.12) (0.16)
Incumbent Runs 0.09
(0.13)
Incumbent 0.30*
Does not Run (0.15)
Election x -0.09
GDP per capita (0.08)
Election x -0.59^
Natural Disasters (0.43)
Election x 0.04
GDP Growth (0.03)
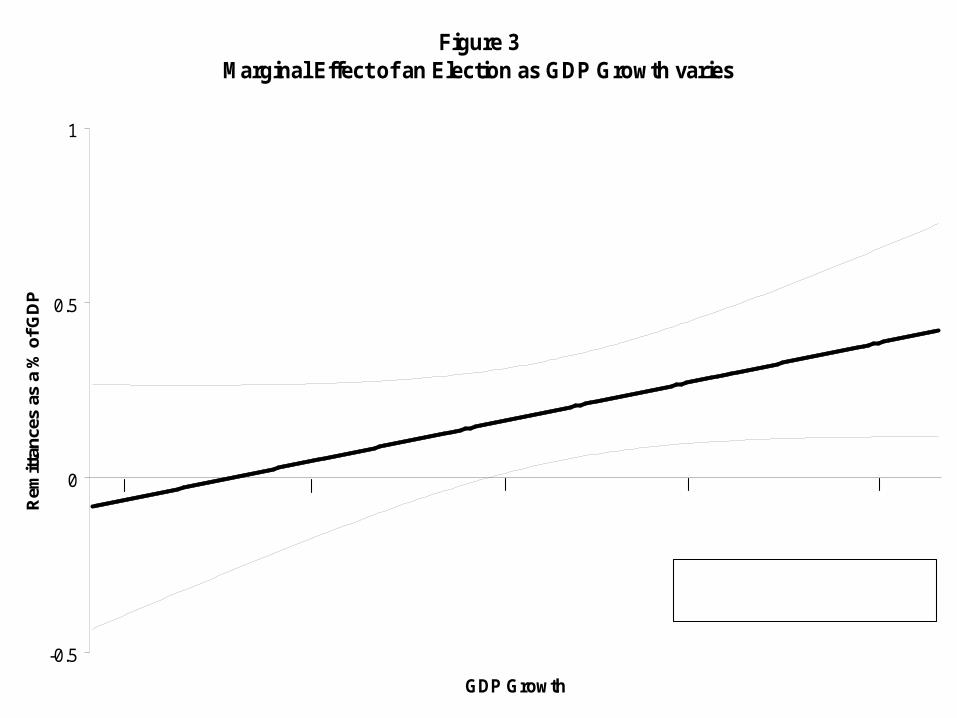
Figure 3Marginal Effect of an Election as GDP Growth varies
-0.5
0
0.5
1
GDP Growth
Rem
ittan
ces
as a
% o
f GD
P
__ Remittances as a % of GDP- - - 90% Confidence Intervals
-3.0 9.03.0 6.00.0
Conclusion
• Migrants remit more in election years• But political remittances are context-specific
Future Work
• Sub-national elections• State response