political & market drivers for nuclear energy: the global ... energy... · political &...
TRANSCRIPT

Political & Market Drivers for Nuclear Energy:
The Global Landscape to 2030… and 2050 US Energy Association
July 2016
”Nuclear Energy enables Urban Living - Globally”
Andrew D. Paterson EBI / Verdigris Capital
571-308-5845
www.environmentalbusiness.org
Walter S. Howes Verdigris Capital
202-342-5323
Clean
cities
Transport
autonomy
Water surety Food
National
Sovereignty
Verdigris
Capital, LLC

OUTLINE
Overview: Shifting Global Landscape
A) Nuclear Power enables Urban Living
B) US Strategic Position Declining
C) Nuclear: Sovereign Marketing & Finance
D) National Strategies shaped by Supply/Demand Factors
2

Elements of Strategy: EPAct 2005, Recovery Act 2009
3
Energy Policy Act of 2005
Recovery Act of 2009; $6B for Title 17
Title 17 DOE Loan Program: Innovative Tech DOE Loan Program Expansion
Our analytical work fed the creation of DOE Loan Program in EPAct 2005, expanded in 2009.
http://www.ne.doe.gov/neac/neacPDFs/bergOct02NERAC.pdf
“The DOE Loan
Program is an
important tool to
address market
gaps and promote
innovation. “
Walter Howes
First DOE Loan
Program Director
(2006-2007)
Verdigris
Capital, LLC

Shifting Leadership in Nuclear Power…
4
2012
“Maintaining”…
Regaining
2013
UK DECC: “Regaining”…
2014
Redefining Leadership in
the Global Nuclear Market
Redefining Leadership
2013
CSIS: “Restoring”
Restoring U.S.
Leadership in
Nuclear Energy 2013
REACTOR RACE: SOUTH KOREA’S
EXPORT SUCCESSES & CHALLENGES
http://www.keia.org/sites/default/files/publications/south_koreas_nuclear_export_successes_and_challenges.pdf
Andrew Paterson
Walter S. Howes
The power of
international alliances
“No country is now
self-sufficient in
nuclear power.”

Nuclear Energy: CURRENT GLOBAL LANDSCAPE
While the USA leads the world in Operating reactors (100 units),
USA no longer leads in construction. China is building.
Most reactor build is outside NATO-- in Asia, MidEast. *How
much of that market is open to US companies, allies?*
“Restoring US leadership” in nuclear power requires a strategy.
USA lost capabilities to make major components.
Japan owns US vendors.
US utilities are smaller, and not active globally.
Financial markets will NOT lead on new financings – New
reactor build requires a National strategy, Federal
investment, Alliances, and Risk-sharing.
“Getting the government out of the way” is not a viable national
strategy in the nuclear sector. Well-negotiated financing can
leverage federal funds, better than $10 to $1 (vs. just subsidies).
5
CHINA AND RUSSIA LAY
FOUNDATION FOR MASSIVE
ECONOMIC COOPERATION
July 2015
2007 2006
Verdigris
Capital, LLC

Nuclear Generation by Country - 2010
6
USA China
Portion of electricity from nuclear (vertical) by volume (width); P5s still dominate.
China + India are >50% of new reactor build, but still over-dependent on coal.
?
P5 P5 P5 P5 P5
Elite UNSC “P5 Club”… still more than half all operating reactors P5
P5 = UN Security Council Permanent Voting Member: USA, UK, France, Russia, China – Nuclear powers
28 different
owners

IFNEC: Nation-States Govern Nuclear Acceptance
7
Despite Fukushima and higher costs, more countries are weighing nuclear… why?

Why we still need Nuclear Power… (after Fukushima)
8
Leading climate scientist James Hansen of NASA, now Columbia University:
"Environmentalists need to recognize that attempts to force all-renewable policies on
all the world will only assure that fossil fuels continue to reign for base-load electric
power, making it unlikely that abundant affordable power will exist and implausible
that fossil fuels will be phased out… A preferable approach, for the sake of both
global climate and local pollution reduction, would be a combination of renewable
energy and advanced (3rd and 4th) generation nuclear power plants.”
www.scientificamerican.com/article/how-nuclear-power-can-stop-global-warming/
How Nuclear Power Can Stop Global Warming (Dec. 2013)
Why We Still Need Nuclear Power -- Making Clean Energy Safe and Affordable
“In the US, an already slow approach to new nuclear plants slowed even further in
the face of an unanticipated abundance of natural gas. It would be a mistake,
however, to let Fukushima cause governments to abandon nuclear power
and its benefits. Electricity generation emits more carbon dioxide in the US than
does transportation or industry, and nuclear power is the largest source of carbon-
free electricity in the country.” Dr. Ernest Moniz, then director of MIT Energy Initiative; now US Secretary of Energy (2013+)
“Why We Still Need Nuclear Power”, Foreign Affairs, December 2011

COP21 (Paris) won’t be enough; Nuclear needed
9
Insert Nuclear here

UN “Deep De-carbonization” Calls for Nuclear + RE
10
July 2014
http://unsdsn.org/what-we-do/deep-decarbonization-pathways/
BASELOAD NEEDED
FOR RELIABILITY
• Wind varies
• Hydro competes for
water; vulnerable to
drought
• Solar cannot power
urban cores or mfg.
• Biomass faces
drought, floods and
scaling issues
• Geothermal not
available broadly
• Baseload CCS faces
cost challenges
• Nuclear needed in
urban areas to
electrify transport
In sync with White House Climate Plan, Commitments at COP21

A) Nuclear Power enables Urban Living
11
Why, after Fukushima, are countries
pursuing Nuclear Power ?
Why is it being built at all ?

McKinsey: 600 Global Cities = 60% of World GDP
12
The primary driver for Nuclear Power is Urban Development, the need for Clean, Reliable Energy.
Cities fuel more than 60% of world GDP. Growth shifted to Asia in 2000 as OECD crested.
Urban world: Mapping the Economic Power of Cities (March 2011) www.mckinsey.com/global-themes/urbanization/urban-world-mapping-the-economic-power-of-cities
Drivers for the Political Economy of Nuclear Energy
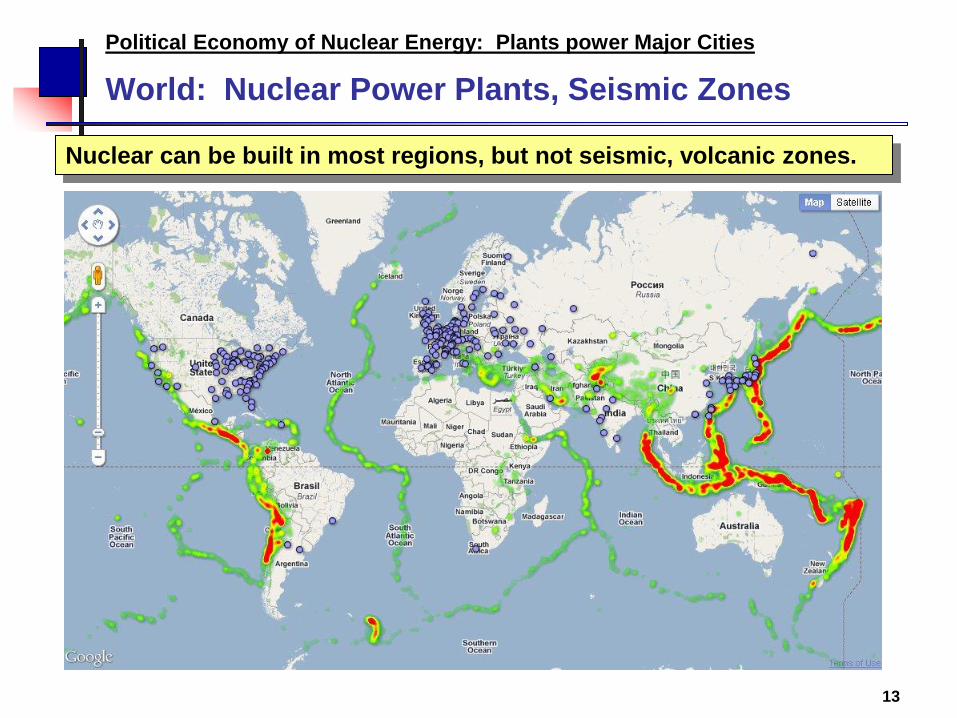
World: Nuclear Power Plants, Seismic Zones
13
Political Economy of Nuclear Energy: Plants power Major Cities
Nuclear can be built in most regions, but not seismic, volcanic zones.

Pace of Growth: Then (1990) and Now (2010)
14
Shanghai, 1990
Shanghai, 2010
Dubai, 1990
Dubai, 2010
http://www.hongkiat.com/blog/world-skylines-then-now/
“DEVELOPING” WORLD is… Developing.
Migration to cities is largest trend shaping development in 21stC, 4-5m / month.

UN: Another 2 billion in cities by 2040 (6b total)
15 http://esa.un.org/unpd/wup/Highlights/WUP2014-Highlights.pdf
3b
1b
2 reactors serve a city of 500k-1m people, depending on consumption per household,
plus level of urban development (office towers, mass transit, water needs, elec cars).
One billion people require 400 to1,000 GWe if served by nuclear energy.
100 reactors: $600B investment
US: 80 urban areas >500k

“Urban Archipelagos” as Global Economic Hubs
16
URBAN ARCHIPELAGOS AS CENTERS OF GRAVITY
Mega-city clusters dominate the world economy. In many countries,
the capital city or financial center often represents up to half
or more of the national GDP. By 2030, we could have as
many as 50 such urban hubs anchoring the global system.
http://www.paragkhanna.com/connectography/
Boston-
WDC L.A. – S.F.
Linked Archipelagos demand highly reliably clean energy

EIA: Nuclear Capacity by decade, 1990
17
370 Most regions double capacity in 80s

EIA: Nuclear Capacity by decade, 2010
18
370 Stasis from 2000-10; Asia emerging
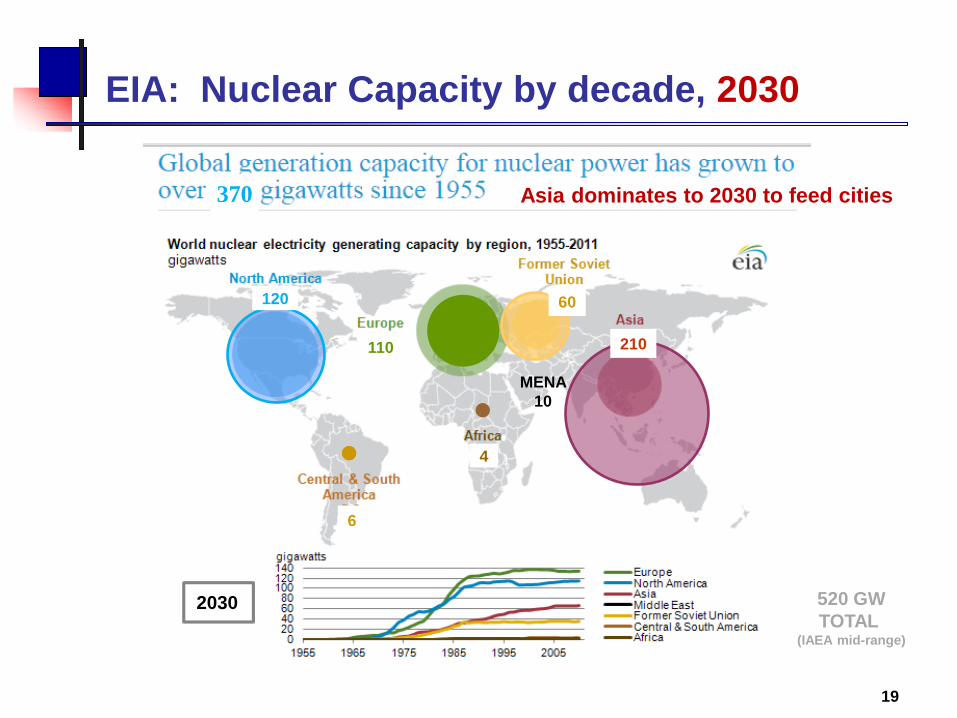
EIA: Nuclear Capacity by decade, 2030
19
2030
120
110
60
210
4
6
MENA
10
370
520 GW
TOTAL (IAEA mid-range)
Asia dominates to 2030 to feed cities

Largest cities by 2030 concentrated in Asia
20 www.bloomberg.com/infographics/2014-09-09/global-megacities-by-2030.html
BLOOMBERG
Sept. 9, 2014
Only Japan is
losing population

21st Century: Urbanization drives demand in Asia
21
Seoul
Where do I put
a wind turbine
or solar panel ?
May 7,
2013

UK, Asia: Wind, Solar use much more land
22
10 SqKM (with buffer)
> 800 SqKM 400 - 500 SqKM
Wind and solar are (1) less dense energy forms; (2) only run 15%-30% of the time
(<15% in UK); and (3) require storage and backup gas turbines for downtime.
Hinkley Point C Reactor
E=mc2
SOLAR
WIND FARM
Washington DC = 177 SqKM
Nuclear Power enables Urban Living
3.2 GWe
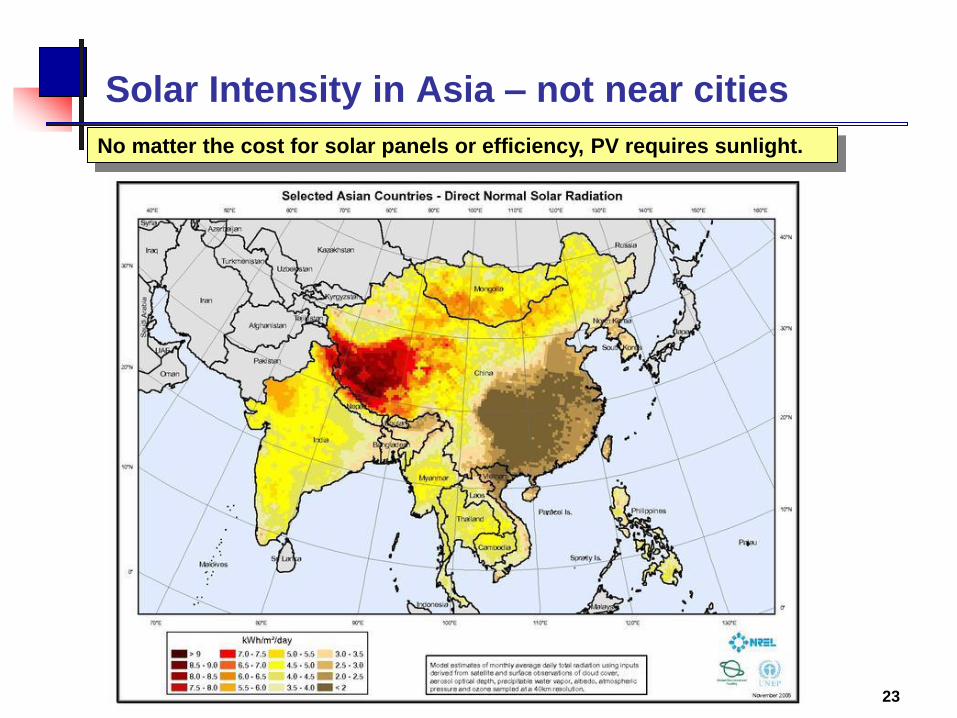
Solar Intensity in Asia – not near cities
23
No matter the cost for solar panels or efficiency, PV requires sunlight.

Jan. 2015
PM 2.5
Another reason solar doesn’t work well in Beijing…
24 Beijing “AIR-POCALYPSE”, Jan. 2013: 750+
NASA photo
Forbidden City…?
Measured at US Embassy, Beijing

Urban Transit: E-buses starting to roll
25 http://primove.bombardier.com/projects/europe/germany-berlin-primove-e-bus.html
Inductive charging
on city routes
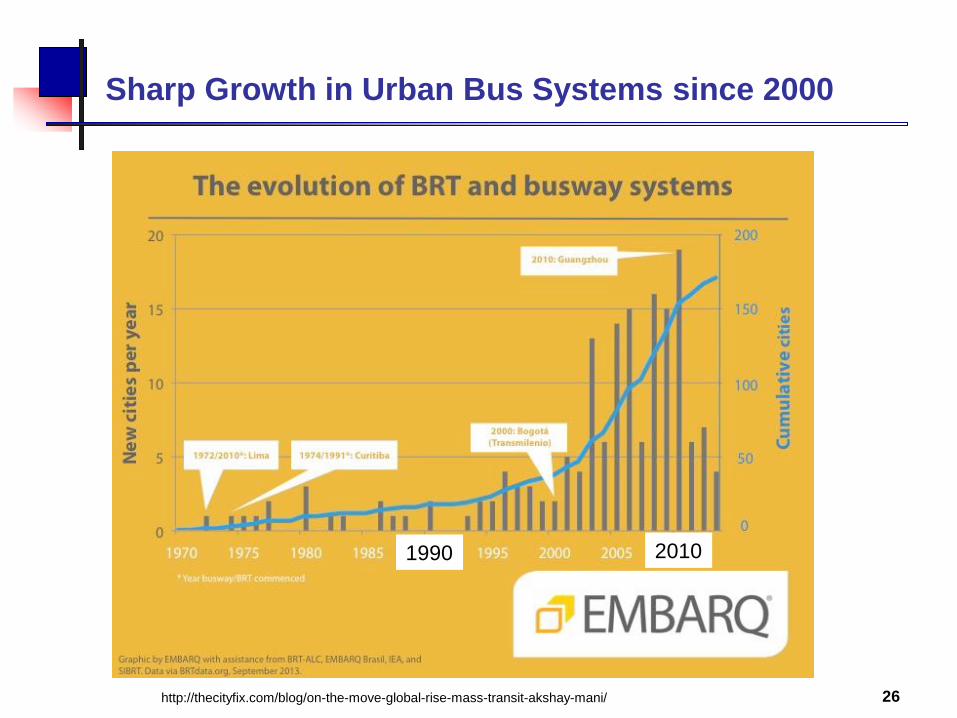
Sharp Growth in Urban Bus Systems since 2000
26 http://thecityfix.com/blog/on-the-move-global-rise-mass-transit-akshay-mani/
2010 1990

EVs/PHEVs: 20% of Global sales by 2030
27
2040 2020
Onset of Electric Vehicles after 2020 matches growth in Adv. Nuclear for big cities.
Growing Urban Demand – Transport Sector
Nuclear Power enables Urban Living

S.Korea: Largest Auto Factory in the World (Ulsan)
28
Where can enough solar panels or wind turbines be placed to power this?
Wolsong
Nuclear
4,500 MW
Solar
30 MW, of
Rooftop PV
In Ulsan

Water Project Market to Triple by 2020 from today
29
http://bluefieldresearch.com/global-water-ppp-market-triple-2020/
18 February 2016 – Many countries are facing a perfect storm of financing constraints and water infrastructure shortfalls.
Dramatic declines in oil and commodity prices, low water tariffs, groundwater overdrafts, and untreated wastewater
discharge are prompting governments to tap the private sector through public-private partnership (PPP) schemes.
According to a new report by Bluefield Research, the global market for Water PPP projects is set to nearly
triple between 2016 and 2020,

Reactors Under Construction + “Planned” (approved)
30
+5
GW by 2020
+4-8
GW by 2030
+8-12 +1
+5 +4-8
+4 +8-10
+6
+6-8
+20
+ 40-60 GW
+6
+12-20
+4
• Under Construction: Assured
• “Planned”: Likely (some approvals made)
• “Proposed”: Possible, based on need (after 2030)
Some open bidding
More nationalized
WNA: www.world-nuclear.org/information-library/current-and-future-generation/plans-for-new-reactors-worldwide.aspx
Under Construction Operating
2030
to 2040
180+GW
+ 40 GW
+ 120 GW

Clean, Compact, Reliable Energy for Large Cities
SUMMARY OF DRIVERS Weakest Alternatives
Safe, Reliable power for Cities Biomass; Geotherm
Without emissions (HazAPs + GHGs) Coal, [less so N.gas]
In any weather Wind, Solar, Hydro (drought, flood)
On a small footprint Wind, Utility Solar
For dense 24/7 end use Wind, Solar, Biomass
(Office towers, High-rise Apts, Elec transit) [Geotherm may not be near]
In Advanced Mfg economies Biomass
Economic, w/ stable pricing, reliable supply Oil, N.gas, if imported (Asia, EU)
Often with Gov’t as customer Depends on policy
31 Verdigris
Capital, LLC

B) US Strategic Position Declining
32
What is the US Position globally ?
Why is it declining? Do we care?
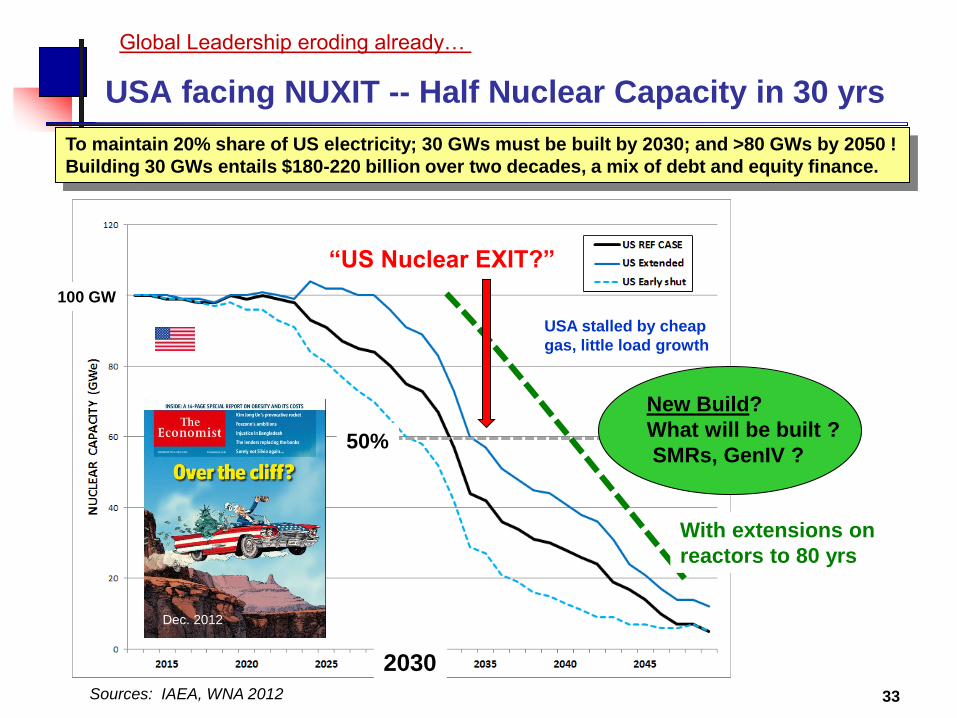
USA facing NUXIT -- Half Nuclear Capacity in 30 yrs
33
To maintain 20% share of US electricity; 30 GWs must be built by 2030; and >80 GWs by 2050 !
Building 30 GWs entails $180-220 billion over two decades, a mix of debt and equity finance.
Global Leadership eroding already…
NOW
Sources: IAEA, WNA 2012
50%
“US Nuclear EXIT?”
100 GW
Dec. 2012
USA stalled by cheap
gas, little load growth
New Build?
What will be built ?
SMRs, GenIV ?
With extensions on
reactors to 80 yrs
2030

US Strategy…? Regional Differences pose challenge
34
Large regional disparity in impact of Nuclear Power hinders a National Strategy politically.

“Nuclear Matters”… How’s that going?
35
June 2016
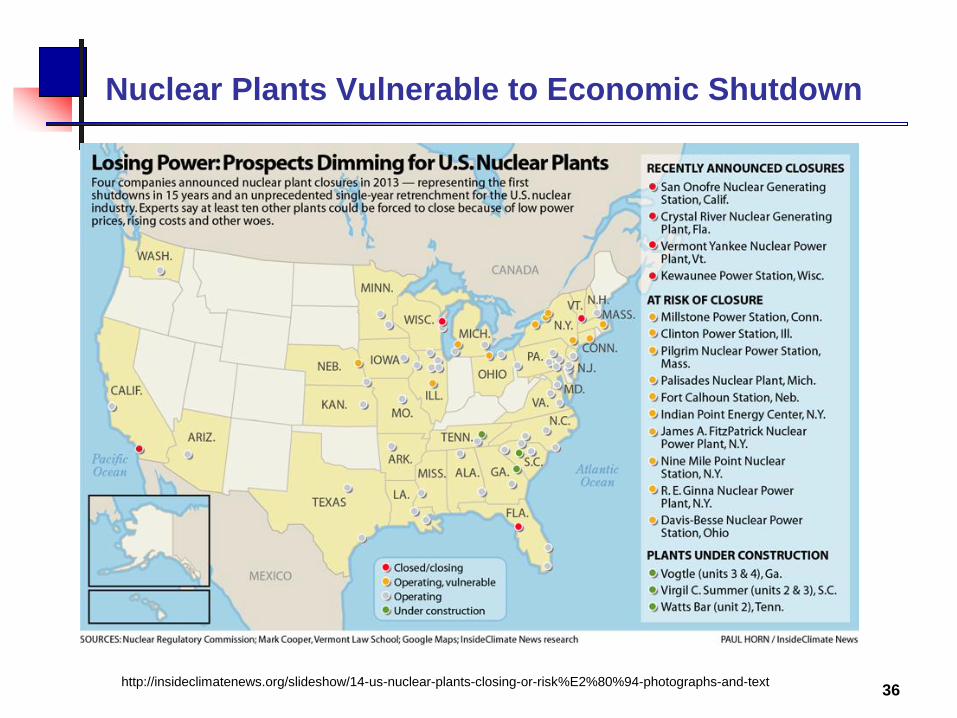
Nuclear Plants Vulnerable to Economic Shutdown
36 http://insideclimatenews.org/slideshow/14-us-nuclear-plants-closing-or-risk%E2%80%94-photographs-and-text
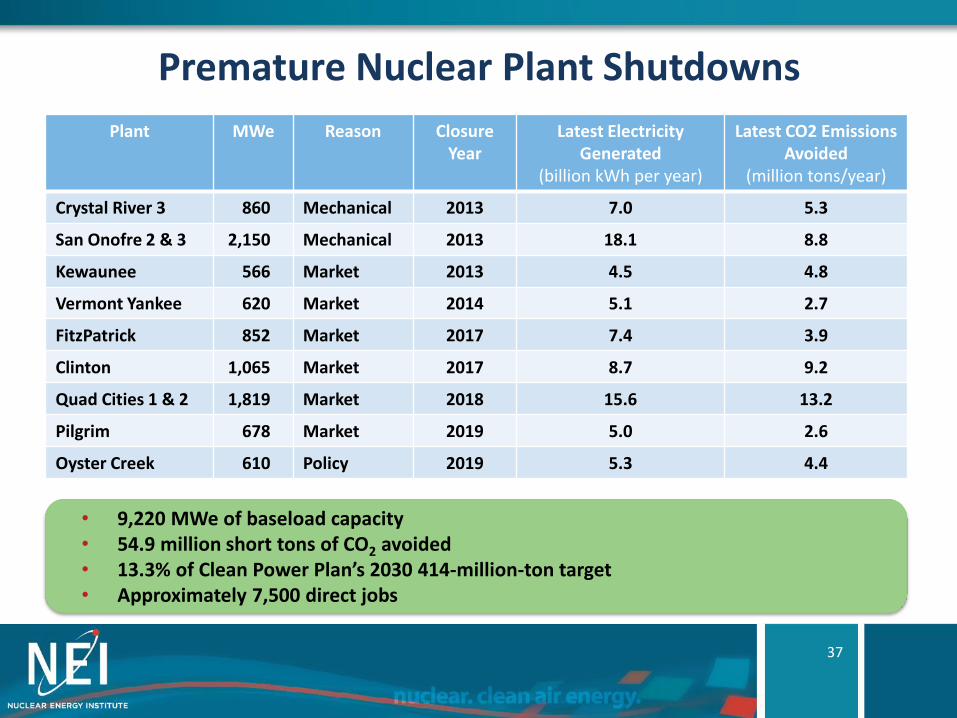
Premature Nuclear Plant Shutdowns
Plant MWe Reason Closure Year
Latest Electricity Generated
(billion kWh per year)
Latest CO2 Emissions Avoided
(million tons/year)
Crystal River 3 860 Mechanical 2013 7.0 5.3
San Onofre 2 & 3 2,150 Mechanical 2013 18.1 8.8
Kewaunee 566 Market 2013 4.5 4.8
Vermont Yankee 620 Market 2014 5.1 2.7
FitzPatrick 852 Market 2017 7.4 3.9
Clinton 1,065 Market 2017 8.7 9.2
Quad Cities 1 & 2 1,819 Market 2018 15.6 13.2
Pilgrim 678 Market 2019 5.0 2.6
Oyster Creek 610 Policy 2019 5.3 4.4
• 9,220 MWe of baseload capacity • 54.9 million short tons of CO2 avoided • 13.3% of Clean Power Plan’s 2030 414-million-ton target • Approximately 7,500 direct jobs
37

The Future of Nuclear Energy
38

The NEXT Chapter: Not Policy Parity… Preference
The Old Way… “Parity”
Go along to get along • Party for parity with RE
But, not all RE groups support
tax policy parity for nuclear
Cheap gas undermines
market position Capital intensive sources require
stable prices, not merchant
Commercial nuclear avoids link
to Nuclear for National Security
Nuclear utilities see less
importance in exports
39
An UPRATE… “Preference”
“Nuclear is Different” • Offers large scale GHG savings
• INDCs cannot be met w/o Nuclear
• Unique value for urban reliability
where open space is scarce
Grid reliability is crucial
P5 Status tied to Nuclear • China, Russia lead in nuclear?
National Security consequences?
• Other countries prefer US Lead
• SMRs and Adv Reactors can
allow US to regain exports and
enhance controls on proliferation
Verdigris
Capital, LLC

“Policy Parity” did not work for US Solar PV Mfrs
40
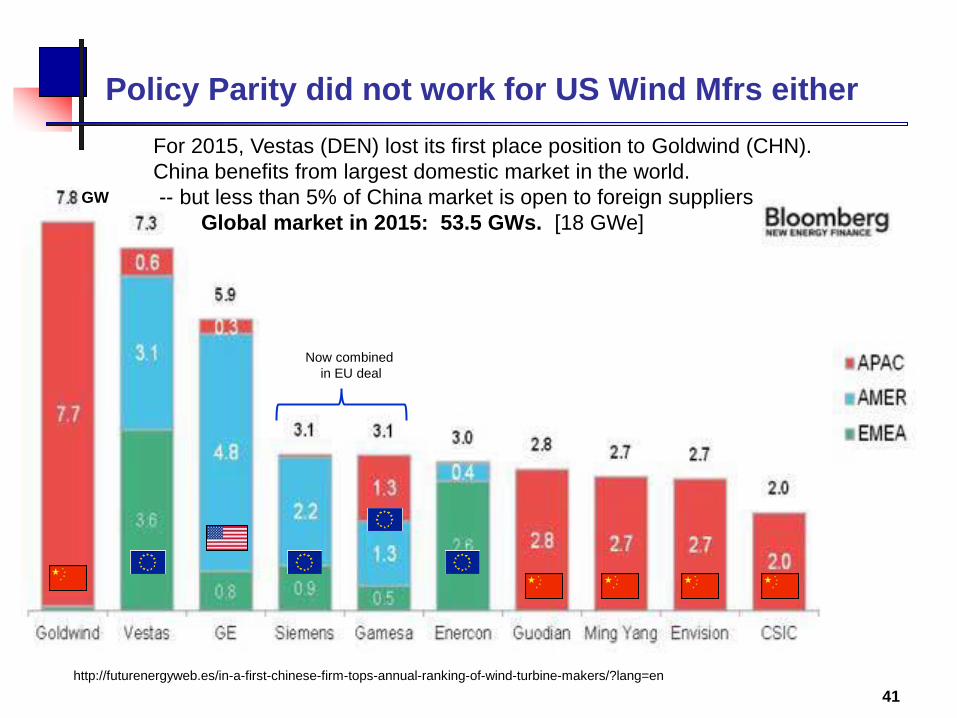
Policy Parity did not work for US Wind Mfrs either
41
http://futurenergyweb.es/in-a-first-chinese-firm-tops-annual-ranking-of-wind-turbine-makers/?lang=en
For 2015, Vestas (DEN) lost its first place position to Goldwind (CHN).
China benefits from largest domestic market in the world.
-- but less than 5% of China market is open to foreign suppliers
Global market in 2015: 53.5 GWs. [18 GWe]
GW
Now combined
in EU deal

RE Tax Subsidies, 2016-19
42
19 GW
x 40%
8 GWe
18 GW
x 20%
3.6 GWe
Renewables got their tax subsidies extended in 2015, plus CPP... Nuclear ?
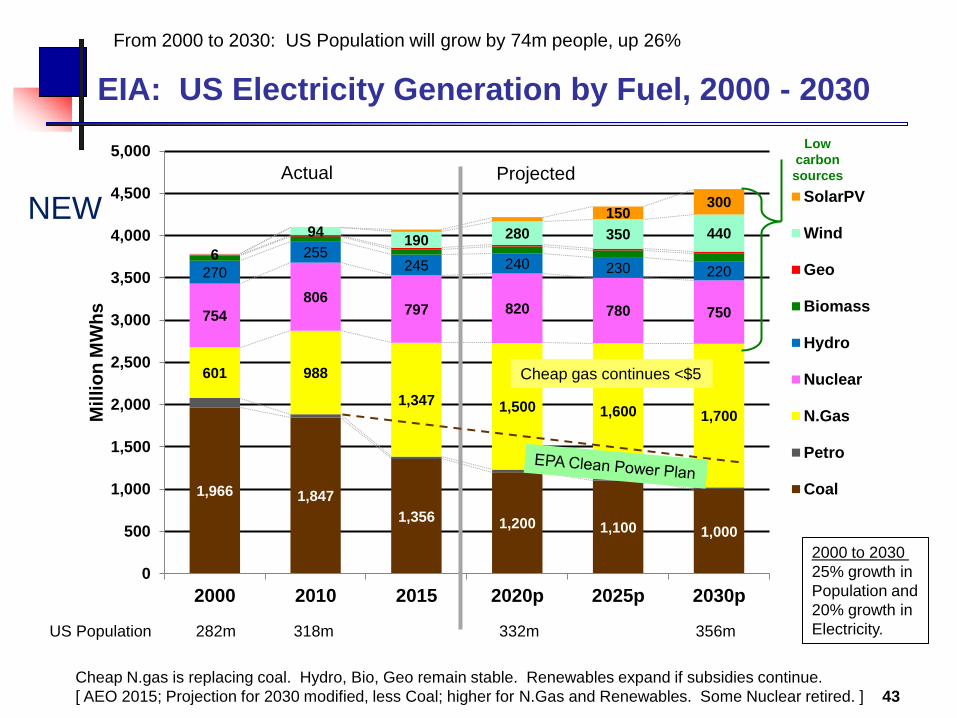
1,966 1,847
1,356 1,200 1,100 1,000
601 988
1,347 1,500 1,600 1,700
754
806 797 820 780 750
270
255 245 240 230 220
6
94 190 280 350 440
150 300
0
500
1,000
1,500
2,000
2,500
3,000
3,500
4,000
4,500
5,000
2000 2010 2015 2020p 2025p 2030p
Mil
lio
n M
Wh
s
SolarPV
Wind
Geo
Biomass
Hydro
Nuclear
N.Gas
Petro
Coal
EIA: US Electricity Generation by Fuel, 2000 - 2030
43
Cheap N.gas is replacing coal. Hydro, Bio, Geo remain stable. Renewables expand if subsidies continue.
[ AEO 2015; Projection for 2030 modified, less Coal; higher for N.Gas and Renewables. Some Nuclear retired. ]
Low
carbon
sources
US Population 282m 318m 332m 356m
From 2000 to 2030: US Population will grow by 74m people, up 26%
Actual Projected
2000 to 2030
25% growth in
Population and
20% growth in
Electricity.
Cheap gas continues <$5
NEW

Electricity rates vary markedly by State
44
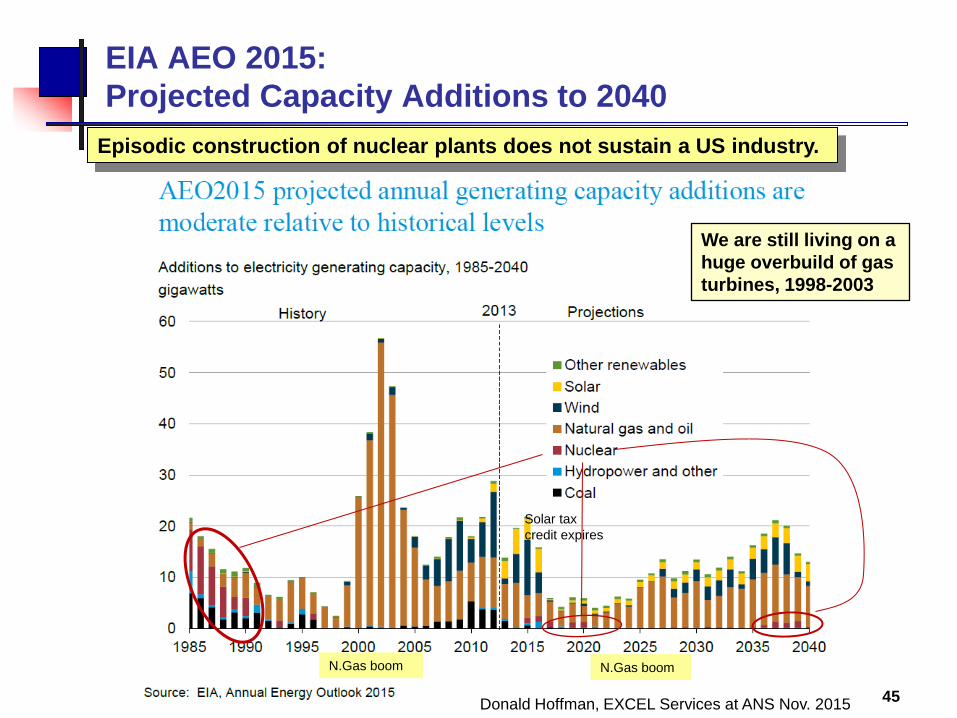
EIA AEO 2015:
Projected Capacity Additions to 2040
Solar tax
credit expires
N.Gas boom N.Gas boom
45
Episodic construction of nuclear plants does not sustain a US industry.
We are still living on a
huge overbuild of gas
turbines, 1998-2003
Donald Hoffman, EXCEL Services at ANS Nov. 2015
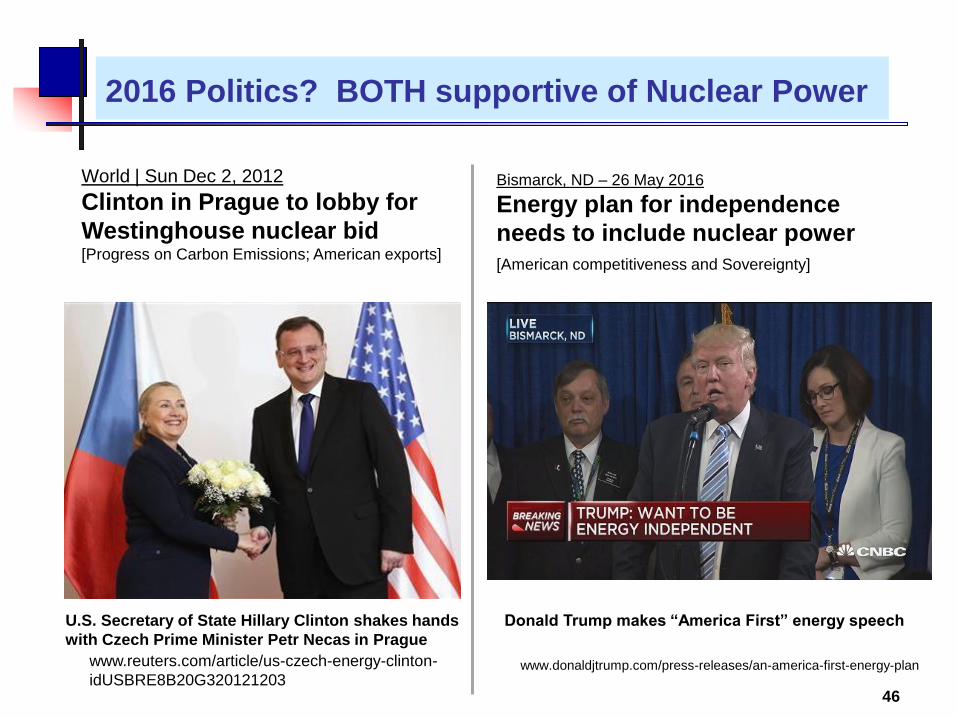
2016 Politics? BOTH supportive of Nuclear Power
46
World | Sun Dec 2, 2012
Clinton in Prague to lobby for
Westinghouse nuclear bid [Progress on Carbon Emissions; American exports]
www.reuters.com/article/us-czech-energy-clinton-
idUSBRE8B20G320121203
U.S. Secretary of State Hillary Clinton shakes hands
with Czech Prime Minister Petr Necas in Prague
www.donaldjtrump.com/press-releases/an-america-first-energy-plan
Bismarck, ND – 26 May 2016
Energy plan for independence
needs to include nuclear power
[American competitiveness and Sovereignty]
Donald Trump makes “America First” energy speech

White House & Congress United on Nuclear
47
Senate Vote 87-4 (Feb. 2016) Nov. 2015
[ In advance of COP 21]
[Amendment to Energy Modernization bill]
“GAIN”

Interest Rates and Nuclear Construction
48
ChernobyI TMI
http://www.ecowatch.com/interactive-map-details-what-you-need-to-know-about-the-worlds-nuclear-1882188367.html
Prime Lending
Rate, 1950-2015
Since 1955
Nuclear capacity
Grid connected
Build Now !
Fukushima
1975 2000 1950 2015
20%
5% 5%
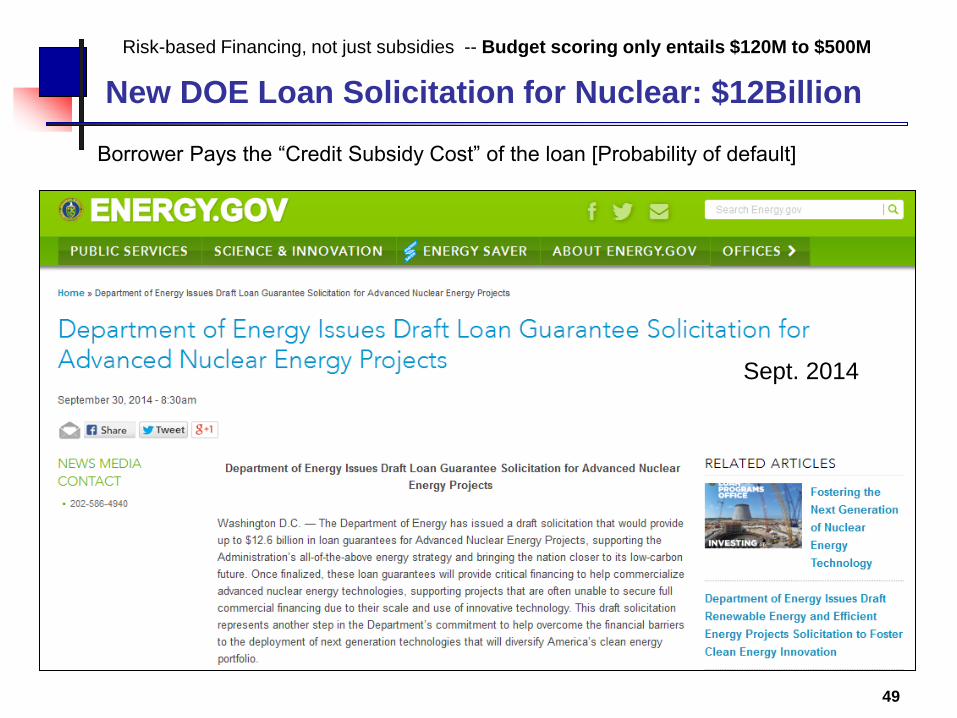
New DOE Loan Solicitation for Nuclear: $12Billion
49
Risk-based Financing, not just subsidies -- Budget scoring only entails $120M to $500M
Borrower Pays the “Credit Subsidy Cost” of the loan [Probability of default]
Sept. 2014

COP21 and Mission Innovation includes Nuclear
50
www.forbes.com/sites/jamesconca/2015/12/15/paris-cop21-and-the-urgent-need-for-more-nuclear-energy/#4aa561194952
FORBES: Paris COP21 And The Urgent Need For More Nuclear Energy James Conca, Dec. 15, 2015
“Drs. Hansen, Wigley, Caldeira and Emanuel declared that the anti-nuclear
position of environmental leaders is causing unnecessary and severe harm to
the environment and to our planet’s future. To ignore the leading climate
scientists at the leading climate conference is foolish. And stupid. And risky.”
The
ASK

Political Strategy / Tactical Options
Energy Modernization Bill… 2017?
• Upgrade NRC Licensing; Financing, preference for Nuclear
Tax Reform in 2017 with Energy provisions (?)
• RE got tax credits in 2015 Budget Bill --- What for Nuclear?
Energy Appropriations in Omnibus
• Expand DOE Loan Program for Clean Energy, GenIV Nuclear
• Renewal of EX-IM Bank (done)
Monitor State Clean Power Plans (+Court Cases)
Lack of Nat’l Consensus = States are more Important
EPA CPP at SCOTUS: A redo to favor Nuclear?
FERC Dispatch Preference for Clean Sources (?)
51
The
ASK

Nuclear Power Enables Urban Living… Globally
52
The
ASK REFRAME THE APPROACH

SUMMARY: Nuclear Power Enables Urban Living
Urban development is the major trend driving demand for clean, reliable
energy for cities. Top 600 cities comprise 60% of World GDP
Most urban growth lies outside OECD economies, in Asia, MidEast
“Policy Parity” did not work well for Renewables; Most Mfg now overseas
Wind and Solar require large empty tracts of land; Not for dense cities
“Nuclear is different”; US P5 Status rides on Nuclear, not others
Cost is a major factor for Nuclear, but not ONLY factor
Strategic National interests, financing drive new construction + GenIV
“Policy Preference” is deserved for security benefits, emissions avoided
Emissions savings are a bigger factor in Europe than USA or elsewhere
To be competitive, USA must accelerate deployment of GenIV Reactors
53 Verdigris
Capital, LLC

C) Nuclear: Sovereign Marketing & Finance
54
C) How are Nuclear Projects being financed ?
Why are Sovereigns so heavily involved ?
-- as Customers and Suppliers
D) Which Key Supply and Demand factors are
driving these transactions?

US Nuclear Plant Owners; Top Ten = 72% of fleet
55
Ten Utilities account for >70% of US operating reactors. Several foreign entities are larger.
Source: www.NEI.org

GLOBAL: Major Nuclear Owners, Sovereigns
56
UNSC “P5” Countries
account for nearly 60% of all
operating MWs.
“Sovereign Energy Co’s”
(state-owned entities) own
and operate almost 50% of
all reactors, but nearly 80%
of new construction.
Several are Hybrid Co’s
(partial State / Muni / Co-op
ownership).
USA and Japan use a private
investor-owned utility model.
www.nei.org/Knowledge-Center/Nuclear-Statistics/World-Statistics/World-Nuclear-Generation-and-Capacity
P5
P5
P5
P5
P5

ADPaterson
New Reactors: Where’s the Growth?… Asia, MidEast
57
New construction of reactors is a Sovereign decision, more than mere economics.
Operating Capacity
Gov’t
Owned
Private
Owned
Sovereigns dominate new orders.
USA and Japan built their fleets of
reactors in smaller regional utilities,
rather than in national enterprises.
Gov’t
Owned
Private
Owned
ADPaterson NOW
Size of bubble =
Reactor GWs now
under construction
Verdigris
Capital, LLC

Sovereign Nuclear Energy Landscape 2030
58
ADPaterson
Operating Capacity
Gov’t
Owned
Private
Owned
USA Utilities
Asia, MidEast continue to dominate new construction: N.Am, EU lag
ADPaterson
2030
Size of bubble =
Reactor GWs now
under construction
Verdigris
Capital, LLC

Britain: Nuclear restart…under France with China
59
Declining North Sea production, climate goals, energy
security, and “P5” status drive UK reactor restart (10-16GW).
Declining North Sea
oil and gas production
since 2000
2000
October 2013
http://www.ft.com/intl/cms/s/0/9fffdb6a-367c-11e3-aaf1-00144feab7de.html?siteedition=intl#axzz2lCUbpf9F
A Tri-party Sovereign Investment Decision: UK, France, China… all P5 countries P5
1980
Will EPR cost
overruns trigger
shift at HP-C ?
Does UK have
room for Advanced
Reactors in next
wave (16 GWe) ?

Britain: Near-term export market – who wins?
60
UK: Go-ahead for 10 nuclear stations
?
?
?
Which reactor technologies and Vendor Teams will prevail in the UK, given French stumbles ?
16 GW
May 2015

Russia – India Mega-deal on Reactors, 2014
Russia will help India build at least 10 more nuclear reactors, Indian
Prime Minister Narendra Modi has said following a visit by Russian
President Vladimir Putin.
http://www.bbc.com/news/world-asia-india-30408274#
Dec. 2014
Russia - India: Putin agrees to build 10 nuclear reactors
July
US$100 billion New Development Bank (NDB)
MEANWHILE… back on the Global Gameboard

Putin markets Rosatom in Turkey, 2014
http://www.world-nuclear-news.org/NN-Ground-broken-for-Turkeys-first-nuclear-power-plant-1541501.html
Mediterranean
Dec. 2014

Russia-China deal on Small Floating Reactors
63
Floating Nuclear Power Plants
Might Be the Future of Energy By Kayla Ruble; August 1, 2014
Following a $400 billion gas supply DEAL signed by the
countries in May, the export sector of Russia’s state
nuclear reactor company Rosatom penned a
memorandum of understanding with China on Tuesday
to develop waterborne nuclear power plants (NPPs)
starting in 2019.
Rosatom previously announced that in 2018 it would
implement the first floating NPP in the world, just
offshore in the country’s eastern region of Chukotka.
https://news.vice.com/article/floating-nuclear-power-
plants-might-be-the-future-of-energy Russian floating nuclear powerplant "Academic Lomonosov"
under construction (RIA Novosti / Alexei Danichev); 2 x 35MWe
MIT Thinking Outside of the Box with Floating Nuclear Plant MIT researchers are now working on a nuclear power plant design that for off-shore floating
nuclear power plants, which would be built in shipyards and moored out to sea, about eight
to ten miles off shore. This would keep them in territorial waters, but allow them to be
placed in water deep enough so that tsunami events would never hit them. Tsunami
events, a potential disaster for coastal nuclear power plants, do not take place in deep
water, said MIT in a recent release. They only build up to dangerous levels in shallow water
environments.
A floating nuclear reactor, built on an oil-rig type of platform, would have the reactor
components underwater for balance and to keep potential overheating events from ever
occurring, given the seawater could passively cool the reactor. In general, during normal
operations, cool water from lower ocean layers would be pumped up to cool the reactor
and the warmer water would be released near the surface, where the water is already
warmer – making for a zero-impact reactor regarding its affect on the thermal conditions of
the ocean. Nuclear Street News, June 25, 2015
300
MW

Rosatom: “A market leader in Asia, outside China”
64
P5
P5
P5
P5
P5
P5
Vendors
WNA 2012: http://proceedings.world-nuclear.org/london/presentations/
“PICKING WINNERS”: Russia and China understand the STRATEGIC value of nuclear…
[ China, India, Bangladesh, Vietnam ]
ROSATOM: Igor Karavaev, Chief Strategy and Investments Officer
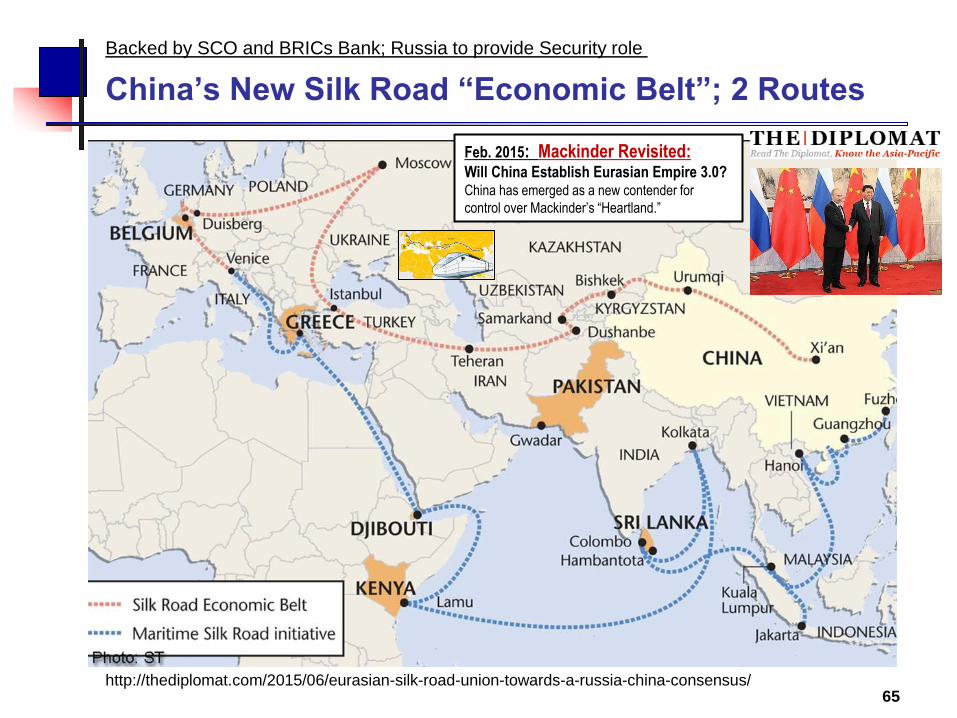
China’s New Silk Road “Economic Belt”; 2 Routes
65 http://thediplomat.com/2015/06/eurasian-silk-road-union-towards-a-russia-china-consensus/
Backed by SCO and BRICs Bank; Russia to provide Security role
Feb. 2015: Mackinder Revisited: Will China Establish Eurasian Empire 3.0? China has emerged as a new contender for
control over Mackinder’s “Heartland.”

Mackinder (1904, LSE): Land Power > Sea Power
66
In 1904 Mackinder gave a paper on "The Geographical Pivot of History" at the Royal Geographical Society,
in which he formulated the Heartland Theory. This is often considered as a, if not the, founding moment of
geopolitics as a field of study. In 1895, he was one of the founders of the London School of Economics.
Who rules East Europe commands the Heartland:
Who rules the Heartland commands the World-Island:
Who rules the World-Island commands the World.
Mackinder: (Democratic Ideals and Reality, 1919)
World-Island
Heartland
“The dawn of a modern debate over Geo-politics” [London School of Economics]
Strategic ellipse: 70% of fossil energy

Russia’s Strategy: Imperial reach with Nuclear
67 http://globalriskinsights.com/2015/10/russia-is-creating-a-global-nuclear-power-empire/
“Russia is creating a global nuclear power empire”
Global Competitive Landscape and Sovereignty: Nuclear is Different

AIIB: $100B+ for Euro-Asian Growth
68
USA not a
member
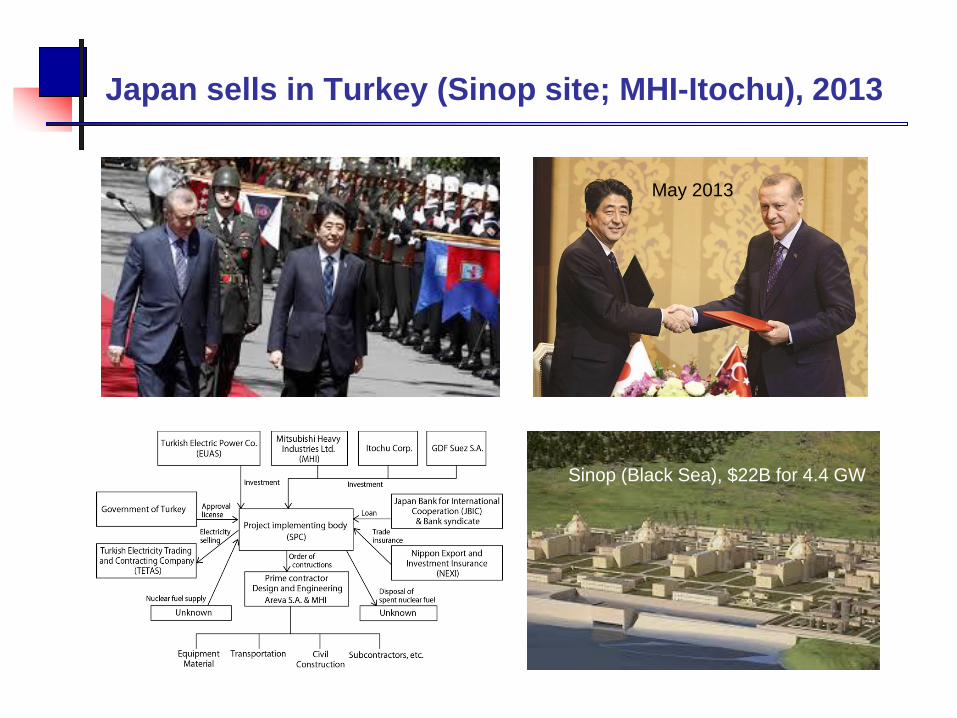
Japan sells in Turkey (Sinop site; MHI-Itochu), 2013
May 2013
Sinop (Black Sea), $22B for 4.4 GW

India plans 60+ GW by 2035; USA winning 6 now.
70
DELHI
MUMBAI
http://www.cnbc.com/2016/06/07/obama-modi-welcome-preparatory-work-for-india-reactor-project.html
JUNE 2016
Amishi
Kumar,
USEA
Westinghouse, 6 x AP1000s
WNA: India expects to have 14.6 GWe
nuclear capacity on line by 2024 and 63
GWe by 2035. It aims to supply 25% of
electricity from nuclear power by 2050.
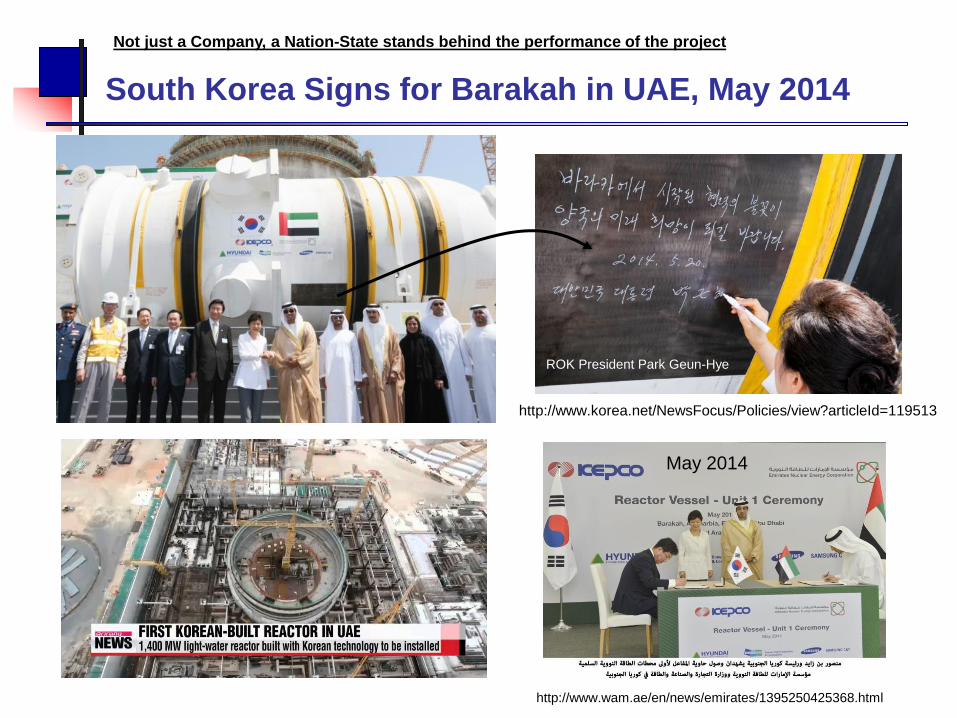
South Korea Signs for Barakah in UAE, May 2014
http://www.korea.net/NewsFocus/Policies/view?articleId=119513
May 2014
http://www.wam.ae/en/news/emirates/1395250425368.html
ROK President Park Geun-Hye
Not just a Company, a Nation-State stands behind the performance of the project

National Nuclear Strategies: Summary Points
• The drivers that led to US Leadership in nuclear energy have shifted
dramatically. Cities: “urban energy reliability” is now the key driver.
The primacy of those drivers has changed, from Supply to Demand.
Low N.gas prices will undercut new nuclear, if no policy interventions.
Extended Fiscal crisis forces Governments to explore new means, JVs.
• Market drivers alone cannot sustain nuclear energy. Policy drivers
(e.g., national security, air pollution, urban resilience) loom large.
The mythical “level playing field” does not recognize nuclear benefits.
• Other Governments do not have a problem “picking winners and
losers”. For many, Nuclear is a winner. And, nuclear is uniquely
regulated at federal level. Most reactor build is by National Enterprises.
• All of the “P5” countries are struggling to sustain their commitment
to nuclear energy… but in different ways. [P5 = USA, UK, France, Russia, China]
• Without new construction, US leadership will wither. Global JVs and
SMRs become very important, and need resources + a fast track.
US regulatory prowess and fuel security are not enough for “leadership”.
• Choices made NOW will lock-in a generation portfolio for 30+ years. 72
Nuclear power is not “left to the market”

National Strategies shaped by Supply/Demand Factors
73
SUPPLY (20th Century)…
…DEMAND (21st Century)
“Technology
Push”
“Market
Pull”
Verdigris
Capital, LLC

Report: National Nuclear Energy Strategies
74
“Redefining Leadership in the Global Nuclear Energy Market”
Andrew Paterson Principal,
EBI / Verdigris Capital
571-308-5845
Walter S. Howes Managing Partner
Verdigris Capital, LLC 202-342-5323
www.climatechangebusiness.com/Policy_Market_Factors_Shaping_National_Nuclear_Strategies
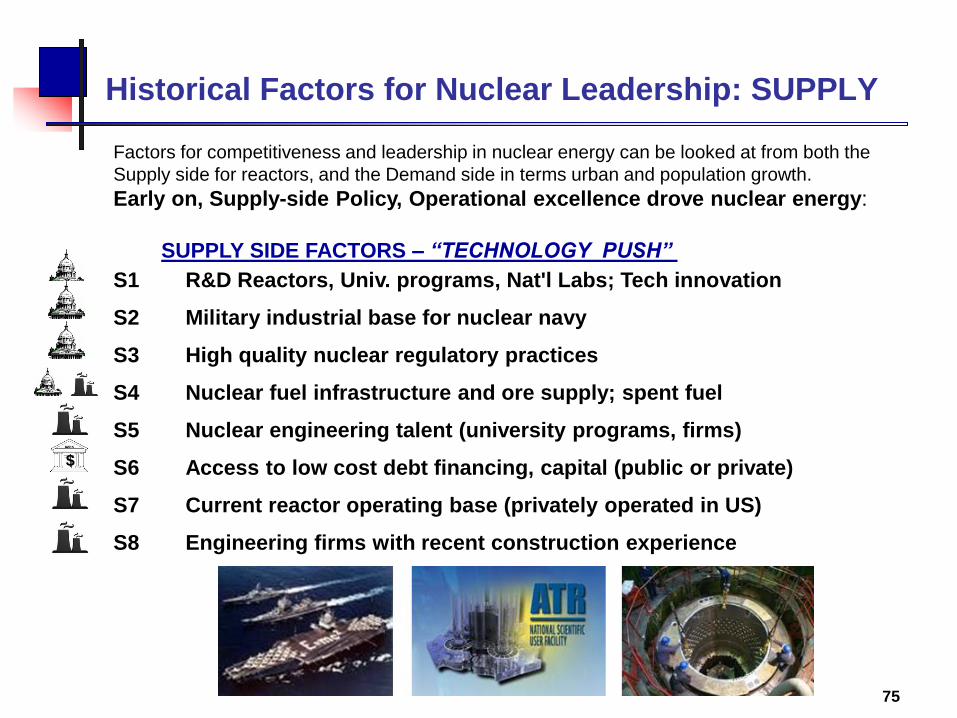
Historical Factors for Nuclear Leadership: SUPPLY
75
Factors for competitiveness and leadership in nuclear energy can be looked at from both the
Supply side for reactors, and the Demand side in terms urban and population growth.
Early on, Supply-side Policy, Operational excellence drove nuclear energy:
SUPPLY SIDE FACTORS – “TECHNOLOGY PUSH”
S1 R&D Reactors, Univ. programs, Nat'l Labs; Tech innovation
S2 Military industrial base for nuclear navy
S3 High quality nuclear regulatory practices
S4 Nuclear fuel infrastructure and ore supply; spent fuel
S5 Nuclear engineering talent (university programs, firms)
S6 Access to low cost debt financing, capital (public or private)
S7 Current reactor operating base (privately operated in US)
S8 Engineering firms with recent construction experience
$

Future Factors for Nuclear Leadership: DEMAND
76
Factors for competitiveness and leadership in nuclear energy can be looked at from both
the Supply side for reactors, and the Demand side in terms urban and population growth.
Market-driven, Demand-side factors are now fueling new construction:
DEMAND SIDE FACTORS – “MARKET PULL”
D1 Growing population overall (demographics)
D2 Current dense, urban electric loads (large cities)
D3 Advanced industrial and manufacturing base
D4 Rising per capita energy use (vs. OECD average)
D5 Higher natural gas prices (nuclear competitiveness) vs portfolio
D6 Significant air pollution (need for clean energy options)
D7 Future growth in urban load (urbanization rate)
D8 Policies and regulations favoring reduced emissions

Insights from Supply vs. Demand Factors
• Demand side factors highlight benefits of nuclear power: reliable, no
emissions, smaller footprint (land use constraints), economic gains
• Satisfying urban demand requires attention to public engagement
(typically public is not just “for” or “against”; can be both; regional)
• Build reactors in regions where public favors benefits of nuclear, as is
happening in US, UK, Canada, EU. Asian urban public wants reliability .
Expanding or new nuclear users are importing supply-side expertise.
• Supply-side “excellence” cannot easily be rebuilt; must be maintained.
UK let their capacity atrophy: A grand challenge for EU, USA to 2030.
• BNFL was broken up (2006); EdF acquired British Energy (2008)
• Toshiba now owns Westinghouse (2006); GE with Hitachi (2007)
• SMRs with discipline of quality manufacturing could enable quality
control in construction and operation to highest quality specs
• Adv. Reactors could become important where cooling water is limited
• Other Governments do not have a problem “picking winners and losers”.
For many, Nuclear is a winner: reliability, no emissions
77

Supply / Demand Factors and National Strategies
78
21st Century, Post Cold War
DEMAND-SIDE INTENSITY
Renaissance
“Heavy”
Renaissance
“Light”
Restruc-
turing
Population growth
Rising energy use
Urbanization / Pollution
Nuclear navy
Nat’l Labs
Engineering
Reactor
operations
Fuel cycle
LOW
LOW
HIGH
HIGH ADPaterson
• Population growth, “Developing”
• Rising consumer energy demand
• High fossil fuel prices, imports
• Large, burgeoning cities (urbanization)
• Significant Industrialization driving demand
• Declining (aging) population
• Energy use declining (EE)
• Anti-nuclear politics / policy
• Not investing in nuclear
training, infrastructure
• Strong nuclear infrastructure
• Stagnant load growth
• Already “developed” (OECD)
• Low fossil fuel prices
• Fragmented utility sector
• Population growth
• Lower fossil prices
• Growing cities
• Need for desalination
• No nuclear infrastructure
DEMAND
ROLL BACK
ADPaterson
Verdigris
Capital, LLC

Nuclear Strategy: “Renaissance”, “Rollback”, “Restructuring”
“Renaissance”: Countries building reactors, relicensing the ones they operate,
and are addressing spent fuel issues with storage or reprocessing or recycling are
fully engaged in the “nuclear renaissance” after a global hiatus. Some are pursuing
next generation “small modular reactors” (SMRs; under 300 MWs each in capacity).
Their societies value the reliable, low emission electricity from reactors, particularly
for large urban loads, and have active safety programs in place.
“Restructuring”: In some leading nuclear countries, including USA, some
construction is underway, but not at a robust pace as seen in Asia. Liberal
democracies (particularly those manifested as Entrepreneurial Market States) are
more pluralistic, allowing more openings for interveners (e.g., anti-nuclear
stakeholder groups). Spent fuel disposal is not resolved either. Financial incentives
may be in flux, depending on political changes. Some merger or restructuring
activity in the electric sector may be needed to bolster utility balance sheets.
“Rollback”: Some EU countries currently operating reactors are not relicensing
them, or some are shutting down reactors early. With 185 reactors (162 GWe), just
five countries account for 75% of EU capacity (France, Russia, Ukraine, Germany,
UK). Nor are they pursuing alternative reactor technologies, such as SMRs, and are
not reprocessing spent nuclear fuel, except UK and France, both P5 countries.
79 From “Nuclear Power and National Sovereignty after Fukushima” by Andrew Paterson at World Nuclear Symposium, London 2012

Supply vs Demand Factors and National Strategies
80
Part II: “Redefining Leadership in Nuclear Energy Markets”
21st Century, Post Cold War DEMAND-SIDE INTENSITY
China*
India S.Korea
Japan (2010, 2014)
France*
USA*
UK*
UAE Germany
Italy
S.Arabia
Vietnam
Russia*
Renaissance “Heavy”
Restruc- turing
Belgium
Japan (2011)
Poland
Turkey
Canada
Population growth Rising energy use
Urbanization / Pollution
Nuclear navy Nat’l Labs
Engineering Reactor
operations Fuel cycle
LOW
LOW
HIGH
HIGH ADPaterson
EXPORTERS
IMPORTERS
BOTH [Import & Export]
DECOM- MISSION
ROLL BACK
Fukushima
Spain DPJ loses
DEMAND
*P5 country
Renaissance
“Light”
ADPaterson
http://ebionline.org/updates/2320-nuclear-energy-remains-vital-to-urban-energy-reliability
Indonesia
Finland
* China is the
only Demand-
side driven P5
country now
Verdigris
Capital, LLC

END -- DISCUSSION / QUESTIONS
81
Andrew Paterson Principal,
EBI / Verdigris Capital
571-308-5845
Walter S. Howes Managing Partner
Verdigris Capital
202-342-5323
The Emerging Global Landscape driving Nuclear Power
www.climatechangebusiness.com/Policy_Market_Factors_Shaping_National_Nuclear_Strategies

IAEA Projection of Global Capacity (Sept 2012)
82
N.America as % of total 30% 26% 22%
IAEA projection shows 25%-30% growth each decade in global total; little of it in N.America