politics in the workplace - shrm
TRANSCRIPT

SHRMPOLITICS IN THEWORKPLACE
O M N I B U S
2
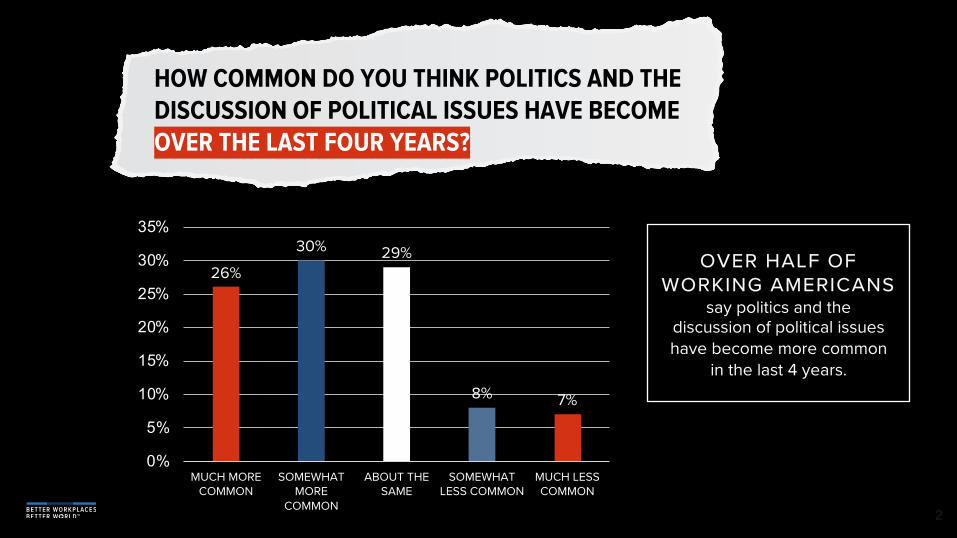
26%
30% 29%
8% 7%
0%
5%
10%
15%
20%
25%
30%
35%
MUCH MORE COMMON
SOMEWHAT MORE
COMMON
ABOUT THE SAME
SOMEWHAT LESS COMMON
MUCH LESS COMMON
OVER HALF OF WORKING AMERICANS
say politics and the discussion of political issues have become more common
in the last 4 years.
HOW COMMON DO YOU THINK POLITICS AND THE DISCUSSION OF POLITICAL ISSUES HAVE BECOMEOVER THE LAST FOUR YEARS?

3
Of those who work in organizations that aren’t totally inclusive, a third say their organization is not looking to become more inclusive.
WHILE MOST WORKPLACES ARE INCLUSIVE OR MOSTLY INCLUSIVE ABOUT DIFFERING POLITICAL OPINIONS…
OVER A THIRD ARE NOT.

4
25%
40%
21%
13%
2%0%5%
10%15%
20%25%30%35%40%45%
DEFINITELY INCLUSIVE
MOSTLY INCLUSIVE
MOSTLY NOT INCLUSIVE
DEFINITELY NOT
INCLUSIVE
DON'T KNOW/SKIP
OVER A THIRD OF WORKING AMERICANS
say their workplace is notinclusive of differing political
perspectives
N=522
TO WHAT EXTENT IS YOUR ORGANIZATION INCLUSIVE OF DIFFERING POLITICAL PERSPECTIVES AMONGST STAFF?
5
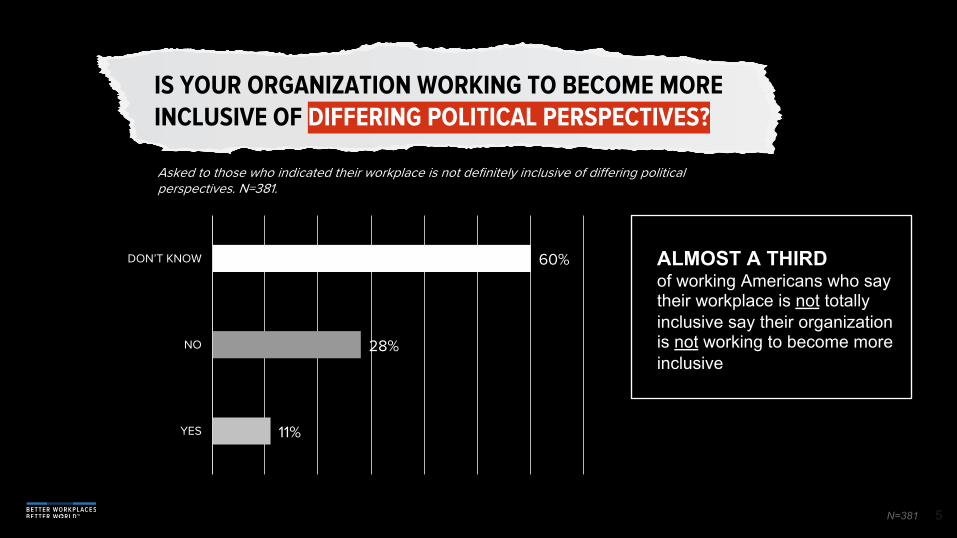
11%
28%
60%
0% 10% 20% 30% 40% 50% 60% 70%
YES
NO
DON’T KNOW ALMOST A THIRD of working Americans who say their workplace is not totally inclusive say their organization is not working to become more inclusive
N=381
IS YOUR ORGANIZATION WORKING TO BECOME MORE INCLUSIVE OF DIFFERING POLITICAL PERSPECTIVES?
Asked to those who indicated their workplace is not definitely inclusive of differing political perspectives. N=381.

6
ALMOST HALF OF WORKING AMERICANS HAVE PERSONALLY HAD A POLITICAL
DISAGREEMENT AT WORK.

7
of working Americans have PERSONALLY EXPERIENCED political disagreements in the workplace.42%
N=522
of working Americans have WITNESSED OR OBSERVED political disagreements in the workplace.44%
HAVE YOU PERSONALLY EXPERIENCED OR WITNESSED POLITICAL DISAGREEMENTS IN THE WORKPLACE?

but what about other, more serious consequences?
8
DISAGREEMENT, IN AND OF ITSELF, DOESN’T HAVE TO BE A PROBLEM.
About 1 in 10 working Americans has personally experienced or witnessed differential treatment on the basis of political affiliation,
or political affiliation bias (whether positive or negative bias).
9
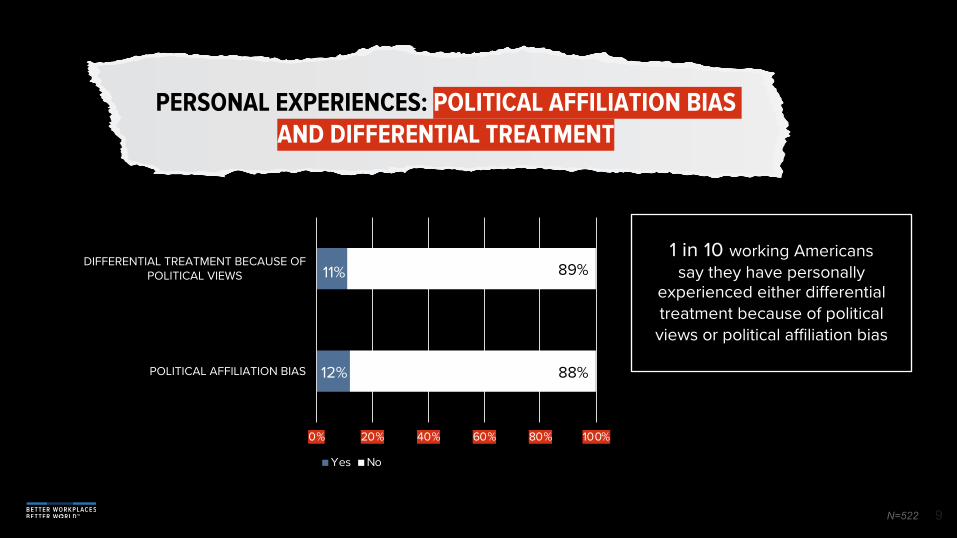
12%
11%
88%
89%
0% 20% 40% 60% 80% 100%
POLITICAL AFFILIATION BIAS
DIFFERENTIAL TREATMENT BECAUSE OF POLITICAL VIEWS
Yes No
N=522
1 in 10 working Americans say they have personally
experienced either differential treatment because of political views or political affiliation bias
PERSONAL EXPERIENCES: POLITICAL AFFILIATION BIAS AND DIFFERENTIAL TREATMENT
10
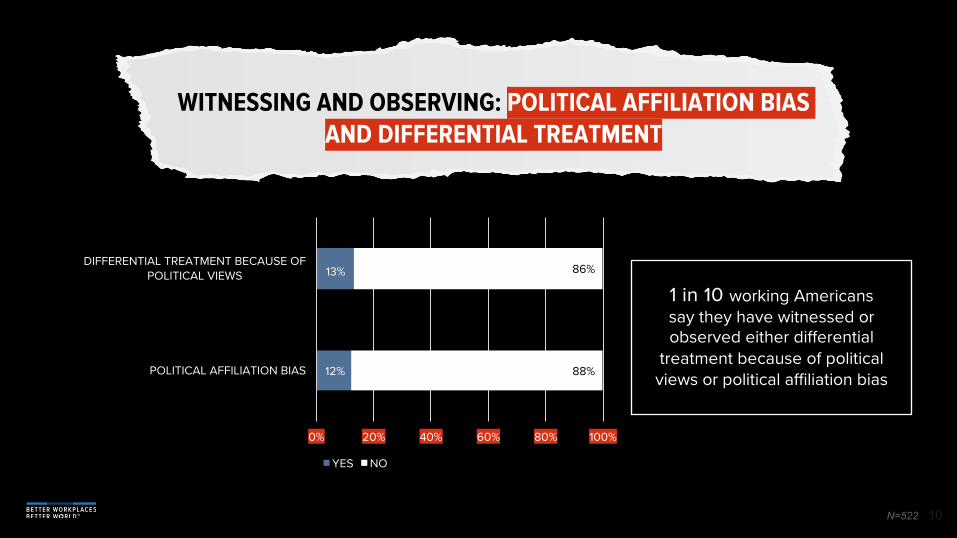
12%
13%
88%
86%
0% 20% 40% 60% 80% 100%
POLITICAL AFFILIATION BIAS
DIFFERENTIAL TREATMENT BECAUSE OF POLITICAL VIEWS
YES NO
N=522
1 in 10 working Americans say they have witnessed or observed either differential
treatment because of political views or political affiliation bias
WITNESSING AND OBSERVING: POLITICAL AFFILIATION BIAS AND DIFFERENTIAL TREATMENT
METHODOLOGY AND CITATION
METHODOLOGYA sample of 522 Working Americans was surveyed using the Amerispeak Omnibus survey, NORC at the University of Chicago’s probability-based panel designed to be representative of the U.S. household population. The survey was administered October 7th to 14th, 2019.
CITATIONSHRM October 2019 Omnibus
For additional information, demographic analysis, and questions please contact the research department via email at [email protected]