pollutant loading and dissolved oxygen dynamics in the tidal...
TRANSCRIPT

printed onrecycled paper
P r e p a r e d b y t h e :S t r a t e g i c A s s e s s m e n t D i v i s i o n , T M D L T e a m
T E X A S C O M M I S S I O N O N E N V I R O N M E N T A L Q U A L I T Y
July 2003
Pollutant Loading and DissolvedOxygen Dynamics in the TidalSegment of the Arroyo Colorado
Segment 2201

ii
Distributed by theTotal Maximum Daily Load Team
Texas Commission on Environmental Quality MC-150
P.O. Box 13087Austin, Texas 78711-3087
TMDL Project Reports are also available on the TCEQ Web site at:www.tnrcc.state.tx.us/water/quality/tmdl/
iii
ContentsIntroduction . . . . . . . . . . . . . . . . . . . . . . . . . . . . . . . . . . . . . . . . . . . . . . . . . . . . . . . . . . . . 1
Background Information . . . . . . . . . . . . . . . . . . . . . . . . . . . . . . . . . . . . . . . . . . . . . . 2
Problem Definition . . . . . . . . . . . . . . . . . . . . . . . . . . . . . . . . . . . . . . . . . . . . . . . . . . . . . . . 4Water Body and Watershed Description . . . . . . . . . . . . . . . . . . . . . . . . . . . . . . . . . 4Review of Historical Water Quality . . . . . . . . . . . . . . . . . . . . . . . . . . . . . . . . . . . . . 7
Endpoint Identification . . . . . . . . . . . . . . . . . . . . . . . . . . . . . . . . . . . . . . . . . . . . . . . . . . 15Dissolved Oxygen . . . . . . . . . . . . . . . . . . . . . . . . . . . . . . . . . . . . . . . . . . . . . . . . . . 16Nutrients and Chlorophyll a . . . . . . . . . . . . . . . . . . . . . . . . . . . . . . . . . . . . . . . . . . 18BOD and SOD . . . . . . . . . . . . . . . . . . . . . . . . . . . . . . . . . . . . . . . . . . . . . . . . . . . . 19Fish Kills and Aquatic Life Use . . . . . . . . . . . . . . . . . . . . . . . . . . . . . . . . . . . . . . . 21
Source Analysis . . . . . . . . . . . . . . . . . . . . . . . . . . . . . . . . . . . . . . . . . . . . . . . . . . . . . . . . 23Point Sources . . . . . . . . . . . . . . . . . . . . . . . . . . . . . . . . . . . . . . . . . . . . . . . . . . . . . 23Nonpoint Sources . . . . . . . . . . . . . . . . . . . . . . . . . . . . . . . . . . . . . . . . . . . . . . . . . . 27Domestic Wastewater Systems and Colonias . . . . . . . . . . . . . . . . . . . . . . . . . . . . . 31
Linkage Between Sources and Receiving Waters . . . . . . . . . . . . . . . . . . . . . . . . . . . . . . 32Arroyo Colorado Watershed Model . . . . . . . . . . . . . . . . . . . . . . . . . . . . . . . . . . . . 32Steady-state Water Quality Model . . . . . . . . . . . . . . . . . . . . . . . . . . . . . . . . . . . . . 39
Margin of Safety . . . . . . . . . . . . . . . . . . . . . . . . . . . . . . . . . . . . . . . . . . . . . . . . . . . . . . . 45Sources of Uncertainty . . . . . . . . . . . . . . . . . . . . . . . . . . . . . . . . . . . . . . . . . . . . . . 48Comparisons of Simulated and Observed Data . . . . . . . . . . . . . . . . . . . . . . . . . . . 49Sensitivity and Error Analysis . . . . . . . . . . . . . . . . . . . . . . . . . . . . . . . . . . . . . . . . 50Uncertainty and Margin of Safety . . . . . . . . . . . . . . . . . . . . . . . . . . . . . . . . . . . . 51
Loading Allocation . . . . . . . . . . . . . . . . . . . . . . . . . . . . . . . . . . . . . . . . . . . . . . . . . . . . . 55
Discussion and Conclusions . . . . . . . . . . . . . . . . . . . . . . . . . . . . . . . . . . . . . . . . . . . . . 63

iv
TablesTable 1. Historical listing of the Arroyo Colorado in the Texas §303(d) list
and precursor state-wide Clean Water Act-mandated water quality and water body inventory lists. . . . . . . . . . . . . . . . . . . . . . . . . . . . . . . . . . . 12
Table 2. Historical fish kills in Segment 2201 (Arroyo Colorado Tidal) . . . . . . . . 22Table 3. Active wastewater discharge permits in the Arroyo Colorado
as of May 30, 2002. . . . . . . . . . . . . . . . . . . . . . . . . . . . . . . . . . . . . . . . . . . . 25
FiguresFigure 1. Arroyo Colorado Watershed . . . . . . . . . . . . . . . . . . . . . . . . . . . . . . . . . . . . . 5Figure 2. Monitoring stations in Segment 2201 (Arroyo Colorado Tidal). Non-
compliance with DO criteria was observed in the labeled stations . . . . . . 17Figure 3. Graph of 24-hour DO measurement in Segment 2201 at Rio Hondo
during August 16 and 17, 1998. . . . . . . . . . . . . . . . . . . . . . . . . . . . . . . . . . 20Figure 4. Wastewater outfall locations in the Arroyo Colorado watershed and
watershed sub-basins. . . . . . . . . . . . . . . . . . . . . . . . . . . . . . . . . . . . . . . . . . 24Figure 5a. Historical effluent concentrations and permit limit for BOD-5 for
the City of Hidalgo, Texas. . . . . . . . . . . . . . . . . . . . . . . . . . . . . . . . . . . . . . 27Figure 5b. Historical effluent concentrations and permit limit for BOD-5 for
the City of San Benito, Texas. . . . . . . . . . . . . . . . . . . . . . . . . . . . . . . . . . . 28Figure 6a. Historical effluent concentrations and permit limit for ammonia for
the City of Harlingen, Texas. . . . . . . . . . . . . . . . . . . . . . . . . . . . . . . . . . . . 28Figure 6b. Historical effluent concentrations and permit limit for ammonia for
the City of Pharr, Texas. . . . . . . . . . . . . . . . . . . . . . . . . . . . . . . . . . . . . . . . 29Figure 7. 1995 MRLC Land Use/Land Cover for the Arroyo Colorado Watershed . 30Figure 8. Measured and simulated stream flow in the Arroyo Colorado
at Harlingen, 1989-95. . . . . . . . . . . . . . . . . . . . . . . . . . . . . . . . . . . . . . . . . 34Figure 9. Measured and simulated stream flow in the Arroyo Colorado
at Harlingen, 1996-99. . . . . . . . . . . . . . . . . . . . . . . . . . . . . . . . . . . . . . . . . 35Figure 10. Measured and simulated dissolved oxygen in the Arroyo Colorado at:
A. Harlingen, B. Lower boundary of Segment 2202, C. Segment 2201 at Rio Hondo, 1989-95 . . . . . . . . . . . . . . . . . . . . . . . . . . . . . . . . . . . . . . . . 36
Figure 11. Measured and simulated dissolved oxygen in the Arroyo Colorado at: A. Harlingen, B. Lower boundary of Segment 2202, C. Segment 2201 at Rio Hondo,1996-99 . . . . . . . . . . . . . . . . . . . . . . . . . . . . . . . . . . . . . . . . . 37
Figure 12. Percentage of loadings of selected constituents into the upper portion of Segment 2201 by source. Charts represent total loadings of eachconstituent between1989 and 1999 as estimated using Arroyo ColoradoHSPF watershed model simulations. . . . . . . . . . . . . . . . . . . . . . . . . . . . . . 38
Figure 13. Probability distributions of simulated DO concentrations under current(base) conditions and probabilities of meeting the DO criteria for: A.Segment 2201 at Rio Hondo using entire simulated daily average timeseries, B. Segment 2201 at Rio Hondo using simulated daily average values for the periods between March 15 through October 15 of every year simulated. . . . . . . . . . . . . . . . . . . . . . . . . . . . . . . . . . . . . . . . . . . . . . . 40
v
Figure 14. Stream segmentation and discretization used in the Arroyo ColoradoQUAL2E water quality model. . . . . . . . . . . . . . . . . . . . . . . . . . . . . . . . . . . 42
Figure 15. Graph of fish kills reported in the tidal segment of the Arroyo Colorado vs the month the kill events were observed. . . . . . . . . . . . . . . . . . . . . . . . . 43
Figure 16. Observed and predicted dissolved oxygen in the tidal segment of the Arroyo Colorado for the following calibration dates: A. June 16-17, 1998, B. August 5, 1998, C. August 12-13, 1992. . . . . . . . . . . . . . . . . . . . . . . . . 46
Figure 17. Observed and predicted dissolved oxygen in the tidal segment of the Arroyo Colorado for the following verification dates: A. August 16-19,1999, B. May 19, 1998, C. August 19-20, 1996. . . . . . . . . . . . . . . . . . . . . 47
Figure 18. Sensitivity analysis for the response variable dissolved oxygen in the tidal segment of the Arroyo Colorado for the following input variables: A. AGYGROMX, B. AGYRESPR, and C. AGYOXYPR (from Flowers and Hauck, 2002). . . . . . . . . . . . . . . . . . . . . . . . . . . . . . . . . . . . . . . . . . . . 52
Figure 19. Sensitivity analysis for the response variable dissolved oxygen in the tidal segment of the Arroyo Colorado for the following input variables: A. AGYOXYUP, B SOD rate (DO flux), and C. K2-OPT1 (from Flowers and Hauck, 2002). . . . . . . . . . . . . . . . . . . . . . . . . . . . . . . . . . . . . . 53
Figure 20. Sensitivity analysis for the response variable dissolved oxygen in the tidal segment of the Arroyo Colorado for the following input variables: A. INITTEMP, B HWTRDO, and C. HWTRCHLA (from Flowers andHauck, 2002). . . . . . . . . . . . . . . . . . . . . . . . . . . . . . . . . . . . . . . . . . . . . . . . 54
Figure 21. Predicted DO in the tidal segment of the Arroyo Colorado for the simulation index period of June 16-17, 1998. A. Base scenario, B. 20% load reduction scenario C. 50% load reduction scenario, and D. 90% load reduction scenario . . . . . . . . . . . . . . . . . . . . . . . . . . . . . . . . . 57
Figure 22. Predicted DO in the tidal segment of the Arroyo Colorado for the simulation index period of August12- 13, 1992. A. Base scenario, B. 20% load reduction scenario C. 50% load reduction scenario, D. 90% load reduction scenario. . . . . . . . . . . . . . . . . . . . . . . . . . . . . . . . . 58
Figure 23. Probability distributions of predicted daily average DO concentrations and probabilities of meeting the DO criteria for scenarios of 20% and 50% reduction of constituents for the periods between March 15 throughOctober 15 of every year simulated. . . . . . . . . . . . . . . . . . . . . . . . . . . . . . 60
Figure 24. Probability distributions of predicted daily average DO concentrations and probabilities of meeting the DO criteria for a scenario of 90% reduction of constituents for the periods between March 15 through October 15 of every year simulated. . . . . . . . . . . . . . . . . . . . . . . . . . . . . . 61
Figure 25. Predicted daily average DO concentrations in the mixed surface layer of the tidal segment of the Arroyo Colorado at Rio Hondo under a natural loading scenario and probability distribution (March 15 throughOctober 15 of every year simulated) and probability of meeting the DOcriteria under a natural loading scenario. . . . . . . . . . . . . . . . . . . . . . . . . . . 61
Figure 26. Predicted dissolved oxygen in the tidal segment of the Arroyo Coloradounder a natural loading scenario for the simulation index periods of: A. June 16-17, 1998, B. August 12-13, 1992, and C. August 19-20, 1996. . . 63

vi

1Texas Natural Resource Conservation Commission Draft, July 16, 2003
Pollutant Loading and DissolvedOxygen Dynamics
in the Tidal Segment of the Arroyo Colorado
IntroductionSection 303(d) of the Clean Water Act requires all states to identify waters that do notmeet, or are not expected to meet, applicable water quality standards. For each listedwater body that does not meet a standard, states must develop a total maximum daily load(TMDL) for each pollutant that has been identified as contributing to the impairment ofwater quality in that water body. This document summarizes the results of a four-yearstudy designed to establish a TMDL for constituents associated with low dissolvedoxygen in the tidal segment of the Arroyo Colorado (Segment 2201).
In simple terms, a TMDL is a quantitative analysis that determines the amount of aparticular pollutant that a water body can receive and still meet its applicable waterquality standards. In other words, TMDLs are the best possible estimates of the assimila-tive capacity of a water body for a particular pollutant under consideration. Whenpracticable, a TMDL is expressed as a load having units of mass per unit time, but aTMDL may also be expressed in other ways. TMDLs typically estimate how much apollutant load needs to be reduced from current levels in order to achieve water qualitystandards.
The Total Maximum Daily Load Program, a major component of Texas’ statewidewatershed management approach, addresses impaired or threatened streams, reservoirs,lakes, bays, and estuaries (water bodies) in or bordering the state of Texas. The primaryobjective of the TMDL Program is to restore and maintain the beneficial uses (such asdrinking water, recreation, support of aquatic life, or fishing) of impaired or threatenedwater bodies.
Section 303(d) of the Clean Water Act and the U.S. Environmental Protection Agency’s(EPA) implementing regulations (40 Code of Federal Regulations, Section 130) describethe statutory and regulatory requirements for acceptable TMDLs. The TCEQ guidancedocument, Developing Total Maximum Daily Load Projects in Texas (GI-250, 1999),further refines the process for Texas. This report has been prepared in accordance withthe guidelines specified in the two documents described above and is composed of thefollowing six elements:
C Problem DefinitionC Endpoint IdentificationC Source AnalysisC Linkage Between Sources and Receiving WatersC Margin of Safety
2Texas Natural Resource Conservation Commission Draft, July 16, 2003
C Loading Allocation
Because of the uncertainty associated with the appropriateness of the water qualitycriteria currently used to assess the Arroyo Colorado and because the perceived dissolvedoxygen impairment in the Arroyo Colorado is believed to be caused in part by physicalmodifications to the stream, the TMDL analysis presented in this report does not support do not support a quantitative, water quality target-based allocation of loadings ofconstituents associated with dissolved oxygen dynamics in the tidal segment of theArroyo Colorado.
This report was prepared by the TMDL Team in the Strategic Assessment Division of theOffice of Environmental Policy, Analysis, and Assessment of the Texas Commission onEnvironmental Quality. Contributors to the loading and dissolved oxygen dynamicsinvestigation in the Arroyo Colorado include:
C Texas Institute for Applied Environmental ResearchC Texas State Soil and Water Conservation BoardC Texas A&M University SystemC United States Geological SurveyC Nueces River Authority
Background InformationThe observed impairment addressed by this document is low dissolved oxygen in theupper reaches of the tidal segment of the Arroyo Colorado in south Texas (Segment2201).
Dissolved oxygen is an essential biochemical attribute of all natural water bodies. Thetype(s) of aquatic ecosystem(s) a water body is capable of supporting depends in part onthe amount of dissolved oxygen contained in the water body. Some aquatic ecosystems,such as mountain streams, support aquatic life that typically thrives in water containingconsistently high levels of dissolved oxygen. Other natural water bodies, such as wet-lands, tidal streams and estuaries, experience periodic episodes of depressed dissolvedoxygen under natural conditions, but are also capable of supporting rich and diverseecosystems. As a general rule, most estuarine animals can tolerate short exposures toreduced dissolved oxygen concentrations without apparent adverse effects. Prolongedexposures to moderate hypoxia, defined as DO levels below 5 mg/l, may result in alteredbehavior, reduced growth, adverse reproductive effects and possible mortality to sensitivespecies and juveniles (EPA 2002).
The Texas Surface Water Quality Standards (30 TAC §§307.1-307.10) specify thedissolved oxygen criteria that must be met for limited, intermediate, high, and excep-tional aquatic life uses in water bodies of the state of Texas under minimal stress. TheArroyo Colorado, a tidal stream located on the Gulf coast of south Texas near the RioGrande river, has been designated a high aquatic life use by the state of Texas and has anassociated 24-hour average dissolved oxygen (DO) criterion of 4.0 mg/l and a 24-hour

3Texas Natural Resource Conservation Commission Draft, July 16, 2003
DO minimum criterion of 3.0 mg/l. The Texas Surface Water Quality Standards also statethat in tidal streams, such as the Arroyo Colorado, under conditions of density stratifica-tion, the DO criteria must be met in the mixed surface layer of the water column which isdefined by the TCEQ as the vertical portion of the water column between the surface andthe depth at which the conductivity of the water is 6,000 umhos higher than the conduc-tivity at the surface.
The tidal segment of the Arroyo Colorado is currently included in the 2000 Texas CleanWater Act Section 303(d) List because dissolved oxygen concentrations in the upper 7.1miles of the segment are sometimes lower than the criteria established to assure optimumconditions for aquatic life.
Current EPA guidance (Draft Guidance for Water Quality-based Decisions: The TMDLProcess, Second Edition, EPA 841-D-99-001, 1999a) on the development of TMDLsoffers flexibility in addressing particular situations and unusual circumstances, allowingstates the discretion to adopt different approaches where appropriate. The guidance statesthat the allowable pollutant load “must be expressed in a manner ... that representsattainment and maintenance of water quality standards.” The guidance allows for the useof alternative targets for situations where “no .... quantifiable pollutant load can be usedto .... express the TMDL.”
In preparing this report, the TCEQ has taken a pragmatic approach in determining theappropriate allocation of loadings of constituents associated with dissolved oxygendynamics in the Arroyo Colorado.
As stated earlier, because of the complex interaction of physical and biochemicalmechanisms involved in the dissolved oxygen dynamics of the Arroyo Colorado (i.e.,natural tidal stream geomorphology, high degree of physical anthropogenic modification,dissolved and particulate organic and inorganic loadings, subtropical climatic setting,complexity and uncertainty associated with the cause-and-effect relationships associatedwith the observed impairment, and questions surrounding the appropriateness of the DOcriteria currently applied to this and other tidal streams along the Texas Gulf Coast), theconclusions of this report do not support a quantitative, water quality target-basedallocation of loadings of constituents associated with dissolved oxygen dynamics in thetidal segment of the Arroyo Colorado.
A factor of particular importance in this TMDL is the effect of physical, anthropogenicmodification on DO dynamics in Segment 2201. In combination, physical modificationssuch as channel deepening and widening, placement of dredge spoils, and loss of riparianhabitat have the effect of exacerbating low dissolved oxygen concentrations in the tidalportion of the Arroyo Colorado by reducing circulation, lowering reaeration rates andincreasing sediment oxygen demand. The effect that this physical modification has onDO dynamics in the Arroyo is discussed in more detail in other sections of thisdocument.

4Texas Natural Resource Conservation Commission Draft, July 16, 2003
The ultimate goal of the analysis contained in this report is to provide the basis fordeveloping a viable strategy to define, attain, and maintain DO criteria that are protectiveof the appropriate beneficial aquatic life use in the tidal segment of the Arroyo Colorado.
Problem DefinitionThe classified segments that comprise the Arroyo Colorado have consistently failed tomeet the numeric criteria defined to support the designated uses established by the TCEQas reported in the Texas Water Quality Inventory (305b report) and the List of ImpairedWaters (303d list).
Since initial ecological surveys were conducted in 1966, there have been numerousdocumented manifestations of environmental stress in the Arroyo Colorado. Docu-mented major fish kills occurred in 1971 (500,000 fish), 1981 (500,000 fish), and 1982(120,000 fish). Fish kills of smaller magnitudes occurred in April and May of 1989,September 1990, June 1991, and June 1992 . More recently, massive fish kills (1,000,000fish and above) have occurred in the Arroyo Colorado in 1997, 1998, and 1999 (TPWD2002). A more detailed discussion of fish kill events in the Arroyo Colorado is providedin the section titled “Endpoint Identification.”
Water Body and Watershed Description The Arroyo Colorado extends 138 kilometers from the city of Mission, Texas, northeast-ward to the Laguna Madre; the entire watershed lies in the neotropical Southern CoastalPlain physiographic region and the Western Gulf Coastal ecoregion. Surface geology, inthis area of south Texas, is dominated by Quaternary alluvial deposits. The flat terrain isextensively cultivated for agricultural purposes and considerable oil and gas activity alsooccurs in the area. Urbanization is extensive in the areas directly adjacent to the mainstem of the Arroyo, particularly in the western and central portions of the watershed(including the cities of Mission, Mc Allen, Pharr, San Juan, Alamo, Donna, Weslaco,Mercedes, La Feria, Harlingen, San Benito, and Rio Hondo).
Originally a distributary channel of the Rio Grande River, the Arroyo Colorado has beenextensively modified to carry flood water overflows to the Laguna Madre. The lower(tidal) portion of the Arroyo is also dredged to accommodate barge traffic to the Port ofHarlingen.
Perennial flow in the Arroyo is sustained mainly by municipal discharges, with irrigationreturn flows and urban runoff supplementing the flow on a seasonal basis. The Arroyoserves primarily as a floodway, an inland waterway, and a recreational area for boatingand fishing. The tidal reach also serves as an important nursery and foraging area fornumerous marine fishes, shrimp, and crabs.
The Texas Commission on Environmental Quality (TCEQ) has classified two reaches ofthe Arroyo Colorado based on the physical characteristics of the stream. Segment 2201,from the port of Harlingen to the confluence with the Laguna Madre, is tidally influencedand has designated uses which include Contact Recreation and High Aquatic Life. The

5Texas Natural Resource Conservation Commission Draft, July 16, 2003
above-tidal segment of the Arroyo Colorado is classified as segment number 2202 andhas designated uses which include Contact Recreation and Intermediate Aquatic Life.The Arroyo Colorado lies within Hidalgo, Cameron, and Willacy Counties, in theNueces-Rio Grande Coastal Basin, which is located on the coastal plain between theNueces River and the Rio Grande in the Lower Rio Grande Valley of south Texas (Figure1):
C Segment 2202 (Arroyo Colorado above Tidal) extends from a point 100 metersdownstream of Cemetery Road south of the Port of Harlingen in east-centralCameron County, upstream to Farm-to-Market (FM) Road 2062 near the Cityof Mission in south-central Hidalgo County. The segment includes the MainFloodway and Llano Grande Lake, but does not include the North Floodway.
C Segment 2201 (Arroyo Colorado Tidal) extends from the confluence with theLaguna Madre in Cameron/Willacy County to a point 100 meters south of thePort of Harlingen in Cameron. The segment includes the Port of Harlingenturning basin.
Figure 1. Arroyo Colorado Watershed

6Texas Natural Resource Conservation Commission Draft, July 16, 2003
The Arroyo Colorado system is the major drainage for Cameron and Hidalgo Counties.The Arroyo consists of two major channels that drain a 2,344 square mile watershed(TWC 1990). The Main Floodway extends from the headwaters near the City of Missionin southwest Hidalgo County, to Llano Grande Lake southwest of the City of Mercedesin southeast Hidalgo County. Llano Grande Lake is a long, shallow depression that actsas a large settling basin, collecting much of the upstream sediment load.
The main channel of the Arroyo Colorado continues downstream from Llano GrandeLake, across southern and central Cameron County to the Port of Harlingen (UT PanAm1995). The tidal portion of the Arroyo Colorado (Segment 2201) flows northeast from thePort of Harlingen, and discharges into the Laguna Madre. The main floodway and channel portion of the Arroyo Colorado, from the headwaters to the Laguna Madre, draina 675 square mile watershed (TNRCC 2000).
The North Floodway splits from the Main Floodway of the Arroyo Colorado at the upperend of Llano Grande Lake. The vast majority of Willacy County drains to the NorthFloodway, as does a significant portion of northern and eastern Hidalgo County and asmall portion of northwestern Cameron County. During flood conditions (flow >1,400cubic feet per second), approximately 60 percent of the flow in the Arroyo is divertedinto the North Floodway (TWC 1990).
The Arroyo Colorado lies in an extensive agricultural belt, where numerous crops aregrown year-round, and where fertilizer and pesticide use is frequent. More than 90percent of Hidalgo County and more than 80 percent of Cameron County are farm andranch land (Garza 1999; Garza and Long 1999). The Arroyo Colorado watershedcontains approximately 290,000 acres of irrigated cropland in these two counties.Primary agricultural crops include cotton, corn, grain, sorghum, sugar cane, citrus, and avariety of vegetables (TAES 2000).
Significant urbanization began in areas adjacent to the Arroyo Colorado in the late 1980s,particularly in the western and central portions of the watershed. The population inHidalgo County more than doubled, while that of Cameron County nearly doubled,between 1970 and 1990 (Chapman et al., 1998). This urbanization trend has continued inthe decade between 1990 and 2000 and is currently the principle trend in land use changein the Arroyo Colorado watershed. Perennial flow in the Arroyo begins at the City ofMission wastewater treatment plant (WWTP) discharge and is sustained primarily bymunicipal WWTP discharges with the seasonal addition of irrigation return flows andurban runoff (TWC 1989; Chapman et al., 1998). On rare occasions, flood water over-flows from the Rio Grande are diverted into the Main Floodway south of the City ofPharr. These infrequent diversion occur only during extreme flood events. Additionally,several industrial facilities discharge effluent into the Arroyo Colorado via municipalwaste water treatment plants operated by several cities.
The Arroyo Colorado watershed is located in an economically distressed area of the stateof Texas. Many communities within or adjacent to the Arroyo Colorado watershed lackbasic water and wastewater infrastructure facilities. These communities, commonly
7Texas Natural Resource Conservation Commission Draft, July 16, 2003
known as “colonias,” are frequently found in many of the population centers locatedalong the Texas-Mexico Border. Of the 1,200 colonias located along the US-Mexicoborder about 75 % are located in Lower Rio Grande Valley (TWDB 1996). It is widelybelieved that the lack of sanitary sewage, storm water discharge, and solid waste disposalfacilities common to most colonias contributes significantly to the water quality problemsin the Arroyo Colorado.
Review of Historical Water QualityOver the last 20 years, the Arroyo Colorado has been a major focus of local concernregarding the quality of surface water in the Rio Grande Valley of south Texas. In asummary of testimony from hearings held jointly by the Lower Rio Grande ValleyDevelopment Council and the Southwest Center for Environmental Research and Policyin 1992 in Brownsville, Texas, water quality in the Arroyo Colorado featured promi-nently among the concerns of local residents along with concern over the ecologicalhealth of fish and shrimp nurseries in the Laguna Madre (SWCERP 1993).
In 1975, water quality modeling was performed on the Arroyo Colorado to evaluate thepoint source and nonpoint source effluent quality necessary to meet water quality goals(STRAAM Engineers 1975). Model simulations predicted depressed dissolved oxygenlevels in the estuarine portion of the Arroyo (Segment 2201). Annual nonpoint source(NPS) loadings for biochemical oxygen demand (BOD) exceeded point source loadings.The report recommended non-structural NPS control measures be considered rather thanexpensive structural controls.
In 1977, the STORM (Storage, Treatment and Overflow) model was used to evaluateNPS load generation rates for water bodies in the Rio Grande Valley (LRGVDC, 1977).Both urban and agricultural waste loads were simulated. Although fairly high pollutantconcentrations were noted during initial wash-off periods in some cases in the simulation,the report recommended that the relative magnitudes of NPS loads from specific sourcesbe assessed further to accurately project water quality conditions.
Nitrogen, phosphorous, and suspended solids loads entering the Gulf of Mexico and theLaguna Madre from the Lower Rio Grande Valley area were sampled under a CleanWater Act (section 208) grant project completed by Black and Veatch in 1981. Theresults of the study indicate that concentrations of total Kjeldahl nitrogen, ammonianitrogen, and nitrate nitrogen were greatest in the Arroyo Colorado. The study alsoreported that sufficient quantities of ammonia nitrogen existed to potentially yield toxicconditions. However, total phosphorous concentrations were reported to be uniformlylow. The report went on to state that potential ammonia toxicity problems would bereduced by several mechanisms including conservative use of agricultural chemicals.
The TCEQ and predecessor agencies conducted intensive surveys in the Arroyo Coloradoin 1976, 1982, 1983, 1987, 1994, 1995, 1996, 1998, and 1999.
The results of the initial intensive surveys conducted in the Arroyo Colorado in 1976 and1982 indicated the following:

8Texas Natural Resource Conservation Commission Draft, July 16, 2003
1. The Arroyo Colorado was unable to assimilate the waste load that it receivedwithout development of dissolved oxygen problems.
2. Oxygen depletion occurred below the City of McAllen sewage treatment plant(near Alamo, Texas) due to the presence of excessive oxygen demandingsubstances (a secondary, less intense oxygen sag also occurred below the Cityof Harlingen sewage treatment plant).
3. High primary productivity rates were observed in the Arroyo estuary. Thisseasonal eutrophic condition was attributed mainly to nutrient contributionsfrom municipal discharges.
4. High algal metabolism resulted in wide diel oxygen fluctuations, periodicoxygen depletion, and occasional fish kills in portions of the tidal segment ofArroyo.
Other significant findings from the intensive surveys conducted in 1976 and 1982included elevated “background” levels of nutrients (thought to be caused by agriculturalrunoff). However, the main contributor of nutrients as well as oxygen demandingcompounds was identified as municipal wastewater discharges (TDWR 1978 and 1983).
Despite a 28% reduction in cumulative BOD5 loading from the ten major dischargers, theresults of the intensive survey conducted on the Arroyo Colorado in 1983 showed lowerdissolved oxygen and poorer overall water quality than in previously conducted surveys.The report cited poor assimilative capacity resulting from low stream discharge andconcomitant reductions in dilution of nutrients and oxygen demanding substances inaddition to low atmospheric reaeration rates (TDWR 1985). Spatial data trends were,again, similar to previously conducted surveys.
Permit non-compliance is cited as one of the major components of the perceived wasteloading problems in the Arroyo Colorado. Following 1983, many of the primary dis-chargers still routinely exceeded their BOD5 and TSS limitations. More current datacontained in from the Federal Permit Compliance System Database (PCS)shows strongevidence that this problem persists today. A Use Attainability Analysis (UAA) completedfor the Arroyo Colorado in 1984 identified the major municipal dischargers in thewatershed as the primary factor impacting water quality in the Arroyo Colorado (TDWR,1984). Other findings of the UAA conducted in the Arroyo in 1984 include the following:
1. The Arroyo Colorado estuary is a naturally sensitive body of water with lowassimilative capacity due to sluggish flow, low atmospheric reaeration rates,low volume of freshwater inflow, and saltwater intrusion/ salinity stratification.
2. Habitat complexity has been reduced in the tidal reach of the Arroyo Coloradoby channel straightening.
3. Benthic conditions in the tidal reach of the Arroyo Colorado are less suitablefor aquatic life due to stresses imposed by salinity stratification and periodicdredging of the navigation channel.

9Texas Natural Resource Conservation Commission Draft, July 16, 2003
4. Turbidity is reduced in the tidal reach of the Arroyo Colorado due to thesettling of suspended solids at the head of the estuary.
5. Although heavily influenced by human activity, the tidal reach of the ArroyoColorado provides a fairly favorable habitat for estuarine life, particularlynekton.
In addition to conventional water quality parameters, the intensive survey conducted bythe Texas Water Commission (now the TCEQ) on the Arroyo Colorado in 1987 includedanalysis of toxic substances in water, soil, and fish tissue, as well as toxicity testing onselected water samples (TWC 1989). The 1987 study concluded that the high aquatic lifeuse designated for Segment 2201 was not being attained at the time the survey wasconducted, but that toxic chemicals did not appear to be an important causative factor fornon-attainment. Instead, the report cited periodic maintenance dredging, salinity stratifi-cation, and high primary productivity as potential stress-inducing factors which occasion-ally resulted in a disturbed benthic environment and depressed dissolved oxygen inbottom waters. Also mentioned in this 1987 report was the fact that the fine-particledsubstrate in Segment 2201 is very homogenous and is not conducive to colonization bydiverse macrobenthic assemblages (TWC 1989). Surface DO concentrations measuredduring the 1987 intensive survey appeared adequate for maintaining the high aquatic lifeuse designated for the tidal segment of the Arroyo Colorado (Segment 2201), but verylow DO concentrations at the bottom of the water column, primarily due to naturalconditions of periodic salinity stratification, acted to limit the kinds of benthic organismsthat could exist at depth (TWC 1989). The report also concluded that toxic chemicalswere contributing to a slight overall impairment of the intermediate aquatic life usedesignated for Segment 2202.
Another study conducted in 1989 by the National Oceanic and Atmospheric Administra-tion (NOAA) identified the Lower Laguna Madre as being at the highest level of risk, orsusceptibility, for eutrophication among all other bays and estuaries in the Gulf ofMexico (NOAA, 1992). The high inflow of nutrients from the mainland was cited as apotential cause. The report states that the Lower Rio Grande Valley watershed (whichends at the southwest boundary of the Lower Laguna Madre) is one of the most intenselyfarmed watersheds in Texas, with approximately 28% of the land area classified ascropland and approximately 72% of available cropland in active cultivation.
In an effort to define wastewater treatment levels and effluent limitations for the ArroyoColorado, the Texas Water Commission (TWC) completed a waste load evaluation forthe stream in 1990. The report classified both segments (2201 and 2202) of the ArroyoColorado as “Water Quality Limited”, meaning that performance-based effluent limitsalone would be sufficient to attain and maintain the DO criteria associated with thedesignated use specified in the Texas Water Quality Standards (TWC 1990). In additionto the conclusions listed above, the 1990 TWC waste load evaluation report recom-mended modification of the wastewater discharge permit held by the City of McAllen toreflect the implementation of “advanced treatment with nitrification.”
Among the conclusions of the waste load evaluation report were the following:

10Texas Natural Resource Conservation Commission Draft, July 16, 2003
1. High-end fecal coliform values measured in the Arroyo Colorado suggested thepossibility that discharges of essentially untreated sanitary wastewater wereoccurring.
2. The impact of irrigation return flows on overall water quality in the ArroyoColorado was qualitatively determined to be significant.
3. Photosynthesis and associated eutrophication appeared to contribute signifi-cantly to the BOD and dissolved oxygen concentrations found in the stream.
The overall objective of the intensive surveys conducted in the Arroyo Colorado in 1994,1995, and 1996 was to predict the long-term effects of aquaculture facilities whichapplied for permits to discharge directly into the Arroyo Colorado near the confluencewith the Laguna Madre (at Arroyo City). Consequently, the studies were designedprimarily to assess water quality in the lower portions of the tidal segment (2201) atSpring and Summer low (freshwater) inflow conditions. However, as part of the study,mid-channel water quality profile measurements were conducted at 2-km intervalsthroughout the entire tidal segment up to the port of Harlingen.
During the three intensive surveys conducted between 1994 and 1996, a high degree ofsalinity stratification was noted throughout the entire tidal segment with the largestconductivity gradients occurring in the upper portion of tidal segment. Twenty-four hourdissolved oxygen(DO) measurements conducted near Arroyo City during the August1996 intensive survey did not meet the established criterion for tidal streams (24- hourDO average was below the 4.0 m/l criteria) and, on all three surveys (1994-96), instanta-neous DO values, measured in the mixed surface layer during the collection mid-channelprofile data, also exceeded the 24hr criterion. Low instantaneous DO readings in themixed surface layer were, again, most frequently observed in the upper portion of thetidal segment above and below Rio Hondo.
In addition to low DO values and high degree of salinity stratification, the results of thesurveys conducted in 1994, 1995, and 1996 also showed elevated levels of ammonianitrogen and chlorophyll a throughout the entire tidal segment. Nitrate plus nitrite,orthophosphate and total phosphorus concentrations were found to be at or only slightlyabove background levels.
Early state-wide water quality assessments and water body inventories conducted by thestate of Texas (i.e 1986 Segment Rankings) classified both segments of the ArroyoColorado (Segment 2201 Arroyo Tidal and Segment 2202 Arroyo Above Tidal) as WaterQuality Limited. Although the assessment methodologies used to create these early listsplaced less emphasis on observed water quality than the assessment methodologies usedin more recent years, a review of water quality data prior to 1986 showed low DO valueswere a common occurrence in the lower portion of Segment 2202 and upper portion ofSegment 2201. Subsequent segment water quality inventory and rankings conducted inby the Texas Water Commission in 1992 and 1994 (1992 and1994 State of Texas §303(d)List) included only the above tidal segment of the Arroyo Colorado (Segment 2202) asimpaired. However, among the pollutant or stressors cited for Segment 2202 were lowDO and excessive levels of nutrients (Table 1).

11Texas Natural Resource Conservation Commission Draft, July 16, 2003
In a 1994 TNRCC Clean Rivers Program report titled “Regional Assessment of WaterQuality in the Rio Grande Basin,” a “concern” for nutrients was identified for the ArroyoColorado and the North Floodway. A “concern” and a “possible concern” were alsoidentified for dissolved oxygen for Segments 2201 and 2202 respectively. In addition,“possible concerns” were identified for fecal coliform in Segment 2202 (determinedunder low flow conditions) and for ammonia nitrogen for the Lower Laguna Madre(TNRCC 1994). The follow-up 1996 TNRCC Clean Rivers Program report on RegionalWater Quality in the Rio Grande Basin again identified a “concern” for nutrients forSegment 2201 (TNRCC 1996).
The TNRCC included both segments of the Arroyo Colorado (Segments 2201 and 2202)in the State of Texas 1996 Clean Water Act (CWA)303(d) List. In this (1996) list ofimpaired water bodies, only Segment 2201 (the upper 8.5 miles) was listed for non-support of aquatic life use due to depressed dissolved oxygen concentrations.
In 1998, Segment 2201 was again listed for depressed dissolved oxygen concentrationsin the State of Texas 1998 CWA Section 303(d) List. The 1998 303(d) listing of Segment2201 was essentially a “carry-over” from the 303(d) listing in 1996 since the 305(b)assessment conducted by the TNRCC in 1998 did not include reassessment of waterbodies in the Nueces-Rio Grande Coastal Basin (Table 1).
Shortly after completion of the Texas 1998 Clean Water Act Section 303(d) List, theTNRCC began efforts to develop a TMDL for constituents associated with the DOimpairment observed in Segment 2201. As part of this effort, two additional intensivesurveys were conducted in the Arroyo Colorado to gain a clearer understanding of thephysical and chemical factors associated with the dissolved oxygen dynamics in the zoneof impairment and to provided additional data for calibration of a watershed loadingmodel and an in-stream water quality model. The first of these two surveys was con-ducted under low flow conditions (–100 cfs measured at Harlingen) in June of 1998. Thesecond survey was conducted under moderate to high flow conditions (–500 cfs mea-sured at Harlingen) following a short rainfall event which occurred in March of 1999.
Although the results of the 1998 intensive survey of the Arroyo Colorado showedsimilarities to those of earlier intensive surveys (i.e., low DO and high salinity stratifica-tion), overall water quality in the stream was the worst ever measured in any synopticstudy conducted in the Arroyo Colorado. Diel DO measurements conducted at the Port ofHarlingen and at Rio Hondo met neither the 24-hour average DO criterion (4.0 m/l) northe minimum DO criterion (3.0 m/l measured over a consecutive 8 hr period). Instanta-

12Texas Natural Resource Conservation Commission Draft, July 16, 2003
Table 1. Historical listing of the Arroyo Colorado in the Texas §303(d) list and precursorstate-wide Clean Water Act-mandated water quality and water body inventorylists.
SegmentNumber
Date ofListing
Portion ofSegmentlisted
Description of Impairment Parameter(s)Listed
Ranking (Number)
or Priority
2201 1986 EntireSegment
Water Quality Limited N/A 14
2201 1996 Upper 8.5Miles
The aquatic life use is notsupported in the upper 8.5 milesdue to depressed dissolved oxygenconcentrations
DissolvedOxygen
Medium
2201 1998 Upper 16Miles
Dissolved oxygen Concentrationsare sometimes lower than thestandard established to assureoptimum habitat for aquatic life.
DissolvedOxygen
TMDLUnderway
2201 1999 Upper 7.1Miles
In the upper 7.1 miles of thesegment, dissolved oxygenconcentrations are sometimeslower than the standard establishedto assure optimum conditions foraquatic life. Sediment toxicityoccasionally exceeds the screeninglevels.
DissolvedOxygen,SedimentToxicity
TMDLUnderway/Medium
2201 2000 Upper 7.1Miles
In the upper 7.1 miles of thesegment, dissolved oxygenconcentrations are sometimeslower than the criterion establishedto assure optimum conditions foraquatic life. Significant effects inambient sediment toxicity testssometimes occur.
DepressedDissolvedOxygen,Toxicity inAmbientSediment
High
2202 1986 EntireSegment
Water Quality Limited N/A 21
2202 1992 EntireSegment
High Point Sources,Eutrophication, Toxics
Toxics, HighAlgae,Nutrients, FecalColiform,Chlorides
Not Assigned
2202 1994 EntireSegment
Ambient Toxicity; High Algae,Fish Fills
DissolvedOxygen,Ammonia plusNitrateNitrogen,Phosphorus,Chlorides, FecalColiform
High

SegmentNumber
Date ofListing
Portion ofSegmentlisted
Description of Impairment Parameter(s)Listed
Ranking (Number)
or Priority
13Texas Natural Resource Conservation Commission Draft, July 16, 2003
2202 1996 EntireSegment
The Texas Department of Health(TDH) issued an all fish restrictedconsumption advisory for thegeneral population in September1980, due to elevated levels ofchlordane, toxaphene, and DDE infish tissue. The aquatic life use isonly partially supported in thelower four miles due to elevatedconcentrations of nitrobenzene,isophorone, and bis (2-ethylhexyl)phthalate. The contact recreationuse is not supported through theentire segment due to elevatedfecal coliform bacteria levels.
Chlordane,Toxaphene,DDE,Nitrobenzene,isophorone, bis(2-ethylhexyl)phthalate, FecalColiform
Medium
2202 1998 Upper 7.1Miles
The Texas Department of Health(TDH) issued a restrictedconsumption advisory for thegeneral population in September1980, due to elevated levels ofchlordane, toxaphene, and DDE infish tissue. Bacteria levelssometimes exceed the criterionestablished to assure the safety ofcontact recreation.
Chlordane,Toxaphene,DDE, FecalColiform
TMDLUnderway
2202 1999 EntireSegment
Fish consumption is not supported,based on a non-consumptionadvisory issued by the TexasDepartment of Health in 1evels ofchlordane, toxaphene, and DDE infish tissue. In the lower 40 miles,bacteria levels sometimes exceedthe criterion established to assurethe safety of contact recreation.
Chlordane,Toxaphene,DDE, FecalColiform
Low/ TMDLUnderway
2202 2000 EntireSegment
Fish consumption is not supported,based on a non-consumptionadvisory issued by the TexasDepartment of Health in 1evels ofchlordane, toxaphene, and DDE infish tissue. In the lower 40 miles,bacteria levels sometimes exceedthe criterion established to assurethe safety of contact recreation.
Chlordane,Toxaphene,DDE, FecalColiform
High
neous DO values measured in the mixed surface layer during the collection of profiledata were below the 24hr standard at 4 of the 12 tidal stations. All low instantaneous DOreadings measured during the survey were confined to the zone of impairment (above andbelow Rio Hondo). Additionally, low instantaneous DO measurements and high chloro-phyll a concentrations observed in the above-tidal segment (2202) provided strongevidence of eutrophication in the middle and lower reaches of the above-tidal segment of
14Texas Natural Resource Conservation Commission Draft, July 16, 2003
the Arroyo Colorado (Segment 2202). Nutrient values were also uniformly high inSegment 2202 but decreased significantly near the confluence of tidal segment. Ammo-nia nitrogen, nitrate plus nitrite nitrogen, orthophosphorus, total phosphorus, andchlorophyll a remained elevated in the uppermost portion of Segment 2201 coincidinggeographically with the zone of impairment.
The main objective of the high-flow intensive survey conducted in the arroyo Coloradoin March of 1999 was to obtain information about the incremental loadings of nutrients,sediment, and oxygen demanding substances received by the Arroyo Colorado at distinctlocations along the length of the Arroyo Colorado (Segments 2201 and 2202) before,during, and immediately after a measurable runoff event. The sampling locations werechosen to coincide with sub-basin boundaries defined by separate “pour points” withinthe watershed. Additionally, in-stream flow and water quality measurements madesimultaneously at several stream locations at different points in the hydrograph provideda snapshot of the physical and chemical conditions associated with the moderate rainfall-runoff event of March 30, 1999 in the Arroyo Colorado watershed.
Typically, detailed high-flow loading studies involve the collection of data from severalrainfall-runoff events using automated samplers. However, due to time and resourceconstraints, the intensive survey described above was the only detailed high-flow datacollection event conducted in the Arroyo Colorado as part of the TMDL effort. Unlikemost high flow studies, the March 1999 high flow intensive survey of the ArroyoColorado included tidal flow and vertical profile measurements conducted simulta-neously at different locations in the water body, at distinct times in the hydrograph.Although snapshots in time, the similarity in sampling methodology of the 1999 high-flow intensive survey to that of the 1998 low-flow survey provides a direct and detailedcomparison of physical and chemicals conditions in the stream during two very differentflow conditions.
Lower average conductivities and higher DO values were observed during the 1999 high-flow intensive survey in both segments of the Arroyo Colorado due to increased freshwa-ter inflows and greater degree of vertical mixing, especially in the tidal portion of thestream. Unlike previous surveys, sharp changes in conductivity with depth were onlyevident in the middle and lower portions of Segment 2201 as the mixed surface layerextended vertically to four meters in the upper portion of the tidal segment and approxi-mately two meters in the middle portions of the tidal segment. Although all DO valuesmeasured during the 1999 high-flow event were above the established criterion andphosphorus and chlorophyll a concentrations were generally much lower, ammonia andnitrate plus nitrite nitrogen concentrations exceeded screening criteria and were signifi-cantly higher than those observed during the 1998 low-flow intensive survey. Averageconcentrations of five-day carbonaceous biochemical oxygen demand (CBOD5) in thezone of impairment (upper portion of Segment 2201) were approximately four timeshigher in the 1999 high-flow intensive survey than during the 1998 low-flow survey. Asexpected, average total suspended solids values in Segment 2202 were higher during thehigh-flow intensive survey than during the low-flow event of 1998. However, there was
15Texas Natural Resource Conservation Commission Draft, July 16, 2003
no significant difference in the concentration of total suspended solids between the high-flow and low-flow events in Segment 2201. Also of significance is the fact that althoughabout 50% of the CBOD5 collected from the lower portion of Segment 2202 was in theform of particulate organic matter, only an average of 22% of the CBOD5 collected inthe zone of impairment (Segment 2201) was found to be particulate organic matter.
In 1999, the TNRCC conducted a reassessment of water quality in the Arroyo Coloradoas part of the state’s effort to compile The State of Texas 1999 Clean Water Act Section303(d) List. As a result of the reassessment, Segment 2201 was again included in thestate’s (1999) 303(d) list for aquatic life use impairment caused by occasional low DOconcentrations in the upper 7.1 miles of the segment (Table 1). In addition to the DOimpairment, Segment 2201 was also placed on the 1999 Surface Water Quality ConcernsList for high levels of ammonia nitrogen (upper 11.5 miles), nitrate plus nitrite nitrogen(upper 6 miles), and chlorophyll a. Concerns for ammonia nitrogen, nitrate plus nitritenitrogen, and chlorophyll a were also cited in the 1999 303(d) list for the lower 40 milesof Segment 2202.
Segment 2201 was again included in the 2000 Texas Clean Water Act Section 303(d)List for aquatic life use impairment caused by occasional low DO concentrations in theupper 7.1 miles of the segment (Table 1). Like the 1998 303(d) listing of Segment 2201(which was based on the assessment conducted in1996), the appearance of Segment 2201in the 2000 Texas 303(d) list was a “carry-over” from the 1999 303(d) list, since notenough new data was available in 2000 to meet the minimum data requirements forreassessment.
Within the last ten years, evidence of negative effects normally associated with excessnutrient loadings has begun to surface in the Lower Laguna Madre (which receivesinflow from the Arroyo Colorado). A persistent algal bloom, known as the “brown tide”,has been observed over large portions of the Laguna. In addition to creating stressfulecological environments typical of eutrophic conditions (i.e., sharp diurnal swings indissolved oxygen), there is also evidence that reductions in light penetration caused bythe density of high macroalgal biomass can harm the long-term productivity and viabilityof sea grasses along with the organisms which depend so heavily on the benthic environ-ment these plants provide (Onuff, 1996). Recent studies conducted by the US GeologicalSurvey in the Lower Laguna Madre appear to indicate that a correlation exists betweenhigh macroalgal biomass and inflows from the Arroyo Colorado (Onuff 1999). Althougha sea grass species composition change has been observed recently in the Laguna Madre,factors affecting this change have not been definitively identified (TNRCC, 1994a andTGLO 1995) .
Endpoint IdentificationIn general terms, the endpoint of any TMDL effort is the restoration and/or protection ofbeneficial uses which have been determined to be impaired or threatened in a particularwater body. In the case of the tidal segment of the Arroyo Colorado, the issue of benefi-cial use impairment is confounded by the difficulties associated with determiningwhether the appropriate aquatic life use has been defined and is being met in the segment.

16Texas Natural Resource Conservation Commission Draft, July 16, 2003
Because of the absence of reliable biological indexes for estuarine and tidally-influencedwater bodies located along the Texas Gulf Coast, studies designed to determine aquaticlife use in these environments must rely on subjective professional judgement to deter-mine use attainability. Additionally, the high degree of anthropogenic influence thatcharacterizes the physical setting in Segment 2201 makes it difficult to determine thedegree to which physical and chemical factors interact to limit aquatic life. Although theTexas Surface Water Quality Standards (30 TAC §§307.1-307.10) specify the dissolvedoxygen criteria that must be met in tidal streams with high aquatic life use designations(such as the Arroyo Colorado), the standards do not currently specify numeric criteria forother constituents associated with dissolved oxygen dynamics (such as nutrients orchlorophyll a). Numeric endpoints for these constituents must be developed through site-specific association with the pertinent numeric DO criteria specified in the standards.
Dissolved OxygenThe most current description of the DO impairment observed in the tidal segment of theArroyo Colorado states that “In the upper 7.1 miles of the segment, dissolved oxygenconcentrations are sometimes lower than the criterion established to assure optimumconditions for aquatic life.”(TNRCC, 2000b). The water quality assessment that resultedin this impairment description was conducted by the TNRCC in 1999.
At the time of the 1999 assessment, most of the dissolved oxygen data collected at fixedstations were instantaneous measurements collected during daylight hours (0900 hours to1400 hrs). As a result, proper comparison of assessment data to the 24-hour criterion (4.0mg/l DO for the Segment 2201) was not possible. Due to these limitations, the 1999assessment methodology used the 24-hour DO criterion as a single measurementminimum screening level to evaluate support of the appropriate aquatic life use. Supportof the designated aquatic life use at each site for routinely collected instantaneous DOdata was based on ranges for the percent of non-compliant samples when at least ninesamples were available. A water body was found to be fully supporting the applicableaquatic life use if the calculated non-compliance rate was 10% or less; partially support-ing if greater than 10% and less than 25%; and not supporting if greater than 25%. Waterbodies were included in the 303(d) list if they were found to not support or only partiallysupport the applicable aquatic life use.
Data from 48 stations were used to assess water quality in the tidal segment of the ArroyoColorado in 1999 (Figure 2). Of the 13 monitoring stations representing the upper portionof the Arroyo Colorado tidal segment, 6 showed DO values below the criteria yielding a36% non-compliance rate (8 non-compliant samples out of 22 measurements). In thelower portion of the tidal segment, only 1 of the 35 remaining downstream stationsproduced DO values below the assessment criteria yielding a 0.9% non-compliance rate(1 non-compliant sample out of 109 measurements). Figure 2 shows the location of allmonitoring stations in Segment 2201 (DO violations occurred only in the stations that arelabeled). Also shown in Figure 2 is the zone of impairment as defined in the 2000 TexasClean Water Act Section 303(d) List.

17Texas Natural Resource Conservation Commission Draft, July 16, 2003
#
#
#
#
#
##
#
#
#
#####
#
##########################
####
########
###
##
##
###
####
##
####
##
1556913072
16143
16142
13072
16143
16142
16144
15548
16152#
2201
#
2202
Zone of Impairment -
Figure 2. Monitoring stations in Segment 2201 (Arroyo Colorado Tidal). Non-compliancewith DO criteria was observed in the labeled stations
After completion of the 2000 Texas CWA Section 303(d) list, the TNRCC modified theassessment methodology and listing policy regarding observed DO impairments.Beginning with the 2002 305(b) assessment of water quality in the state of Texas, waterbodies are no longer listed on (or de-listed from) the state’s list of impaired water bodies(303(d) list) for DO violations based on instantaneous DO measurements. Currently,compliance with the appropriate 24-hour DO criterion can only be determined throughthe collection and analysis of diel (24-hour) DO monitoring data. Additionally, in orderto establish an acceptable probability of falsely listing water bodies as impaired (Type Ierror) or neglecting to include impaired water bodies on the 303(d) list (Type II error) thecurrent 305(b) assessment methodology employs the binomial method to determine usesupport (TNRCC 2001). Although partial support and non support are still defined asnon-compliance rates of more than 10 and 25 percent, respectively, under the binomialmethod, the number of non-compliant samples necessary to determine non-support andpartial support varies with the number of samples available for assessment.
To determine use attainment for DO criteria under the current (2002) assessmentmethodology, at least ten (10) 24-hour monitoring events must be conducted at each sitewithin a 5-year period to provide adequate data for assessment of aquatic life use. All 24-hour sampling events must occur within the index period (March 15- October 15).
18Texas Natural Resource Conservation Commission Draft, July 16, 2003
However, at least one sample and between half and two thirds of each year’s samplesmust be taken during the critical period of July 1, - September 30. No more than twothirds of the samples should be taken in the same year and the sampling events should bemore than one month apart.
Assuming low DO concentrations are likely to occur within the critical portion of theindex period, a numerical endpoint for DO (signifying full support of aquatic life use)may be expressed as a probability of less than 10% that the average 24-hour DO mea-sured in the mixed surface layer during the index periods will be below 4.0 mg/l (i.e.,90% compliance rate). Similarly, an endpoint for the minimum DO may also be ex-pressed as a probability of less than 10% that the 24-hour minimum DO concentration in the mixed surface layer of the segment will be below 3.0 mg/l over a consecutive 8-hour period.
Currently under the 2002 305 (b) assessment methodology, a determination of whetherthe designated aquatic life use is being fully supported in the tidal segment of the ArroyoColorado can only be made after additional 24-hour DO monitoring is completed.Although historical data indicate the strong possibility that the DO criteria are not beingmet in the upper portion of Segment 2201, the data requirements of the current (2002)305(b) assessment methodology and the lack of existing 24-hour DO data prevents fullre-assessment of use attainment (for DO) in the segment until, at least, 2006.
In summary, the DO endpoints for this TMDL are a 90% compliance rate with theapplicable 24-hour average DO concentration (4.0 mg/l) and also a 90% compliance ratewith the applicable minimum DO criteria (3.0 mg/l).
Nutrients and Chlorophyll aAs mentioned previously, the Texas Surface Water Quality Standards (30 TAC §§307.1-307.10) do not specify numeric nutrient criteria for water bodies in the state of Texas.Consequently, water bodies are not listed for nutrient impairments in the state of Texas303(d) list using numeric criteria. Instead, water bodies in the state are evaluated fornutrient concerns using screening criteria developed using the 85 percentile of nutrientdata collected for similar water bodies in the state. A detailed description of the nutrientconcerns identified in the 2000 Texas 303(d) list for Segment 2201 was discussedpreviously in the “Problem Definition” section of this document. It is interesting to notethat under the 2002 305 (b) assessment methodology, no nutrient or chlorophyll aconcerns were identified for Segment 2201.
Nutrient screening criteria are meant to represent an upper end of nutrient values which,if exceeded, may indicate over-enrichment of these constituents in the water body beingassessed. However, criteria based on percentiles calculated from data collected in similarwater bodies of the state cannot be considered viable numerical TMDL endpoint targets.In order to define a suitable endpoint target for these parameters, a cause-and-effectrelationship must be established between the nutrient and chlorophyll a levels observedin Segment 2201 and the DO impairment in the upper portion of the segment.
19Texas Natural Resource Conservation Commission Draft, July 16, 2003
In a study conducted between 1997 and 2000 in the upper portion of Segment 2201,Matlock found sampling sites in the zone of impairment showed no detectable increase in periphytic chlorophyll production with nutrient enrichment in the reaches measured(Matlock, et al., 2001). Also noted in the study was the fact that nutrients appearedsaturated with respect to algal requirements and that little difference in primary produc-tivity existed between the reaches analyzed. Based on these and other findings, Matlockconcluded that nutrients were not limiting periphytic chlorophyll production in the upperportion of Segment 2201.
Failure to identify a limiting nutrient complicates the ability to associate a particularnutrient or nutrient type with the observed DO impairment in Segment 2201. Further-more, although (relatively) elevated chlorophyll- a levels and DO supersaturation valuesindicative of hyper-eutrophication have been documented in the upper portion ofSegment 2201, very low average 24-hour DO concentrations have also been measured inthe upper portion of Segment 2201 during diel fluctuations that occurred below thetheoretical DO saturation concentration; this includes the data collected during the 1998intensive survey in which the most pronounced non-compliance with 24-hour DO criteriawas recorded in Segment 2201 (Figure 3). In fact, a limited but credible amount of 24-hour DO data, suggests that some low average diel DO values measured in the tidalsegment of the Arroyo can be attributed to factors other than eutrophication, such astemperature, salinity, and benthic oxygen demand (Matlock 2001).
While it is theoretically possible to define nutrient (and chlorophyll a) endpoints throughthe use of calibrated water quality model(s) designed to simulate dissolved oxygen andthe complex interaction of these constituents in the processes associated with photosyn-thesis, primary productivity, and respiration, it is important to recognize that basingnutrient targets on a predetermined dissolved oxygen criteria will yield meaningfulendpoint concentrations of these parameters only if realistic and appropriate DO criteriaare first established and only after a significant association can be established betweennutrient and chlorophyll a parameters and the DO impairment observed . Unfortunately,the results of the TMDL analysis conducted in Segment 2201 does not provide a quanti-tative, water quality target-based nutrient (or chlorophyll a) endpoint. Proposed nutrientendpoint concentrations are discussed in more detail in the “Loading Allocation” sectionof this document.
BOD and SOD Like nutrients and chlorophyll a, TMDL target endpoints for Biochemical OxygenDemand (BOD) are based on established cause-and-effect relationships between BODlevels and observed DO impairments. These relationships can also be quantitativelydefined using calibrated water quality model(s) designed to simulate BOD loading,transport, and decay and dissolved oxygen dynamics. However, as with nutrients,establishing endpoints for BOD in the tidal segment of the Arroyo Colorado is dependent

20Texas Natural Resource Conservation Commission Draft, July 16, 2003
Dissolved Oxygen and Percent Saturation
0
1
2
3
4
5
6
22:00 0:0
02:0
04:0
06:0
08:0
010
:0012
:0014
:0016
:0018
:0020
:0022
:00 0:00
2:00
4:00
6:00
8:00
0
10
20
30
40
50
60
70
80
DO (mg/L)
DO (% sat)
Time
Figure 3. Graph of 24-hour DO measurement in Segment 2201 at Rio Hondo duringAugust 16 and 17, 1998.
on the ability to establish a significant association between BOD parameters and the DOimpairment observed in the upper portion of Segment 2201.
Given the number of wastewater outfalls in the stream, the waste water treatment levels,and the permit compliance record of wastewater treatment plants in the Arroyo Colorado,historical BOD levels measured in Segment 2201 are low. Average and median CBOD5concentrations in Segment 2201 (derived from historical water quality monitoring datadating back to 1974) are 5.1 mg/l and 5.0 mg/l respectively. CBOD5 values from morerecent monthly monitoring conducted in 2000-2002 in the zone of impairment ofSegment 2201 yield average and median values that are at and below detection limits(#3.0 mg/l) respectively.
As with nutrients and chlorophyll a, the results of the TMDL analysis conducted inSegment 2201 does not provide a quantitative, water quality target-based TMDLendpoint for BOD. Proposed BOD endpoint concentrations are discussed in more detailin the “Loading Allocation” section of this document.
21Texas Natural Resource Conservation Commission Draft, July 16, 2003
One of the factors that emerges as an important component of DO dynamics in theArroyo Colorado is sediment oxygen demand (SOD). SOD can be defined in a numberof ways. However, for the purpose of this document, SOD is defined as the oxygendemand exerted on the water column by in-situ benthic biochemical processes such asdiagenesis of sedimentary organic matter. SOD was investigated by Matlock et al., in astudy conducted between 1998 and 2000 in the tidal and above-tidal segments of theArroyo Colorado. As part of the study, SOD was measured in-situ using benthic chamberrespirometers and ex-situ in the laboratory for 9 sites located mainly along the above-tidal portion of the Arroyo Colorado (Segment 2202). Although significant spatial andtemporal variations in SOD were observed during the course of the study, high averageand median values were reported throughout the segment (average of 44.4 mg/m2-hr andmedian of 24.7 mg/m2-hr) with values as high as 191.4 mg/m2-hr reported for siteslocated in areas of high deposition (Matlock et al., 2001).
It is clear from the TMDL analysis conducted in the Arroyo Colorado that the combinedeffects of high SOD and poor mixing (referred to collectively as DO flux across thehalocline) exert a powerful (seasonal) effect on dissolved oxygen dynamics in the mixedsurface layer of Segment 2201. The TMDL analysis conducted in the Arroyo Coloradoand similar studies conducted in other coastal water bodies also offer evidence that thephysical channel dimensions, hydraulics, and geographic orientation of the water bodyprobably have a high degree of influence on the DO flux in the Arroyo Colorado. Despitethe TMDL analysis, there is still a general lack of information and understanding of thetransport dynamics, and diagenesis of the particulate organic matter which is thought toplay an important role in the formation of excessive SOD in Segment 2201. Moreover,other mechanisms associated with DO flux across the halocline are also poorly repre-sented in the current TMDL analysis. The role of SOD/DO flux as it relates to DOdynamics in Segment 2201 are discussed in more detail in the “Linkage Between Sourcesand Receiving Waters” and “Load Allocation” sections of this document.
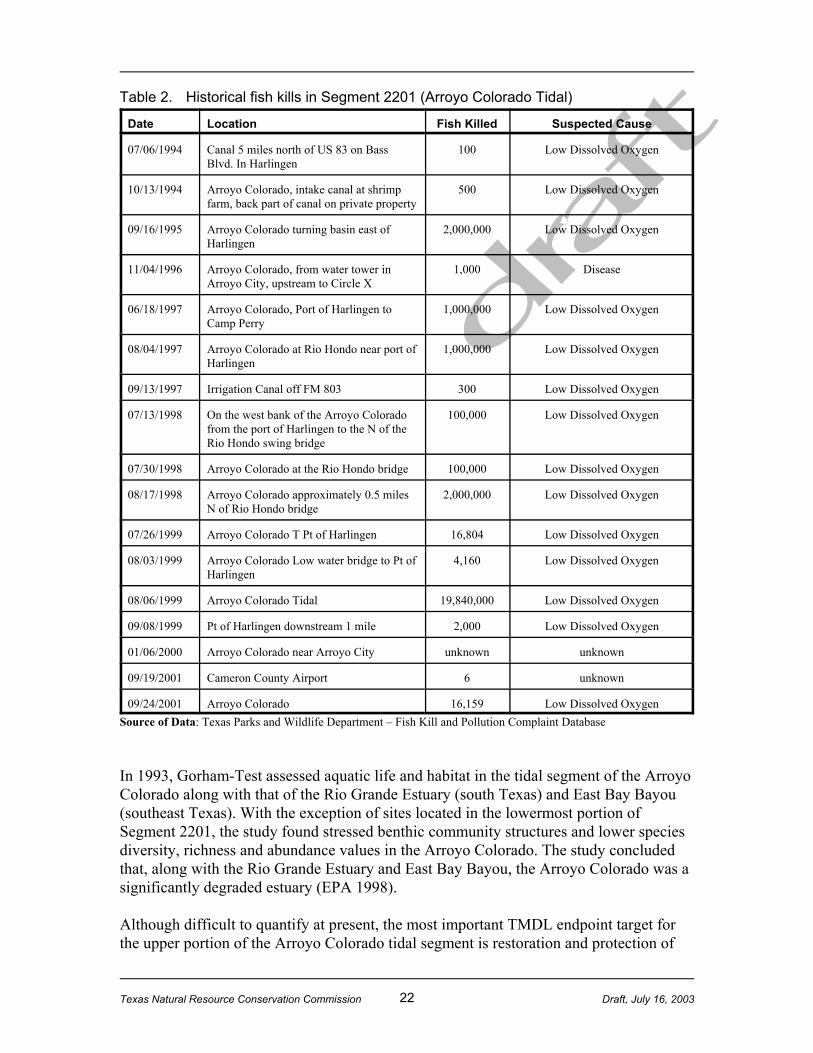
Fish Kills and Aquatic Life UseAs stated previously in this document, the ultimate goal of the TMDL analysis describedherein is to provide the basis for developing a viable strategy to attain and maintain a DOcriterion that is protective of the appropriate beneficial aquatic life use in the tidalsegment of the Arroyo Colorado. In addition to monitoring and assessment resultsshowing aquatic life use is not being supported in Segment 2201 (i.e., documented DOcriteria violations), there is quantitative biological evidence of stress to aquatic life in theupper portion of Segment 2201. Since 1994, fish kills have been reported with increasingfrequency in the tidal segment of the Arroyo Colorado (see Table 2.). While the sus-pected causes of the fish kills include disease and unknown factors, the majority of theseevents are attributed to low DO (TPWD 2002). Not surprisingly, the majority of the fishkills reported have also occurred in the zone of impairment defined in the 2000 TexasClean Water Act Section 303(d) List.
22Texas Natural Resource Conservation Commission Draft, July 16, 2003
Table 2. Historical fish kills in Segment 2201 (Arroyo Colorado Tidal)
Date Location Fish Killed Suspected Cause
07/06/1994 Canal 5 miles north of US 83 on BassBlvd. In Harlingen
100 Low Dissolved Oxygen
10/13/1994 Arroyo Colorado, intake canal at shrimpfarm, back part of canal on private property
500 Low Dissolved Oxygen
09/16/1995 Arroyo Colorado turning basin east ofHarlingen
2,000,000 Low Dissolved Oxygen
11/04/1996 Arroyo Colorado, from water tower inArroyo City, upstream to Circle X
1,000 Disease
06/18/1997 Arroyo Colorado, Port of Harlingen toCamp Perry
1,000,000 Low Dissolved Oxygen
08/04/1997 Arroyo Colorado at Rio Hondo near port ofHarlingen
1,000,000 Low Dissolved Oxygen
09/13/1997 Irrigation Canal off FM 803 300 Low Dissolved Oxygen
07/13/1998 On the west bank of the Arroyo Coloradofrom the port of Harlingen to the N of theRio Hondo swing bridge
100,000 Low Dissolved Oxygen
07/30/1998 Arroyo Colorado at the Rio Hondo bridge 100,000 Low Dissolved Oxygen
08/17/1998 Arroyo Colorado approximately 0.5 milesN of Rio Hondo bridge
2,000,000 Low Dissolved Oxygen
07/26/1999 Arroyo Colorado T Pt of Harlingen 16,804 Low Dissolved Oxygen
08/03/1999 Arroyo Colorado Low water bridge to Pt ofHarlingen
4,160 Low Dissolved Oxygen
08/06/1999 Arroyo Colorado Tidal 19,840,000 Low Dissolved Oxygen
09/08/1999 Pt of Harlingen downstream 1 mile 2,000 Low Dissolved Oxygen
01/06/2000 Arroyo Colorado near Arroyo City unknown unknown
09/19/2001 Cameron County Airport 6 unknown
09/24/2001 Arroyo Colorado 16,159 Low Dissolved OxygenSource of Data: Texas Parks and Wildlife Department – Fish Kill and Pollution Complaint Database
In 1993, Gorham-Test assessed aquatic life and habitat in the tidal segment of the ArroyoColorado along with that of the Rio Grande Estuary (south Texas) and East Bay Bayou(southeast Texas). With the exception of sites located in the lowermost portion ofSegment 2201, the study found stressed benthic community structures and lower speciesdiversity, richness and abundance values in the Arroyo Colorado. The study concludedthat, along with the Rio Grande Estuary and East Bay Bayou, the Arroyo Colorado was asignificantly degraded estuary (EPA 1998).
Although difficult to quantify at present, the most important TMDL endpoint target forthe upper portion of the Arroyo Colorado tidal segment is restoration and protection of

23Texas Natural Resource Conservation Commission Draft, July 16, 2003
the appropriate aquatic life use. Many of the biological surveys conducted in segment2201 cite loss of habitat (from dredging and channel straightening) and the artificialcreation of physical conditions not conducive to the development of a healthy benthicenvironment (accentuation of natural salinity stratification) as factors that contribute tothe stress exerted on aquatic life in the Arroyo Colorado (TDWR, 1984 ; EPA, 1998).
The results of the TMDL analysis conducted in the Arroyo Colorado also indicate thatanthropogenic modification of the Arroyo Colorado contributes significantly to thedissolved oxygen conditions observed in the upper portion of Segment 2201 and thatreductions in loadings of chemical and biochemical constituents alone may not besufficient to reduce environmental stresses to a level that will sustain a high aquatic lifeuse in the segment. The physical factors (natural and anthropogenic) that contribute to theDO impairment observed in the upper portion of Segment 2201 are discussed further inthe section of this document titled “Linkage Between Sources and Receiving Waters.”
Source AnalysisIn accordance with the TMDL target endpoint(s) identified above, the TMDL analysisconducted in the Arroyo Colorado focuses primarily on sources of constituents com-monly associated with dissolved oxygen dynamics in surface waters. These constituentsinclude the following parameters:
C BODC Ammonia NitrogenC Nitrate plus Nitrite NitrogenC Orthophosphate PhosphorusC Organic NitrogenC Organic PhosphorusC Sediment
An analysis of the sources of these constituents in the Arroyo Colorado watershed revealsa variety of point and nonpoint source contributors encompassing a number of social andeconomic sectors.
Point Sources There are currently 39 active wastewater discharge permits associated with the ArroyoColorado (33 municipal and domestic wastewater outfalls and 6 industrial outfalls), witha total permitted flow of approximately 56 million gallons per day. Thirty four of thesedischarge permits are for outfalls that discharge into Segment 2202 (Arroyo Coloradoabove tidal); 5 are for outfalls that discharge into Segment 2201 (see Table 3).
Figure 4 shows the location of wastewater outfalls relative to the various sub-basins thatcomprise the Arroyo Colorado watershed. Although officially classified by the TCEQ asdischarging into the Arroyo Colorado, it should be noted that several of the wastewateroutfalls listed Table 3 are located outside the Arroyo Colorado watershed and do not

24Texas Natural Resource Conservation Commission Draft, July 16, 2003
HidalgoWillacy
Cameron
#
##
## #
##
#
#
#
#
#
#
#
#
#
#
#
#
#
#
#
#
#
##
#
#
#
#
#
##
#
#
Permitted Wastewater Outfall Locations#
Figure 4. Wastewater outfall locations in the Arroyo Colorado watershed and watershedsub-basins.
contribute directly to the classified segments of the Arroyo Colorado. All of the permit-ted outfalls located outside of the Arroyo Colorado watershed are small domesticwastewater facilities with non-direct discharges such as subsurface drain fields orsubsurface pressure injection.
Much of the information gathered during the TMDL analysis regarding actual flow andloading of BOD, suspended sediment and, in some cases, ammonia nitrogen for munici-pal point sources in the watershed was obtained from monthly effluent data submitted tothe TCEQ as part of self-reporting requirements specified in individual TPDES permits.Information regarding municipal point source loadings of constituents such as nitrate plusnitrite, total kjeldahl nitrogen, total phosphorus, and orthophosphate was obtained frommonitoring of wastewater effluents performed voluntarily by permitted wastewatertreatment facilities in the watershed and from special effluent monitoring conducted bythe TNRCC (now the TCEQ) as part of the TMDL effort in 2000 and 2001.
The information described above was assembled and entered into a Watershed DataManagement File (WDM file) in the form of time series for input into a dynamic
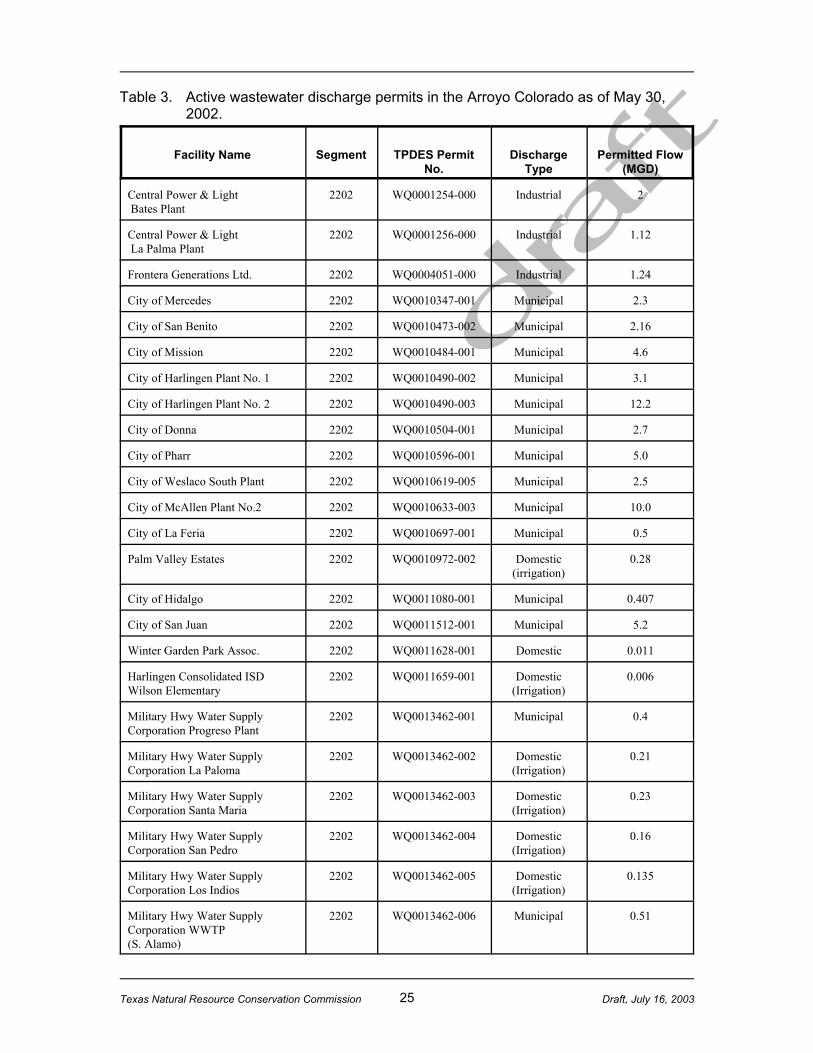
25Texas Natural Resource Conservation Commission Draft, July 16, 2003
Table 3. Active wastewater discharge permits in the Arroyo Colorado as of May 30,2002.
Facility Name Segment TPDES PermitNo.
DischargeType
Permitted Flow(MGD)
Central Power & Light Bates Plant
2202 WQ0001254-000 Industrial 2
Central Power & Light La Palma Plant
2202 WQ0001256-000 Industrial 1.12
Frontera Generations Ltd. 2202 WQ0004051-000 Industrial 1.24
City of Mercedes 2202 WQ0010347-001 Municipal 2.3
City of San Benito 2202 WQ0010473-002 Municipal 2.16
City of Mission 2202 WQ0010484-001 Municipal 4.6
City of Harlingen Plant No. 1 2202 WQ0010490-002 Municipal 3.1
City of Harlingen Plant No. 2 2202 WQ0010490-003 Municipal 12.2
City of Donna 2202 WQ0010504-001 Municipal 2.7
City of Pharr 2202 WQ0010596-001 Municipal 5.0
City of Weslaco South Plant 2202 WQ0010619-005 Municipal 2.5
City of McAllen Plant No.2 2202 WQ0010633-003 Municipal 10.0
City of La Feria 2202 WQ0010697-001 Municipal 0.5
Palm Valley Estates 2202 WQ0010972-002 Domestic(irrigation)
0.28
City of Hidalgo 2202 WQ0011080-001 Municipal 0.407
City of San Juan 2202 WQ0011512-001 Municipal 5.2
Winter Garden Park Assoc. 2202 WQ0011628-001 Domestic 0.011
Harlingen Consolidated ISDWilson Elementary
2202 WQ0011659-001 Domestic(Irrigation)
0.006
Military Hwy Water SupplyCorporation Progreso Plant
2202 WQ0013462-001 Municipal 0.4
Military Hwy Water SupplyCorporation La Paloma
2202 WQ0013462-002 Domestic(Irrigation)
0.21
Military Hwy Water SupplyCorporation Santa Maria
2202 WQ0013462-003 Domestic(Irrigation)
0.23
Military Hwy Water SupplyCorporation San Pedro
2202 WQ0013462-004 Domestic(Irrigation)
0.16
Military Hwy Water SupplyCorporation Los Indios
2202 WQ0013462-005 Domestic(Irrigation)
0.135
Military Hwy Water SupplyCorporation WWTP(S. Alamo)
2202 WQ0013462-006 Municipal 0.51

26Texas Natural Resource Conservation Commission Draft, July 16, 2003
La Joya ISDLa Joya Elementary
2202 WQ0013523-001 Domestic(Subsurface
Pressure)
0.15
La Joya ISDChapa Elementary
2202 WQ0013523-002 Domestic(SubsurfaceDrain Field)
0.15
La Joya ISDKika De la Garza Elementary
2202 WQ0013523-003 Domestic(Subsurface
Pressure)
0.15
La Joya ISD11th and 12th Elementary
2202 WQ0013523-004 Domestic(Subsurface
Pressure)
0.15
City of Alamo 2202 WQ0013633-001 Municipal 2.0
Donna ISD Runn Elementary 2202 WQ0013680-001 Municipal 0.017
Donna ISD Muñoz Elementary 2202 WQ0013680-002 Domestic(SubsurfaceDrain Field)
0.0125
Donna ISD Garza Elementary 2202 WQ0013680-003 Domestic(SubsurfaceDrain Field)
0.0125
Mission CISDMission Elementary
2202 WQ0013887-001 Domestic(SubsurfaceDrain Field)
0.013
USDA Moore Field WWTP 2202 WQ0014155-001 Domestic(SubsurfaceDrain Field)
0.0033
Hartex Cattle Co. Feedlot 2201 WQ0001666-000 Industrial N/A
Taiwan Shrimp Village Assoc. andArroyo Aquaculture Inc.
2201 WQ0003596-000 Industrial 100
Southern Star Inc. 2201 WQ0004244-000 Industrial 50
City of Rio Hondo 2201 WQ0010475-002 Municipal 0.4
Military Hwy Water SupplyCorporation Lago WWTP
2201 WQ0013462-008 Municipal 0.51
watershed and water quality model used to simulate water quality in the ArroyoColorado.
The TMDL analysis conducted on the Arroyo Colorado indicates that municipal waste-water facilities in the Arroyo Colorado watershed are the most significant point sourcecontributors of nutrients and BOD into the Arroyo Colorado (USGS, 2002).
Although marked improvements in permit compliance have been observed in the last 5-7years, a comparison of permit limits of BOD and ammonia nitrogen to historical BODand ammonia nitrogen effluent concentrations from self-reported data provides historical

27Texas Natural Resource Conservation Commission Draft, July 16, 2003
0
10
20
30
40
50
60
70
80
Jan-
89
Jan-
90
Jan-
91
Jan-
92
Jan-
93
Jan-
94
Jan-
95
Jan-
96
Jan-
97
Jan-
98
Jan-
99
Self-reported Effluent BOD-5 Conc.(mg/l)City of HidalgoPermit Limit
confirmation of permit non-compliance for several municipal wastewater facilities in theArroyo Colorado watershed. Figures 5a-6b show historical BOD and ammonia nitrogeneffluent concentrations plotted along with the applicable permit limits for severalmunicipal wastewater facilities in the Arroyo Colorado watershed. The data shown inthese figures highlights the fact that permit non-compliance has historically has been aproblem in the Arroyo Colorado watershed. Figure 5a. Historical effluent concentrations and permit limit for BOD-5 for the City of
Hidalgo, Texas.
Nonpoint SourcesAs in most watersheds, the contribution of constituents of concern in the Arroyo Colo-rado from nonpoint sources is closely related to the type of land use and land cover that ispresent in the watershed. Land use and land cover in the Arroyo Colorado watershed arecomposed of a complex mixture of agricultural, urban, and natural land which contributeslarge quantities of nutrients and BOD in the form of dissolved and particulate loadingsduring rainfall-runoff events and also as a result of irrigation return flows which occurmainly under low in-stream flow conditions.
Figure 7 shows land use in the Arroyo Colorado watershed during the period of 1995-1996. As part of the TMDL analysis conducted on the Arroyo Colorado, the TNRCC in

28Texas Natural Resource Conservation Commission Draft, July 16, 2003
Self-reported Effluent BOD-5 Conc. (mg/l) City of San Benito No. 1 Plant
010203040506070
Jan-
89
Jan-
90
Jan-
91
Jan-
92
Jan-
93
Jan-
94
Jan-
95
Jan-
96
Jan-
97
Jan-
98
Jan-
99
Permit Limit
Self-reported Effluent NH3-N Conc.(mg/l) City of Harlingen #2 Plant
0
5
10
15
20
25
Jan-
89
Jan-
90
Jan-
91
Jan-
92
Jan-
93
Jan-
94
Jan-
95
Jan-
96
Jan-
97
Jan-
98
Jan-
99
Permit limits
Figure 5b. Historical effluent concentrations and permit limit for BOD-5 for the City ofSan Benito, Texas.
Figure 6a. Historical effluent concentrations and permit limit for ammonia for the Cityof Harlingen, Texas.

29Texas Natural Resource Conservation Commission Draft, July 16, 2003
012345678
Jan-
89
Jan-
90
Jan-
91
Jan-
92
Jan-
93
Jan-
94
Jan-
95
Jan-
96
Jan-
97
Jan-
98
Jan-
99
Self-reported Effluent NH3-N Conc.(mg/l)City of PharrPermit Limit
Figure 6b. Historical effluent concentrations and permit limit for ammonia for the Cityof Pharr, Texas.
cooperation with the USGS, developed a detailed coverage of land use and land cover for the Arroyo Colorado watershed based on the Multi-Resolution Land CharacteristicsClassification (MRLC) system. This system allows the customization of land usecharacteristics to a level commensurate with the unique needs of each particular land useanalysis.
The date of the land use coverage shown in Figure 7 is considered to be an averagecondition for the entire period of record studied during the Arroyo Colorado TMDLanalysis (1989-1999) because it represents the temporal center of the 11-year periodencompassed by the study.
In order to analyze nutrient and BOD contributions from sub-sectors of agriculturalproduction, agricultural land in the Arroyo Colorado watershed was characterized to thelevel of individual crop type (i.e., sugarcane, row crops, citrus, etc.). Detailed land usecharacterization was also conducted for urban and natural land uses.
Using the detailed land use information shown in Figure 7 and, in combination withinformation about soil types underlying the different permeable land uses, a series ofpermeable (PERLND) and impermeable (IMPLND) land groupings possessing uniquehydraulic and constituent loading characteristics were developed for the Arroyo Coloradowatershed (USGS 2002). The loading of sediment, nutrients and BOD for these land unitsinto the Arroyo Colorado was then modeled using the Hydrologic Simulation Program -Fortran (HSPF).
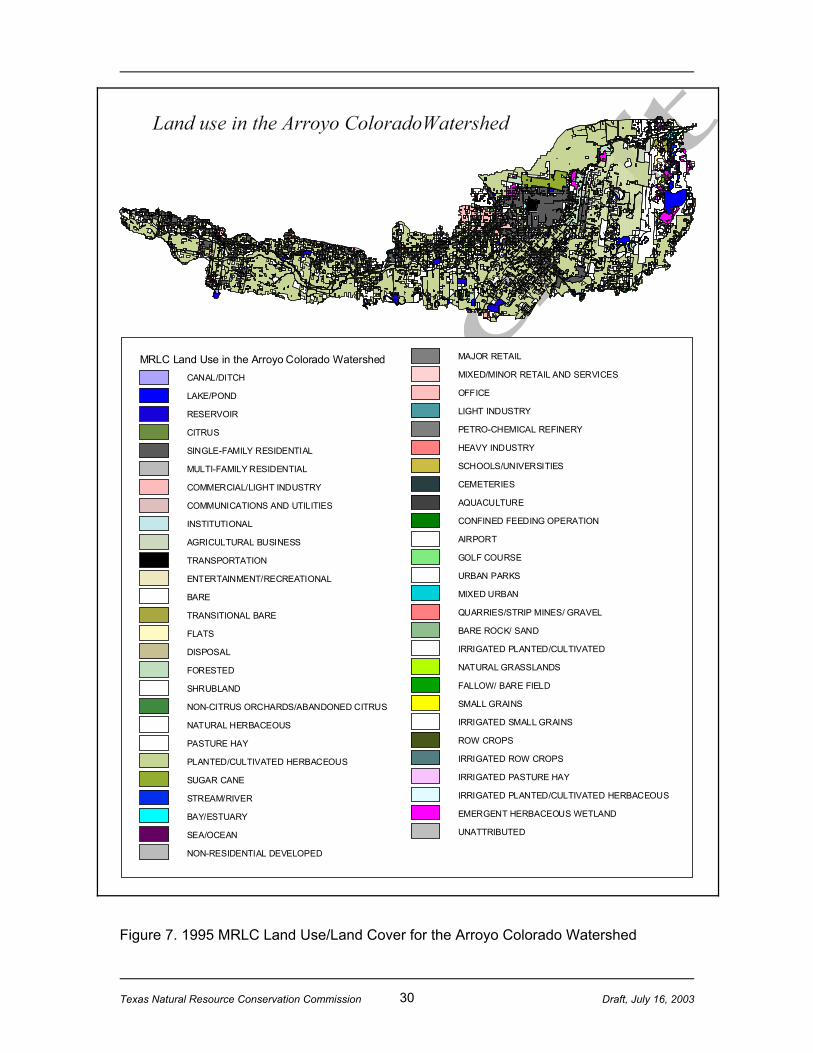
30Texas Natural Resource Conservation Commission Draft, July 16, 2003
MRLC Land Use in the Arroyo Colorado WatershedCANAL/DITCH
LAKE/POND
RESERVOIR
CITRUS
SINGLE-FAMILY RESIDENTIAL
MULTI-FAMILY RESIDENTIAL
COMMERCIAL/LIGHT INDUSTRY
COMMUNICATIONS AND UTILITIES
INSTITUTIONAL
AGRICULTURAL BUSINESS
TRANSPORTATION
ENTERTAINMENT/RECREATIONAL
BARE
TRANSITIONAL BARE
FLATS
DISPOSAL
FORESTED
SHRUBLAND
NON-CITRUS ORCHARDS/ABANDONED CITRUS
NATURAL HERBACEOUS
PASTURE HAY
PLANTED/CULTIVATED HERBACEOUS
SUGAR CANE
STREAM/RIVER
BAY/ESTUARY
SEA/OCEAN
NON-RESIDENTIAL DEVELOPED
MAJOR RETAIL
MIXED/MINOR RETAIL AND SERVICES
OFFICE
LIGHT INDUSTRY
PETRO-CHEMICAL REFINERY
HEAVY INDUSTRY
SCHOOLS/UNIVERSITIES
CEMETERIES
AQUACULTURE
CONFINED FEEDING OPERATION
AIRPORT
GOLF COURSE
URBAN PARKS
MIXED URBAN
QUARRIES/STRIP MINES/ GRAVEL
BARE ROCK/ SAND
IRRIGATED PLANTED/CULTIVATED
NATURAL GRASSLANDS
FALLOW/ BARE FIELD
SMALL GRAINS
IRRIGATED SMALL GRAINS
ROW CROPS
IRRIGATED ROW CROPS
IRRIGATED PASTURE HAY
IRRIGATED PLANTED/CULTIVATED HERBACEOUS
EMERGENT HERBACEOUS WETLAND
UNATTRIBUTED
Figure 7. 1995 MRLC Land Use/Land Cover for the Arroyo Colorado Watershed

31Texas Natural Resource Conservation Commission Draft, July 16, 2003
Calibration of the Arroyo Colorado HSPF watershed model was accomplished atdiffering geographic scales. Edge-of-field loadings of constituents for the differentPERLND and IMPLND land units modeled in the TMDL analysis (including naturalland) were determined using data from published and unpublished studies of flow andconcentrations of constituents observed during run-off and irrigation events in similarland use types (USGS, 2002). Constituent buildup and wash-off factors for the differentHSPF land units were adjusted to yield constituent edge-of-field concentrations similar tothose observed in the published and unpublished data and using best professionaljudgement. Parameterization and calibration of the Arroyo Colorado HSPF watershedmodel at the sub-basin and reach scale was accomplished using the HSPF Parm libraryand software, observed flow and in-stream water quality data, and best professionaljudgement.
Domestic Wastewater Systems and ColoniasFor the purpose of the TMDL analysis described herein, small domestic wastewatersystems are defined as low capacity (< 0.15 MGD) wastewater systems with treatmentmechanisms ranging from basic underground settling tanks with drain fields (i.e., on-siteseptic systems) to low-flow systems with more advanced primary treatment includingaeration basins, clarifiers and aerobic digesters. In addition to the relatively low volumeof wastewater produced, domestic wastewater systems are also typically characterized byindirect (or no) discharges to surface water bodies.
Small domestic wastewater systems in the Arroyo Colorado watershed were categorized,inventoried, assessed and modeled in accordance with the type of treatment and dis-charge mechanism associated with each system. Higher capacity systems, such as the(permitted) domestic wastewater systems included in table 3, were modeled according tothe permitted flow and concentration of nutrients and BOD expected to be contained inthe treated effluents. The indirect discharge mechanisms associated with these systemswere also modeled according to permit specifications (i.e., size of subsurface drain orpressure field, acreage irrigated, etc). Smaller domestic systems, such as individual onsiteseptic systems, were modeled using population figures and GIS coverages provided bythe local council of governments for areas served by these systems. The population(using septic systems) and GIS data was used along with assumptions regarding theaverage volume of wastewater produced per capita (according to the Texas WaterDevelopment Board), average size of most septic drain fields, and average concentrationsof constituents found in wastewater from septic systems, to model loadings to the ArroyoColorado.
The loading of nutrients and BOD into the Arroyo Colorado from colonias was modeledin a similar fashion to that of on-sight septic systems. Colonia population figures and GIScoverages obtained from the Texas Water Development board were used along withassumptions regarding per capita wastewater production, disposal areas, and effluentquality to model daily loading of nutrients and BOD to the Arroyo Colorado. However,wastewater application for colonias was assumed to be a surface process and the concen-tration of constituents was assumed to be that of essentially raw, untreated wastewater.
32Texas Natural Resource Conservation Commission Draft, July 16, 2003
Linkage Between Sources and Receiving WatersThe relationship between the sources of the constituents described above and DOconcentrations in the Arroyo Colorado was modeled using the Hydrologic SimulationProgram - Fortran (HSPF) to simulate watershed loadings and in-stream flow and waterquality in the tidal and above tidal segments of the Arroyo Colorado. Additionally, waterquality in the mixed surface layer of the tidal segment of the Arroyo Colorado (Segment2201) was simulated, in one dimension, for several critical steady-state flow conditionsusing QUAL2E to obtain a more detailed depiction of simulated nutrient and DOconcentrations in Segment 2201. Watershed loadings simulated using the HSPF modelwhere used to estimate loading boundary conditions each of the steady-state QUAL2Emodel simulations of Segment 2201.
Arroyo Colorado Watershed ModelThe HSPF simulation program (EPA 1997) is a continuous-simulation model that uses aconceptual framework to represent infiltration, evaporation, interception storage, surfacerunoff, interflow, and baseflow on pervious land segments and retention storage andsurface runoff on impervious land segments. Each user-defined land segment representsits own unique hydrologic response system based on land cover, soil type, watershedslope, or other basin characteristics. Runoff and constituent loadings from the variousland segments and user-defined point sources are moved through a system of reachesusing storage routing. Simulation of flow and water quality at the reach scale is accom-plished through an in-stream flow and water quality simulation module contained in theprogram.
The Arroyo Colorado (HSPF) watershed model dynamically simulates point andnonpoint source flow and constituent contributions to Segments 2201 and 2202 from the14 sub-basins that comprise the Arroyo Colorado watershed (see Figure 4). Watersheddelineation for the Arroyo Colorado was performed using automated watershed delinea-tion methods which define geographic drainage area through computer processing ofdigital elevation models (DEMs) edited to conform with updated hydrographic data (seeUSGS 2000). Sub-delineation of the total drainage area in the Arroyo Colorado water-shed into the14 sub-basins defined in the study was accomplished by selecting pourpoints in the main stem of the stream chosen to coincide with historical flow and/or waterquality monitoring stations. The pour points mark the beginning and end of adjacent sub-basins.
Time series of rainfall, irrigation, evaporation, air temperature, dewpoint, wind speed,cloud cover, solar radiation, streamflow, and concentrations for selected properties andconstituents from 1989-1999 were used in the simulation. Twenty six different perviousland segments and three impervious land segments were defined based on land cover andsoil groupings in the Arroyo Colorado watershed. In all, 18 process-related parameterswere defined for each land segment for flow, 31 process-related parameters were definedfor each land segment for water quality, and 75 process-related parameters for eachstream reach for water quality (USGS 2002).
33Texas Natural Resource Conservation Commission Draft, July 16, 2003
The Arroyo Colorado watershed model was calibrated and tested for flow and waterquality with data collected between 1989 and 1999 from three flow and five water qualitystations. Flow calibration was accomplished using data from 1989-1995 at two stations.Simulated flow was tested spatially with data from 1989-1995 at one station and testedtemporally from 1996-1999 at two stations using the Expert System for Calibration ofHSPF (HSPEXP). Water quality calibration was accomplished for seven properties andconstituents from 1989-1995 using the two historical stations with the most data avail-able. Water quality calibration was tested spatially at one station from 1989-1995 andtemporally at three stations from 1996-1999. The simulated flow and water qualityconstituent concentrations generally fit the shape of the data available for the calibrationand testing periods chosen for the study.
Figures 8-11 show examples of calibration plots generated as part of the Arroyo Colo-rado HSPF watershed model development effort. Additional details regarding thedevelopment, calibration, and testing of the Arroyo Colorado HSPF watershed model,including the full set of input parameters and calibration and verification plots, can befound in USGS Water Resources Investigation Report 02-4110 (USGS 2002).
A comparison, by source, of simulated loadings to Segment 2201 reveals that agriculturalnonpoint sources were the principle source of sediment, nitrate nitrogen and ammonianitrogen in the Arroyo Colorado watershed for the period 1989-1999. The distribution oforthophosphate and BOD loadings into Segment 2201 for the simulation period was moreevenly divided between urban and agricultural sources and also between point andnonpoint sources (Figure 12).
Although widely used as a tool to simulate flow and water quality in many stream andriver systems, HSPF is not particularly well suited for use in tidal streams due to aninherent inability of the HSPF software to simulate complex hydrodynamic regimes suchas those found in tidal environments. For this reason, intensive calibration and testing ofthe Arroyo Colorado (HSPF) watershed model focused primarily on reaches andcalibration points located in the non-tidal segment of the Arroyo (Segment 2202).
Because the DO endpoint defined for this TMDL effort is based primarily on a non-compliance probability (10th percentile) for DO concentrations in the mixed surface layerof tidal segment of the Arroyo Colorado, there is a strong need for a continuous (dailytime step), multi-year time series of simulated DO values in Segment 2201. In order toobtain this multi-year dynamic simulation of water quality in Segment 2201, the ArroyoColorado (HSPF) watershed model was extended to include Segment 2201 using many ofthe assumptions and justifications used to develop the steady-state (QUAL2E) model oftidal segment of the Arroyo Colorado described below. Both models (the watershedHSPF model and the steady-state QUAL2E model) simulate only the mixed surface layerof the tidal segment. Flow in this uppermost layer of Segment 2201 is assumed to beunidirectional at all times and total water column depth in the simulations is assumed tobe equal to the depth of the mixed surface layer. A detailed discussion of the assumptionsand justifications associated with the modeling strategy used to simulate water quality in

34Texas Natural Resource Conservation Commission Draft, July 16, 2003
Figure 8. Measured and simulated stream flow in the Arroyo Colorado at Harlingen,1989-95.
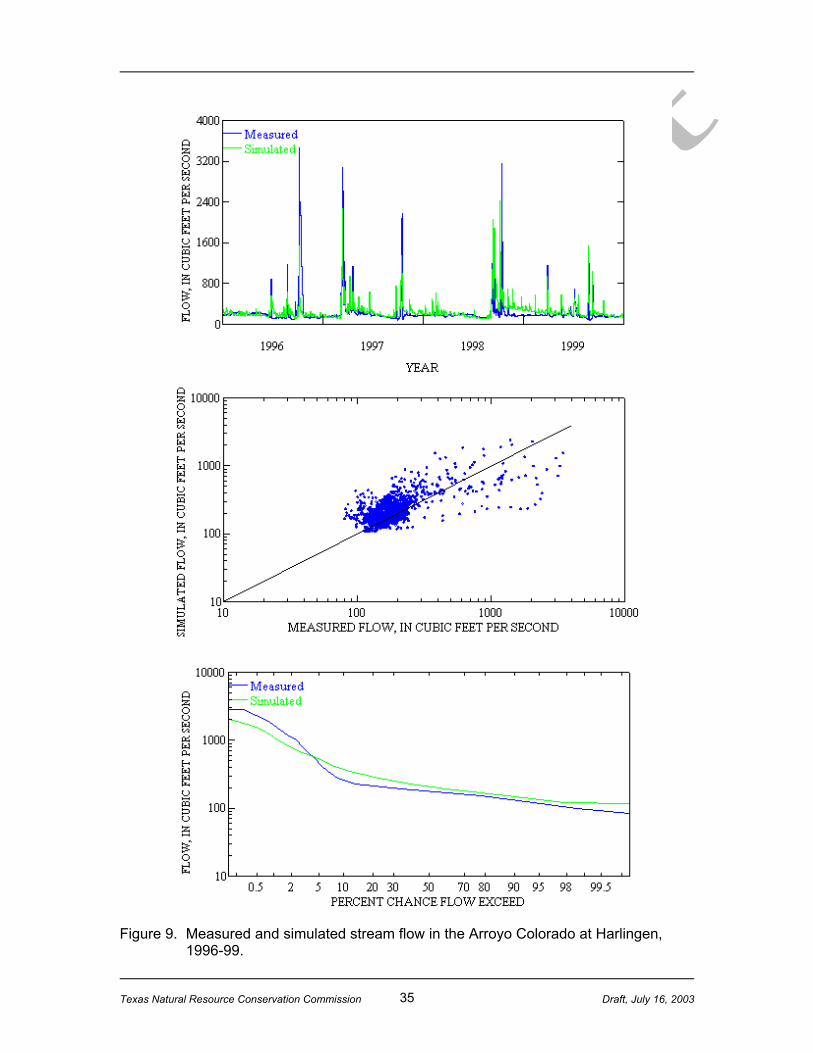
35Texas Natural Resource Conservation Commission Draft, July 16, 2003
Figure 9. Measured and simulated stream flow in the Arroyo Colorado at Harlingen,1996-99.

36Texas Natural Resource Conservation Commission Draft, July 16, 2003
Figure 10. Measured and simulated dissolved oxygen in the Arroyo Colorado at: A.Harlingen, B. Lower boundary of Segment 2202, C. Segment 2201 at RioHondo, 1989-95

37Texas Natural Resource Conservation Commission Draft, July 16, 2003
Figure 11. Measured and simulated dissolved oxygen in the Arroyo Colorado at: A.Harlingen, B. Lower boundary of Segment 2202, C. Segment 2201 at RioHondo,1996-99

38Texas Natural Resource Conservation Commission Draft, July 16, 2003
1% 10%
87%
2%
Urban Point Sources
Urban Nonpoint Sources
Agricultural Nonpoint Sources
Natural Nonpoint Sources
23%
30%
41%
6%
20%
11%
68%
1%
22%
13%
64%
1%
40%
10%
49%
1%
Suspended Sediment
Biochemical Oxygen Demand Nitrate Nitrogen
Ammonia Nitrogen Orthophosphate
Figure 12. Percentage of loadings of selected constituents into the upper portion ofSegment 2201 by source. Charts represent total loadings of eachconstituent between1989 and 1999 as estimated using Arroyo ColoradoHSPF watershed model simulations.

39Texas Natural Resource Conservation Commission Draft, July 16, 2003
the tidal segment of the Arroyo Colorado is included in the next section of this documenttitled “Steady-state Water Quality Model.”
Using the time series of simulated daily average DO concentrations generated by theextension of Arroyo Colorado (HSPF) watershed model into Segment 2201, a frequencydistribution can be established for the average DO values in each of the tidal reaches.Figure 13 shows the frequency distributions of simulated DO concentrations in the mixedsurface layer in the uppermost reach of Segment 2201 (Rio Hondo). In general, there isgood agreement between the non-compliance probability estimated from the frequencydistribution of simulated DO concentrations (34.75%) and the percent non-complianceobserved (36%) from the assessment data used to generate the State of Texas 1999303(d) List.
It is important to note, however, that under the current (2002) 305(b) assessmentmethodology for the State of Texas, only the probability distribution shown in chart “B”(Figure 13) would apply as a measure of use attainment for the segment, since only in-stream (24-hour) DO measurements collected in the months of March through Octoberare used for assessment purposes.
Steady-state Water Quality Model The Arroyo Colorado (HSPF) watershed model is an adequate tool for dynamic waterquality simulation at the reach scale. The simulated DO concentrations generated in theHSPF model represent vertically and longitudinally averaged DO concentrations for eachof the reaches simulated. Since individual land segments in each of the sub-basinsmodeled are associated with corresponding reaches, there is a practical limit to thenumber of reaches that can be defined in the model. This limitation forces reach lengthsto be on the order of kilometers rather than meters for a watershed the size of the ArroyoColorado’s.
In order to characterize dissolved oxygen dynamics in greater detail, a separate modelingstrategy, involving higher reach discretization, was developed to simulate water qualityin the tidal segment of the Arroyo Colorado. The stream water quality simulationprogram QUAL2E was selected to simulate detailed water quality conditions in Segment2201.
The QUAL2E water quality simulation program allows simulation of up to 15 waterquality constituents in branching stream systems using an implicit backward finite-difference solution to the one-dimensional advective-dispersive equation. The stream isconceptually represented as a system of reaches of variable length, each of which issubdivided into computational elements that have the same length in all reaches. A massand heat balance is applied for every element. Mass may be gained or lost from elementsby transport processes and external sources and sinks. Although limited to the simulationof time periods during which stream flows, inflows, and loads are essentially constant,the model can also be run in a quasi-dynamic mode in which the effects of diurnalvariations in meteorological data on water quality (primarily DO and temperature) can beexamined.

40Texas Natural Resource Conservation Commission Draft, July 16, 2003
0
2
4
6
8
10
12
1
Simulated DO in Segment 2201 at Rio Hondo 1989-1999
Probability (% )
DO(m g/l)
10 20 30 40 50 60 70 80 9065.25
0
2
4
6
8
10
10 20 30 40 50 60 70 80 90
DO(m g/l)
Probability (% )
Simulated DO in Segment 2201 at Rio Hondo 1989-1999
43.55
A
B
Figure 13. Probability distributions of simulated DO concentrations under current(base) conditions and probabilities of meeting the DO criteria for: A.Segment 2201 at Rio Hondo using entire simulated daily average timeseries, B. Segment 2201 at Rio Hondo using simulated daily averagevalues for the periods between March 15 through October 15 of every yearsimulated.

41Texas Natural Resource Conservation Commission Draft, July 16, 2003
The tidal segment of the Arroyo Colorado was discretized into 86 computationalelements in 27 reaches for use in the Arroyo Colorado QUAL2E water quality model.Additionally, the 27 tidal QUAL2E reaches were grouped into three separate zoneswhich are generally of the same length and geographic location as the (large) reachesused in the discretization of the Arroyo Colorado for the HSPF watershed model (Figure14). Input to the QUAL2E model was derived from the Arroyo Colorado HSPF water-shed model described in the previous section.
The principal assumptions used to develop the modeling strategy behind the use ofQUAL2E to simulate water quality in the tidal segment of the Arroyo Colorado are thefollowing:
1. Simulation of water quality at steady-state flow conditions is an adequatemethod to characterize and assess the cause-and-effect relationships that existbetween loadings of constituents of concern and the DO impairment observedin the tidal segment of the Arroyo Colorado.
2. Using empirical relationships derived from observed data and an assumption ofessentially unidirectional flow, the mixed surface layer of Segment 2201 canbe modeled as a separate and distinct hydrologic unit which can be linked tothe underlying water column through a mathematical term (DO flux) whichdescribes the attenuation of DO in the mixed surface layer as a result of thephysical interaction with the underlying layer(s).
The justifications for use of the QUAL2E program to simulate water quality in the tidalsegment of the Arroyo Colorado are based largely on a detailed analysis of the historicalflow, water quality, and biological data available for Segment 2201 (Flowers and Hauck2001).
The data analysis focused on factors contributing to low dissolved oxygen and reportedfish kills in Segment 2201 (best available indicator of DO problems in the segment), withparticular emphasis on the upper 7.1 miles. The results of the analysis revealedlongitudinal and vertical gradients in salinity characteristic of tidal systems.
Although seasonal in nature, a steep density gradient was generally apparent in the watercolumn at two to three meters from the surface. Dissolved oxygen profiles exhibited a“classical” pattern in response to density stratification, with slight atmospheric reaerationaffecting the surface layer and sediment oxygen demand impacting the lower layerresulting in higher DO in the near-surface waters and very low DO in bottom waters. This “classic” DO pattern was particularly evident in the summer months due to theeffects of increased temperature and algal production (Flowers and Hauck, 2001).
Dissolved oxygen levels below the criteria also appear to coincide with periods of low,steady-state flow.

42Texas Natural Resource Conservation Commission Draft, July 16, 2003
N
0 2 4 6 Kilometers
Ñ
ÑÑ
21
26
15
Zone 3
Zone 2
Zone
1
27
2524
23
22
21
2019
18
17
16
14
13
1211
98
7
65
4
3
10
HSPF sub-basins
Streams
Segment 2201
Reach
Zones
Point sourcesÑ
Figure 14. Stream segmentation and discretization used in the Arroyo ColoradoQUAL2E water quality model.
Investigation of the occurrence of fish kills in Segment 2201 indicated that kills weremuch more prevalent during the summer months from May through September (Figure15). Most fish kills were associated with steady-state, low flow conditions and the causewas frequently attributed to low DO (Flowers and Hauck, 2001).
Sufficient density of data was available in each of the three tidal zones shown in Figure14 to develop statistically significant relationships predicting the depth of the mixedsurface layer as a function of vertical mean conductivity. These statistical relationshipsform the basis for the estimates of depth of the surface layer used for each of the 3 tidalzones based on observed conductivity data.
Flow and salinity measurements conducted by the Texas Water Development Board(TWDB) in 1991 and 1994 in Segment 2201 also indicate the prevalence of a highlystratified body of water. A 1994 report summarizing the findings of the TWDB studies inthe Arroyo Colorado observed that, at times, the lower layer of the water column isdriven slowly upstream (probably in response to tidal influences and/or density differ-ences) while the upper layer moves downstream (TWDB 1994).
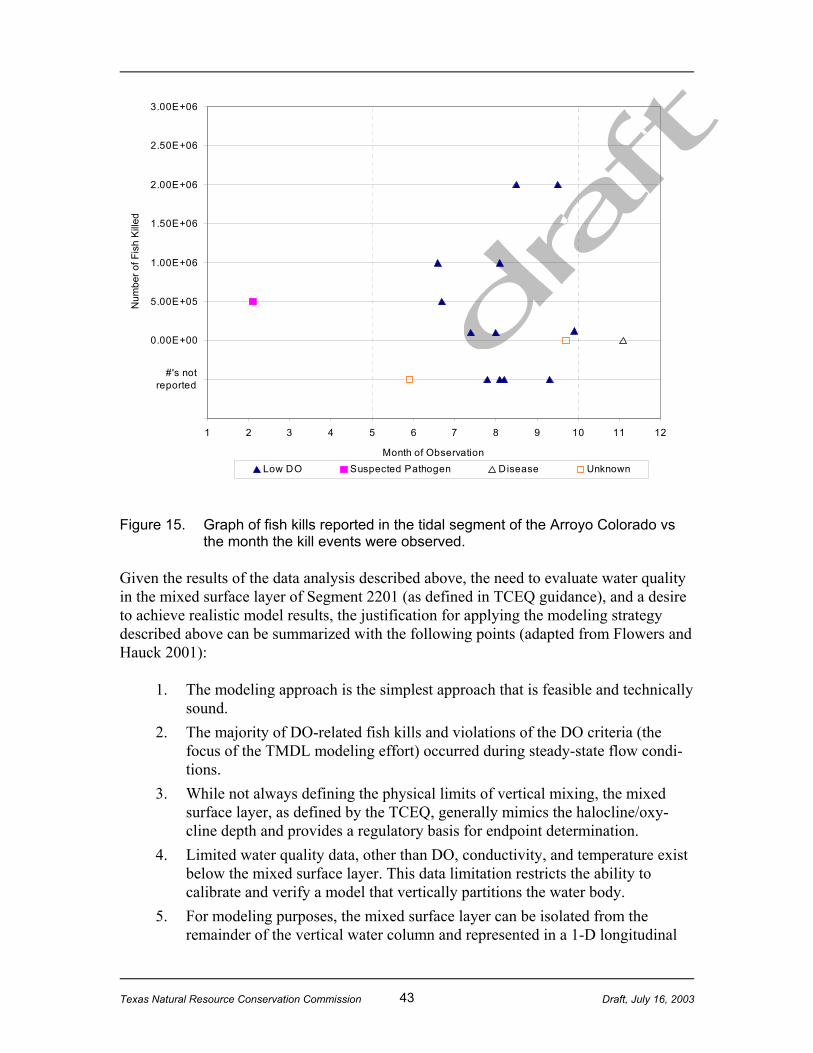
43Texas Natural Resource Conservation Commission Draft, July 16, 2003
-1.00E+06
-5.00E+05
0.00E+00
5.00E+05
1.00E+06
1.50E+06
2.00E+06
2.50E+06
3.00E+06
1 2 3 4 5 6 7 8 9 10 11 12
Month of Observation
Num
ber o
f Fis
h K
illed
Low DO Suspected Pathogen Disease Unknown
#'s not reported
Figure 15. Graph of fish kills reported in the tidal segment of the Arroyo Colorado vsthe month the kill events were observed.
Given the results of the data analysis described above, the need to evaluate water qualityin the mixed surface layer of Segment 2201 (as defined in TCEQ guidance), and a desireto achieve realistic model results, the justification for applying the modeling strategydescribed above can be summarized with the following points (adapted from Flowers andHauck 2001):
1. The modeling approach is the simplest approach that is feasible and technicallysound.
2. The majority of DO-related fish kills and violations of the DO criteria (thefocus of the TMDL modeling effort) occurred during steady-state flow condi-tions.
3. While not always defining the physical limits of vertical mixing, the mixedsurface layer, as defined by the TCEQ, generally mimics the halocline/oxy-cline depth and provides a regulatory basis for endpoint determination.
4. Limited water quality data, other than DO, conductivity, and temperature existbelow the mixed surface layer. This data limitation restricts the ability tocalibrate and verify a model that vertically partitions the water body.
5. For modeling purposes, the mixed surface layer can be isolated from theremainder of the vertical water column and represented in a 1-D longitudinal

44Texas Natural Resource Conservation Commission Draft, July 16, 2003
modeling approach. Restricting the model to the mixed surface layer avoidsviolating a major assumption of the 1-D longitudinal approach - that of com-plete vertical and lateral mixing. Consideration of the entire water columnwould violate this assumption due to extreme variations in the crucial waterquality variable, DO, in the vertical axis. The preponderance of observationaldata indicate very low DO concentrations in the waters below the mixedsurface layer and frequent supersaturating concentrations in near surfacemeasurements. Vertically-averaging over the entire water column cannotresolve this DO signature. Complete vertical mixing would also diminish themagnitude of the diel DO fluctuations predicted by the model and would limitthe model’s ability to assess violations of the minimum DO criterion. Sincediel DO fluctuations were determined to be an important factor in the impair-ment, modeling only the mixed surface layer addresses this aspect of thesimulation more adequately.
6. Independent of the availability of vertical profile data needed to calibrate amodel with vertical and longitudinal resolution, the ability of existing models,such as WASP6, EFDC and CE-QUAL-W2, to accurately predict the depth ofthe mixed surface layer must be questioned. Errors in the vertical and horizon-tal salinity gradients predicted by any model could greatly compromise theability of the model to simulate DO concentrations in the mixed surface layer.
7. Sufficient observational data exists for the simulation period (1989-1999) tocharacterize the salinity and the mixed surface layer depth for each of the threetidal zones. Since salinity and depth of the mixed surface layer can be definedbased on observed data, it is not necessary to model these variables; therefore,a one-dimensional modeling approach, restricted to the mixed surface layer,may be used to model DO in Segment 2201.
Under typical freshwater inflow conditions to Segment 2201, the hydraulic detentiontime is approximately 15 days. Twice the hydraulic detention time (30 days) wasassumed to be a reasonable period for the tidal segment to reach steady-state conditions(more accurately defined as dynamic equilibrium). Therefore, inflow and constituentloadings over a 30-day period were used to define the input for the QUAL2E simulations.
Hourly predictions of flow and constituent loads from the (HSPF) watershed simulationswere averaged over 30-day periods (i.e., the day simulated plus the preceding 29 days).Thirty-day mean flows and flow weighted mean concentrations were used as input to theQUAL2E model.
Having established, through the analysis of observational data, that violations of the DOcriteria occur mainly in the late spring and summer months (May-October), and given thefact that most intensive data collection efforts yielding detailed spatial and temporal datasets were also performed during summer months, the following time periods were chosenfor calibration and verification:
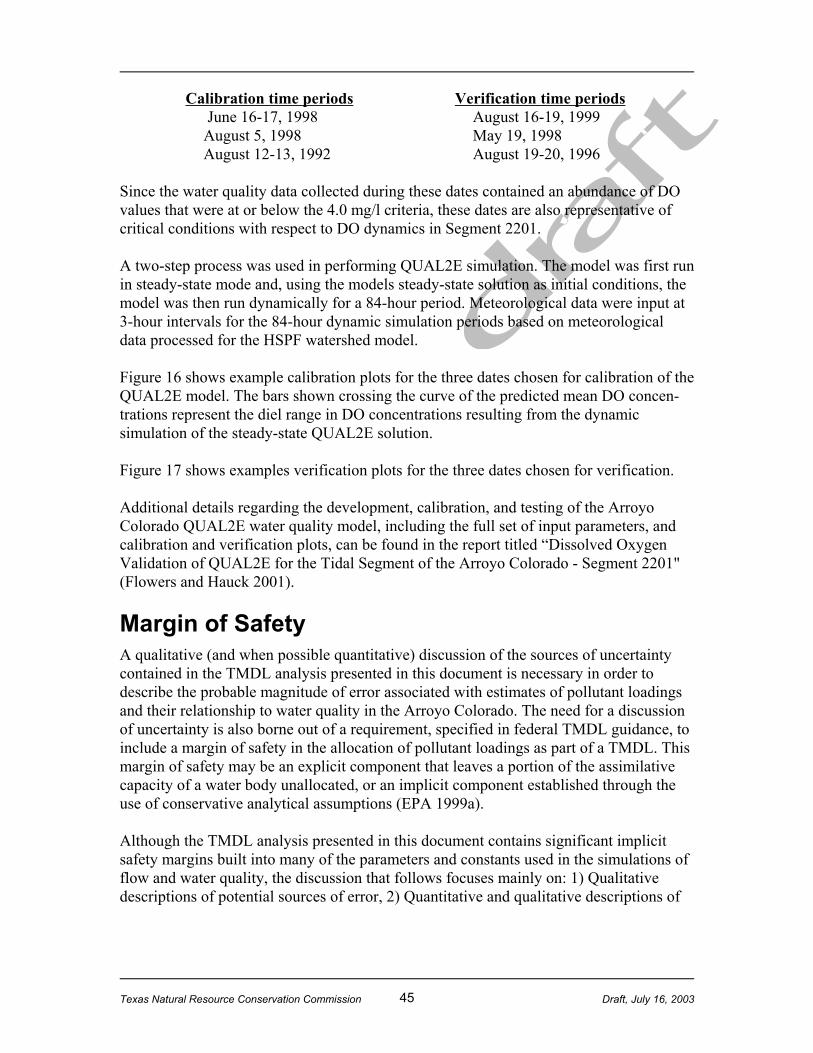
45Texas Natural Resource Conservation Commission Draft, July 16, 2003
Calibration time periods Verification time periods June 16-17, 1998 August 16-19, 1999August 5, 1998 May 19, 1998August 12-13, 1992 August 19-20, 1996
Since the water quality data collected during these dates contained an abundance of DOvalues that were at or below the 4.0 mg/l criteria, these dates are also representative ofcritical conditions with respect to DO dynamics in Segment 2201.
A two-step process was used in performing QUAL2E simulation. The model was first runin steady-state mode and, using the models steady-state solution as initial conditions, themodel was then run dynamically for a 84-hour period. Meteorological data were input at3-hour intervals for the 84-hour dynamic simulation periods based on meteorologicaldata processed for the HSPF watershed model.
Figure 16 shows example calibration plots for the three dates chosen for calibration of theQUAL2E model. The bars shown crossing the curve of the predicted mean DO concen-trations represent the diel range in DO concentrations resulting from the dynamicsimulation of the steady-state QUAL2E solution.
Figure 17 shows examples verification plots for the three dates chosen for verification.
Additional details regarding the development, calibration, and testing of the ArroyoColorado QUAL2E water quality model, including the full set of input parameters, andcalibration and verification plots, can be found in the report titled “Dissolved OxygenValidation of QUAL2E for the Tidal Segment of the Arroyo Colorado - Segment 2201"(Flowers and Hauck 2001).
Margin of SafetyA qualitative (and when possible quantitative) discussion of the sources of uncertaintycontained in the TMDL analysis presented in this document is necessary in order todescribe the probable magnitude of error associated with estimates of pollutant loadingsand their relationship to water quality in the Arroyo Colorado. The need for a discussionof uncertainty is also borne out of a requirement, specified in federal TMDL guidance, toinclude a margin of safety in the allocation of pollutant loadings as part of a TMDL. Thismargin of safety may be an explicit component that leaves a portion of the assimilativecapacity of a water body unallocated, or an implicit component established through theuse of conservative analytical assumptions (EPA 1999a).
Although the TMDL analysis presented in this document contains significant implicitsafety margins built into many of the parameters and constants used in the simulations offlow and water quality, the discussion that follows focuses mainly on: 1) Qualitativedescriptions of potential sources of error, 2) Quantitative and qualitative descriptions of
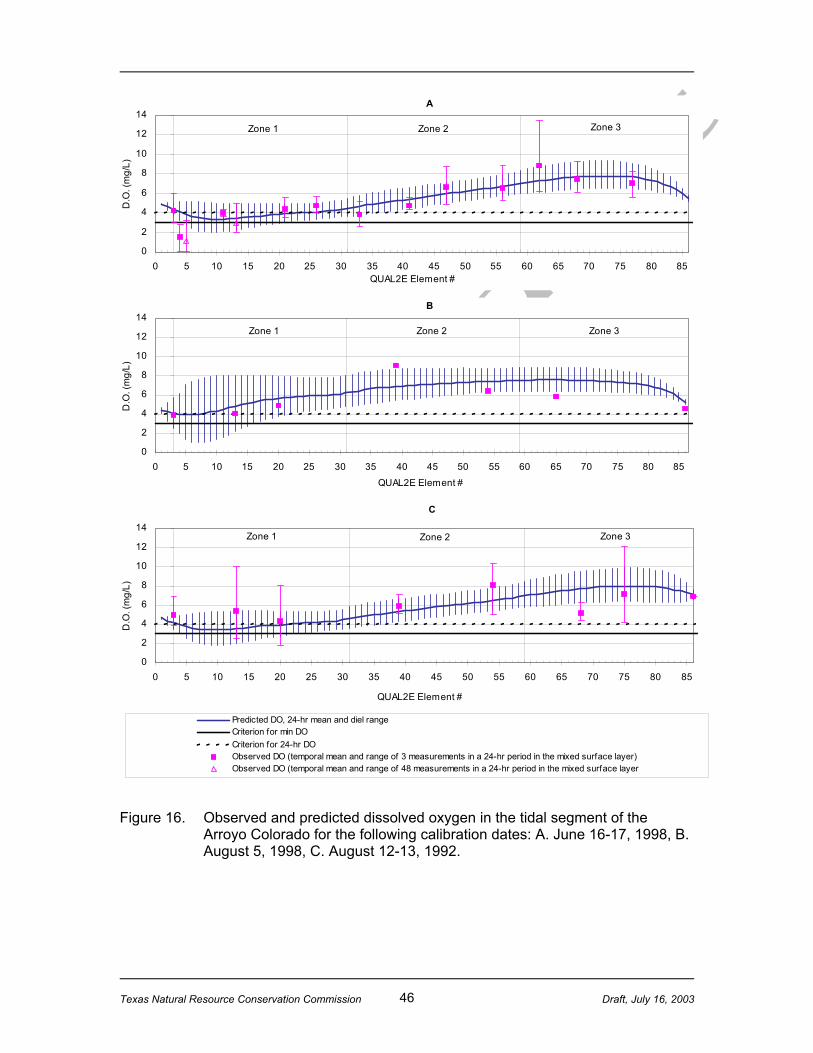
46Texas Natural Resource Conservation Commission Draft, July 16, 2003
B
0
2
4
6
8
10
12
14
0 5 10 15 20 25 30 35 40 45 50 55 60 65 70 75 80 85
QUAL2E Element #
D.O
. (m
g/L)
Zone 1 Zone 2 Zone 3
C
0
2
4
6
8
10
12
14
0 5 10 15 20 25 30 35 40 45 50 55 60 65 70 75 80 85
QUAL2E Element #
D.O
. (m
g/L)
Zone 1 Zone 2 Zone 3
A
0
2
4
6
8
10
12
14
0 5 10 15 20 25 30 35 40 45 50 55 60 65 70 75 80 85QUAL2E Element #
D.O
. (m
g/L)
Zone 1 Zone 2 Zone 3
Predicted DO Concentration in Arroyo Colorado (Segment 2201)No Load Reduction, Index Period #1, 6/16-17/1998
02468101214
0 5 10 15 20 25 30 35 40 45 50 55 60 65 70 75 80 85
QUAL2E Element #
D.O
. (m
g/ L)
Predicted DO, 24-hr mean and diel rangeCriterion for min DOCriterion for 24-hr DOObserved DO (temporal mean and range of 3 measurements in a 24-hr period in the mixed surface layer)Observed DO (temporal mean and range of 48 measurements in a 24-hr period in the mixed surface layer
Figure 16. Observed and predicted dissolved oxygen in the tidal segment of theArroyo Colorado for the following calibration dates: A. June 16-17, 1998, B.August 5, 1998, C. August 12-13, 1992.

47Texas Natural Resource Conservation Commission Draft, July 16, 2003
02468101214
0 5 10 15 20 25 30 35 40 45 50 55 60 65 70 75 80 85
Predicted DO, 24-hr mean and diel rangeCriterion for min DOCriterion for 24-hr DOObserved DO (temporal mean and range of 3 measurements in a 24-hr period in the mixed surface layer)Observed DO (vertical average of instantaneous measurements at several depths in the mixed surface layer)Observed DO (temporal mean and range of 48 measurements in a 24-hr period in the mixed surface layer)
A
0
2
4
6
8
10
12
14
0 5 10 15 20 25 30 35 40 45 50 55 60 65 70 75 80 85
QUAL2E Element #
D.O
. (m
g/L)
Zone 3Zone 1 Zone 2
B
0
2
4
6
8
10
12
14
0 5 10 15 20 25 30 35 40 45 50 55 60 65 70 75 80 85
QUAL2E Element #
D.O
. (m
g/L)
Zone 1 Zone 2 Zone 3
C
0
2
4
6
8
10
12
14
0 5 10 15 20 25 30 35 40 45 50 55 60 65 70 75 80 85QUAL2E Element #
D.O
. (m
g/L)
Zone 1 Zone 2 Zone 3
Figure 17. Observed and predicted dissolved oxygen in the tidal segment of theArroyo Colorado for the following verification dates: A. August 16-19, 1999,B. May 19, 1998, C. August 19-20, 1996.

48Texas Natural Resource Conservation Commission Draft, July 16, 2003
error in simulated values as compared to measured data (i.e., HSPEXP flow erroranalysis), 3) Quantitative and semi-quantitative descriptions of error associated withvariation in input parameters (QUAL2E-UNCAS first-order error analysis), and 4) Adiscussion of the overall effect of these factors on total uncertainty associated with thestudy.
Sources of UncertaintyA full accounting of the potential sources of error which contribute to the total measureof uncertainty in TMDL analysis is beyond the scope of this document. Sources of errorcan be found in literally every aspect of a TMDL analysis. The following are a fewexamples of the sources of error in most TMDL analyses:
C Measurement error in observational dataC Error associated with the inability of models to accurately represent complex
natural processes mathematically (model equations and parameters) C Error in parameter estimation (e.g., interception storage, roughness, reaeration,
etc.). C Computational limitations (e.g., time steps, number of elements, etc.)
Sources of error are not specific to any particular TMDL analysis and become reduced intime through refinement of methods and general advances in technology and research;most TMDL analyses simply compensate for the uncertainty introduced by sources oferror by using conservative assumptions and model parameters.
In order to gain further understanding regarding the magnitude of uncertainty associatedwith a particular study, it is helpful to discuss the potential sources of error that arespecific to this study. The following is a brief description of the potential sources of errorspecific to the Arroyo Colorado (DO) TMDL analysis:
1. Irrigation return volumes were estimated based on a combination of informa-tion which includes data on irrigation water use (i.e., monthly surface waterdiversions by local irrigation districts, geographic area of each irrigationdistrict within the Arroyo Colorado watershed sub-basins, typical irrigationneeds by crop type, and local irrigation practices), and flow analysis (in-streamwater mass balance calculations of irrigation return inflows based on reconcili-ation of non-irrigation inflows to the Arroyo, evapotranspiration, and gaged in-stream flow). Because irrigation return flows were not (and currently cannotaccurately) be measured directly, there is considerable uncertainty associatedwith the irrigation return flow volume used in the model. This is somewhatapparent in the results of the HSPF watershed model flow calibration/testing. Asemi-quantitative accounting of the uncertainty associated with flow simulationat the watershed scale is presented later in this section.
2. Surface accumulation rates, surface storage limits and interflow concentrationsof constituents of concern for the different permeable and impermeable landunits represented in the model were estimated based on the results of published

49Texas Natural Resource Conservation Commission Draft, July 16, 2003
studies (four of which were conducted in the Arroyo Colorado watershed) andalso on limited, unpublished data.
3. Although data for average daily flow, suspended solids, BOD, and (in somecases) ammonia nitrogen concentrations from wastewater treatment facilities inthe watershed was, for the most part, available through self-reported monthlyeffluent reports, data on nutrient parameters from these facilities was sparse ornon-existent. This fact combined with some substantial data gaps in the self-reported effluent data and the use of average daily values for each monthintroduce a significant measure of uncertainty into the loading estimates fromthese point sources.
4. Sources of essentially untreated wastewater (i.e., colonias) in the ArroyoColorado watershed are not well characterized. The potential error in loadingestimates of constituents from these sources may be significant.
5. Background concentrations of constituents in soils, runoff, and irrigation returnflows from sources such as atmospheric deposition and irrigation water are notwell known. There is a potential error in loading estimates of constituents fromthese sources.
6. The TMDL analysis, as a whole, would benefit greatly from additional knowl-edge regarding several key physical and chemical input variables (i.e hydraulicparameters, reaeration rates, BOD decay rates, SOD, etc.). First order erroranalysis (QUAL2E-UNCAS) shows that a more detailed knowledge of theoxygen flux rate (transfer of DO the from the mixed surface layer to the lowerhypoxic layer) and algal oxygen production and consumption rates in the upperportions of Segment 2201 would reduce the greatest source of uncertaintyassociated with the in-stream water quality modeling effort.
Comparisons of Simulated and Observed DataTo a large extent, the ability of a watershed model to accurately represent point andnonpoint source loadings into a receiving water depends on how well the model cansimulate the complex hydrologic mechanisms associated with moisture storage, surfaceflow, interflow, and baseflow.
A measure of the accuracy of the Arroyo Colorado watershed model is revealed by theresults of (HSPEXP) flow calibration and testing analysis. The Arroyo Colorado HSPFwatershed model was calibrated for flow with data from 1989-95 at two flow gagestations, tested spatially with data from the same period at one flow gage station, andtested temporally with data from 1996-99 two flow gage stations using the expert systemHSPEXP. The errors for total flow volume (storm flows plus base flows) ranged from -0.1 to 29.0 percent and the errors for total storm volume range from -15.6 to 8.4 percent.The errors for the total highest 10 percent flows range from -12.5 to 13.2 percent and theerrors for lowest 50 percent flows range from -5.0 to 27.6 percent. The higher errorsoccurred in the temporal verification period 1996-1999 (USGS 2002).
The calibrated parameter set used to model water quality at the reach scale in the ArroyoColorado HSPF watershed model adequately simulates water quality in the Arroyo

50Texas Natural Resource Conservation Commission Draft, July 16, 2003
Colorado for the selected properties and constituents. Although water temperatures at thehigh range appear to be under-simulated, water temperature in general fits the annualcycle of measured water temperature at the three calibration sites chosen in the watershedmodel. Scatter in measured dissolved oxygen concentrations above and below thesimulated values at upstream stations is within acceptable limits considering thatsimulated DO values match observed data near the zone of impairment. A lack of BODdata at the tidal boundary prevented testing of BOD simulation in the lower portions ofthe stream.
The QUAL2E water quality model of the Arroyo Colorado shows reasonable agreementbetween predicted and observed values for DO and chlorophyll a concentrations in themixed surface layer of Segment 2201. Predicted mean DO values compared well withobservations except for measurements taken just downstream of the Port of Harlingenturning basin in June, 1998 when the conductivity profile indicated a mixing depthextending to the bottom. Slight under-prediction of nitrate plus nitrite and over-predictionof ammonia nitrogen noted in the June 1998 critical period are probably the result ofrandom error in parameter estimation. The largest discrepancy between the valuespredicted by the QUAL2E water quality model of the Arroyo Colorado and observed dataoccurs in the simulation of BOD, which is significantly under-predicted in all three zonesof the tidal segment. It should be noted, however, that a general lack of historical BODdata prevented rigorous calibration of this parameter in both the watershed and waterquality models (due to the expense associated with the analysis, this parameter the TCEQand predecessor agencies dropped BOD from routine monitoring
Sensitivity and Error AnalysisTwo techniques were used to quantify the sensitivity and uncertainty associated withQUAL2E model predictions for the tidal segment of the Arroyo Colorado, the sensitivityanalysis and first order error analysis options. Since the TMDL analysis focuses on DO,the sensitivity and uncertainty analysis also focuses on DO as a response variable andfurther concentrates the interpretation on zone 1 near the region of maximum DO sag(element 6).
Inspection of the sensitivity analysis results for the six index periods simulated indicatethe results are generally similar for all periods. The June 1998 index period (May 19,1998 through June 17, 1998) was selected as a representative period for average headwa-ter concentrations. The sensitivity and uncertainty analysis were performed on the steady-state solution for the June 1998 index period.
Results of the sensitivity analysis indicate that predicted DO in the tidal segment ingeneral, and in the zone of impairment in particular, displayed the highest sensitivities toinput parameters defining algal photosynthesis and respiration. Four input parametersdefining algal oxygen production and consumption in QUAL2E are:
C algal maximum species growth rate (AGYGROMX), C oxygen production by algal growth (AGYOXYPR), C algal respiration rate (AGYRESPR), and
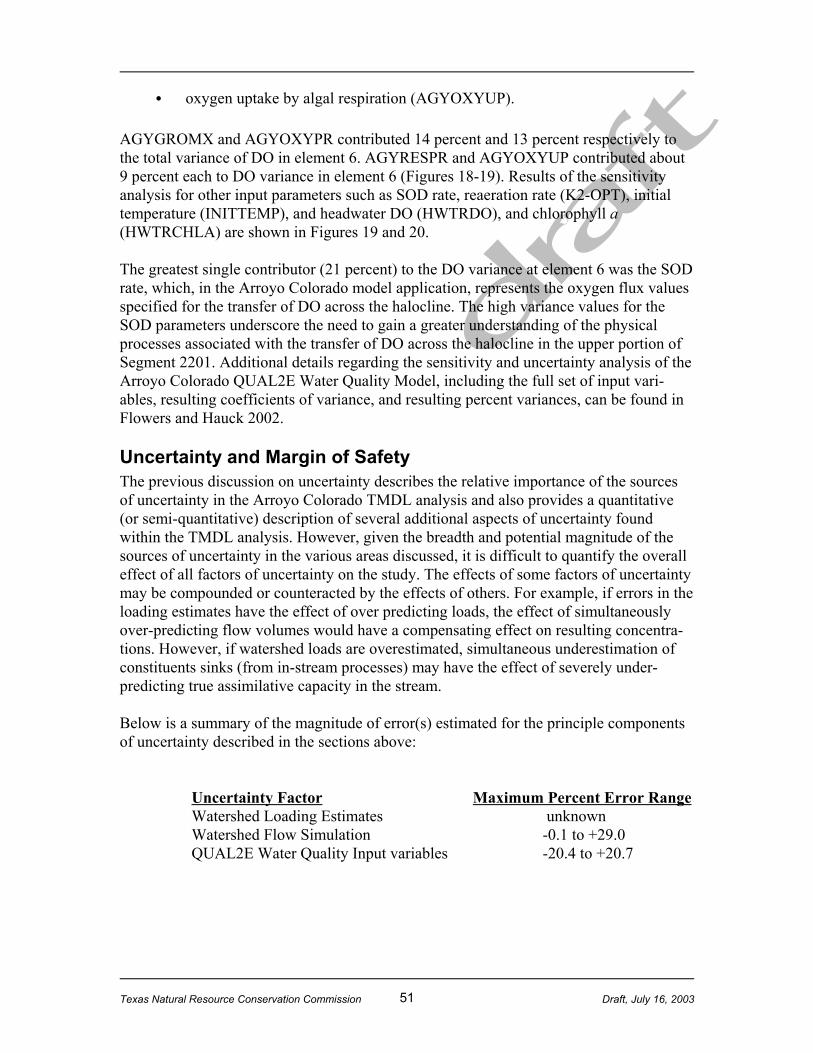
51Texas Natural Resource Conservation Commission Draft, July 16, 2003
C oxygen uptake by algal respiration (AGYOXYUP).
AGYGROMX and AGYOXYPR contributed 14 percent and 13 percent respectively tothe total variance of DO in element 6. AGYRESPR and AGYOXYUP contributed about9 percent each to DO variance in element 6 (Figures 18-19). Results of the sensitivityanalysis for other input parameters such as SOD rate, reaeration rate (K2-OPT), initialtemperature (INITTEMP), and headwater DO (HWTRDO), and chlorophyll a(HWTRCHLA) are shown in Figures 19 and 20.
The greatest single contributor (21 percent) to the DO variance at element 6 was the SODrate, which, in the Arroyo Colorado model application, represents the oxygen flux valuesspecified for the transfer of DO across the halocline. The high variance values for theSOD parameters underscore the need to gain a greater understanding of the physicalprocesses associated with the transfer of DO across the halocline in the upper portion ofSegment 2201. Additional details regarding the sensitivity and uncertainty analysis of theArroyo Colorado QUAL2E Water Quality Model, including the full set of input vari-ables, resulting coefficients of variance, and resulting percent variances, can be found inFlowers and Hauck 2002.
Uncertainty and Margin of Safety The previous discussion on uncertainty describes the relative importance of the sourcesof uncertainty in the Arroyo Colorado TMDL analysis and also provides a quantitative(or semi-quantitative) description of several additional aspects of uncertainty foundwithin the TMDL analysis. However, given the breadth and potential magnitude of thesources of uncertainty in the various areas discussed, it is difficult to quantify the overalleffect of all factors of uncertainty on the study. The effects of some factors of uncertaintymay be compounded or counteracted by the effects of others. For example, if errors in theloading estimates have the effect of over predicting loads, the effect of simultaneouslyover-predicting flow volumes would have a compensating effect on resulting concentra-tions. However, if watershed loads are overestimated, simultaneous underestimation ofconstituents sinks (from in-stream processes) may have the effect of severely under-predicting true assimilative capacity in the stream.
Below is a summary of the magnitude of error(s) estimated for the principle componentsof uncertainty described in the sections above:
Uncertainty Factor Maximum Percent Error RangeWatershed Loading Estimates unknownWatershed Flow Simulation -0.1 to +29.0QUAL2E Water Quality Input variables -20.4 to +20.7

52Texas Natural Resource Conservation Commission Draft, July 16, 2003
2
3
4
5
6
7
8
9
10
1 6 11 16 21 26 31 36 41 46 51 56 61 66 71 76 81 86
QUA L2E Elements
DO
Con
cent
ratio
n in
MS
L (m
g/L)
Baseline -20% +20%
A
2
3
4
5
6
7
8
9
10
1 6 11 16 21 26 31 36 41 46 51 56 61 66 71 76 81 86
QUA L2E Elements
DO
Con
cent
ratio
n in
MS
L (m
g/L)
Baseline -20% +20%
B
2
3
4
5
6
7
8
9
10
1 6 11 16 21 26 31 36 41 46 51 56 61 66 71 76 81 86
QUA L2E Elements
DO
Con
cent
ratio
n in
MS
L (m
g/L)
Baseline -20% +20%
C
Figure 18. Sensitivity analysis for the response variable dissolved oxygen in the tidalsegment of the Arroyo Colorado for the following input variables: A.AGYGROMX, B. AGYRESPR, and C. AGYOXYPR (from Flowers andHauck, 2002).
53Texas Natural Resource Conservation Commission Draft, July 16, 2003
2
3
4
5
6
7
8
9
10
1 6 11 16 21 26 31 36 41 46 51 56 61 66 71 76 81 86
QUA L2E Elements
DO
Con
cent
ratio
n in
MS
L (m
g/L)
Baseline -20% +20%
A
2
3
4
5
6
7
8
9
10
1 6 11 16 21 26 31 36 41 46 51 56 61 66 71 76 81 86
QUA L2E Elements
DO
Con
cent
ratio
n in
MS
L (m
g/L)
Baseline -30% +30%
B
2
3
4
5
6
7
8
9
10
1 6 11 16 21 26 31 36 41 46 51 56 61 66 71 76 81 86
QUA L2E Elements
DO
Con
cent
ratio
n in
MS
L (m
g/L)
Baseline -30% +30%
C
Figure 19. Sensitivity analysis for the response variable dissolved oxygen in the tidalsegment of the Arroyo Colorado for the following input variables: A.AGYOXYUP, B SOD rate (DO flux), and C. K2-OPT1 (from Flowers andHauck, 2002).

54Texas Natural Resource Conservation Commission Draft, July 16, 2003
2
3
4
5
6
7
8
9
10
1 6 11 16 21 26 31 36 41 46 51 56 61 66 71 76 81 86
QUA L2E Elements
DO
Con
cent
ratio
n in
MS
L (m
g/L)
Baseline -5% +5%
A
2
3
4
5
6
7
8
9
10
1 6 11 16 21 26 31 36 41 46 51 56 61 66 71 76 81 86
QUA L2E Elements
DO
Con
cent
ratio
n in
MS
L (m
g/L)
Baseline -10% +10%
B
2
3
4
5
6
7
8
9
10
1 6 11 16 21 26 31 36 41 46 51 56 61 66 71 76 81 86
QUA L2E Elements
DO
Con
cent
ratio
n in
MS
L (m
g/L)
Baseline -50% +50%
C
Figure 20. Sensitivity analysis for the response variable dissolved oxygen in the tidalsegment of the Arroyo Colorado for the following input variables: A.INITTEMP, B HWTRDO, and C. HWTRCHLA (from Flowers and Hauck,2002).

55Texas Natural Resource Conservation Commission Draft, July 16, 2003
Uncertainty associated with one of the most important sources of error in the ArroyoColorado TMDL analysis, watershed loading estimates, is one of the least quantifiable atthis time. This is only one of the reasons why it is not possible to accurately estimate aviable margin of safety for the current Arroyo Colorado TMDL analysis based onavailable information. As will become apparent in the following section, an attempt toestimate a margin of safety (that leaves a portion of the assimilative capacity of theArroyo Colorado unallocated) is actually not warranted in this study.
Loading AllocationAs stated in the introduction section of this document, the TMDL analysis presentedherein does not support a quantitative, water quality target-based allocation of loadings ofconstituents associated with dissolved oxygen dynamics in the tidal segment of theArroyo Colorado. This is due, in part, to the important role played by the physicalmodifications imposed on the Arroyo Colorado which have the effect of exacerbating thefrequency and magnitude of episodes of anoxia in the mixed surface layer. A quantita-tive, water quality target-based allocation of loadings is also problematic due to a generalinability of the DO criteria applied to the Arroyo to take into account episodes of lowdissolved oxygen that are the result of naturally occurring conditions. However, theTMDL analysis does show that improvements in water quality and a potential reductionin the environmental stresses to aquatic life can be achieved through the reduction ofnutrients, BOD, and sediment loadings into the Arroyo Colorado.
The effect(s) of reductions in loadings of constituents of concern on dissolved oxygenconcentrations and other selected water quality parameters in the mixed surface layer ofthe tidal segment of the Arroyo Colorado were simulated under a number of loadreduction scenarios. Detailed spatial analysis of the effects of loading reductions wereconducted for the six index periods chosen for the QUAL2E simulations. Temporalanalysis of the effects of loading reductions were conducted using the 11-year dynamicsimulation output provided by the Arroyo Colorado (HSPF) watershed model.
Three load reduction scenarios were chosen for discussion in this document (20%, 50%,and 90%). Due to the absence of a limiting nutrient parameter and the low sensitivity ofthe water quality model to headwater BOD and chlorophyll a concentrations, the percentreductions in loadings shown in the different scenarios represent across-the-boardreductions in loadings for all constituents of concern by the same percentage (e.g., the20% load reduction scenario represents a 20% reduction in BOD loading, plus a 20%reduction in ammonia N loading, plus a 20% reduction in NO3+NO2 N loading, plus a20% reduction in PO4P loading, etc.). It should be noted, that flow volumes were notaltered during the load reduction runs and remain the same in each scenario.
Figures 21 and 22 show QUAL2E simulations of dissolved oxygen concentrations in thetidal segment of the Arroyo Colorado resulting from the reduction of loadings ofconstituents of concern by 20%, 50%, and 90%. Although the simulation periods shownin these figures correspond only to the June 1998 and August 1992 index periods, similarresults were observed for all other simulation index periods.
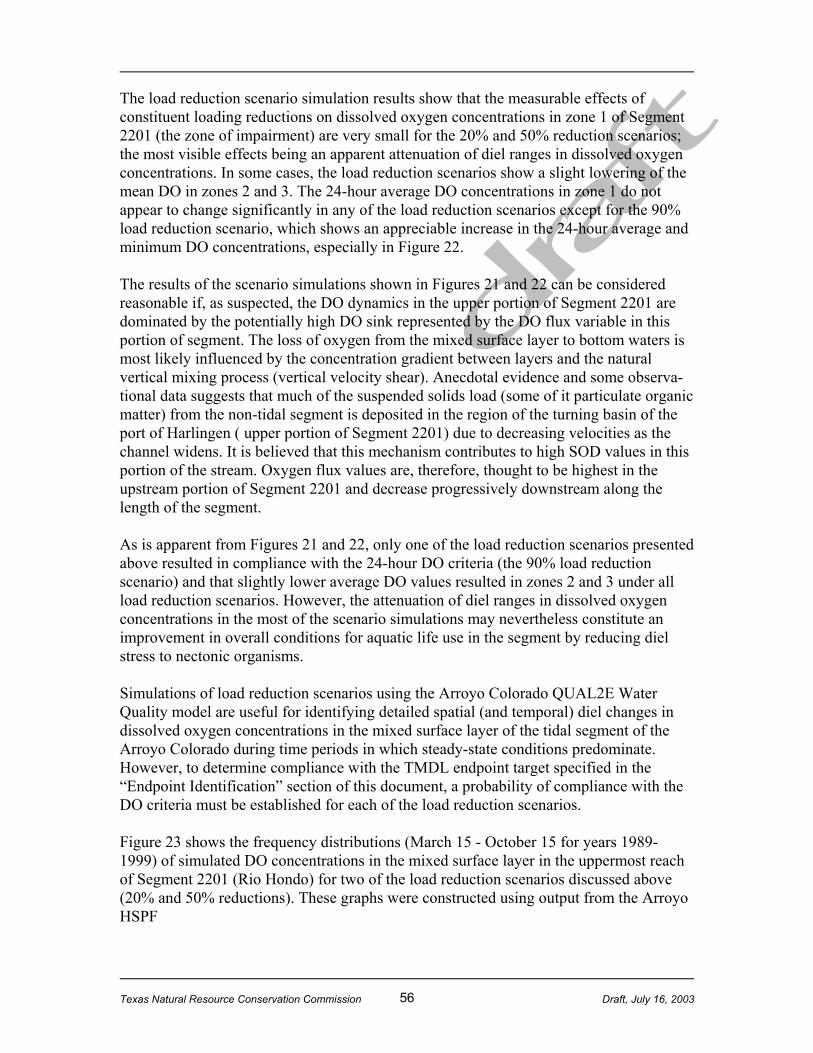
56Texas Natural Resource Conservation Commission Draft, July 16, 2003
The load reduction scenario simulation results show that the measurable effects ofconstituent loading reductions on dissolved oxygen concentrations in zone 1 of Segment2201 (the zone of impairment) are very small for the 20% and 50% reduction scenarios;the most visible effects being an apparent attenuation of diel ranges in dissolved oxygenconcentrations. In some cases, the load reduction scenarios show a slight lowering of themean DO in zones 2 and 3. The 24-hour average DO concentrations in zone 1 do notappear to change significantly in any of the load reduction scenarios except for the 90%load reduction scenario, which shows an appreciable increase in the 24-hour average andminimum DO concentrations, especially in Figure 22.
The results of the scenario simulations shown in Figures 21 and 22 can be consideredreasonable if, as suspected, the DO dynamics in the upper portion of Segment 2201 aredominated by the potentially high DO sink represented by the DO flux variable in thisportion of segment. The loss of oxygen from the mixed surface layer to bottom waters ismost likely influenced by the concentration gradient between layers and the naturalvertical mixing process (vertical velocity shear). Anecdotal evidence and some observa-tional data suggests that much of the suspended solids load (some of it particulate organicmatter) from the non-tidal segment is deposited in the region of the turning basin of theport of Harlingen ( upper portion of Segment 2201) due to decreasing velocities as thechannel widens. It is believed that this mechanism contributes to high SOD values in thisportion of the stream. Oxygen flux values are, therefore, thought to be highest in theupstream portion of Segment 2201 and decrease progressively downstream along thelength of the segment.
As is apparent from Figures 21 and 22, only one of the load reduction scenarios presentedabove resulted in compliance with the 24-hour DO criteria (the 90% load reductionscenario) and that slightly lower average DO values resulted in zones 2 and 3 under allload reduction scenarios. However, the attenuation of diel ranges in dissolved oxygenconcentrations in the most of the scenario simulations may nevertheless constitute animprovement in overall conditions for aquatic life use in the segment by reducing dielstress to nectonic organisms.
Simulations of load reduction scenarios using the Arroyo Colorado QUAL2E WaterQuality model are useful for identifying detailed spatial (and temporal) diel changes indissolved oxygen concentrations in the mixed surface layer of the tidal segment of theArroyo Colorado during time periods in which steady-state conditions predominate.However, to determine compliance with the TMDL endpoint target specified in the“Endpoint Identification” section of this document, a probability of compliance with theDO criteria must be established for each of the load reduction scenarios.
Figure 23 shows the frequency distributions (March 15 - October 15 for years 1989-1999) of simulated DO concentrations in the mixed surface layer in the uppermost reachof Segment 2201 (Rio Hondo) for two of the load reduction scenarios discussed above(20% and 50% reductions). These graphs were constructed using output from the ArroyoHSPF
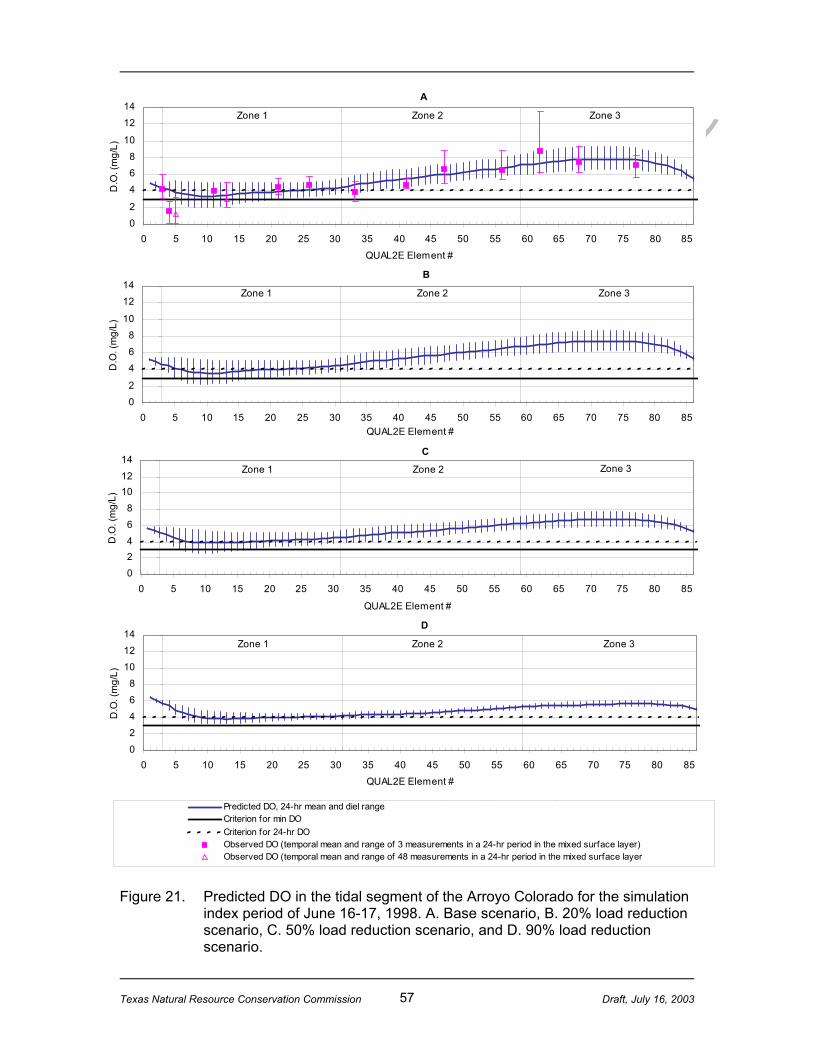
57Texas Natural Resource Conservation Commission Draft, July 16, 2003
B
0
2
4
6
8
10
12
14
0 5 10 15 20 25 30 35 40 45 50 55 60 65 70 75 80 85QUAL2E Element #
D.O
. (m
g/L)
Zone 1 Zone 2 Zone 3
C
0
24
6
8
1012
14
0 5 10 15 20 25 30 35 40 45 50 55 60 65 70 75 80 85
QUAL2E Element #
D.O
. (m
g/L)
Zone 1 Zone 2 Zone 3
D
0
2
4
6
8
10
12
14
0 5 10 15 20 25 30 35 40 45 50 55 60 65 70 75 80 85
QUAL2E Element #
D.O
. (m
g/L)
Zone 1 Zone 2 Zone 3
A
0
2
4
6
8
10
12
14
0 5 10 15 20 25 30 35 40 45 50 55 60 65 70 75 80 85
QUAL2E Element #
D.O
. (m
g/L)
Zone 1 Zone 2 Zone 3
Predicted DO Concentration in Arroyo Colorado (Segment 2201)No Load Reduction, Index Period #1, 6/16-17/1998
02468101214
0 5 10 15 20 25 30 35 40 45 50 55 60 65 70 75 80 85
QUAL2E Element #
D.O
. (m
g/ L)
Predicted DO, 24-hr mean and diel rangeCriterion for min DOCriterion for 24-hr DOObserved DO (temporal mean and range of 3 measurements in a 24-hr period in the mixed surface layer)Observed DO (temporal mean and range of 48 measurements in a 24-hr period in the mixed surface layer
Figure 21. Predicted DO in the tidal segment of the Arroyo Colorado for the simulationindex period of June 16-17, 1998. A. Base scenario, B. 20% load reductionscenario, C. 50% load reduction scenario, and D. 90% load reductionscenario.

58Texas Natural Resource Conservation Commission Draft, July 16, 2003
A
0
2
4
6
8
10
12
14
0 5 10 15 20 25 30 35 40 45 50 55 60 65 70 75 80 85
QUAL2E Element #
D.O
. (m
g/L)
Zone 1 Zone 2 Zone 3
B
0
2
4
6
8
10
12
14
0 5 10 15 20 25 30 35 40 45 50 55 60 65 70 75 80 85
QUAL2E Element #
D.O
. (m
g/L)
Zone 1 Zone 2 Zone 3
C
0
2
4
6
8
10
12
14
0 5 10 15 20 25 30 35 40 45 50 55 60 65 70 75 80 85
QUAL2E Element #
D.O
. (m
g/L)
Zone 1 Zone 2 Zone 3
D
0
2
4
6
8
10
12
14
0 5 10 15 20 25 30 35 40 45 50 55 60 65 70 75 80 85
QUAL2E Element #
D.O
. (m
g/L)
Zone 1 Zone 2 Zone 3
Predicted DO Concentration in Arroyo Colorado (Segment 2201)No Load Reduction, Index Period #1, 6/16-17/1998
02468101214
0 5 10 15 20 25 30 35 40 45 50 55 60 65 70 75 80 85
QUAL2E Element #
D.O .
(mg
/L)
Predicted DO, 24-hr mean and diel range
Criterion for min DO
Criterion for 24-hr DO
Observed DO (temporal mean and range of 3 measurements in a 24-hr period in the mixed surface layer)
Figure 22. Predicted DO in the tidal segment of the Arroyo Colorado for the simulationindex period of August12- 13, 1992. A. Base scenario, B. 20% loadreduction scenario C. 50% load reduction scenario, D. 90% load reductionscenario.

59Texas Natural Resource Conservation Commission Draft, July 16, 2003
model. The graphs show that, although the probability of compliance with the 24-hourDO criteria improves, the endpoint target of 90% probability of compliance is not met ineither load reduction scenario. In fact, after numerous iterations and load reductionscenario simulations using HSPF, the endpoint target of 90% compliance was met onlyafter a 90% reduction in loadings of constituents of concern was achieved (Figure 24).
In order to appreciate the magnitude of change in loading that a 90% load reductionscenario in the Arroyo Colorado watershed would represent, one must put these loadingreductions into context. To do this, it is helpful not only to calculate the total reduction inmass of constituents necessary to achieve the TMDL endpoint target (e.g. 5.6 tons/day oftotal nitrogen, 0.6 tons/day of total phosphorus, and 11.1 tons/day of BOD, as peraverage year of simulation), it is also helpful, for comparison purposes, to develop anestimate of the loadings of constituents of concern that would be expected in the ArroyoColorado watershed under natural conditions. This estimate of natural loadings wasaccomplished by performing an HSPF simulation of the Arroyo Colorado watershedunder natural conditions; that is, having removed all anthropogenic point and nonpointsources from the input file and having converted all land use and land cover to naturalland (i.e., natural herbaceous, trees and shrubs).
Figure 25 shows a graph of the frequency distribution of DO concentrations predicted forthe natural loading scenario (March 15 - October 15 for years 1989-1999). It is interest-ing to note that the frequency of compliance with the 4.0 mg/l criteria shown in Figure 25is similar to that of the base (current) condition (see Figure 13).
A detailed view of the spatial (and temporal diel) changes in dissolved oxygen concentra-tions that could be expected in the mixed surface layer of the tidal segment of the ArroyoColorado under a natural loading scenario during critical periods is exemplified by someof the QUAL2E simulation index periods is presented in Figure 26.
The predicted DO concentrations shown in Figure 26, resulting from QUAL2E simula-tions under natural loading conditions, underscore the potential contributions of thephysical setting to the DO dynamics observed in the tidal segment of the Arroyo Colo-rado. Unlike the load reduction scenarios presented in Figures 21 and 22, the predictedresponse in DO concentrations in the mixed surface layer to the reduction in loading andflow volume represented by the natural loading scenario is a notable decrease in averageDO values in the upper portion of Segment 2201 and very small ranges in diel DOfluctuations for all simulation index periods.
The predicted low range in diel DO fluctuations shown in Figure 26 can be attributed tothe decrease in nutrient concentrations associated with the natural loading scenario. Thelow DO ranges, along with the lower average DO values, are indicative of a decrease inprimary productivity in Segment 2201 and reveal the relative importance of algalproductivity as a source of dissolved oxygen and a counteracting factor to dissolvedoxygen flux across the halocline and low reaeration rates in the zone of impairment.
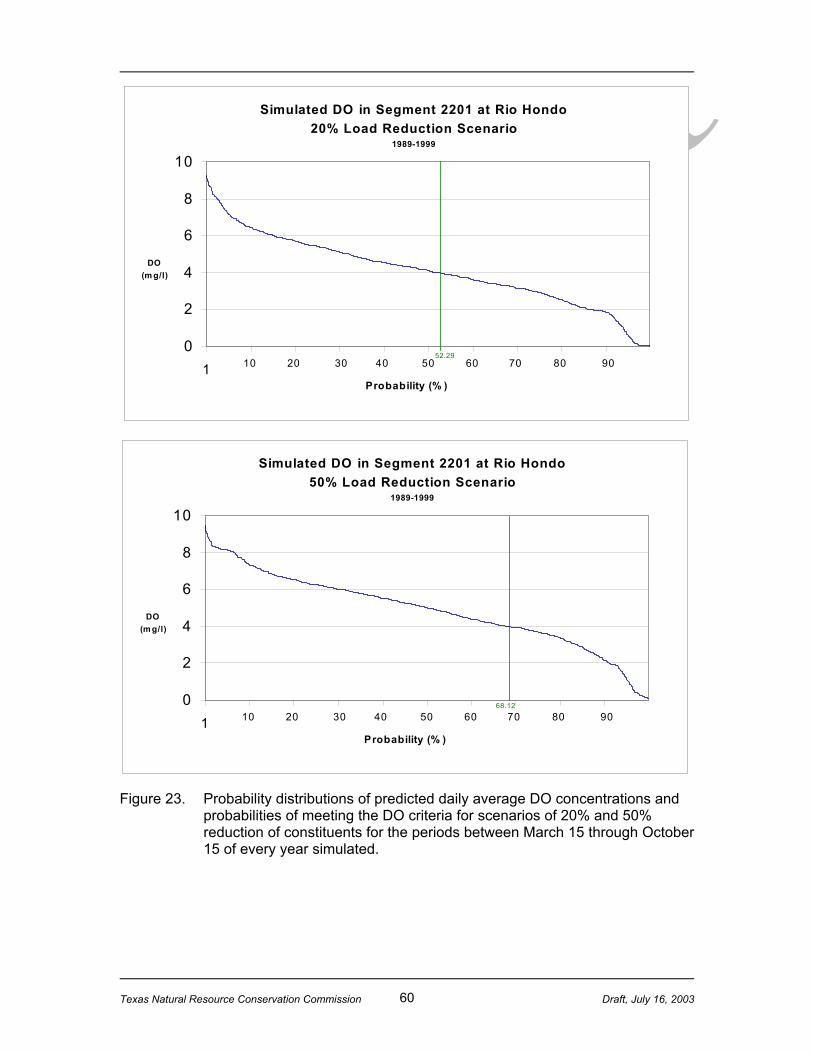
60Texas Natural Resource Conservation Commission Draft, July 16, 2003
0
2
4
6
8
10
1 10 20 30 40 50 60 70 80 90
Simulated DO in Segment 2201 at Rio Hondo20% Load Reduction Scenario
1989-1999
Probability (% )
DO(m g/l)
52.29
0
2
4
6
8
10
1 10 20 30 40 50 60 70 80 90
Simulated DO in Segment 2201 at Rio Hondo50% Load Reduction Scenario
1989-1999
Probability (% )
DO(m g/l)
68.12
Figure 23. Probability distributions of predicted daily average DO concentrations andprobabilities of meeting the DO criteria for scenarios of 20% and 50%reduction of constituents for the periods between March 15 through October15 of every year simulated.

61Texas Natural Resource Conservation Commission Draft, July 16, 2003
0
2
4
6
8
10
12
1 10 20 30 40 50 60 70 80 90
Simulated DO in Segment 2201 at Rio Hondo 1989-1999
Probability (%)
DO(mg/l)
43.50
0
2
4
6
8
10
1 10 20 30 40 50 60 70 80 90
Simulated DO in Segment 2201 at Rio Hondo90% Load Reduction Scenario
1989-1999
Probability (%)
DO(mg/l)
90.30
Figure 24. Probability distributions of predicted daily average DO concentrations andprobabilities of meeting the DO criteria for a scenario of 90% reduction ofconstituents for the periods between March 15 through October 15 of everyyear simulated.
Figure 25. Predicted daily average DO concentrations in the mixed surface layer of thetidal segment of the Arroyo Colorado at Rio Hondo under a natural loadingscenario and probability distribution (March 15 through October 15 of everyyear simulated) and probability of meeting the DO criteria under a naturalloading scenario.

62Texas Natural Resource Conservation Commission Draft, July 16, 2003
A
0
2
4
6
8
10
12
14
0 10 20 30 40 50 60 70 80 90
QUA L2E Element #
D.O
. (m
g/L)
Zone 1 Zone 2 Zone 3
B
0
2
4
6
8
10
12
14
0 10 20 30 40 50 60 70 80 90
QUA L2E Element #
D.O
. (m
g/L)
Zone 1 Zone 2 Zone 3
C
0
2
4
6
8
10
12
14
0 10 20 30 40 50 60 70 80 90
QUA L2E Element #
D.O
. (m
g/L)
P r edic t ed D.O. ( mg/ L) mean DO Cr i t er ion f or m in DO DO Cr i t er ion f or 24- hr DO
Zone 1 Zone 2 Zone 3
Figure 26. Predicted dissolved oxygen in the tidal segment of the Arroyo Coloradounder a natural loading scenario for the simulation index periods of: A. June16-17, 1998, B. August 12-13, 1992, and C. August 19-20, 1996.

63Texas Natural Resource Conservation Commission Draft, July 16, 2003
Analysis of HSPF simulation output for the natural loading scenario and the 90% loadingreduction scenario discussed previously (see Figure 24) reveals that loading ofconstituents of concern into zone 1 of Segment 2201 under a 90% loading reductionscenario are comparable to the loadings estimated under a natural loading scenario. Theresults of this analysis imply that even at much higher (anthropogenically augmented)flow volumes, the Arroyo Colorado is unable to assimilate loadings in excess of whatwould be expected under natural conditions. It should also be noted that, even undernatural flow volumes and loadings, the Arroyo Colorado would meet the current DOcriteria only 43.5% of the time, which is about as often as the DO criteria is currentlymet.
The analysis described above leads to the conclusion that the physical setting in theArroyo Colorado (and in particular in zone 1 of Segment 2201) contributes significantlyto the observed DO impairment in the tidal segment of the Arroyo Colorado and thateven extreme reductions in the loading of constituents of concern into the ArroyoColorado will not achieve the TMDL endpoint target described in the “EndpointIdentification” section of this document without mitigating the effects of some of thephysical modifications imposed on the Arroyo Colorado (i.e., dredged channel, leveedand/or raised banks, lack of riparian habitat, etc.)
Given the conclusions stated above, the TMDL analysis presented herein does notsupport a quantitative, water quality target-based allocation of loadings of constituentsassociated with dissolved oxygen dynamics in the tidal segment of the Arroyo Colorado.However, the analysis does show improvements in water quality and a potentialreduction in the environmental stresses to aquatic life can be achieved through thereduction of nutrients, BOD, and sediment loadings into the Arroyo Colorado. There isalso evidence that reductions of constituent loadings into the Arroyo Colorado would alsogreatly benefit aquatic life in the Laguna Madre, an important downstream receivingwater body which is also currently thought to suffer from nutrient over-enrichment.Efforts to improve water quality in the Laguna Madre should, therefore, includemechanisms for reduction of constituent loadings entering the Arroyo Colorado.
Discussion and Conclusions The TMDL analysis presented in this document is a useful tool for designing aWatershed Action Plan to address the dissolved oxygen impairment observed in theupper portion of the tidal segment of the Arroyo Colorado. Although the analysis doesnot support an allocation of constituents of concern among sources in the watershed, theknowledge gained through the study of the water body can be used as a foundation forachieving the ultimate goal stated at the beginning of this document, which is to providethe basis for developing a viable strategy to develop, attain and maintain a DO criterionthat is protective of the appropriate beneficial aquatic life use in the tidal segment of theArroyo Colorado.
Recommendations for designing a Watershed Action Plan based on the knowledgegained through the Arroyo Colorado TMDL analysis can be summarized into thefollowing points:

64Texas Natural Resource Conservation Commission Draft, July 16, 2003
1. Loadings of total nitrogen, total phosphorus, BOD, and sediment into theArroyo Colorado should be reduced to levels that are technically achievablewith consideration given to economic viability issues. Better compliance withexisting TPDES permit limits should be achieved through increasedenforcement efforts and by upgrading existing treatment methods in severalPOTWs. Reductions in nonpoint source loadings should be achieved throughincreased emphasis of existing state and federal voluntary cost-share programsin the watershed.
2. Aquatic habitat in the Arroyo Colorado should be improved to mitigate theenvironmental stresses currently being experienced by indigenous aquatic life.The physical anthropogenic modifications which currently characterize thetidal segment of the Arroyo Colorado must be changed or compensated forthrough additional modifications in order to improve aquatic habitat. Forexample, low reaeration rates in the upper portion of the tidal segment of theArroyo Colorado are thought to be influenced by the depth of entrenchment ofthe (dredged) channel and the placement of dredge spoils along the channelbanks which may have the effect of blocking wind action. In addition to in-stream and riparian modifications such as the building of settling basins andreaeration structures (EPA 1996), management practices such as properplacement or alternative disposal of dredge spoils should also be considered.Among the factors that influence DO dynamics is DO and nutrient loadingfrom Segment 2202. In addition to reductions in contaminant loadings,increasing the assimilative capacity as well as the dissolved oxygen content inthe above-tidal segment would greatly improve water quality in Segment 2201.Therefore, improvements in physical habitat should not be limited to Segment2201.
3. Given the questions surrounding the appropriateness of the DO criteriacurrently applied to this (and other) tidal stream(s) located along the TexasGulf Coast, a review of the applicability of the current DO criteria to theArroyo Colorado should be conducted. The review should include updatedbiological information and water quality monitoring data. The review shouldalso consider the altered physical nature of the water body and it’s relationshipto use attainability.
4. Biological, flow, and water quality monitoring in the Arroyo Colorado shouldbe continued and enhanced. In order to improve understanding of the cause-and-effect relationships associated with the DO impairment observed inSegment 2201 and also to provide a means to establish more detailed waterquality trends. A monitoring program similar to that currently in existenceshould continue to monitor changes in constituent concentrations in (andloadings into) the Arroyo Colorado. Monitoring should also include long-termbiological sampling and continuous profile monitoring in the upper reaches ofSegment 2201 (specifically at the Port of Harlingen turning basin and at RioHondo). This monitoring is needed in order to establish trends and to gain abetter understanding of the relationship between DO concentrations in the

65Texas Natural Resource Conservation Commission Draft, July 16, 2003
mixed surface layer and hydrodynamics in the tidal segment of the ArroyoColorado.
5. Characterization of watershed loadings, in-stream rates and constants, and DOdynamics in the Arroyo Colorado should be improved to enhanceunderstanding of the cause-and-effect relationships between flow, loadings,biochemical interactions, and physical setting. Studies should include edge-of-field measurements of flow and constituent concentrations resulting fromrunoff and irrigation events, measurements of irrigation return flow volumes,direct monitoring of nutrient loading from municipal wastewater facilities,measurements of SOD in the upper portion of Segment 2201, measurements ofnutrient cycling and algal productivity, measurements of particulate organicmatter loadings from various sources in the watershed, and measurement of thedeposition and accumulation rates of particulate organic matter in the upperportion of Segment 2201. The results of the data collection efforts describedabove would be used to enhance the sophistication of modeling efforts and torefine the overall TMDL analysis of the Arroyo Colorado.
6. More detailed hydrodynamic modeling should be conducted on the tidalsegment of the Arroyo Colorado in order to better characterize the effects ofthe complex hydraulic environment which exists in Segment 2201. Additionaldata collection should be conducted to document kinetic rates, productivityparameters, and nutrient cycling parameters for use in the hydrodynamicmodel.
ReferencesBlack and Veatch. 1981, Nonpoint Source Pollution Sampling Program. Report, Dallas,
Texas. June, 1981.
Chapman, D.C., D.M. Papoulias, and C.P. Onuf. 1998. Environmental change in south Texas. In M.J. Mac, P.A. Opler, C.E. Puckett-Haecker, and P.D. Doran (editors).Status and Trends of the Nation’s Biological Resources, 2 volumes. U.S.Department of the Interior, U.S. Geological Survey, Reston, Virginia,http://biology.usgs.gov/s+t/SNT/index.htm
EPA (U.S. Environmental Protection Agency). 1996, Ecological Restoration: A Tool toManage Stream Quality. USEPA Office of Wetlands Oceans and Watersheds.http://www.epa.gov/OWOW/NPS/Ecology
EPA (U.S. Environmental Protection Agency). 1997, Hydrologic Simulation Program -FORTRAN users manual for version 11: U.S. Environmental Protection Agency,National Exposure Research Center, Athens, Georgia, EPA/600/R-97/080, 755 p.
EPA (U.S. Environmental Protection Agency). 1998, 1993 Regional EnvironmentalMonitoring and Assessment Program (Remap) Arroyo Colorado Tidal, RioGrande Tidal, and East Bay Bayou, Texas. USEPA, Region 6, watershedManagement Division, April 14, 1998.
66Texas Natural Resource Conservation Commission Draft, July 16, 2003
EPA (U.S. Environmental Protection Agency). 1999a. Draft Guidance for Water Quality-based Decisions: The TMDL Process (Second Edition). EPA 841-D-99-001,Office of Water, U.S. EPA, Washington, D.C.
EPA (U.S. Environmental Protection Agency). 2002. Dissolved Oxygen of BottomWaters in the Mid-Atlantic Region. Mid-Atlantic Integrated Assessment, USEPAOffice of Research and Development. http://www.epa.gov/maia/html/oxygen.html
Flowers, J. D. and L. M. Hauck, 2001. Dissolved Oxygen Validation of QUAL2E for theTidal Segment of the Arroyo Colorado (Segment 2201). TIAER (Texas Institutefor Applied Environmental Research) Deliverable for TNRCC contract No. 582-0-80113, Work Order No. 582-0-80113-02, August 31, 2001.
Flowers, J. D. and L. M. Hauck, 2002. Sensitivity and Uncertainty Analysis of Qual2EModel Predictions for Dissolved Oxygen in the Tidal Segment of the ArroyoColorado (Segment 2201). TIAER (Texas Institute for Applied EnvironmentalResearch) Deliverable for TNRCC contract No. 582-0-80113, Work Order No.582-0-80113-07, April 30, 2002.
Garza, A.A. 1999. Hidalgo County. The Handbook of Texas Online, Texas StateHistorical Association. <http://www.tsha.utexas.edu/handbook/online/articles/>
Garza, A.A., and C. Long. 1999. Cameron County. The Handbook of Texas Online, Texas State Historical Association.<http://www.tsha.utexas.edu/handbook/online/articles/>
LRGVDC (Lower Rio Grande Valley Development Council ). 1977, Nonpoint SourceReport. McAllen, Texas.
Matlock, M., K.P. Kasparzak, and S. Osborn. 2001. In Situ Oxygen Demand in theArroyo Colorado River, Final Contract deliverable for Interagency Agreement7500000149, August 29, 2001.
NOAA (National Oceanic and Atmospheric Administration). 1992, Coastal ZoneBoundary Review, National Summary: State Characterization Reports, U.S.Department of Commerce. October 1992.
Onuf, C.P., 1996, Biomass patterns in seagrass meadows of the Laguna Madre, Texas.Bulletin of Marine Science, 58 (2): 404-420
Onuf, C.P., 1999, Written Communication to Gail Rothe (TNRCC). October 14, 1999.
STRAAM Engineers (1975) Technical Subplans, Technical Plan Report, Volume 1, Part5, 208 Water Quality Program. McAllen, Texas.
SWCERP (Southwest Center for Environmental Policy and Research). 1993, Summary ofU.S. - Mexico Border Community Environmental Forums. February, 1993.

67Texas Natural Resource Conservation Commission Draft, July 16, 2003
TAES (Texas Agricultural Extension Service). 2000. Introduction - Arroyo Colorado Project. TAES, Texas A&M University, Agricultural Research & ExtensionCenter, Weslaco, Texas. Available through <http://primera.tamu.edu/>
TDWR (Texas Department of Water Resources). 1978, Intensive Surface WaterMonitoring Survey for Segment 2201. February, 1978. IMS-72
TDWR (Texas Department of Water Resources). 1983, Intensive Survey of the ArroyoColorado Segment 2201. April, 1983. IS-49.
TDWR (Texas Department of Water Resources). 1984, Use Attainability Analysis of theArroyo Colorado: Segment 2201. May, 1984.
TDWR (Texas Department of Water Resources). 1985, Intensive Survey of the ArroyoColorado Segment 2201. January, 1985. IS-69.
TGLO (Texas General and Office). 1995, Rio Grande Coastal Impact MonitoringProgram - Final Project Report.
TWC (Texas Water Commission). 1989, Results of Intensive Priority PollutantMonitoring in Texas - Phase II. Sabine River Near Longview, Upper San AntonioRiver, Corpus Christi Bay/Inner Harbor, Arroyo Colorado, Sabine/Neches RiverTidal. LP 89-07, Texas Water Commission, Austin, Texas.
TWDB (Texas Water Development Board). 1994. Acoustic Doppler Current Profiler(ADCP) Measurements on the Arroyo Colorado. Arroyo Colorado EcosystemSurvey.
TWDB (Texas Water Development Board). 1996. Colonia Data and Maps Online,Economically Distressed Areas Geographic Information System. Texas WaterDevelopment Board.<http://www.twdb.state.tx.us/colonias/countyindex1996.htm>
TNRCC (Texas Natural Resource Conservation Commission). 1994. RegionalAssessment of Water Quality in the Rio Grande Basin including the Pecos River,the Devils River, the Arroyo Colorado and the Lower Laguna Madre. AS-34,Watershed Management Division, TNRCC, Austin, Texas.
TNRCC (Texas Natural Resource Conservation Commission). 1994a, RegionalAssessment of Water Quality in the Nueces Coastal Basins. October, 1994. AS35
TNRCC (Texas Natural Resource Conservation Commission). 1996, RegionalAssessment of water in the Rio Grande Basin including the Pecos River, theDevils River, the Arroyo Colorado and the Lower Laguna Madre. November,1996. GP 92-02.

68Texas Natural Resource Conservation Commission Draft, July 16, 2003
TNRCC (Texas Natural Resource Conservation Commission). 2000. Improving Water Quality in the Arroyo Colorado. Project Status, Monitoring Operations Division,SFR-58/00, TNRCC, Austin, Texas.
TNRCC (Texas Natural Resource Conservation Commission). 2000b. 2000 Texas CleanWater Act Section 303(d) List and Schedule for Developing Total MaximumDaily Loads, TNRCC, Austin, Texas.
TNRCC (Texas Natural Resource Conservation Commission). 2001. Guidance forAssessing Texas Surface and Finished Drinking Water Quality Data, 2002 ,TNRCC Office of Compliance and Enforcement. September 11, 2001.
TPWD (2002) Pollution Response Inventory and Species Mortality - Texas Parks andWildlife Department Fish Kill and Pollution Compliance Database.<http://tpwd-bioapp.tpwd.state.tx.us/scripts/esrimap.dll?name=wda_rp&cmd=START&img=1.4>
TWC (Texas Water Commission). 1990. Waste Load Evaluation for the Arroyo Coloradoin the Nueces-Rio Grande Coastal Basin. Segment 2201 - Arroyo Colorado Tidal,Segment 2202 - Arroyo Colorado Above Tidal. WLE 90-04, Texas WaterCommission, Austin, Texas.
USGS (U.S. Geological Survey). 2000. Creating a Standardized Watersheds Database forthe Lower Rio Grande/Rio Bravo, Texas. Open File Report 00-065.
USGS (U.S. Geological Survey). 2002. Simulation of Flow and Water Quality of theArroyo Colorado, Texas, 1989-1999. Draft Water Resources Investigation Report02-4110.
UT PANAM (University of Texas - Pan American). 1995. Report of Literature Reviewon
Discharges from the Rio Grande and Arroyo Colorado and their Impacts. TexasGeneral Land Office, Austin, Texas, GLO - September, 1995.