polya: a tool for adjudicating competing …
TRANSCRIPT
University of Montana University of Montana
ScholarWorks at University of Montana ScholarWorks at University of Montana
Graduate Student Theses, Dissertations, & Professional Papers Graduate School
2021
POLYA: A TOOL FOR ADJUDICATING COMPETING ANNOTATIONS POLYA: A TOOL FOR ADJUDICATING COMPETING ANNOTATIONS
OF BIOLOGICAL SEQUENCES OF BIOLOGICAL SEQUENCES
Kaitlin Carey
Follow this and additional works at: https://scholarworks.umt.edu/etd
Part of the Bioinformatics Commons
Let us know how access to this document benefits you.
Recommended Citation Recommended Citation Carey, Kaitlin, "POLYA: A TOOL FOR ADJUDICATING COMPETING ANNOTATIONS OF BIOLOGICAL SEQUENCES" (2021). Graduate Student Theses, Dissertations, & Professional Papers. 11672. https://scholarworks.umt.edu/etd/11672
This Thesis is brought to you for free and open access by the Graduate School at ScholarWorks at University of Montana. It has been accepted for inclusion in Graduate Student Theses, Dissertations, & Professional Papers by an authorized administrator of ScholarWorks at University of Montana. For more information, please contact [email protected].

POLYA: A TOOL FOR ADJUDICATING COMPETING ANNOTATIONS OF
BIOLOGICAL SEQUENCES
By
Kaitlin Carey
Bachelor of Science, The University of Montana, Missoula, MT, 2014
Thesis
presented in partial fulfillment of the requirementsfor the degree of
Master of Sciencein Computer Science
The University of MontanaMissoula, MT
Autumn 2020
Approved by:
Ashby Kinch Ph.D., DeanGraduate School
Travis Wheeler Ph.D., ChairComputer Science
Jesse Johnson Ph.D.Computer Science
Robert Hubley, Senior Software EngineerInstitute for Systems Biology, Seattle, WA

© COPYRIGHT
by
Kaitlin Carey
2021
All Rights Reserved
ii

Carey, Kaitlin, M.S., January 2021 Computer Science
PolyA: a tool for adjudicating competing annotations of biological sequences
Chairperson: Travis Wheeler
Annotation of a biological sequence is usually performed by aligning that sequence to a databaseof known sequence elements. When that database contains elements that are highly similar to eachother, the proper annotation may be ambiguous, because several entries in the database producehigh-scoring alignments. Typical annotation methods work by assigning a label based on thecandidate annotation with the highest alignment score; this can overstate annotation certainty,mislabel boundaries, and fails to identify large scale rearrangements or insertions within the anno-tated sequence. Here, I present a new software tool, PolyA, that adjudicates between competingalignment-based annotations by computing estimates of annotation confidence, identifying a tracewith maximal confidence, and recursively splicing/stitching inserted elements. PolyA communi-cates annotation certainty, identifies large scale rearrangements, and detects boundaries betweenneighboring elements.
iii

ACKNOWLEDGMENTS
I’d like to thank my advisor, Travis Wheeler, for endless support, accessibility, problem solving,
algorithm design, mathematical formula derivation, revising/editing my writing, and questions
answered at all hours of the day; without him none of this would be possible. I’d also like to thank
John McCutcheon who introduced me to computer science and enabled me to discover this passion.
I’d like to thank George Lesica for mentoring me in better software practices, Jack Roddy for using
his software SODA to create visualizations, Audrey Shingleton for her addition of the tandem
repeat analysis, Daniel Olson for using his software ULTRA as a tandem repeat detector and Robert
Hubley, Arian Smit and Jeb Rosen (and Jeb came up with the AAAAAAAAAAAAAAAA:PolyA
name) for establishing motivation for the software and supplying mechanisms for validation. I’d
also like to thank all members of the Wheeler lab for ideas, emotional support, and fun times at
conferences. And finally, I’d like to thank my friends and family for supporting me and enduring
endless practice talks and presentations. I am very grateful for NIH grants P20GM103546 and
5U24HG010136 for funding my research.
iv

TABLE OF CONTENTS
COPYRIGHT . . . . . . . . . . . . . . . . . . . . . . . . . . . . . . . . . . . . . . . . . ii
ABSTRACT . . . . . . . . . . . . . . . . . . . . . . . . . . . . . . . . . . . . . . . . . . iii
ACKNOWLEDGMENTS . . . . . . . . . . . . . . . . . . . . . . . . . . . . . . . . . . iv
LIST OF FIGURES . . . . . . . . . . . . . . . . . . . . . . . . . . . . . . . . . . . . . vi
LIST OF TABLES . . . . . . . . . . . . . . . . . . . . . . . . . . . . . . . . . . . . . . vii
CHAPTER 1 INTRODUCTION . . . . . . . . . . . . . . . . . . . . . . . . . . . . 1
CHAPTER 2 METHODS . . . . . . . . . . . . . . . . . . . . . . . . . . . . . . . . . 8
CHAPTER 3 RESULTS . . . . . . . . . . . . . . . . . . . . . . . . . . . . . . . . . . 13
CHAPTER 4 DISCUSSION . . . . . . . . . . . . . . . . . . . . . . . . . . . . . . . 25
BIBLIOGRAPHY . . . . . . . . . . . . . . . . . . . . . . . . . . . . . . . . . . . . . . 27
v

LIST OF FIGURES
Figure 1.1 Biological sequence annotation. . . . . . . . . . . . . . . . . . . . . . . . . . 2
Figure 1.2 Choosing from competing annotations. . . . . . . . . . . . . . . . . . . . . . 3
Figure 1.3 Neighboring partial element matches. . . . . . . . . . . . . . . . . . . . . . . 4
Figure 1.4 Homologous Recombination. . . . . . . . . . . . . . . . . . . . . . . . . . . . 4
Figure 1.5 Nested insertions. . . . . . . . . . . . . . . . . . . . . . . . . . . . . . . . . . 5
Figure 2.1 Dynamic programming recurrence. . . . . . . . . . . . . . . . . . . . . . . . 11
Figure 2.2 Splicing insertions. . . . . . . . . . . . . . . . . . . . . . . . . . . . . . . . . 12
Figure 3.1 Confidence as a function of sequence divergence. . . . . . . . . . . . . . . . . 15
Figure 3.2 Detecting the change-point between overlapping elements; demonstration of
confidence heatmap. . . . . . . . . . . . . . . . . . . . . . . . . . . . . . . . 16
Figure 3.3 Recombination example. . . . . . . . . . . . . . . . . . . . . . . . . . . . . . 17
Figure 3.4 Example of nested insertions. . . . . . . . . . . . . . . . . . . . . . . . . . . 18
Figure 3.5 Boundary accuracy. . . . . . . . . . . . . . . . . . . . . . . . . . . . . . . . . 23
Figure 3.6 Adjudicating short tandem repeats. . . . . . . . . . . . . . . . . . . . . . . . 24
vi

LIST OF TABLES
3.1 Accuracy results when annotating nested sequences. . . . . . . . . . . . . . 22
vii

1
CHAPTER 1 INTRODUCTION
Biological Sequences
A genome is the set of genetic material in an organism, and it contains complete instructions
for how the organism will grow and function. The genome of an organism is stored in long strings
of DNA made of linearly-connected components called nucleotides. DNA contains 4 nucleotides,
each of which is represented as a letter: A, C, T and G. The human genome, for example, is about
3 billion nucleotides in length, while the smallest viral genomes can be as short as a thousand
nucleotides. Related organisms have more similar DNA sequences, while less related organisms have
further diverged sequences. Understanding the genetic makeup of an organism provides insight into
health, medicine, agriculture, and more, while also allowing us to understand evolutionary history
and processes. Annotating recognizable features in the genome is an import step in this pursuit.
Genome Annotation
Genome annotation is the process of assigning labels to a sequence of nucleotides, and is typically
based on comparison of such sequences to a database of known sequence elements called query
sequences. This comparison is called sequence alignment, which amount to finding good ways to line
up the sequence of the genome to one or more of the sequences in the database. A score is assigned
to an alignment that corresponds to how well the strings match. If these database sequences match
reasonably well to a section of the genome, we assign the corresponding label to that genomic
region (see Figure 1.1). If the genomic sequence has good-scoring alignments to multiple database
sequences, current annotation methods typically adjudicate the target as belonging to the element
with the highest alignment score. This winner-takes-all approach is insufficient for some use cases.

2
What is Genome Annotation?
GCCCCCGTCTGTATTC
GCCCCCGT CTGTATTC…GGCCGGGCCCGCGTGGCTCACGCCTGTAATCCCAGCACTT…
4
Known sequences from a database
Genome
Figure 1.1: Biological sequence annotation is performed by comparing a collection of known sequences from a database,to your genomic or target sequence. Here, the blue and orange sequences from the database match reasonably wellto genomic locations. Then, the corresponding locations are given the labels ’blue’ and ’orange’.
Biological events that complicate annotation
Competing annotations
When the database of known sequences contains elements that are similar to each other, many
related elements may align with a high score to the same region of the target sequence being
annotated, sometimes overlapping in non-trivial ways. From these competing annotations software
must ‘decide’ which is the true annotation at that location; we call this process adjudication (see
Figure 1.2). The winner-takes-all approach of sequence annotation overstates annotation certainty.
The existence of multiple related elements is common, even in databases designed to accumulate
sequence instances into families. For example, in the Dfam [1] database of transposable element
families, some abundant families are divided into highly similar subfamilies in order to represent
family history or improve annotation sensitivity. Similarly, the Pfam [2] database of protein domains
groups similar families into ‘clans’, as does the Rfam [3] database of non-coding RNA families; in
both cases, clan competition selects the longest and highest scoring hit when multiple clan members
match the annotated sequence.

3
Picking from competing annotations
4
dfam.org
A
B
Figure 1.2: A. Several competing query sequences (blue, green and orange rectangles) from a database match tothe same genomic regions (grey rectangle). B. The annotation process produces chooses the best match from thecompetitors and labels the genomic region. [1]
Adjacent neighbors
Due to the nature of sequence alignment, often times the alignment is extended past the bound-
ary of relatedness. This can result in boundaries between adjacent elements being unclear (see
Figure 1.3).
Recombination
Homologous recombination (usually) occurs as the result of a double-stranded break in a strand
of DNA; during the repair process a similar sequence is used as a template for repair, and in some
cases may itself break and ligate to the first. The resulting sequence is chimeric - part one element
and part the other element. During the alignment process, full length instances of both database

4Detecting boundaries of neighboring partial
element matches
Target sequence
L1PA3
AluJo
breakpoint
14Figure 1.3: The terminal end of AluJo alignment overlaps with the start of the L1PA3 alignment. This is caused byover extension in one or both alignments. The actual boundary between these adjacent elements is unknown.
sequences may align to the recombined region (one better matching the first part, the other better-
matching the second part), obscuring the recombination (see Figure 1.4). Current annotation
methods provide no basis for recognizing rearrangements such as in homologous recombination.
Identifying instances of homologous recombination
Target sequence
AluSx
AluY
breakpoint
13Figure 1.4: In the target sequence, half the blue sequence (AluY) has been recombined with half of the orangesequence (AluSx). Full length instances of AluY and AluSx have aligned to this region. The annotation process willchoose the single best match completely missing the recombination.
Nesting
Certain genomic activity (specifically: the replication of transposable elements, see below) can
result in sequences that have created copies of themselves and placed those copies elsewhere in the
genome. Sometimes the copy is inserted inside of another element (see Figure 1.5). Current anno-
tation methods can recognize all of the resulting segments, but can not directly identify fragments

5
from the sub-divided sequence - expert systems such as the ProcessRepeats post-processing script
in RepeatMasker [4] perform such fragment stitching based on extensive domain-specific knowledge.
Dealing with Inserted Elements
26
Dealing with Inserted Elements
27
?
A
B
Figure 1.5: A. The blue and orange sequences have inserted themselves inside of the gray sequence. B. This resultsin separated segments from the original gray sequence.
Transposable elements (TE)
TEs are sequences of DNA that move or replicate from one region of the genome to another,
often via a copy/paste mechanism. When a TE has distributed numerous copies of itself across a
genome, the resulting copies are said to belong to the same family. If those copies came in bursts,
with evolutionary pressures influencing the success of a copy, the results of each burst may be
thought of as a subfamily. These subfamily sequences can be very similar to each other [1].
Our analysis focuses on transposable elements, because they present all of the annotation
challenges listed above. High levels of sequence similarity between subfamilies can cause several
database sequences to align well to a specific genomic sequence, necessitating adjudication between
competing annotations. In addition, integration of one element into another is a hallmark of TE
activity, so that split sequences and unclear boundaries are very common. Furthermore, due to
sequence similarity between elements, rearrangements are common in TEs.

6
Current TE annotation
To our knowledge, RepeatMasker (specifically its ProcessRepeats function) represents the most
complex TE adjudication engine in use today, with expert knowledge built into the software to select
between overlapping competing annotations, and even control the order of candidate alignments
(when known) in order to recursively splice out inserted elements. In addition, RepeatMasker
identifies cases in which multiple candidate annotations have nearly-identical scores, and reduces
annotation specificity in some cases of ambiguity (e.g. labeling a sequence simply ‘Alu’ when several
competing Alu subfamilies all share near-identical scores). My goal in developing the software
described here has been to replace this domain-specific framework with one that works with generic
alignment tools, requiring no expert knowledge of the underlying family structure, and improving
representations of confidence, overlap, recombination, and insertions/stitching.
PolyA
I have devised a simple method for computing confidence in (sub)family membership in the
face of competing sequence alignments, making it possible to report confidence values for sequence
labels, rather than simply reporting a single ‘winner’ from all possible matches. I then extended
this confidence scoring method to compute residue-specific annotation based on the ensemble of
competing alignments, assigning labels (with annotation confidence) to each residue of the target
sequence.
In the following sections, I introduce PolyA, short for ‘AAAAAAAAAAAAAAAA: Automati-
cally Adjudicate Any And All Arbitrary Annotations, Astutely Adjoin Abutting Alignments, And
Also Amputate Anything Amiss’. I demonstrate that it (i) reports a meaningful measure of annota-
tion certainty, (ii) recognizes many instances of homologous recombination, (iii) effectively stitches
sequence element segments resulting from nested insertions, (iv) accurately locates boundaries be-
tween overlapping candidate annotations, and (v) yields adjudicated annotation results that agree
with those of RepeatMasker without resorting to complex and domain-specific expert system logic.
I follow with a complete description of the methods supporting the observed results.

7
To my knowledge, PolyA is the first tool that computes a measure of annotation confidence
in the face of competing alignments, and the first to establish a principled framework for select-
ing the boundary cutoffs between overlapping annotations. PolyA is available for download at
https://github.com/TravisWheelerLab/polyA.
The work described here is largely my own, but significantly benefited from infusions of effort
by several members of the Wheeler lab (see Acknowledgements for details). Because the final
results depend on these contributions, the remainder of this document will describe effort in the
first-person-plural (“we”) rather than singular (“I”).

8
CHAPTER 2 METHODS
Computing confidence in annotation of a full sequence
We can compute a measure of confidence that an annotated sequence belongs to a subfamily i by
leveraging the probabilistic underpinnings of alignment scores. We have described these calculations
in [5], but reproduce them here for completeness.
Given Q = q1, q2, ..., qn competing subfamily annotations of genomic sequence t, we define
P (qi|t) as the probability that the true label of t is qi, and the confidence that qi is the correct label
is
Conf(qi|t) =P (qi|t)∑j P (qj |t)
(2.1)
Assuming a uniform distribution over Q, P (qi|t) ∝ P (t|qi), so that
Conf(qi|t) =P (t|qi)∑j P (t|qj)
(2.2)
In scoring matrices used for sequence alignments, the score for aligning a pair of letters is a
log odds ratio [6], typically scaled by factor λ then rounded to the nearest integer value. Under
the simplifying assumption that gap costs map to probabilities [7], the overall alignment score
corresponds to a scaled log of the ratio of the probability of observing t if it is homologous to qi vs
the probability of observing t under a random (non-homology) model:
score(t, qi) = λ · lg P (t|qi)P (t|R)
(2.3)
After straightforward algebraic manipulation

9
P (t|qi) = P (t|R) · 2score(t,qi)/λ (2.4)
and following substitution into equation 2.2
Conf(qi|t) =2score(t,qi)/λ∑j 2score(t,qj)/λ
(2.5)
This derivation depends on the assumption that all competing family annotations are equally
likely; in the case of non-uniform priors, with P (qk) defined as the prior probability of annotation
qk, the computation may be adjusted as:
Conf(qi|t) =2score(t,qi)/λ · P (qi)∑j P (qj) · 2score(t,qj)/λ
(2.6)
Residue-specific confidence, tracing through competing annotations
A natural mechanism for sub-family annotation would be to develop a jumping profile hidden
Markov model (jpHMM) [8], representing the full contingent of candidate families, then to align
genomic sequence to such a jpHMM. Posterior probabilities calculated on a nucleotide-resolution
basis could work in lieu of the above calculations, and could also identify recombinations and
boundary transitions between adjacent overlapping alignments. Unfortunately, such a model would
be prohibitively computationally expensive. Here, we describe an efficient method for computing
annotation confidence at residue-level resolution, followed by a dynamic programming algorithm
that traces a maximum confidence labeling of the annotated genome sequence.
To compute residue-specific estimates of annotation confidence, we first modify the above full-
sequence confidence calculations to compute confidence across length-w windows. For each position
j in the annotated sequence of length L, we consider a window centered on j (trimmed at the ends)
as follows: let s = max(1, j − bw/2c) and e = min(L, j + bw/2c), and compute the windowed
confidence Conf i,j as above, considering only the scores of sub-alignments that cover sequence
positions in the window s..e. By computing confidence within windows, our tool can account for

10
the fact that one region of sequence is better explained by one candidate annotation, while another
region is best explained by an alternate annotation.
The choice of window length is arbitrary - it should be long enough to smooth out the influence
of individual mutations, but short enough to capture annotation transition points; PolyA sets the
window length to w = 31 by default. In order to produce a less-granular picture of annotation con-
fidence, PolyA computes residue-specific estimates for each position j by capturing an unweighted
average of the confidence calculations of all windows that include position j. Individual mutations
(especially gaps) can cause a single window’s score to vary substantially; this effect is muted by
capturing confidence on a windowed basis.
Conf avgi,j =
∑ek=s Confi,k
w(2.7)
Based on these per-residue confidence values, PolyA computes a maximum confidence trace
through candidate annotations across the length of the annotated sequence, using the dynamic
programming (DP) recurrence shown in Figure 2.1, in which each row is a candidate annotation i,
and each column is a sequence position j.
Two additional candidate annotations are considered, beyond those provided in the form of
sequence alignments. (1) Candidate short tandem repeats (STRs) are identified using the tool
ULTRA [9], which provides per-residue log-odds ratio scores that fit naturally into the PolyA
confidence calculations; these are simply treated as an additional candidate annotation. (2) In some
cases, a single low-quality annotation may extend slightly beyond a clearly-preferred annotation; if
PolyA is forced to choose among available annotations, a small clip of this low-quality annotation
will be selected. PolyA avoids this outcome by including what we call a skip state; when the
annotation trace is in a skip state, the corresponding sequence is assigned no annotation. Skip
states are given a special default score (such that they will out-compete low-quality candidate
annotations).
To encourage annotation continuity, transitioning from one annotation candidate to a different
annotation is heavily penalized. The penalty for transitioning to/from the skip state is reduced.

11
Skip State (𝑖 = 0)
𝑖
𝑗
𝑆!,# = 𝐶𝑜𝑛𝑓_𝑎𝑣𝑔!,# ∗ 𝑚𝑎𝑥 .𝑆!!,#$% ∗ 𝑡&&, 𝑖 = 𝑖' 𝑎𝑛𝑑 𝑖 = 0𝑆!!,#$% ∗ 𝑡(&, 𝑖 ≠ 𝑖' 𝑎𝑛𝑑 𝑖 = 0 𝑜𝑟 𝑖' = 0
𝑆!,# = 𝐶𝑜𝑛𝑓_𝑎𝑣𝑔!,# ∗ 𝑚𝑎𝑥𝑆!!,#$% ∗ 𝑡(&, 𝑖 ≠ 𝑖' 𝑎𝑛𝑑 𝑖 = 0 𝑜𝑟 𝑖' = 0𝑆!!,#$% ∗ 𝑡&, 𝑖 = 𝑖' 𝑎𝑛𝑑 𝑖 ≠ 0𝑆!!,#$% ∗ 𝑡(, 𝑖 ≠ 𝑖' 𝑎𝑛𝑑 𝑖 ≠ 0 𝑎𝑛𝑑 𝑖' ≠ 0
Figure 2.1: In the implicit dynamic-programming matrix, each column represents a position in the genome, and eachrow represents a candidate annotation family. In this figure, a gray bar corresponds to an alignment of the sequencefor family i over a range of genome positions. Cells covered by a gray bar represent positions covered by an alignment- confidence (Conf avgi,j) and score (Si,j) values are computed only these positions; other cells have an implicitvalue of zero. Because this describes a very sparse matrix, values are stored as a sparse set of (i,j,conf avg) tuples.Transition probabilities are: ts (‘stay in the same row’), tm (‘move to a new non-skip-state row’), tms (‘move betweenthe skip-state row and a non-skip-state row’), and tss (‘stay in the skip-state row’). Default values are: tm = 1e− 55,tms =
√tm, ts = 1− tm − tms, tss = 1− tms.
Because an annotated sequence may exceed the length of any single candidate annotation, the
Conf avgi,j matrix is sparse; the DP implementation performs correspondingly sparse calculations
to avoid excessive time and space resource use.
A maximal trace through the sparse DP matrix described in Figure 2.1 yields an ordered series
of labeled regions over the target sequence. These regions may identify transitions between adjacent
elements and recombination or insertion events.
Recursive splicing of insertions, and stitching of surrounding sequences
In the case that an annotated sequence contains an instance B of one family inserted into the
middle of an instance A of another family, the above DP mechanism will annotate the sequence in a
form A1BA2. PolyA takes steps to identify the relationship between A1 and A2 as ordered fragments
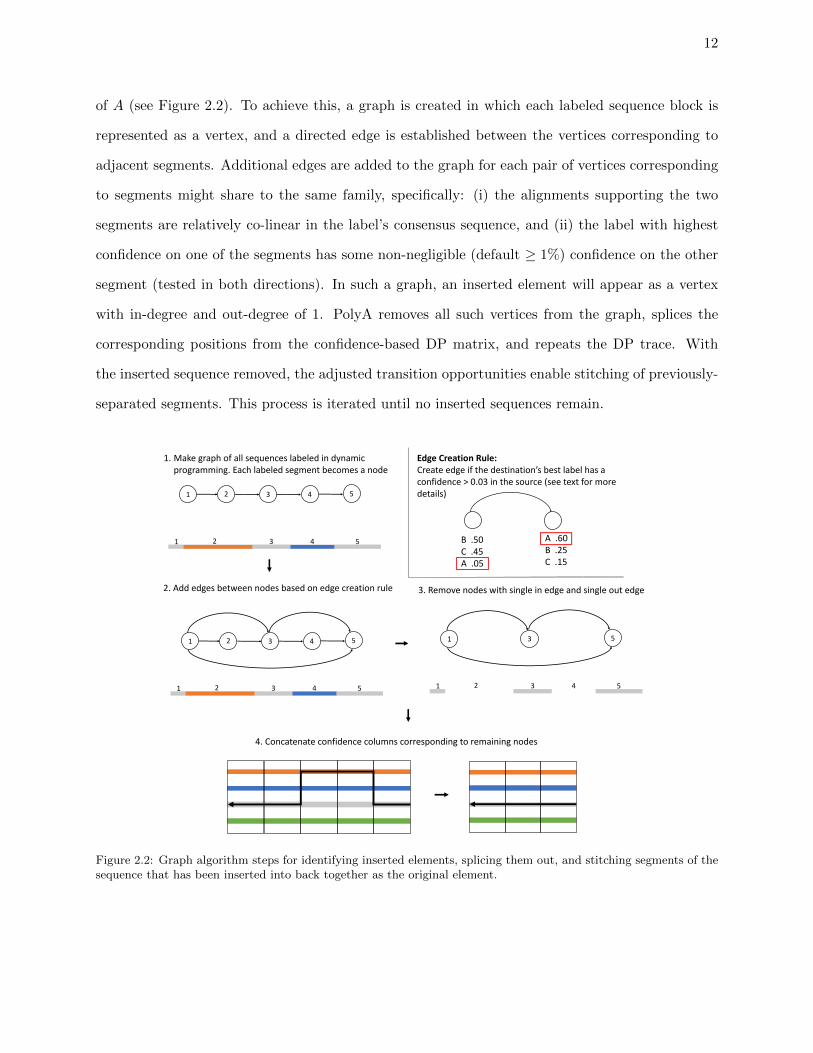
12
of A (see Figure 2.2). To achieve this, a graph is created in which each labeled sequence block is
represented as a vertex, and a directed edge is established between the vertices corresponding to
adjacent segments. Additional edges are added to the graph for each pair of vertices corresponding
to segments might share to the same family, specifically: (i) the alignments supporting the two
segments are relatively co-linear in the label’s consensus sequence, and (ii) the label with highest
confidence on one of the segments has some non-negligible (default ≥ 1%) confidence on the other
segment (tested in both directions). In such a graph, an inserted element will appear as a vertex
with in-degree and out-degree of 1. PolyA removes all such vertices from the graph, splices the
corresponding positions from the confidence-based DP matrix, and repeats the DP trace. With
the inserted sequence removed, the adjusted transition opportunities enable stitching of previously-
separated segments. This process is iterated until no inserted sequences remain.
1. Make graph of all sequences labeled in dynamic programming. Each labeled segment becomes a node
2. Add edges between nodes based on edge creation rule 3. Remove nodes with single in edge and single out edge
4. Concatenate confidence columns corresponding to remaining nodes
Edge Creation Rule:Create edge if the destination’s best label has a confidence > 0.03 in the source (see text for more details)
B .50C .45A .05
A .60B .25C .151
1 2 53 4
1 2 3 4 5
4
3
1 2 53 4
1 3 5
5
2
1 2 53 4
1 2 3 4 5
Figure 2.2: Graph algorithm steps for identifying inserted elements, splicing them out, and stitching segments of thesequence that has been inserted into back together as the original element.

13
CHAPTER 3 RESULTS
Results
To annotate with PolyA, the target (to-be-annotated) sequence should be aligned to all the
sequences in the annotation database. Alignment may be performed with any sequence-to-sequence
alignment tool that depends on a scoring matrix (e.g. blast [10] or cross match [11]). For the
results presented here, this alignment is performed with cross match, since this is the most sensitive
alignment method used in RepeatMasker for consensus sequences; the annotation database is the
Repbase RepeatMasker Edition library (a future version of PolyA will accept alignments with profile
hidden Markov model databases such as Dfam and Pfam; see Discussion). PolyA takes as input (i)
the collection of alignments between the target sequences and the database, and (ii) a reference to
the scoring matrix and gap parameters used to produce each alignment. As described above, PolyA
computes a measure of the confidence with which each position of the target can be assigned to each
competing annotation candidate. These position-specific confidence estimates for all competing
annotations support identification of transition points generated by forces such as recombination
and transposable element integration, and enable boundary detection between adjacent elements
with overlapping competing annotations. The dynamic programming approach described above
identifies a highest-confidence path through competing annotations, assigning labels to each position
of the target sequence. This is followed by a stage that iteratively identifies insertion events and
stitches the segments that were split by such insertions. The result is an annotation adjudication
that correctly addresses events that typically cause incorrect labeling, and also discloses a measure
of annotation certainty.
To evaluate the efficacy of PolyA, we constructed a variety of artificial sequences with known

14
origin, insertion activity, and recombination breakpoints. In each case, artificial sequences were
constructed by mutating consensus sequences from Repbase, according to average substitution,
insertion, and deletion rates acquired from the RepeatMasker hg38.fa.out annotation file [4], then
inserting, trimming, and recombining as appropriate for the specific scenario being assessed.
Annotation Confidence
In [5] we introduced a simple mechanism for computing annotation confidence when several
competing candidates produce alignments to a sequence window (see Methods). This confidence
measure decreases as mutational load of an annotated sequence increases. To demonstrate this, we
selected the AluY subfamily consensus sequence, and for each integer value in the range p ∈ [1..50],
generated 100 mutated copies of AluY in which p percent of nucleotides were randomly selected,
and modified (uniformly) to a different nucleotide. Each mutated instance was aligned to all
Repbase Alu subfamily consensus sequences using cross match, and Eq 2.2 was applied to compute
the confidence with which the instance was assigned an annotation of AluY. Figure 3.1 provides
the average confidence for each bin of 100 (dark line), along with a shaded region indicating an
interval of 1 standard deviation. This plot provides a sense of the decay in confidence expected as
sequence divergence increases; specific confidence details for a particular (sub)family will depend
on the number and relationship of similar subfamilies.
Selecting Change-point for Overlapping Annotation Candidates
When faced with competing, overlapping annotation candidates, PolyA infers a precise inter-
mediate boundary between overlapping annotation candidates by computing per-residue confidence
values and identifying a highest-confidence trace. This approach is effective for recombinations and
insertions as described below, as well as for overlapping neighbors as demonstrated in Fig 3.2, in
which the tail of an L1M1 orf2 candidate overlaps with several competing Alu alignments. The
bottom of Fig 3.2 represents the position-specific confidence values as a heatmap, with green repre-
senting high confidence and purple representing low confidence (Note: the Alu shows long stretches

15
Figure 3.1: Confidence as a function of sequence divergence. Beginning with the Repbase consensus sequencefor the AluJr subfamily, mutated instances were created with a range of percent substitutions, with 100 copies foreach percentage bin. Each mutated instance was aligned to all Alu subfamilies using cross match (25p41g matrix,gap init=-25, and gap ext=-5). For each sequence, the confidence in AluJr as the correct annotation was captured.The dark blue line shows the average AluJr confidence per bin, and the shaded region shows the range of a singlestandard deviation.
of low confidence because that region of the genome is equally-well explained by several other Alu
subfamilies - all of them share equally-low confidence over that region).
Recombination
The presence of many highly-similar TE instances in a genome leads to common occurrence of
non-allelic homologous recombination [12, 13], in which the initial sequence a is replaced in part by
a subsequence of some homolog b. If a and b belong to different subfamilies A and B, respectively,
then the sequence alignment step of annotation is likely to find near-full-length alignments of the
sequence to database representatives of both A and B; the alignment to the A representative will
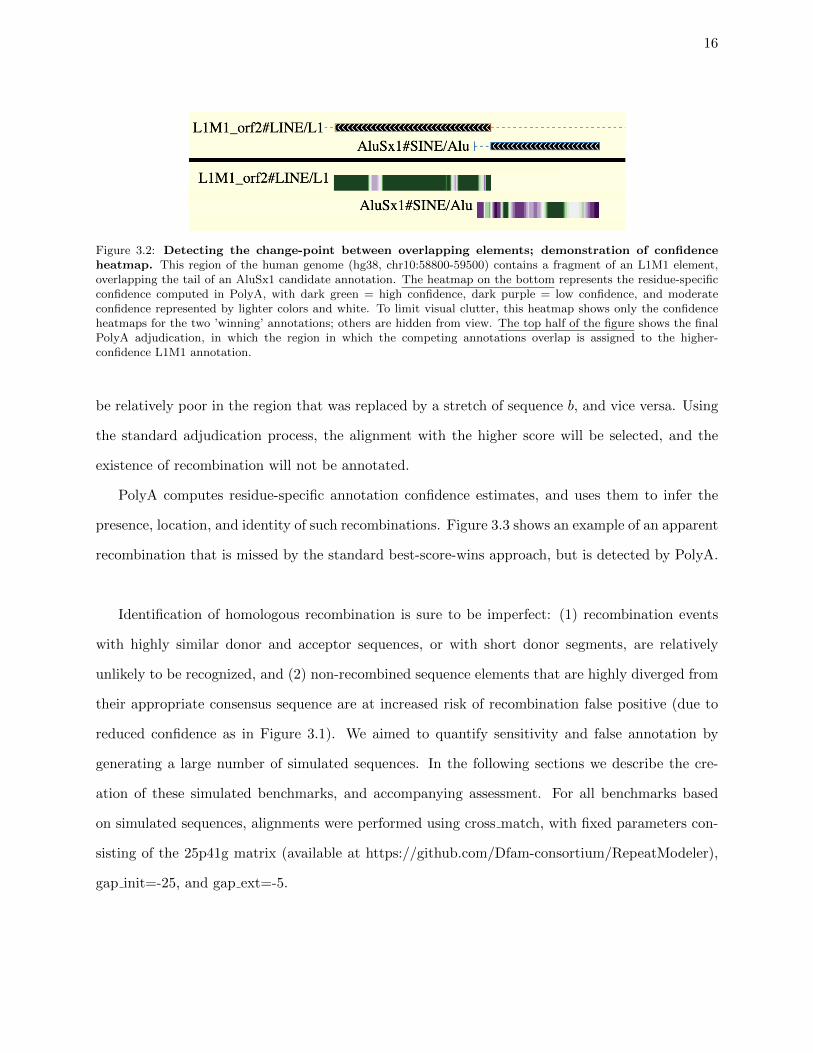
16
Figure 3.2: Detecting the change-point between overlapping elements; demonstration of confidenceheatmap. This region of the human genome (hg38, chr10:58800-59500) contains a fragment of an L1M1 element,overlapping the tail of an AluSx1 candidate annotation. The heatmap on the bottom represents the residue-specificconfidence computed in PolyA, with dark green = high confidence, dark purple = low confidence, and moderateconfidence represented by lighter colors and white. To limit visual clutter, this heatmap shows only the confidenceheatmaps for the two ’winning’ annotations; others are hidden from view. The top half of the figure shows the finalPolyA adjudication, in which the region in which the competing annotations overlap is assigned to the higher-confidence L1M1 annotation.
be relatively poor in the region that was replaced by a stretch of sequence b, and vice versa. Using
the standard adjudication process, the alignment with the higher score will be selected, and the
existence of recombination will not be annotated.
PolyA computes residue-specific annotation confidence estimates, and uses them to infer the
presence, location, and identity of such recombinations. Figure 3.3 shows an example of an apparent
recombination that is missed by the standard best-score-wins approach, but is detected by PolyA.
Identification of homologous recombination is sure to be imperfect: (1) recombination events
with highly similar donor and acceptor sequences, or with short donor segments, are relatively
unlikely to be recognized, and (2) non-recombined sequence elements that are highly diverged from
their appropriate consensus sequence are at increased risk of recombination false positive (due to
reduced confidence as in Figure 3.1). We aimed to quantify sensitivity and false annotation by
generating a large number of simulated sequences. In the following sections we describe the cre-
ation of these simulated benchmarks, and accompanying assessment. For all benchmarks based
on simulated sequences, alignments were performed using cross match, with fixed parameters con-
sisting of the 25p41g matrix (available at https://github.com/Dfam-consortium/RepeatModeler),
gap init=-25, and gap ext=-5.

17
High confidence that 3’end is a MIRc
Conf
iden
ce
heat
map
Poly
AU
CSC
chr19:15304678-15304839
Figure 3.3: Recombination example. The top panel shows the repeatmasker-adjudicated annotation of human(hg38) chr19:15304678-15304839 as a full-length MIRb element. The bottom panel presents a heatmap of the win-dowed average confidence that serves as the basis of PolyA adjudication, which highlights that in the 3’ end ofthe region, MIRc is the prefered annotation with high confidence. The middle panel shows that PolyA recognizesa recombination between MIR and MIRc at roughly the midpoint of the extant sequence window. The standardrepeatmasker preference for MIRb is due to the fact that it has the largest score of all candidates (MIRb=349,MIR=280, MIRc=290, MIR3=196). In the 3’ half of the annotated region beginning at position 15304742, MIRb’sscore is 269, while MIRc’s score is 290.
False Positive Recombination
We first sought to test the frequency with which PolyA incorrectly identifies a sequence as being
the result of a recombination, specifically: how often does PolyA claim that a sequence element is
derived from two subfamilies, even though the actual sequence is derived from a single subfamily. We
began with Alu sequences: randomly selecting one Alu type (AluS, AluJ, AluY), then one subfamily
within the selected type, among those found in Repbase. The consensus sequence corresponding
to the selected subfamily was mutated with subfamily-specific rates of substitution, insertion, and
deletion. Substitution rates were approximated from existing repeatmasker (RM) annotations,
modeling transitions as twice as likely as transversions. Indel rates and lengths were also chosen
based on RM annotations: an overall length distribution of insertions and deletions (capped at
length 7) was computed from all RM alignments, and used as the basis for randomly selecting indel

18
Figure 3.4: Example of nested insertions. This region of the human genome (hg38, chr11:11990878..11991874)exemplifies nested transposable element insertions. Here, an instance of AluJr was inserted within an instance ofMSTB1, which itself was inserted into an instance of LTR40b. The confidence heatmap is included for reference, anddemonstrates a change-point decision in the context of nested annotations; heatmaps for competing annotations arenot shown, in order to reduce visual clutter. PolyA automates the splicing of inserted elements and stitching of thesurrounding split segments.
lengths; for each benchmark instance, such indels were accumulated until reaching family-specific
indel averages determined from RM annotations. This was repeated 10,000 times, yielding 10,000
sequences that contain no recombination and should be identified as such. These sequences were
aligned to all Alu subfamily consensus sequences using cross match, and adjudicated using PolyA.
Of these Alu sequences, 99.8% were correctly identified as being derived from a single subfamily.
The same procedure was performed to produce 10,000 L1 instances, randomly selecting among all
Repbase L1 subfamilies. Of these, 97.8% were correctly identified as having a single source.
True Positive Recombination
To assess PolyA’s sensitivity in detecting the aftermath of recombination, we performed exper-
iments similar to those above, but now with recombination. Beginning with Alu, we: (i) selected a
pair of distinct Alu subfamily consensus sequences a and b, with uniform probability as described
above, (ii) aligned a and b using cross match, and (iii) identified the middle position i of the align-
ment. If in the resulting sequence halves, either was shorter than 50 nucleotides, the simulation
for this pair was aborted. With surviving simulations, (iv) both a and b were mutated as above,
then (v) a recombinant sequence was created, made up of the prefix of a up to the nucleotide cor-
responding to position i of the alignment and the suffix of b beginning just after the ith position.
This was repeated until 10,000 sequences were successfully generated, producing 10,000 simulated

19
recombined sequences. We call these simulated sequences, with one end from a and one end from
b, ‘single-recombinations’. Each resulting sequence was aligned to all Repbase Alu consensus se-
quences with cross match, residue-specific confidence estimates were computed, and these were
used to label the entire sequence allowing for recombination.
From these simulated Alu single recombinants 55.1% were correctly identified as recombinants.
Among these, 65.2% were assigned to the correct subfamily on both ends of the recombination,
while 96.9% were correctly assigned on at least one half.
A similar procedure was followed to produce L1 single-recombinations. Because Repbase L1
sequences are fragments of a full L1 (corresponding to 3’ end, 5’ end, and internal ORF region),
many pairs do not meaningfully overlap. Furthermore, highly-divergent sequences are unlikely to
produce homologous recombination. We performed an all-vs-all alignment of Repbase L1 consensus
sequences, and identified 1553 alignment regions with length ≥ 100 bp on both sequences and ≥ 90%
identity. With a given sequence-pair, we selected a random breakpoint and produced a recombinant
as above, repeating 7 times for each pair, yielding a total of 10,871 L1 single-recombinations. These
were each aligned using cross match to the full contingent of Repbase L1 consensus sequences, with
resulting alignments input to PolyA. Because PolyA adjudicates between annotation candidates
produced by the alignment tool, it will fail to assign a correct family to a region if the input
from the precursor alignment software does not include the correct family. This occurred in 5
L1 inputs. These have no possibility of being correctly adjudicated and were removed from the
analysis. Of the remaining inputs, 94.8% of simulated L1 recombinants were correctly identified
as recombinants. Among these, 93.6% were assigned to the correct subfamily on both ends of the
recombination, while 99.8% were correctly assigned on at least one half.
True Positive Gene Conversions
We repeated the above experiment for sequences simulating gene conversion, in which an inter-
nal segment of the original sequence is replaced by sequence from a related subfamily. Specifically,
we identified two subfamilies and aligned their consensus sequences a and b as before, then two

20
recombination points i and j were identified at positions 1/3 and 2/3 into the alignment, aborting
construction of sequences where all segments are not atleast 50 nucleotides in length. For the re-
maining simulations both sequences were mutated, and the segment from sequence a corresponding
to alignment positions i through j was replaced with the corresponding segment from sequence b.
As before, 10,000 simulated sequences were produced from the Alu family, and for the L1 fam-
ily 1228 alignment regions ≥ 90% identity and that fulfill the length requirement were identified.
Repeating the gene conversion sequence construction described above 9 times for each pair we pro-
duced 11052 sequences. For these ‘internal recombinations’, 4 L1s were thrown out because input
alignments from cross match did not include the correct subfamily alignments. Among surviving
instances, only 2.7% of simulated Alus were correctly identified as containing an internal recom-
bination, while 18.1% were correctly identified as resulting from some recombination (i.e. were
annotated as a single-recombinant). For L1 simulations, 56.5% were correctly identified as being
the result of internal recombination, while 63.3% were correctly identified is being the result of
some recombination(s) (i.e. at least one part of the recombination was recognized).
In both experiments, the low recombination sensitivity in Alus is not particularly surprising,
since the nucleotides typically used to discriminate one of the subfamilies may not even have made
it into the final recombinant sequence. Particularly for internal recombinations, the component
sequences are all typically short enough that discriminating nucleotides are likely to be missing,
leading to annotation ambiguity.
Stitching Annotations Fragmented by Nested Insertions
It is common to find a single instance of a younger TE (sub)family inserted inside an instance
of an older TE (sub)family. A goal of PolyA is to support the automatic stitching of the segments
separated by such (possibly-nested) insertions. This is achieved by repeatedly identifying an in-
serted element, splicing it from between the sequence fragments that it separated, then repeating
the labeling process on the resulting stitched sequences. This procedure is repeated until no ap-
parent insertions are observed (see Methods for details). Figure 3.4 shows a genomic region with

21
nested inserted elements. PolyA first identified a series of confidently-annotated segments, then
spliced the inner-most element (AluJr4), stitching the remaining sequence around the excision. The
resulting full-length MSTA1 was then spliced, so that the surrounding LTR40a instance could be
stitched, and identified in full.
To assess the efficacy of PolyA’s annotation stitching mechanism, we simulated 3 classes of
nested architectures, which we represent here as short strings: ABA (a single fragment of family
B inserted into an instance of family A), ABACA (distinct fragments from families B and C,each
inserted into an different location in an instance of family A), and ABCBA (a nested insertion, in
which a fragment of family C is inserted into a fragment of family B, which itself is inserted into
an instance of family A).
ABA sequences were simulated by creating 1,000 each of Alu1-Alu2-Alu1 (with Alu2 being
a younger subfamily than Alu1), MER-Alu-MER, and MIR-MER-MIR amalgams. These are not
meant to be exhaustive, but are representative of the kinds of insertions seen in the human genome.
Alu families were selected as above, and others were selected randomly. In each case, the inner
sequence was trimmed to retain the middle 2/3 of its length, and inserted into the middle of the
outer sequence, splitting the outer sequence, but not replacing it. Trimming of the inner sequence
was performed in order to replicate the common situation in TE annotation in which the boundary
between inserted and surrounding sequence is unclear; this is a decidedly artificial arrangement, but
it replicates the challenge faced during adjudication. Each of these 3,000 were aligned against the
entire Repbase database, with results fed to PolyA. Of these, 182 sequences were filtered because
the correct families were not among the cross match results.
ABACA sequences were simulated by creating 1,000 each of LTR-L11-LTR-L12-LTR (in which
L11 and L12 are two distinct L1 subfamilies), HAL1-Alu1-HAL1-Alu2-HAL1 (with distinct subfam-
ilies Alu1 and Alu2), and L2-MER1-L2-MER2-L2 (with distinct subfamilies MER1 and MER2). In
all other ways, these are produced as with the ABA format. Of these, 172 were filtered because
the correct families were not among the cross match results.
ABCBA sequences were simulated by creating 1,000 each of HAL1-MER-Alu-MER-HAL1, L4-

22
MST-Alu-MST-L4, and L2-LTR-MST-LTR-L2. Of these, 122 were filtered due to failed cross match
results.
Table 3.1 shows that the correct nesting architecture was usually identified, as were the correct
subfamilies.
Table 3.1: Accuracy results when annotating nested sequences.
correct nesting architecture correct families
ABA 93.3% 83.4%
ABACA 77.8% 92.4%
ABCBA 68.1% 92.2%
Accurate Boundary Locations
To evaluate the accuracy of boundary point detection in PolyA, we computed the distance
between estimated and true boundaries for all artificial sequences described in the experiments
above (distance = |actual - detected|). The mean and median boundary detection error produced
by PolyA is 5 and 9 nucleotides, respectively. Figure 3.5 shows the distribution of boundary
detection error. Precise accuracy statistics depend on specifics of benchmark creation, alignment
software choice, and aligner parameterization, but these results suggest that PolyA is effective at
identifying cross-point boundaries.
Short tandem repeats
When annotating genomic sequences, it is common to mask short tandem repeats (STRs) prior
to alignment-based annotation, either hard-masking (changing a masked region to a sequence of Ns
so that alignment software assigns no score to alignments to the masked region) or soft-masking
(marking a region such that that it will not serve as the seed of an alignment, but can be used
in scoring after seeding is complete). PolyA accepts scored STR annotations from ULTRA [9]
among candidate annotations. The left side of Fig 3.6 demonstrates how this may effectively

23
Figure 3.5: Boundary accuracy. To evaluate the accuracy of boundary point detection in PolyA, we computedthe distance between estimated and true boundaries for all artificial sequences described above. All 24,961 simulatedsequences that were correctly-labeled as recombinations or nestings were used. The boundary error for each annotationwas assigned to a bin of size 2. In 90% of all such annotations, the predicted boundary was within 20 nucleotides ofthe true boundary.
allow an STR to out-compete a potential fragmentary family annotation (replacing a weak L1MC4
fragment annotation seen on UCSC based on repeatmasker’s default adjudication) with the more
appropriate STR call. The right side of Fig 3.6 shows an example of an STR candidate that is
out-competed by the A-rich 3’ tail of an AluSz annotation.
In practice, it is likely still useful to soft-mask a genome prior to annotation, in order to limit
excessive run time caused by evaluating alignments seeded in STR regions. Even so, by enabling
direct competition between annotations from a library (by sequence alignment) or of STRs (as by
ULTRA), PolyA provides substantially better fine-grained resolution of annotation near repetitive
regions.

24
High confidence TR call leads to correct label(instead of spurious L1MC4 call on UCSC Browser)
Conf
iden
ce
heat
map
Poly
AUC
SCGe
nom
eBr
owse
r
chr1:14632106..146333918
High confidence TR call does not override poly-A tail of Alu
Figure 3.6: Adjudicating short tandem repeats. The top section shows the annotation of hg38,chr1:14632106..146333918 as presented on the UCSC genome browser, which is derived from the standard adju-dication results in repeatmasker, using ProcessRepeats. This process aligns the library against genomic sequencethat has first been masked for tandem repeats using TRF; it reports a short L1MC4 fragment of dubious accuracy(left), and a reasonable full-length AluSg annotation (right). The middle section shows the annotation producedwhen candidate annotations from repeatmasker (TEs) and ULTRA (tandem repeats) are adjudicated using PolyA; itidentifies the dubious L1MC4 fragment instead as a tandem repeat (left), and agrees on the Alu designation on theright (though subtle confidence differences lead to an AluSz assignment). The bottom section presents a confidenceheatmap over the region. Of particular interest is the poly-A region on the far right of the plot; ULTRA correctlyidentifies this region as repetitive, but continuity with the preceding Alu annotation causes the region to be correctlylabeled as part of the Alu.

25
CHAPTER 4 DISCUSSION
PolyA produces annotation confidence estimates for biological sequences based on an input of
candidate sequence alignments and underlying scoring matrices. These confidence estimates are
computed on a per-residue basis, and used to infer transitions between overlapping annotations,
including those caused by recombination and (possibly-nested) insertion of one element into another.
We have demonstrated the efficacy of PolyA on multiple simulated scenarios, and shown that it
produces reasonable results on the human genome. We are currently working to incorporate PolyA
into the RepeatMasker software package for transposable element annotation.
PolyA often fails to identify recombination among instances of highly similar Alu elements - this
is not surprising because (i) genomic Alu fragments are often short (e.g. less than 50 nucleotides),
and thus unable to accumulate enough support to overcome transition penalties, and (ii) Alu sub-
family sequences are highly similar, often differing by only a few nucleotides. We view this as
a feature, not a failure. Importantly, PolyA produces confidence values for all annotations, and
is therefore able to communicate the diminished confidence resulting from alignments to multiple
highly-similar sequence elements, as with highly similar Alu subfamilies. We expect both the an-
notation tracing and confidence measures to contribute to future improvements in genome browser
presentation of annotations.
In the current release, PolyA adjudicates annotations based on only nucleotide sequence-to-
sequence alignments using scoring matrices, supplemented with tandem repeat annotations from
ULTRA [9]. In a future release, PolyA will accept (i) annotations of protein sequences, and (ii) align-
ments made with profile hidden Markov models, which are the basis of sequence-family databases
such as Dfam [1] and Pfam [2].

26
In its current form, PolyA naively adjudicates between candidate annotations without regard
for additional information that expert systems currently use to improve annotation quality. In the
future, we will explore approaches such as (i) adjusting transition penalties to prefer full length
insertions when supported (akin to preferring global alignment [14]), and (ii) adjusting transition
penalties based on relative apparent divergence of a sequence window to its candidate annotation.

27
BIBLIOGRAPHY
[1] R. Hubley, R. D. Finn, J. Clements, S. R. Eddy, T. A. Jones, W. Bao, A. F. Smit, and
T. J. Wheeler, “The dfam database of repetitive dna families,” Nucleic acids research, vol. 44,
no. D1, pp. D81–D89, 2016.
[2] S. El-Gebali, J. Mistry, A. Bateman, S. R. Eddy, A. Luciani, S. C. Potter, M. Qureshi, L. J.
Richardson, G. A. Salazar, A. Smart et al., “The pfam protein families database in 2019,”
Nucleic acids research, vol. 47, no. D1, pp. D427–D432, 2019.
[3] E. P. Nawrocki, S. W. Burge, A. Bateman, J. Daub, R. Y. Eberhardt, S. R. Eddy, E. W.
Floden, P. P. Gardner, T. A. Jones, J. Tate et al., “Rfam 12.0: updates to the rna families
database,” Nucleic acids research, vol. 43, no. D1, pp. D130–D137, 2015.
[4] Smit, AFA. Hubley, R., Green, P., “Repeatmasker open-4.0.2013-2015,” 2013. [Online].
Available: http://www.repeatmasker.org/
[5] K. Carey, G. Patterson, and T. Wheeler, “Transposable element subfamily annotation is un-
reliable,” Mobile DNA (in review, preprint), 2020.
[6] Y.-K. Yu and S. F. Altschul, “The construction of amino acid substitution matrices for the
comparison of proteins with non-standard compositions,” Bioinformatics, vol. 21, no. 7, pp.
902–911, 2005.
[7] M. C. Frith, “How sequence alignment scores correspond to probability models,” Bioinformat-
ics, vol. 36, no. 2, pp. 408–415, 2020.
28
[8] A.-K. Schultz, M. Zhang, T. Leitner, C. Kuiken, B. Korber, B. Morgenstern, and M. Stanke,
“A jumping profile hidden markov model and applications to recombination sites in HIV and
HCV genomes,” BMC bioinformatics, vol. 7, no. 1, p. 265, 2006.
[9] D. Olson and T. Wheeler, “Ultra: A model based tool to detect tandem repeats,” in Proceedings
of the 2018 ACM International Conference on Bioinformatics, Computational Biology, and
Health Informatics, 2018, pp. 37–46.
[10] S. F. Altschul, W. Gish, W. Miller, E. W. Myers, and D. J. Lipman, “Basic local alignment
search tool,” Journal of molecular biology, vol. 215, no. 3, pp. 403–410, 1990.
[11] Green, P., “Phrap and cross match.” [Online]. Available: http://www.phrap.org/phredphrap/
phrap.html
[12] J. A. Fawcett and H. Innan, “The role of gene conversion between transposable elements in
rewiring regulatory networks,” Genome biology and evolution, vol. 11, no. 7, pp. 1723–1729,
2019.
[13] P. Sung and H. Klein, “Mechanism of homologous recombination: mediators and helicases take
on regulatory functions,” Nature reviews Molecular cell biology, vol. 7, no. 10, pp. 739–750,
2006.
[14] M. Brudno, S. Malde, A. Poliakov, C. B. Do, O. Couronne, I. Dubchak, and S. Batzoglou,
“Glocal alignment: finding rearrangements during alignment,” Bioinformatics, vol. 19, no.
suppl 1, pp. i54–i62, 2003.
[15] W. Bao, K. K. Kojima, and O. Kohany, “Repbase update, a database of repetitive elements
in eukaryotic genomes,” Mobile Dna, vol. 6, no. 1, p. 11, 2015.
[16] A. Harpak, X. Lan, Z. Gao, and J. K. Pritchard, “Frequent nonallelic gene conversion on the
human lineage and its effect on the divergence of gene duplicates,” Proceedings of the National
Academy of Sciences, vol. 114, no. 48, pp. 12 779–12 784, 2017.