polymer chemistry sem-6, dse-b3 molecular weight of
TRANSCRIPT

POLYMER CHEMISTRY
SEM-6, DSE-B3MOLECULAR WEIGHT OF POLYMERS
PART-2, PPT-23
Dr. Kalyan Kumar Mandal
Associate Professor
St. Paul’s C. M. College
Kolkata

Polymer ChemistryMolecular Weight of Polymers: Part-2
Contents
• The Number-Average Molecular Weight ( ഥ𝑴n)
• The Weight-Average Molecular Weight ( ഥ𝑴w)
• Viscosity-Average Molecular Weight ( ഥ𝑴v)
• Molecular Weight Averages
• Determination of the Number-Average Molecular Weight: Colligative Properties: Osmotic Pressure

Number-Average Molecular Weight
• Since typical polymers consist of mixtures of many molecular species of (nearly) identical
chemical structure but varying in chain length or molecular weight, molecular weight
methods always yield average values. The molecules produced in polymerization reactions
have lengths that are distributed in accordance with a probability function which is governed
by the mechanism of the reaction and by the conditions under which it has been carried out.
• The measurement of the colligative properties in effect counts the number of moles of solute
per unit weight of sample. This number is the sum over all molecular species of the number
of moles Ni of each species present:
𝒊
∞
𝑵𝒊
• The total weight w of the sample is similarly the sum of the weights of each molecular
species,
𝒘 =𝒊
∞
𝒘𝒊 =𝒊
∞
𝑵𝒊𝑴𝒊
This Lecture is prepared by Dr. K. K. Mandal, SPCMC, Kolkata

Number-Average Molecular Weight
• The average molecular weight given by these methods is known as the number average
molecular weight, 𝑀n. ഥ𝑴n is defined as the total weight w of all the molecules in a polymer
sample divided by the total number of moles present. Thus the number-average molecular
weight is expressed in Equation 1 where the summations are over all the different sizes of
polymer molecules from i = 1 to i = ∞ and Ni is the number of moles whose weight is Mi. By
the definition of molecular weight as weight of sample per mole,
𝑴𝒏 =σ𝒊𝒘𝒊
σ𝒊𝑵𝒊=σ𝒊𝑵𝒊𝑴𝒊
σ𝒊𝑵𝒊=
σ𝒊𝒘𝒊
σ𝒊(𝒘𝒊𝑴𝒊)−−−−𝑬𝒒𝒖𝒂𝒕𝒊𝒐𝒏 𝟏
• The number-average molecular weight ഥ𝑀n is determined by experimental methods that count
the number of polymer molecules in a sample of the polymer. The methods for measuring ഥ𝑀n
are those that measure the colligative properties of solutions-vapour pressure lowering
(vapour pressure osmometry), freezing point depression (cryoscopy), boiling point elevation
(ebulliometry), and osmotic pressure (membrane osmometry).
This Lecture is prepared by Dr. K. K. Mandal, SPCMC, Kolkata

Number-Average Molecular Weight• The colligative properties are the same for small and large molecules when comparing
solutions at the same molal (or mole fraction) concentration. For example, a 1-molal solution
of a polymer of molecular weight 105 has the same vapour pressure, freezing point, boiling
point, and osmotic pressure as a 1-molal solution of a polymer of molecular weight 103 or a
1-molal solution of a small molecule such as hexane.
• Equation 1 can also be written as,
𝑴𝒏 =
𝒊
𝑵𝒊𝑴𝒊 −−− −𝑬𝒒𝒖𝒂𝒕𝒊𝒐𝒏 𝟐
where 𝑵𝒊 is the mole fraction (or the number-fraction) of molecules of size Mi.
• The most common methods for measuring ഥ𝑴𝒏 are membrane osmometry and vapour pressure
osmometry since reasonably reliable commercial instruments are available for those methods.
Vapour pressure osmometry, which measures vapour pressure indirectly by measuring the
change in temperature of a polymer solution on dilution by solvent vapour, is generally useful
for polymers with ഥ𝑴𝒏 below 10,000-15,000.
This Lecture is prepared by Dr. K. K. Mandal, SPCMC, Kolkata

Number-Average Molecular Weight• Above that molecular weight limit, the quantity being measured becomes too small to detect
by the available instruments. Membrane osmometry is limited to polymers with ഥ𝑴𝒏 above
about 20,000-30,000 and below 500,000. The lower limit is a consequence of the partial
permeability of available membranes to smaller-sized polymer molecules. Above molecular
weights of 500,000, the osmotic pressure of a polymer solution becomes too small to measure
accurately.
• End-group analysis is also useful for measurements of ഥ𝑴n for certain polymers. For example,
the carboxyl end groups of a polyester can be analyzed by titration with base and carbon-
carbon double bond end groups can be analyzed by 1H NMR. Accurate end-group analysis
becomes difficult for polymers with ഥ𝑴𝒏values above 20,000-30,000.
• Evaluation of number average molecular weight is useful in understanding the
polymerization mechanism and kinetics. It also assumes prime importance in determining the
solution properties of the polymer, commonly known as the colligative properties. Polymer
molecules of lower molecular weight contribute equally and enjoy equal status with those of
higher molecular weight in determining these properties.
This Lecture is prepared by Dr. K. K. Mandal, SPCMC, Kolkata
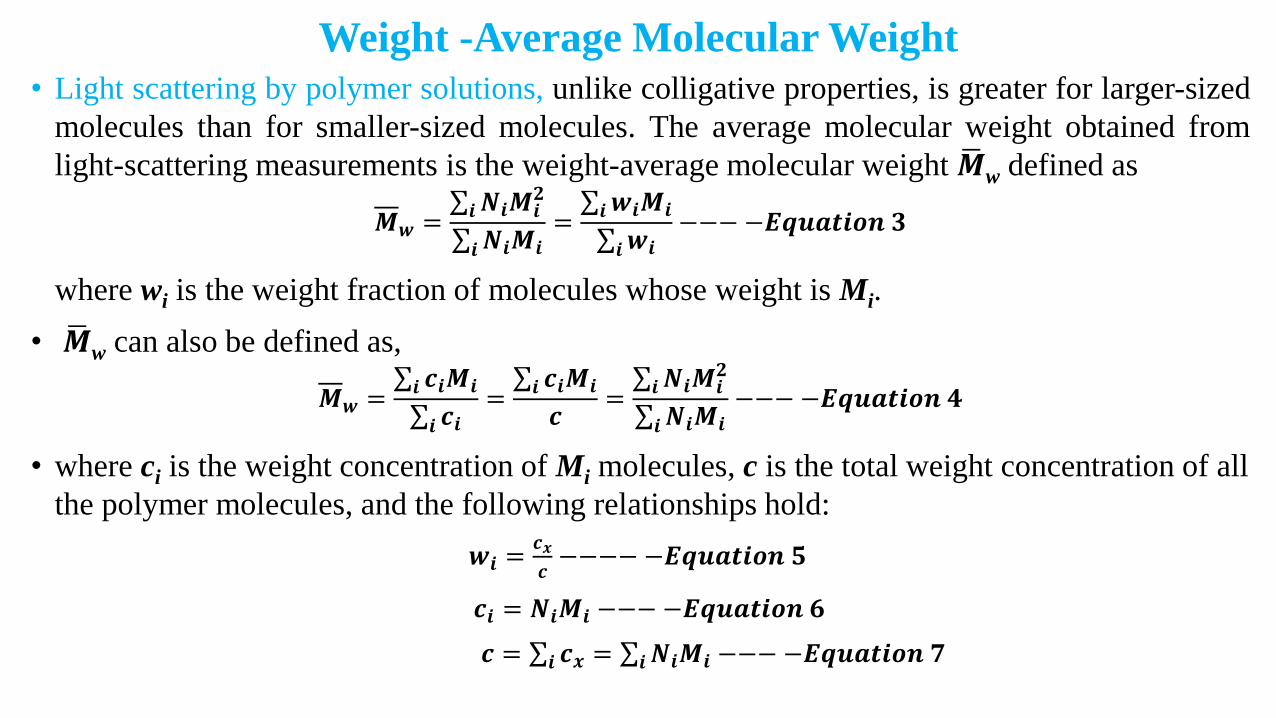
Weight -Average Molecular Weight• Light scattering by polymer solutions, unlike colligative properties, is greater for larger-sized
molecules than for smaller-sized molecules. The average molecular weight obtained from
light-scattering measurements is the weight-average molecular weight ഥ𝑴w defined as
𝑴𝒘 =σ𝒊𝑵𝒊𝑴𝒊
𝟐
σ𝒊𝑵𝒊𝑴𝒊=σ𝒊𝒘𝒊𝑴𝒊
σ𝒊𝒘𝒊−−−−𝑬𝒒𝒖𝒂𝒕𝒊𝒐𝒏 𝟑
where wi is the weight fraction of molecules whose weight is Mi.
• ഥ𝑴w can also be defined as,
𝑴𝒘 =σ𝒊 𝒄𝒊𝑴𝒊
σ𝒊 𝒄𝒊=σ𝒊 𝒄𝒊𝑴𝒊
𝒄=σ𝒊𝑵𝒊𝑴𝒊
𝟐
σ𝒊𝑵𝒊𝑴𝒊−−−−𝑬𝒒𝒖𝒂𝒕𝒊𝒐𝒏 𝟒
• where ci is the weight concentration of Mi molecules, c is the total weight concentration of all
the polymer molecules, and the following relationships hold:
𝒘𝒊 =𝒄𝒙
𝒄−−−−−𝑬𝒒𝒖𝒂𝒕𝒊𝒐𝒏 𝟓
𝒄𝒊 = 𝑵𝒊𝑴𝒊 −−−−𝑬𝒒𝒖𝒂𝒕𝒊𝒐𝒏 𝟔
𝒄 = σ𝒊 𝒄𝒙 = σ𝒊𝑵𝒊𝑴𝒊 −−−−𝑬𝒒𝒖𝒂𝒕𝒊𝒐𝒏 𝟕

Weight -Average Molecular Weight
• Since the amount of light scattered by a polymer solution increases with molecular weight,
this method becomes more accurate for higher polymer molecular weights. There is no upper
limit to the molecular weight that can be accurately measured except the limit imposed by
insolubility of the polymer. The lower limit of ഥ𝑴w by the light scattering method is close to
5000-10,000. Below this molecular weight, the amount of scattered light is too small to
measure accurately.
• Weight average molecular weight is important in relation to bulk properties of polymers that
reflect their load bearing capacity. Softening, hot deformation, tensile and compressive
strength, modulus and elongation, toughness and impact resistance and some other related
bulk properties of polymer are better appreciated on the basis of weight average molecular
weight, keeping in mind, however, the influence of chemical nature of the repeat units,
degree of branching and cross-linking, thermal or thermomechanical history of the sample.
This Lecture is prepared by Dr. K. K. Mandal, SPCMC, Kolkata

Viscosity-Average Molecular Weight
• Solution viscosity is also useful for molecular-weight measurements. Viscosity, like light
scattering, is greater for the larger-sized polymer molecules than for smaller ones. However,
solution viscosity does not measure ഥ𝑴w since the exact dependence of solution viscosity on
molecular weight is not exactly the same as light scattering.
• Solution viscosity measures the viscosity-average molecular weight ഥ𝑴v defined by
𝑴𝒗 = [
𝒊
𝒘𝒊𝑴𝒊𝒂]𝟏𝟐] = [
σ𝒊𝑵𝒊𝑴𝒊𝟏+𝒂
σ𝒊𝑵𝒊𝑴𝒊]𝟏𝒂−−−−𝑬𝒒𝒖𝒂𝒕𝒊𝒐𝒏 𝟖
where a is a constant.
• The viscosity- and weight-average molecular weights are equal when a is unity. ഥ𝑴v is lessthan ഥ𝑴w for most polymers, since a is usually in the range 0.5-0.9. However, ഥ𝑴v is muchcloser to ഥ𝑴w than ഥ𝑴n, usually within 20% of ഥ𝑴w. The value of a is dependent on thehydrodynamic volume of the polymer, the effective volume of the solvated polymermolecule in solution, and varies with polymer, solvent, and temperature.
This Lecture is prepared by Dr. K. K. Mandal, SPCMC, Kolkata

Molecular Weight Averages
• More than one average molecular weight is required to reasonably characterize a polymer
sample. There is no such need for a monodisperse product (i.e., one composed of molecules
whose molecular weights are all the same) for which all three average molecular weights are
the same. The situation is quite different for a polydisperse polymer where all three
molecular weights are different if the constant a in Equation 8 is less than unity, as is the
usual case. A careful consideration of Equations 1 through 2 shows that the number-,
viscosity-, and weight-average molecular weights, in that order, are increasingly biased
toward the higher-molecular-weight fractions in a polymer sample. For a polydisperse
polymer
𝑴𝒘 > 𝑴𝒗 > 𝑴𝒏
• with the differences between the various average molecular weights increasing as the
molecular-weight distribution broadens. A typical polymer sample will have the molecular
weight distribution shown in Figure 1 the approximate positions of the different average
molecular weights are indicated on this distribution curve.
This Lecture is prepared by Dr. K. K. Mandal, SPCMC, Kolkata

Molecular Weight Averages• For most practical purposes, one usually characterizes the molecular weight of a polymer
sample by measuring 𝑴𝒏 and either 𝑴𝒘 or 𝑴𝒗 . 𝑴𝒗 is commonly used as a close
approximation of 𝑴𝒘, since the two are usually quite close (within 10–20%). Thus in most
instances, one is concerned with the 𝑴𝒏 and 𝑴𝒘 of a polymer sample. The former is biased
toward the lower-molecular-weight fractions, while the latter is biased toward the higher-
molecular weight fractions.
• The ratio of the two average molecular weights
𝑴𝒘/𝑴𝒏 depends on the breadth of the distribution
curve (Figure 1) and is often useful as a measure
of the polydispersity in a polymer. The value of
𝑴𝒘 / 𝑴𝒏 would be unity for a perfectly
monodisperse polymer. The ratio is greater than
unity for all actual polymers and increases with
increasing polydispersity.
This Lecture is prepared by Dr. K. K. Mandal, SPCMC, Kolkata

Molecular Weight Averages
• The characterization of a polymer by 𝑴𝒏 alone, without regard to the polydispersity, can
be extremely misleading, since most polymer properties such as strength and melt viscosity
are determined primarily by the size of the molecules that make up the bulk of the sample by
weight.
• Polymer properties are much more dependent on the larger-sized molecules in a sample than
on the smaller ones. Thus, for example, let us consider a hypothetical mixture containing
95% by weight of molecules of molecular weight 10,000, and 5% of molecules of molecular
weight 100 (The low-molecular-weight fraction might be monomer, a low-molecular weight
polymer, or simply some impurity.).
• The 𝑴𝒏 and 𝑴𝒘 are calculated, using the appropriate equations, as 1680 and 9505,
respectively. The use of the 𝑴𝒏 value of 1680 gives an inaccurate indication of the properties
of this polymer.
This Lecture is prepared by Dr. K. K. Mandal, SPCMC, Kolkata

Molecular Weight Averages• The properties of the polymer are determined primarily by the 10,000-molecular-weight
molecules that make up 95% of the weight of the mixture. The weight-average molecular
weight is a much better indicator of the properties to be expected in a polymer. The utility of
𝑴𝒏 resides primarily in its use to obtain an indication of polydispersity in a sample by
measuring the ratio 𝑴𝒘/𝑴𝒏.
• In addition to the different average molecular weights of a polymer sample, it is frequently
desirable and necessary to know the exact distribution of molecular weights. As indicated
previously, there is usually a molecular weight range for which any given polymer property
will be optimum for a particular application. The polymer sample containing the
greatest percentage of polymer molecules of that size is the one that will have the optimum
value of the desired property. Since samples with the same average molecular weight may
possess different molecular weight distributions, information regarding the distribution
allows the proper choice of a polymer for optimum performance.
This Lecture is prepared by Dr. K. K. Mandal, SPCMC, Kolkata

Molecular Weight Averages• The methods that are used in the past to determine the molecular weight distribution of a
polymer sample, e.g., fractional extraction and fractional precipitation are laborious and
determinations of molecular weight distributions were not routinely performed. However, the
development of size exclusion chromatography (SEC), also referred to as gel permeation
chromatography (GPC) and the availability of automated commercial instruments have
changed the situation. Molecular-weight distributions are now frequently performed using
SEC.
• Size exclusion chromatography involves the permeation of a polymer solution through a
column packed with microporous beads of crosslinked polystyrene. The packing contains
beads of different-sized pore diameters. Molecules pass through the column by a
combination of transport into and through the beads and through the interstitial volume (the
volume between beads). Molecules that penetrate the beads are slowed down more in moving
through the column than molecules that do not penetrate the beads; in other words, transport
through the interstitial volume is faster than through the pores.
This Lecture is prepared by Dr. K. K. Mandal, SPCMC, Kolkata

Molecular Weight Averages
• The smaller-sized polymer molecules penetrate all the beads in the column since their
molecular size (actually their hydrodynamic volume) is smaller than the pore size of the
beads with the smallest-sized pores. A larger-sized polymer molecule does not penetrate all
the beads since its molecular size is larger than the pore size of some of the beads. The larger
the polymer molecular weight, the fewer beads that are penetrated and the greater is the
extent of transport through the interstitial volume. The time for passage of polymer molecules
through the column decreases with increasing molecular weight.
• The use of an appropriate detector (refractive index, viscosity, light scattering) measures the
amount of polymer passing through the column as a function of time. This information and a
calibration of the column with standard polymer samples of known molecular weight allow
one to obtain the molecular weight distribution in the form of a plot such as that in Figure 1.
Not only does SEC yield the molecular weight distribution, but 𝑴𝒏 and 𝑴𝒘 (and also 𝑴𝒗 if a
is known) are also calculated automatically. SEC is now the method of choice for
measurement of 𝑴𝒏 and 𝑴𝒘 since the SEC instrument is far easier to use compared to
methods such as osmometry and light scattering.

Determination of the Number-Average Molecular Weight
• The number-average molecular weight, 𝑴𝒏, involves a count of the number of molecules of
each species, NiMi, summed over i, divided by the total number of molecules as shown in
Equation 1. It is the simple average that most people think about. For many simple single-
peaked distributions, 𝑴𝒏 is near the peak (Figure 1).
𝑴𝒏 =σ𝒊𝑵𝒊𝑴𝒊
σ𝒊𝑵𝒊=
σ𝒊𝒘𝒊
σ𝒊(𝒘𝒊𝑴𝒊)−−− −𝑬𝒒𝒖𝒂𝒕𝒊𝒐𝒏 𝟏
• There are two important groups of methods for determining 𝑴𝒏.
1. End-Group Analyses; 2. Colligative Properties
• End-Group Analyses: The first group of methods involves end-group analyses. Many types
of syntheses leave a special group on one or both ends of the molecule, such as hydroxyl and
carboxyl. These can be titrated or analyzed instrumentally by such methods as infrared. For
molecular weights above about 25,000 g mol-1, however, the method becomes insensitive
because the end groups are present in too low a concentration.
This Lecture is prepared by Dr. K. K. Mandal, SPCMC, Kolkata

Colligative Property Measurement
• The second group of methods makes use of the colligative properties of solutions.
Colligative properties depend on the number of molecules in a solution, and not their
chemical constitution. The relations between the colligative properties and molecular weight
for infinitely dilute solutions rest upon the fact that the activity of the solute in a solution
becomes equal to its mole fraction as the solute concentration becomes sufficiently small.
• Colligative properties reflect the chemical potential of the solvent in solution. Alternatively, a
colligative property is a measure of the depression of the activity of the solvent in solution,
compared to the pure state. The activity of the solvent must equal its mole fraction under
these conditions, and it follows that the depression of the activity of the solvent by a solute is
equal to the mole fraction of' the solute.
• The relative applicability of the colligative methods to polymer solutions is demonstrated in
Table 1.
This Lecture is prepared by Dr. K. K. Mandal, SPCMC, Kolkata

Determination of the Number-Average Molecular Weight
• The colligative properties include boiling point elevation (ebulliometry), freezing-point
depression (cryoscopy), vapour pressure lowering, and osmotic pressure (osmometry). The
basic equations for boiling point elevation, and melting point depression may be represented
as the following.
𝐥𝐢𝐦𝒄→𝟎
∆𝑻𝒃𝒄
=𝑹𝑻𝟐
𝝆∆𝑯𝑽
𝟏
𝑴𝒏
−−−−𝑬𝒒𝒖𝒂𝒕𝒊𝒐𝒏 𝟗
𝐥𝐢𝐦𝒄→𝟎
∆𝑻𝒇
𝒄= −
𝑹𝑻𝟐
𝝆∆𝑯𝒇
𝟏
𝑴𝒏
−−−−𝑬𝒒𝒖𝒂𝒕𝒊𝒐𝒏 𝟏𝟎
• where ∆Tb, and ∆Tf are the boiling point elevation, and freezing point depression,
respectively. ρ is the solvent density. ∆Tb and ∆Tf are the latent heats of vaporization and
fusion per gram of solvent, and c is the solute concentration in grams per cubic centimeter.
• The number-average molecular weight ഥ𝑴n, defined below, has been inserted to make the
equations applicable to polydisperse solutes.
𝑴𝒏 =σ𝒊𝑵𝒊𝑴𝒊
σ𝒊𝑵𝒊=
σ𝒊𝒘𝒊
σ𝒊(𝒘𝒊𝑴𝒊)−−− −𝑬𝒒𝒖𝒂𝒕𝒊𝒐𝒏 𝟏

Determination of the Number-Average Molecular Weight
• If the vapour pressure of the solute is small, and the solvent follows Raoult’s vapour
pressure law,𝑷𝟏𝟎 − 𝑷𝟏
𝑷𝟏𝟎 = 𝒙𝟐 −−−−𝑬𝒒𝒖𝒂𝒕𝒊𝒐𝒏 𝟏𝟏
• where 𝑷𝟏𝟎 is the vapour pressure of the pure solvent, P1 is that of the solution, and x2 is the
mole fraction of the solute. The osmotic pressure π depends on the molecular weight as
follows:
𝐥𝐢𝐦𝒄→𝟎
𝝅
𝒄=𝑹𝑻
𝑴𝒏
−−−−𝑬𝒒𝒖𝒂𝒕𝒊𝒐𝒏 𝟏𝟐
• Taking membrane osmometry as an example, Equation 10 can be written separately for
each species i in the mixture present. Omitting the limit sign for convenience and
transposing, one obtains
𝝅𝒊 = 𝑹𝑻𝒄𝒊𝑴𝒊
−−−−𝑬𝒒𝒖𝒂𝒕𝒊𝒐𝒏 𝟏𝟑
This Lecture is prepared by Dr. K. K. Mandal, SPCMC, Kolkata

Determination of the Number-Average Molecular Weight
• Summing over i, σ𝝅𝒊 may be replaced by π, since each solute molecule contributes
independently to the osmotic pressure, and it is to be noted that c = σ𝒄𝒊. The mixture is
then described by an unspecified average molecular weight 𝑀:
𝝅 = 𝑹𝑻𝒄𝒊𝑴𝒊
= 𝑹𝑻𝒄
𝑴−−−−𝑬𝒒𝒖𝒂𝒕𝒊𝒐𝒏 𝟏𝟒
• Solving, one gets
𝑴 =𝒄
σ𝒄𝒊𝑴𝒊
−−−−𝑬𝒒𝒖𝒂𝒕𝒊𝒐𝒏 𝟏𝟓
• For unit volume the c’s may be replaced by w’s. Noting that wi = MiNi shows that 𝑴 = 𝑴𝒏.
End-group methods as well as colligative methods give the number-average molecular
weight. The number average is very sensitive to changes in the weight fractions of low-
molecular-weight species, and relatively insensitive to similar changes for high-molecular-
weight species.
This Lecture is prepared by Dr. K. K. Mandal, SPCMC, Kolkata

Determination of the Number-Average Molecular Weight
• Though the osmotic pressure is inversely proportional to solute molecular weight, the
relatively large, measurable values of osmotic pressure (π) obtained even for dilute solutions
make osmotic pressure measurements valuable in determining molecular weights of
substances with high molecular weights like polymers.
• Typical values for the colligative properties for a polymer having a molecular weight of
20,000 g/mol are shown in Table 1. Only osmotic pressure is large enough for fruitful
studies at this molecular weight or higher.
Table 1: Comparison of the Colligative Solution properties of a
1% polymer solution with M = 20000 g/mol
Property Value
Vapour pressure lowering 4.0 x 10⁻³ mm Hg
Boiling point elevation 1.3 x 10⁻³ °C
Freezing point depression 2.5 x 10⁻³ °C
Osmotic pressure 15 cm solvent
This Lecture is prepared by Dr. K. K. Mandal, SPCMC, Kolkata

Osmotic Pressure: Thermodynamic Basis
• Polymer solutions exhibit osmotic pressures because the chemical potentials of the pure
solvent and the solvent in the solution are unequal. Because of this inequality, there is a net
flow of solvent, through a connecting membrane, from the pure solvent side to the solution
side. When sufficient pressure is built up on the solution side of the membrane, so that the
two sides have the same activity, equilibrium will be restored.
• While the discussion above gives an exact thermodynamic interpretation of the
phenomenon, a consideration in terms of the number of solute molecules per unit volume is
useful for practical calculations. An analogy exists between Equation 12 and the ideal gas
law:𝑷𝑽 = 𝒏𝑹𝑻 −−− −𝑬𝒒𝒖𝒂𝒕𝒊𝒐𝒏 𝟏𝟔
• Where n is in moles, as usual. The quantity n/V is equal to c/M, yielding
𝑷 =𝒄
𝑴𝑹𝑻 −−− −𝑬𝒒𝒖𝒂𝒕𝒊𝒐𝒏 𝟏𝟕
• Setting the gas pressure equal to the osmotic pressure, P = π, and rearranging, Equation 12
is obtained.
This Lecture is prepared by Dr. K. K. Mandal, SPCMC, Kolkata

Instrumentation
• A typical static osmometer design includes a membrane that permeates only the solvent, a
capillary, and a reference capillary. Typical membranes are made from regenerated cellulose
or other microporous materials. Such an instrument usually requires 24 h to reach
equilibrium.
• There are now several types of automatic osmometers that operate with essentially zero flow
and that reach equilibrium very rapidly, usually within minutes. Osmotic equilibrium depends
on an equal and opposite pressure being developed. The critical part of their design relates to
the method of automatic adjustment of the osmotic pressure of the solution side so that the
activity of the two sides is equal.
• Since several concentrations usually need to be run, the time required to determine a
molecular weight by osmometry has been reduced from a week to a few hours by these
automatic instruments.
This Lecture is prepared by Dr. K. K. Mandal, SPCMC, Kolkata

The Flory θ-Temperature
• The basis for determining the molecular weight by osmometry has been given in Equation
12. At finite concentrations, interactions between the solvent and the solute result in the virial
coefficients A2, A3, and so on. The full equation may be written𝝅
𝒄= 𝑹𝑻
𝟏
𝑴𝒏+ 𝑨𝟐𝒄 + 𝑨𝟑𝒄
𝟐 +⋯ −−−−𝑬𝒒𝒖𝒂𝒕𝒊𝒐𝒏 𝟏𝟖
• Interactions between one polymer molecule and the solvent result in the second virial
coefficient, A2. Multiple polymer-solvent interactions produce higher virial coefficients, A3,
A4, and so on. A further interpretation of the virial coefficients is considered along with
solution theory. For medium molecular weights, the slope is substantially linear below about
1% solute concentration. Of course, 𝑨𝟏 =𝟏
𝑴𝒏.
• The quantity A2 depends on both the temperature and the solvent, for a given polymer. A
unique and much desired state arises when A2 equals zero. The temperature at which this
condition holds is called the Flory θ-temperature.
This Lecture is prepared by Dr. K. K. Mandal, SPCMC, Kolkata

The Flory θ-Temperature
• In this state, π/c is independent of concentration, so that only one concentration need be
studied to determine 𝑀𝑛. Since it is also the state where an infinite molecular weight polymer
just precipitates and χ1= 0.5, considerable care must be taken to keep the polymer in solution.
Table 2 presents a selected list of polymers and their theta solvents.
Table 2: Polymers and their θ-solvents
Polymer Solvent Temperature (°C)
cis-Polybutadiene n-Heptane -1
Polyethylene Biphenyl 125
Poly(n-butyl acrylate) Benzene/methanol (52/48) 25
Polystyrene Cyclohexane 34
Poly(oxytetramethylene) Chlorobenzene 25
• It must be emphasized that molecular weights determined by any of the colligative
properties, osmometry in particular, are absolute molecular weights; that is, the values are
determined by theory and not by prior calibration. The practical limit of osmometry is about
500,000 g/mol because the pressures become too small.
This Lecture is prepared by Dr. K. K. Mandal, SPCMC, Kolkata