polypropylene (pp) has become one of the mostpolypropylene (pp) has become one of the most widely...
TRANSCRIPT


Polypropylene (PP) has become one of the most widely used commercial polyolefins. PP is obtained through chemical synthesis with Ziegler-Natta and metallocene catalyst which produce highly linear, highly stereospecific polymers and relative narrow molecular weight distribution
H2C CH
CH3 Polymerization
iPP

Commercial isotactic PP (iPP) possesses many excellent properties, such as : Low density ~ 0.96 g/cm3
High melting temperature ~ 170°C
Good chemical resistance
Low production cost
Stiffness and Reusability
However, iPP is a linear polymer, which has relative low
melt strength and exhibits no strain hardening behavior in
the molten state.

The fluids that exhibit strain hardening have micro estructural interactions that offers resistance to molecular alignment in the direction of flow
Zhenjiang et al.Polymer 53 (2012) 121-129
Extension

PP with highly linear chains has limitations to be used in applications such as thermoforming, foaming, blow molding, film molding because the extensional deformation present in these processes is a key property.
Blow
n m
oldi
ng
Blow
n fi
lm
Foam
ing

The most effective strategy to improve extensional performance is to modify the topology of linear molecules incorporating long branches in order to increase the restrictions on molecular mobility improving the behavior of the material in extensional flow
Mb > Mc = 2Me ≈ 14 Kg/mol

The generation of branches onto the backbone of commercial PP has been achieved for different methods: Polymerization in situ: in this process the branches are generated simultaneously with the polymerization reaction. Irradiation: the generation of macroradicals is through macromolecular excitation using different doses of electron beam irradiation or electro-magnetic waves. Reactive extrusion: this process involves chemical attack of PP in the molten state in presence of an appropiate peroxide and polyfunctional monomers able to promote the generation of branches.

Modify the topology of the iPP generating long branches in its molecular structure by reactive mixing in the molten state, in order to improve their performance in elongational flow.
iPP LCBPP
Reactive mixing

PPg (1% AM) Mw=120 Kg/mol PD=2.6
Branching agent
Reaction in molten state 190 C
LCB PP
Purification
Characterization
Brabender Plastograph® 40 rpm during 15 min
Rheology (AR-G2 TA Instruments) using a 25 mm plate-plate geometry.
Espectroscopy IR (Nicolet, Madison, WI; model 5210) operating at a resolution of 4 cm-, using films of 100 μm
SEC (PgGlicerol) DSC (PgGlicerol y PgEpoxi)
Glycerol Epoxy resin 1,4 Butanediol p-Phenylendiamine

Branching Agent (Abbreviation) Chemical structure % p/p Characterization
Glycerol (PgG)
0.1 0.3 0.5 1 5
IR, Rheology, SEC and DSC
Epoxy resin (PgEp)
0.65 1.9 2.5 3.2
IR, Rheology and DSC
1,4 Butanediol (PgBOH)
0.3 0.9 2.3 3.0 4.5
IR, Rheology and DSC
p-Phenylendiamine (PgFDA)
0.11 0.21 0.34
IR and Rheology
OH OHOH
OHOH
O
OH
O
H2C CH CH CH CH2
H2N NH2

O
OO
OH OH
O
OO
HO
O
O O
H O
OH
OH
+
1792 cm-1
1784 cm-1
1735cm-1
1710 cm-1
Branching agent Glycerol

2800 2400 2000 16002600 2200 1800
Wavenumbers (cm-1)
Abs
orba
n ce
(a.u
. )
Pg
PgG01
PgG03
PgG05
PgG1
PgG5
FTIR spectra of PPgAM + Glycerol
1792 cm-1 1784 cm-1
1735cm-1
Signals at 1792 and 1860 cm-1 are due to C=O stretching of free succinic anhydride, and signal at 1780 cm-1 assigned to poly(maleic anhydride. Bands at 1715 and 1735 cm-1 assigned to stretching of the carboxylic acid group and carboxylic ester group respectively.
FTIR spectroscopy

3 4 5 6 73.5 4.5 5.5 6.5 7.5
Log M
0
0.2
0.4
0.6
0.1
0.3
0.5
0.7
Nor
ma l
ize d
Wt F
r
PgG5PgG1PgG05PgG03PgG01Pg
Molecular weight distribution of Pg and its modifications
Molecular Characterization

Mark-Houwink plot of the initial Pg and the
modified samples
Sample Mw (103 g/mol)* Mw/Mn NLCB
PPg 117 2.7 0 PPg01G 147 3.1 ~0
PPg03G 351 6.6 0.08
PPg05G 590 6.2 0.30
PPg1G 625 3.1 0.40
PPg5G 669 2.8 0.62
* Obtained by triple detection
Molecular Characterization
4.4 4.6 4.8 5 5.2 5.4 5.6 5.8 6 6.2 6.4
Log Mw
-0.6
-0.5
-0.4
-0.3
-0.2
-0.1
0
0.1
0.2
0.3
Log
[η]
PgPgG01PgG03PgG05PgG1PgG5
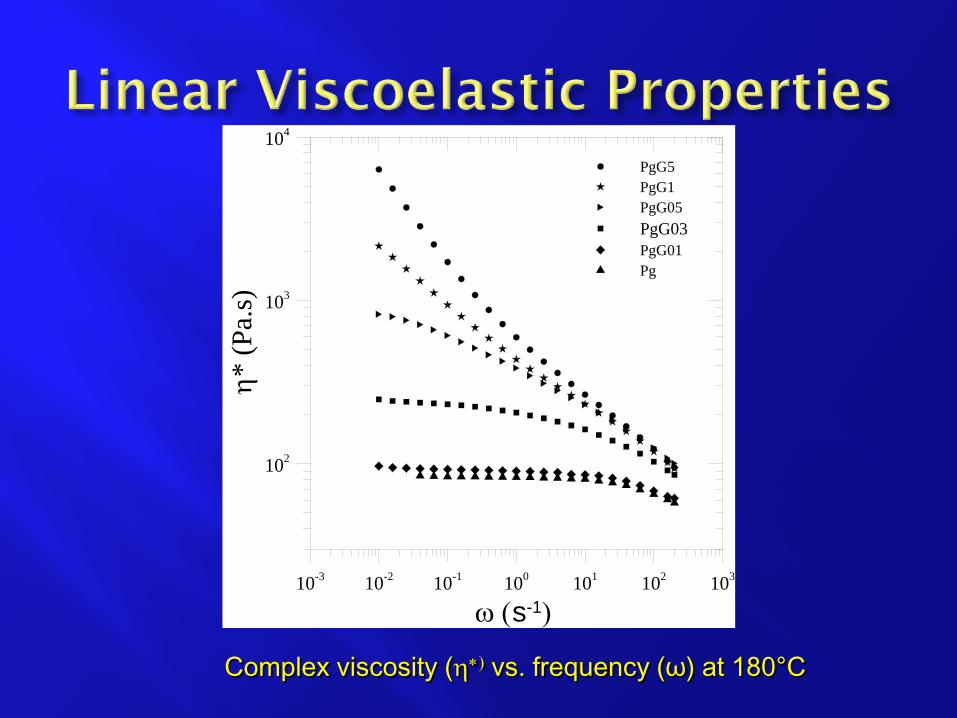
Complex viscosity (η∗) vs. frequency (ω) at 180°C
10-3 10-2 10-1 100 101 102 103
ω (s-1)
102
103
104
η* (P
a.s)
PgG5PgG1PgG05PgG03PgG01Pg

Zero shear viscosity η0 dependence on weight average molar mass MwLS for the initial material Pg and the modified samples to 180°C.
Relationship between rheological and molecular characterization
Auhl, D. et al. Macromolecules 2004, 37(25), 9465-9472.

Storage modulus (G’) vs frequency (ω) at 180°C

1E-006 1E-005 0.0001 0.001 0.01 0.1G*/Go
N
40
60
80
50
70
90
δ (°
)
PPg5GPPg1GPPg05GPPg03GPPg01GPPg
van Gurp-Palmen plot: Loss angle (δ) vs. G*/GN0 at 180°C.

40 60 80 100 120 140 160 180
T (°C)
Hea
t Flo
w (W
/ g)
Pg
PgG01
PgG03
PgG05
PgG1
PgG5
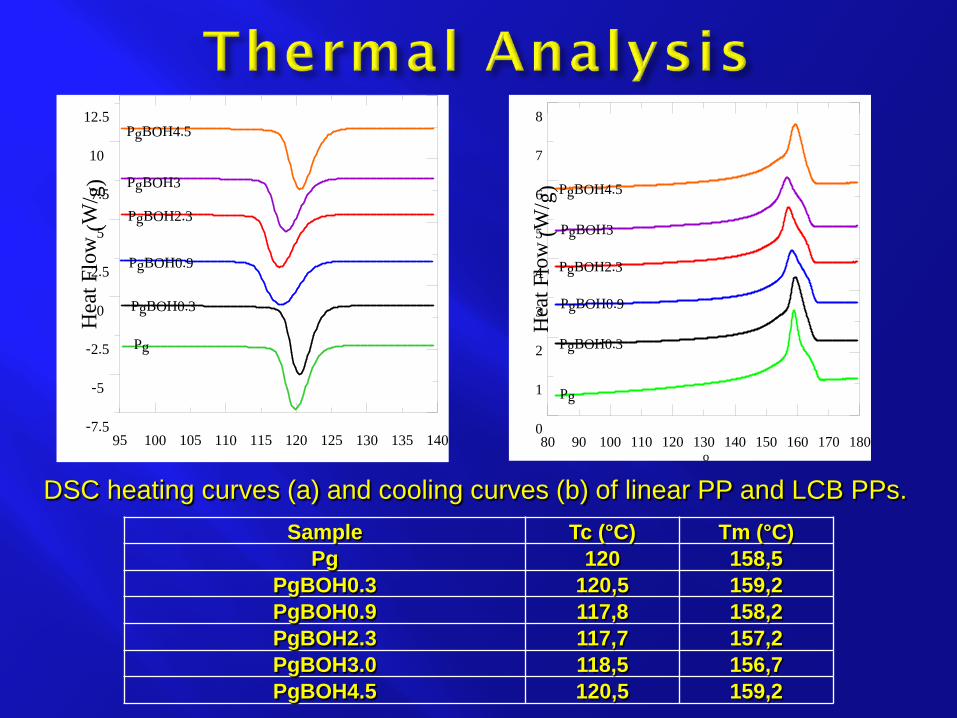
DSC curves of initial PP and modified LCBPP with increasing Glycerol
concentration. (a) Crystallization curves (b) Melting curves
Sample Tc (°C) Tm (°C) Pg 120 158,5
PgG01 120.4 159,4 PgG03 119.7 157.7 PgG05 119.5 159.2 PgG1 117 159.7 PgG5 118.5 159.8
b a

FTIR results indicated that the grafting reaction took place and glycerol has been grafted on the PP backbone. A new band appears at about 1735 cm-1 which is characteristic of carbonyl groups of the ester in the MAH molecule, and, therefore, suggesting the existence of LCB.
From GPC-LLS analysis, PPG-g showed extensive departure from
linear behavior on the high molecular weight fraction. Branched PP showed considerably increase on the long relaxation
modes by small-amplitude oscillatory shear experiments. The rheological characteristics such as higher G’ at low frequency and G* shifting to smaller values of the phase angle in the van Gurp Palmen plot confirm different relaxation mechanism for LCBPP from linear PP
Melting temperature slightly increases while crystallization temperature decreases with increasing degree of branching.

O O O
+ HO OH
O O O OH
O HO
O
PPg 1,4 Butanediol
PPg#BOH
1792 cm-1
1784 cm-1
1735 cm-1

2000 1900 1800 1700 1600 15001950 1850 1750 1650 1550
Número de onda (cm-1)
Abso
rban
cia (u
.a.)
PPg
PPg03BOH
PPg09BOH
PPg23BOH
PPg30BOH
PPg45BOH
1792 cm-1 1784 cm-1
1735 cm-1
FTIR spectroscopy
FTIR spectra of PPgAM + 1-4 butanediol

0.001 0.01 0.1 1 10 100 1000ω (s-1)
10-3
10-2
10-1
100
101
102
103
104
105
G' (
Pa)
PPgPPg03BOHPPg09BOHPPg23BOH PPg30BOHPPg45BOH
Storage modulus (G’) vs frequency (ω) at 180°C

10-6 10-5 10-4 10-3 10-2 10-1
G*/GoN
40
60
80
50
70
90
δ (°
)
PPgPPg03BOHPPg09BOHPPg23BOHPPg30BOHPPg45BOH
Rheological characterization
van Gurp-Palmen plot: Loss angle (δ) vs. G*/GN0 at 180°C.
80 100 120 140 160 18090 110 130 150 170
T (oC)
0
2
4
6
8
1
3
5
7
Hea
t Flo
w (W
/ g)
Pg
PgBOH0.3
PgBOH0.9
PgBOH2.3
PgBOH3
PgBOH4.5
100 110 120 130 14095 105 115 125 135
T (oC)
-5
0
5
10
-7.5
-2.5
2.5
7.5
12.5
Hea
t Flo
w (W
/ g)
Pg
PgBOH0.3
PgBOH0.9
PgBOH2.3
PgBOH3
PgBOH4.5
Sample Tc (°C) Tm (°C) Pg 120 158,5
PgBOH0.3 120,5 159,2 PgBOH0.9 117,8 158,2 PgBOH2.3 117,7 157,2 PgBOH3.0 118,5 156,7 PgBOH4.5 120,5 159,2
DSC heating curves (a) and cooling curves (b) of linear PP and LCB PPs.

12 16 20 24 28
2 theta, o
0
5000
10000
15000
20000
25000
Inte
nsity
, a.u
.
PPgMA- 1,4-ButanediolPPgMA0.3%0.9%2.3%3.0%4.5%
WAXD diffractogram of PP and LCB PPs

La presencia de la banda de absorción a 1735 cm-1 confirma la presencia de grupos carbonilos de éster producto de la reacción del anhídrido del Pg con el diol.
El comportamiento viscoelástico lineal de los polímeros
sugiere la presencia de estructuras moleculares complejas al evidenciar la aparición de procesos lentos de relajación que aumenta en importancia a medida que se incrementa la concentración de diol utilizada.

O
OO
OO
O
O
O O
O
O
OH
OO
O
O
OH
O
H2C CH CH
COOH
CH
CH2
CH
Estructura I
Estructura III
X 2
COOH
CH
CH2
CH
Estructura II
HC CH2CH2
1792 cm-1
1784 cm-1
1735cm-1

1900 1800 1700 1600 15001850 1750 1650 1550Número de onda (cm-1)
Abso
rban
cia (u
.a)
Pg
PgEp1.9
PgEp2.5
PgEp3.2
PgEp0.65
1735 cm-1
1782 cm-1
1790 cm-1
FTIR spectroscopy
FTIR spectra of PPgAM + epoxi

0.1 1 10 100 1000
ω (s-1)
1
10
100
1000
10000
100000
G' (
Pa)
PgEp3.2PgEp2.5PgEp1.9PgEp0.65Pg
2
Rheological characterization
Storage modulus (G’) vs frequency (ω) at 180°C
100
101
102
103
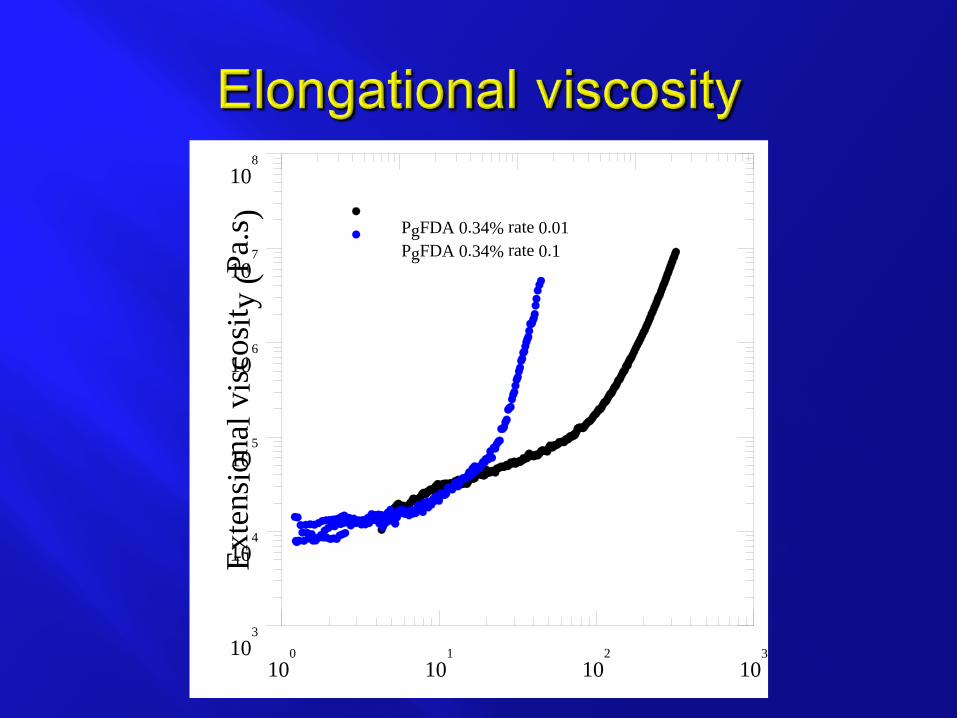
Time (s)
103
104
105
106
107
108
Ext e
n sio
n al v
isco
s it y
(Pa .
s ) PgFDA 0.34% rate 0.01PgFDA 0.34% rate 0.1

20 40 60 80 100 120 140 160 180T (oC)
-8
-4
0
4
8
Fluj
o de c
alor (
W/g
)
Pg
PgEp0.65
PgEp3.2
PgEp1.9
PgEp2.5
20 40 60 80 100 120 140 160 180T (oC)
-2
0
2
4
Fluj
o de
calo
r (W
/g)
Pg
PgEp0.65
PgEp3.2
PgEp1.9
PgEp2.5
Tc ( C) Tm ( C) Pg 120 158.5
PgEp0.65 120.5 159 PgEp1.9 123.5 160.5 PgEp2.5 124.5 161 PgEp3.2 134 161.5
DSC heating curves (a) and cooling curves (b) of linear PP and LCB PPs.

La presencia de bandas de absorción a 1715 y 1735 cm-1 confirma la presencia de grupos carbonilos de ácido y éster que resultarían de la reacción del anhídrido del Pg con la resina epoxi.
El comportamiento viscoelástico lineal de los polímeros
sugiere la presencia de estructuras moleculares complejas al evidenciar la aparición de procesos lentos de relajación que aumenta en importancia a medida que aumenta la concentración de epoxi utilizada.

El análisis térmico indica un aumento de Tc y Tm con el aumento del grado de modificación, además del tipo de estructura cristalina predominantes, α y β, que se presentan en los materiales estudiados.

SEC with triple detection indicated branched structures in the high molecular weight tail of the distribution with high molecular weight branches

El análisis térmico indica un aumento de Tc y Tm con el aumento del grado de modificación, además del tipo de estructura cristalina predominantes, α y β, que se presentan en los materiales estudiados.

3 4 5 6 73.5 4.5 5.5 6.5 7.5
Log M
0
0.4
0.8
1.2
0.2
0.6
1
1.4
d (W
)/d(L
o gM
)PgG5PgG1PgG05PgG03PgG01Pg