polytechnic universitety mechanic … universitety mechanic engineery faculty textile and fashion...
TRANSCRIPT
1
POLYTECHNIC UNIVERSITETY MECHANIC ENGINEERY FACULTY
TEXTILE AND FASHION DEPARTAMENT
3d TEXTILE CONFERENCE
20 NOVEMBER 2008 TIRANA

2
Welcoming Remarks UPT
Academic Prof. Jorgaq KAÇANI
Project RETEXRESALB in frame of FP6 program of European Community had the aim to
consolidate human and material capacities of Textile and Fashion Department near Polytechnic University of Tirana (UPT) and collaboration of this department with the textile and cloth industry in Albania.
Project RETEXRESALB in frame of FP6 program where Department of Textile and Fashion in UPT was the coordinator with two European research and scientific contractual units, Gent University in Belgium and Technological Institute of Pireas, Greece, was a success of Textile and Fashion Department and of Polytechnic University in Albania. In frame of this project is organized the International Technology Transfer conference in November 20th, 2008, the aim of which is to:
- The reinforcement of relations industry-university in the field of textile technology. - The contribution in new technologies in textile and confection field. - Interchange of university experiences with European university professors in field of textile
technology. This is an event for Polytechnic University of Tirana, because: - This is the first International Conference organized in the textile industry in Albania - This conference also, means the closure of FP6 Project (WBC-INCO), in which for the first
time an Albanian university is the coordinator. - It is focused on national textile and confections industry problems. - 2/3 of the refers are from European Universities which have textile schools members in
AUTEX, international system of these Universities (Polytechnic University of Tirana member from July 2008) as ENSIT Mulhouse (France), Ghent University (Belgium), TEI Piraeus (Greece).
The consolidation of human resources in Textile Department like the first objective of the project is realized through:
- Visits of the foreign lectors. - Delegate of the 6 members of the Department for research and working of the doctorate in
Belgium and Greece. - International technology transfer conference in Tirana.
The consolidation of human resources of the Department realized by:
- Maintenance, renovation and growth level of the laboratory equipment in Department. - International accreditation of the Physical-Mechanical and Chemic laboratory of Textile.
The lectors that visited our department realized courses for the staff of Textile Department and for students in Textile and Fashion. All courses were in English and the materials had been translated in Albanian to be used for research and teaching. Four members of Department that are working for their doctorate were send in Ghent University in Belgium for a period of 3 months in the Institute of Piraeus for a training and specialization in specified fields. The fields of research and specialization of Textile and Fashion members are:
1. Technique Textiles 2. The use of textile threads with conductivity. 3. Smart Textiles 4. Finishing processes

3
5. CAD/CAM in cut and Design technologies. Second Objective of FP6 project was the improvement of material resources. To support this objective has been ordered and bought new equipments for controlling quality of textile, didactic equipments, books, magazines. Third objective was the collaboration industry-university which is realized through organization of activities of technology transfer in the form of seminars workshops and technology transfer conference. The seminars had the themes like Quality Management, Quick Response, Quality Control, The production of Carpets and fire behavior, CAD/CAM etc. Fourth Objective was the introduction of Textile and Fashion Department, UPT in the network of research centers and European universities to have the possibility of collaboration with EU universities to realize researches and common activities in the future. In the continuance of the material capacities reinforcement of this department, started the accreditation of Physical- Mechanical and Chemical laboratory of Textile from international accreditation body. Actually, is recognized by Albanian Accreditation Directory which is not yet a member of European Accreditation Body (EA). According to this, all the procedures, rules, quality manuals of the laboratory, and all the needed documentations have been prepared. Fifth Objective was the inclusion of women in research activities, helping them to reinforcement their knowledge and abilities through the experience exchange with European researchers and lectures. During the two years of this project are organized 5 project meetings, 3 in Albania, 1 in Belgium and 1 in Greece which helped in details determination for the progress evaluation of the project. The project RETEXRESALB in the frame of FP6 project where the Textile and Fashion Department was the coordinator, was a real success of this Department, and of entire Albanian Polytechnic University.
Minister of Economy, Trade and Energy
Ing. Enno BOZDO
Ladies and Gentleman!
In the name of Ministry of Economy, Trade and Energy, I have the pleasure to greet The International Technology Transfer Conference, which according to the objectives that has, is an initiative that goes through the university teaching. As for me, it is a pleasure to participate in a scientific conference, which the main objective has the advance based on a closed relation between University-Industry and Work trade. I want to point from the beginning, that the Textile and Fashion Department has found in all its initiatives the availability of a real partner, that of Ministry of Economy, Trade and Energy, such as:
1. The advance and maintenance of a quality management system in Physical-Mechanical and Chemical Laboratory of Textiles. This laboratory is certificated from the National Accreditation Institution, The Accreditation Directory in the Ministry of Economy, Trade and Energy, for the accomplishment of quality control of products and raw textiles materials, commensurate the international standard ISO/IEC 17025.
4
2. In the frame of reorganization of Institutes dependent from the Ministry of Economy, Trade and Energy, the Textile and Fashion Department in the Polytechnic University of Tirana, was one of the institutes that profit from this.
This kind of partnership, it’s not casual, at first it is based on Albanian Government objectives for the building of a hole infrastructure of quality in Albania, where standardization, metrology, and anthropometric instruments are included. Second, this partnership is based on the work of Textile and Fashion Department to transform it in a research and development center of Textile Industry. This Conference that has as a target group representative of textile entertainment in Albania, is an example of the role that Albanian University can play in the economic national development and in the technology acknowledgement, innovation and good west praxis I want to congratulate to the Conference a full success and to encourage Textile and Fashion Department. Also I want to secure not only this Department, but the whole Polytechnic University of Tirana, and the other Albanian Universities, that they will always find support for their projects from the Albanian governments and especially from the Ministry of Economy, Trade and Energy Thank you very much! Ministry of Education and Science
Genc POLLO
Session 1 I. CALCULATING MASS PER UNIT AREA OF SINGLE AND DOUBLE KNITTED STRUCTURES: A NEW APPROACH
Prof. Efthymios Gravas, Prof. Dr Paul Kiekens Abstract
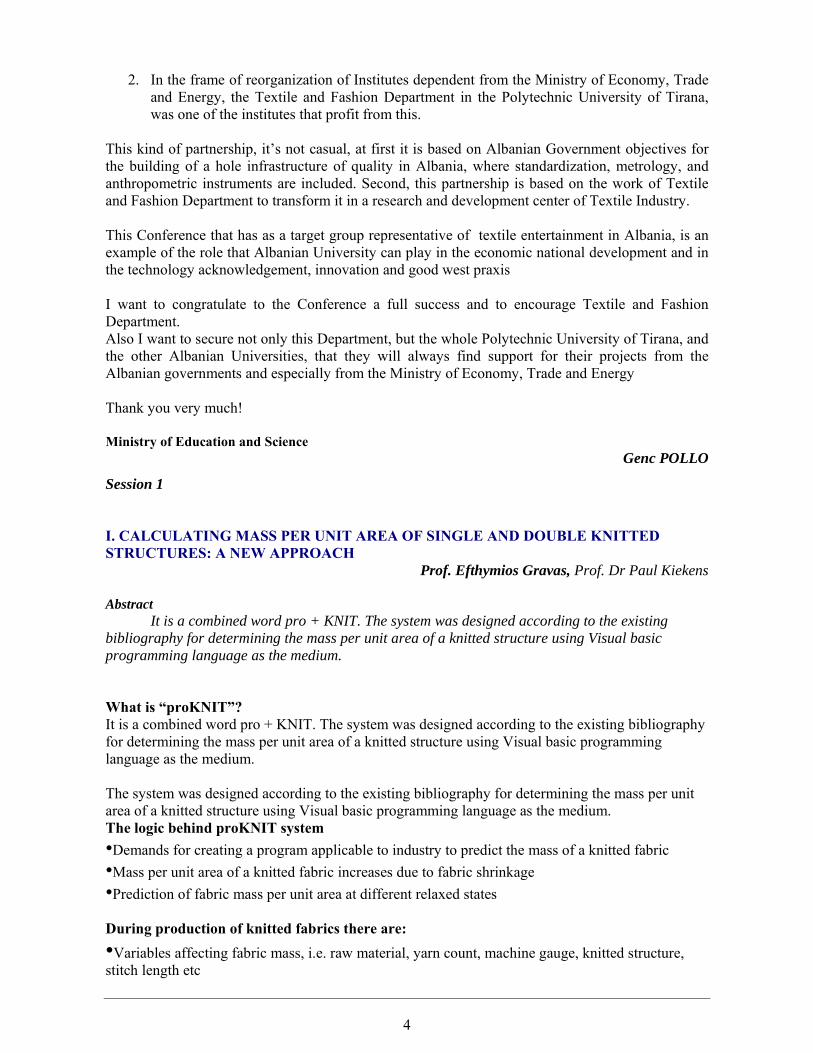
It is a combined word pro + KNIT. The system was designed according to the existing bibliography for determining the mass per unit area of a knitted structure using Visual basic programming language as the medium. What is “proKNIT”? It is a combined word pro + KNIT. The system was designed according to the existing bibliography for determining the mass per unit area of a knitted structure using Visual basic programming language as the medium. The system was designed according to the existing bibliography for determining the mass per unit area of a knitted structure using Visual basic programming language as the medium. The logic behind proKNIT system •Demands for creating a program applicable to industry to predict the mass of a knitted fabric •Mass per unit area of a knitted fabric increases due to fabric shrinkage •Prediction of fabric mass per unit area at different relaxed states During production of knitted fabrics there are: •Variables affecting fabric mass, i.e. raw material, yarn count, machine gauge, knitted structure, stitch length etc

5
•Variations in mass due to fabric shrinkage The procedure behind this work was based on the following logical assumptions: •Using the mathematical models from existing bibliography to set up the sequences of the estimations. •Developing three different relaxing conditions for predicting fabric mass. •Developing appropriate software suitable and friendly to industry. •Building a comprehensive database. •The system must give logical and acceptable predictions. Mathematical models for single and double knitted structures • Geometry of plain knit structures courses/cm (c), wales/cm (w), loop length (ℓ), loops per unit area (S) • According to Munden’s theory from the above variables the following relations can derive: Kc = c x ℓ Kw = w x ℓ Ks = S x ℓ² Kr = R = c/w = Kc/Kw Knapton et al developed the theory of “Structural Knitted Cell” (SKC) for double knitted structures. Uc = Cu x ℓ Uw = Wu x ℓ Us = Cu x Wu x ℓ² R = Uc/Uw = Cu/Wu Correlation of yarn count and knitting machine gauge G = (10,630/tex)½ (for single knits) G = (8,860/tex)½ (for double knits) Tightness or Cover Factor Kf = (Tex)½ / ℓ Mass per unit area of a knitted fabric (grams per square meter) is given: Loop density of fabric, loop length and yarn count Relaxing conditions for predicting fabric mass •Dry-relaxed state (48 hours) •Wet-relaxed state (soaked in water 40°C for 2 hours) •Finished and Full-relaxed state (steamed, washed 30°C for 15 minutes)
6
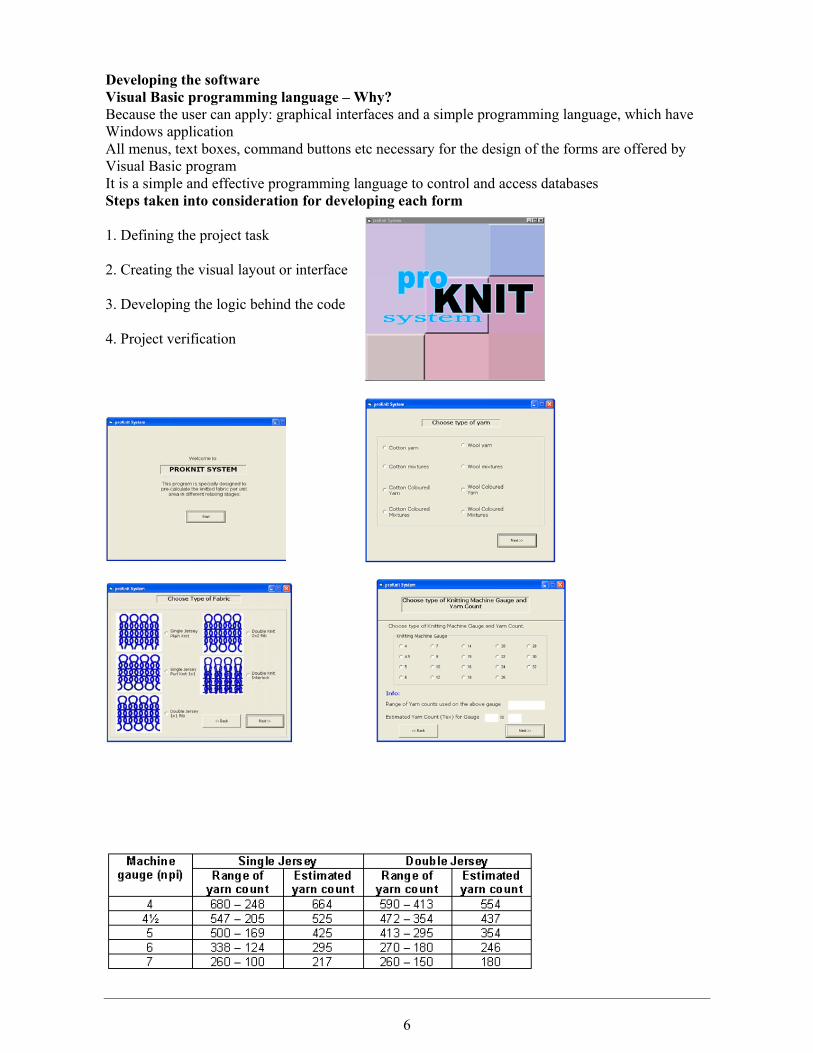
Developing the software Visual Basic programming language – Why? Because the user can apply: graphical interfaces and a simple programming language, which have Windows application All menus, text boxes, command buttons etc necessary for the design of the forms are offered by Visual Basic program It is a simple and effective programming language to control and access databases Steps taken into consideration for developing each form 1. Defining the project task 2. Creating the visual layout or interface 3. Developing the logic behind the code 4. Project verification

7

8
Database for “proKNIT” system •Wool blend yarns •Knitted fabric production •Test methods applied •Estimating the non-dimensional parameters •Enter non-dimensional parameters to “proKNIT” system Yarns used
Knitted fabric production •Stoll CMS 411 Knitting machine •Structures produced: plain knit, purl, 1x1 rib, 2x2 rib, interlock •Fabrics produced at three different levels of tightness
Yarn composition
Yarn count
Measured yarn count (tex) (3)
No ends used
(4)
Total yarn
count (tex) (5)
Nm
(1)
Tex
(2) 50% Acrylic / 50% Wool extra fine (undyed)
2/28
2/35.7
2/36.40
3
218.4
70% Acrylic /30% Wool (undyed)
2/28
2/35.7
2/36.35
3
218.1
50% Acrylic / 25% Viscose / 25% wool (undyed)
2/17
2/58.8
2/58.60
2
234.4
50% Wool Merinos / 50% Dralon (dyed blue)
2/28
2/35.7
2/36.60
3
219.6
Dry Relaxed 70% Wool / 30% Acrylic (dyed brown)
2/28
2/35.7
2/36.40
3
218.4
50% Acrylic 25% Viscose 25% Wool (dyed beige)
2/17
2/58.8
2/64.20 2
256.8

9
•Two samples produced at each structure and at each tightness •Purl structure produced by loop transfer •2x2 rib structure produced on 2/3 needle arrangement •Interlock structure produced using half racking Test methods •Yarn linear density or yarn count (tex) •Measuring courses and wales per unit length and width respectively •Loop length determination •Mass per unit area •Relaxing conditions including steaming process Estimation of dimensional parameters
Non-dimensional parameters used on “proKNIT”
Type of Fabric
Geometrical Dimensions Dimensional Parameters
cpc
wpc
ℓ
(mm) S
KC
Kw Ks
R
Plain-Knit
5.3
4.1
9.5
21.73
50.3
39.0
1961
1.29
Purl structure
7.1
3.8
9.7
26.98 68.9
36.9 2538
1.87
1X1 rib
5.3
4.0/2
8.52
21.20
45.2
34.1
1541
1.33
2X2 rib
5.4
4.2/2
9.12
22.68
49.2
38.3
1884
1.29
Interlock
4.7
4.4/2
10.23
20.68
48.1
45.0
2165
1.07

10

11

12
Discussion and conclusions •Mass per unit area of knitted fabrics can be predicted with accuracy using “proKNIT” system. •Project covered a small range of tightness factors and yarn types. •The estimations of fabric mass were based on fabric geometry. •Courses and wales per unit length and loop density derived from the non-dimensional variables.
II. STTUDY AND DEVELPOEMENT OF AN ELECTROSPINNING PROCESS TO PRODUCE NANOFIBERS.
Khenoussi, E. Drean, L. Schacher and D. Adolphe France Abstract The interest in producing fibers at the nano scale has increased the last few years because of the potentially broad applications of nanofibers. It is supposed that nanofibers could be used in almost all spheres of our life; filtration, electronics, sensors, optics, textile, medical application, cosmetics, etc. due to their large specific area. The basic and the most common technique for producing nanofibers way to create nanofibers from many kinds of polymers is the electrospinning process. The electrostatic production of nanofibers has become an object of intensive theoretical experimental research in textile area during the recent years led by Pr. Reneker from Akron University (USA). The electrospinning process uses high voltage to create an electric field between a polymer solution and a collector plate. One electrode of the voltage source is placed into the solution and the other is connected to the collector. On the surface of the grounded collector, a web of randomly oriented solid nanofibers is formed. In this paper, state of the art of electrospinning researches in the textile field will be presented as well as the successive electrospinning ranges which have been designed and built at the LPMT laboratory. The influencing parameters and the various devices (Scanning Electron Microscopy and Atomic Force Microscopy) which have been used to investigate the obtained nanofibers and to give a direct approach of their morphology, will also been exposed. Results of experimental work on the production of Polyacrylonitrile (PAN) nanofiber containing carbon nanotubes (CNT) will be given, considering that the electrical, mechanical, and physical properties of a polymeric matrix can be improved by the addition of a slight CNT amount. What are the reasons to produce nanofibers? My presentation is organized on these following points:
• Why nanofibers are produced? • How to produce nano fibers?
- Electrospinning method • How to characterize electrospun fibers? • Electrospun fibers properties

13
• Electrospun fibers current developments • Electrospun fibers applications • Researches on nanofibers at LPMT • Conclusions
Firstly, I’ll explain the interest of nanofibers and the major advantage of reducing scale of fiber diameter. I’ll explain the electrospinning process and the different ways of their characterization. Then I’ll introduce some current developments of nanofibers production, and some of their application. Finally, I’ll present some results and researches characterization that are done in LPMT. I’ll will finish with a short conclusion. What is the reasons of producing nanofibers ??
PAN nanoweb and PET fibers (LPMT)
Comparison nanoweb / Human hair (E-spin)
With electrospinning process we can obtain fiber diameter in nanoscale between 10 to 500 nm. In these photos we can see nanofibers non-wowen. The second pictures shows nanofibers non-wowen in comparison with human hair. First photo shows us the difference in diameter between common PET fiber and PAN nanofibers that have been obtained in LPMT. One of the most importants reasons of producing nanofibers, is the reduction of diameter.With reduction of diameter, nanofibers have a huge surface area to volume ratio by the same weight of

14
polymer. As shown on this figure 3, with nanofiber between 10 to 1000 nm, we obtain specific surface area between 10 to 500 square meter per gram.
Graph: K. KO – Nanofiber technology - Annual Report of Fibrous Material Research Laboratory (2002)
Nanofibers with their special properties like huge surface area to volume ratio and their high ability of nanofiltration and small pore size have the potential to enlarge applications and find news areas. For example in medical area, in the case of drug delivery, nanofibers with high number of functional groups make possible releasing of actives substances. Filament diameter is 5 - 500 nm Specific surface area is 10 000 - 1 000 000 m²/kg
Human hair di t
Carbon nanotube SWNT & MWNT
ElectrospunsNanofibers
Textiles Microfibers
Conventional Fibers
Fiber diameter (µm)
Specific surface area (m2/gr)

15
Photo: Raghavendra R Hedge – University of Tennessee – Knoxville – College of Engineering - June 2005 How to produce nanofibers ?
Electrospinning process is a nanofibers formation technique that can be used for a wide variety of polymer solutions. The polymer solution is placed in a syringe and can flow through a tube which has a needle attached at its end. The droplet of polymer solution is suspended from the tip of the needle. An electrode from high voltage power supply is in contact with the polymer solution. The electric charge overcomes the surface tension of the droplet and charged jet is emitted. The jet passes a set distance between needle tip and collector, which is an aluminium foil. Between the needle and the collector the nanofibers is submitted to a combined stretch effect, firstly caused by the repulsion between polymers chains positively charged and secondly by the high collector attraction.

16
Attraction Toward the collector 1 Taylor cone 2: Simple jet 3: Electro-splaying
The most important parameters of electrospinning process can be divided in three parts. Firstly solution properties as polymer viscosity, polymer concentration, molecular weight, electrical conductivity, viscoelastic properties and surface tension. Secondly the processing conditions such as applied voltage, distance from needle to collector, feedrate and needle diameter. Finally ambient conditions that is to say temperature, humidity and atmosphere pressure. So the most important parameters are: Solution properties; Viscosity, polymer concentration, molecular weight, electrical conductivity, viscoelastic properties, surface tension Processing conditions Applied voltage (Taylor cone), distance from needle to collector, feedrate, needle diameter Ambient conditions Temperature, humidity, atmosphere pressure
E
+ -
2
3
+ +
Pump
Syringe
Collector
1
+
Repulsion between chains

17
Electrospinning process
This photo shows the electrospinning machine that we have designed and built in our laboratory. It’s composed of an automatic pump which delivers polymer solution to the tip of needle vertically located on the collector. Between the needle and the collector, we have an electrical high field that is provided with an high voltage system. You can also see an automatic movement system that can move vertically and horizontally for process versatility. Current developments
We can discuss on current development and new researches field in nanofiber to improve their properties. Some improvements of electrospinning process are focused on production machine. One aspect is new collector system and the other is designing new machines for greater productivity. The second point is concerning the development of composite nanofilament. Improving production machines
• New collector system • New machine for higher productivity
Development of composite filament
• Development of reinforced filament So researchers are working to improve filament in terms of diameter filaments dispersion, of mechanical behaviors, and in term of bicomponment filaments. Improvement of filaments
• In terms of diameter dispersion

18
• In terms of mechanical behaviour • In terms of complex filament
Syringe
Taylor cone Core-shell nanofibers in one-step from electrified coaxial jets Juan E. Diaz-Gómez Fiber Society Spring Conference 2005 May 25 – 27, 2005 St. Gallen, Switzerland Potential application
In the development of application, the researchers are working on applying nanofibers as filters through sandwich complex and membrane. In the medical applications the nanofibers could be used to protect open wounds. Now there are some researches to use nanofibers membranes as microsensor or microactuator. So potential application includes:
• Filtration through sandwich complex and membrane • Protection of open wounds • Interior coating of vascular prostheses • Nano membrane for micro sensor
Laboratory work Transition : Now I’ll present you works which are conducted in our laboratory. We used Polyacrylonitrile as the polymer and DMF as solvent. The concentration of solution was varied between 2 to 10 percent. Concerning electrospinning parameters, high voltage was applied between 15 to 20 kV and feedrate between 2 to 5 milliliters per hour.
Polyacrylonitril (PAN) CH2 CH
C Nn
Concentration: 2 – 10 wt%
CH3
N
CH3
C
O
H
Dimethylformamide (DMF)
Extra dry (precipitation)
Parameters
Tension: 15 – 20 kV (1kV/cm) Feed rate: 2 – 5 ml/h Vertical trajectory Ambient

19
Characterization tools To evaluate the physical properties of nanofibers, different analyses are done. Transmission and scanning electron microscopy are done to determine the diameter of fibers and atomic force microscopy to show us the surface topography in the case of nanoroughness variation. In this figure below you can see an AFM topographic photo which shows a PAN nanofibers produced in LPMT.
AFM photo –ENSISA - Dr. WANG Researches at LPMT …
200 nm200 nm200 nm200 nm200 nm200 nm200 nm200 nm
On this scanning electron microscopy pictures we see a typical PAN non-wowen nanofibers. To obtain this type of nanofibers we worked with a 5 percent solution, an applied voltage of 20 kV and a feedrate of 2 milliter per hour. The pictures show filaments randomly ordered which form a global non-wowen relatively homogeneous. The diameter of the fiber is approximately equal to 200 nanometers.
An other part of our work is focused on addition of carbone nanotube in PAN nanofiber. This works has be done to increase conductivity of nanofibers and to observe the effect of carbon nanotubes on the physical properties. The figure 11 is a Transmission microscopy pictures showing carbon nanotube provided by arkema compagny. It’s multiwalled carbon nanotubes forming aggregates.

20
Carbon Nanotubes Multi wall type Arkema company
After electrospinning process we obtain composite nanofilament forming a regular and homogenous non-wowen. To compare PAN to PAN/CNt nanofibers obtained in the same conditions, we made SEM pictures at the same scale. The Left pictures(figure 12) is PAN nanofibers and the right is PAN/CNt composite. We can clearly see that the nanofibers composite has a bigger diameter in comparaison to the pure PAN. The diameter of the nanocomposite is about 600 nm for a PAN fiber about 200 nm initially. It’s the first difference observed.
The second difference is on surface morphology of the nanofibers composite. If we calculate the rate of carbon nanotube in the nanofibers for solution initially containing 0.5 to 2.5 % in the solution we found that the nanofibers containing approximately 10 to 30 % CnT. So it’s logical that
SBET(m2/ g)
C %
H %
N %
S %
Al %
Fe %
254 92.180.710.18< 0.3 3.81 1.96

21
we increase the diameter and as we see on the SEM pictures that addition of carbon nanotubes modify the surface morphology. In the solution 0.5 – 2.5 wt% of CNT In the nanofibers 10 – 30 wt% of CNT
In the figure 13 is shown the modification of surface morphology. Topography analyses of PAN/CNT by AFM
To highlight this modification of morphology caused by the addition of carbon nanotube an investigation has been done thanks to AFM. These two photos compare at the same scale the

22
surface topography of PAN (left) and PAN/CnT nanofibers. Thanks to this method we have proven that the surface roughness has been increased by the addition of CNT. Conclusion
To conclude this presentation we can say that nanofibers by their special properties represent materials with a great potential in terms of application. These materials could offer new possibility in some areas like bioengineering or nanomembrane for medical applications. The necessity is to characterize these new materials with adapted nanoscales techniques.
III. CLASSIFICATION ACCORDING THICKENESS OF WOOL FIBRES FROM ALBANIAN BREEDS
Dr. Genti Guxho, Albania Abstrakt
The study is a an effort made to in relation to the measurement of the thickness of local breeds wool fibres using the air penetrability method, according to ISO 1136:1976 [1] and IWTO-6-26 1986 [2], as well as their classification taking into account geographical and breed spread of the Albanian sheep. The thickness is one of the most important characteristics of the wool fibres, which represent (in our analysis) their average diameter - μm. This characteristic is decisive in defining the technology wise potential of the said fibres. In the air penetrability equipment (flow meter) the average thickness will be measured with the indirect method. Pressure decrease caused by the test specimen of the wool fibres (regularly spreaded) is in proportion with the average diameter of the fibre with a certain length. In order to get scientifically exact conclusions, a preliminary calibration of the equipment is needed. The method of thickness measurement of wool fibres, based on the air penetrability, is a complete scientific method. Air penetrability equipment is the same for all experiments, and measures fibres with a thickness which varies from 20 to 40 μm. Samples are randomly selected.
Keywords: wool, diameter, flow meter, testing, international standards, Albanian sheep breeds
Introduction
Thisckness is the essential characteristic of wool, which gives to the textile products the high quality, softness, thermic insulation and elegance. People tend to use wool fabrics, but at the same time look for the them to be resistant. This requirement could fulfill only textiles prepared with thin wool fibres. Textiles prepared with thin wool fibres have higher ressistance compared to the same textile but with rough wool fibres. In the physical meaning, the wool thickness is defined as the average diamater of fibres, expressed in (μm). There are different systems used to define the thickness, and consequently it is expressed in different measurement units.
The most used thickness measuremment methods are:
a. Microscope method, whicj consist in measuring the wool thickness using the projection microscope, and performing, as the case might be, 200-400 measurements of the selected wool sample. In this method the thickness is given in micrometër (μm).
b. Gravimetric Method. There is a specific constant correlation beteween fibre thickness and the length – weight ratio. The length- weight ratio is defined as metric number (this ratio gives, thus, the metric number). This definition tells us the fibre length which corresponds to unit of weight. Thus:
23
mLN = (1)
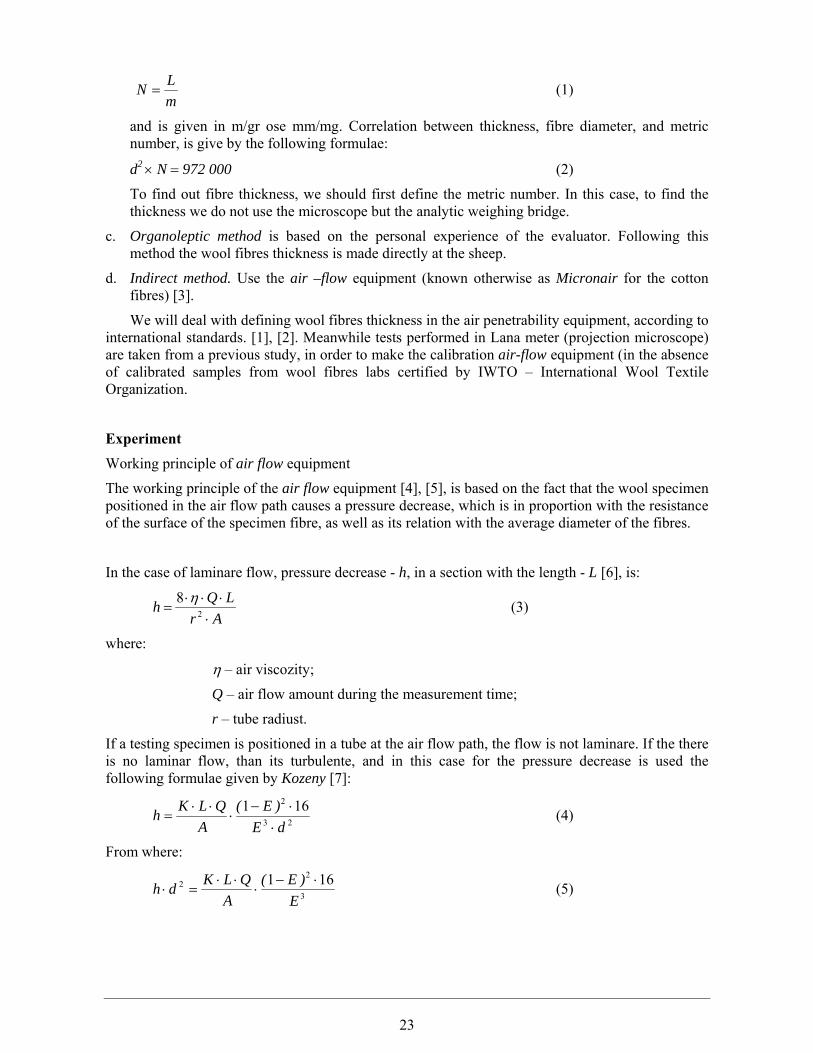
and is given in m/gr ose mm/mg. Correlation between thickness, fibre diameter, and metric number, is give by the following formulae:
d2 × N = 972 000 (2)
To find out fibre thickness, we should first define the metric number. In this case, to find the thickness we do not use the microscope but the analytic weighing bridge.
c. Organoleptic method is based on the personal experience of the evaluator. Following this method the wool fibres thickness is made directly at the sheep.
d. Indirect method. Use the air –flow equipment (known otherwise as Micronair for the cotton fibres) [3].
We will deal with defining wool fibres thickness in the air penetrability equipment, according to international standards. [1], [2]. Meanwhile tests performed in Lana meter (projection microscope) are taken from a previous study, in order to make the calibration air-flow equipment (in the absence of calibrated samples from wool fibres labs certified by IWTO – International Wool Textile Organization.
Experiment
Working principle of air flow equipment
The working principle of the air flow equipment [4], [5], is based on the fact that the wool specimen positioned in the air flow path causes a pressure decrease, which is in proportion with the resistance of the surface of the specimen fibre, as well as its relation with the average diameter of the fibres.
In the case of laminare flow, pressure decrease - h, in a section with the length - L [6], is:
ArLQh
⋅⋅⋅⋅
= 2
8 η (3)
where:
η – air viscozity;
Q – air flow amount during the measurement time;
r – tube radiust.
If a testing specimen is positioned in a tube at the air flow path, the flow is not laminare. If the there is no laminar flow, than its turbulente, and in this case for the pressure decrease is used the following formulae given by Kozeny [7]:
23
2 161dE)E(
AQLKh
⋅⋅−
⋅⋅⋅
= (4)
From where:
3
22 161
E)E(
AQLKdh ⋅−⋅
⋅⋅=⋅ (5)

24
where:
d – average diameter of fibre;
K – constant index;
L – the length of stretch
Q – amount of the air flow during the measurement time;
A – cross section of the stretch;
E – porozity coeficient, given by the formulae (6).
ALGE⋅⋅
=γ
(6)
where:
G – weight of the testing specimen, (1,5g ± 2mg);
γ – density of the experimented specimen, which in the case of wool is γ =1,31g/cm3;
L – the length of stretch;
A – cross section of the stretch.
If we keep constant the values of the righthand side of the equation (5), then:
hcdorcdh
tete ==⋅ 2 (7)
from the equation (5) we see that does exist a hyperbolic type correlation bteween fibre thickness and pressure decrease.
Pressure decrease produced by the air pump and equilibrated by the air deposits, should be kept unchanged during the air flow.
Testing sample positioned in the flowing stretch has the weight 1,5gr and is compensated in any case by the same volume.
In this way, values C, A, Q and E in the equation (5) have been kept constant. Viscozity of the air flow, as well, is considered constant, subsequently only the values of the pressure decrease h, and of d, change. Therfore, it is sufficient and satisfactory to the above conditions, to define the average wool fibre thickness, based on the pressure drecease h in manometër.
Technical description of the type FM-06 equipment (Hungary)
One of the air penetrability equipment, located in the Textile Physic-Mechanical and Chemical Lab in the Textile Department of Polytechnic University of Tirana (PUT), and accredited in compliance with the international standard ISO 17025, is the thickness measurement equipment FM-06 type. Both, the equipment and international standard in force, are of the middle ’70s. The main advantage of this equipment is that the thickness of an elementary fibre is defined much faster than using optical methods (microscope). For example, if during the use of the projection microscope (lanameter) we need 2-3 hours to measure the thickness of 500 fibres, with the FM-06 equipment we spend 1-2 minutes [8].
A general view of the functioning scheme of the equipment is shown in the Figure 1.
Air flow from the pump 1, which goes through reservoir 2, is regulated by the pinpoint valvle 3, in such a way that at the measurement room 2, the right amount of air be flown in it. Pressure decrease is measured in the manometer 5. (Fig. 2)

25
Air quantity, passing in a certain time period in the room, is measured by rotameter 6. Pressure decrease in milimeters of mercury bar, caused by the resistance to air flow created by the sample located in the room, is measured by manometer 5. Average fibre diameter in milimeter, corresponding to the related pressure decrease, is red in the nomogram.
Fig. 1 Equipment FM-06 type for the measurement of the wool fibres thickness
2.3.1 Source: Measurement equipment in textile industry Moskva 1972
Measurement speed allows use of the equipment in labs, as well as in industrial plants, to select the most appropriate wool fibre types, for a specific product. The disadvantage of this equipment is the higher rate of measurement uncertainties.
Figure 2 Scheme of the equipment FM-06 (Hungary)
2.3.2. Source: Measurement equipment in textile industry Moskva 1972

26
1.1 Tab. 1 Technical characteristics of FM-06 [8] Air Pump capacity, m3/hour ……………………………….
5
Measurement limits of the Rota meter, l/hour …………………
Up to 1 200
Pump electromotor tension, V ………………………
380/220
Gross size of the equipment, mm ……………………………
1 500 × 620 × 620
Weight of the equipment, kg …………………………………
70
Source: Measurement Equipment in textile industry Moskva 1972
Calibration and measurement in the air penetrability equipment FM-06
To calibrate the FM-06 equipment, we have used samples with already known diameter for each wool fibre, which have been measured using projection microscope (Lana meter). Taking into account the theorical side, we use summary table of the average of five measurements for each wool fibre. Tests in the air penetrability equipment show a non-linear correlation between the pressure difference h and average thickness of wool fibres d. We design a diagram where the relationship between pressure decrease and diameter is given, and the correlation will be as follows h = k × db. Result values of h for a diameter d of already known wool fibres, served to design the regress exponential type equation:
Y = A × XB (8)
where:
Y – is the pressure, and
X – is the average diameter of wool fibres.
Tab. 2 Pressure decrease for known diameters of fibres Debit 610 l(ore) W = 1.5g No. Wool Type
(quality) Pressure (h)(mm alcohol
bar) Thickness (d)(μm)
1 Rough 70.1 48.4 2 Rough 71.2 48.4 3 ½ Rough 85.4 37.2 4 ½ Rough 86.4 37.2 5 ½ Rough 110.6 37 6 ½ Rough 125.5 31.4 7 ½ Rough 128.3 31.4 8 ½ Thin 153 28.28 9 ½ Thin 156.6 29.4 10 ½ Thin 174.4 26.8 11 Thin 200.1 25 12 Thin 206 24.7 13 Thin 210.8 24.7 14 Thin 224.7 25
27
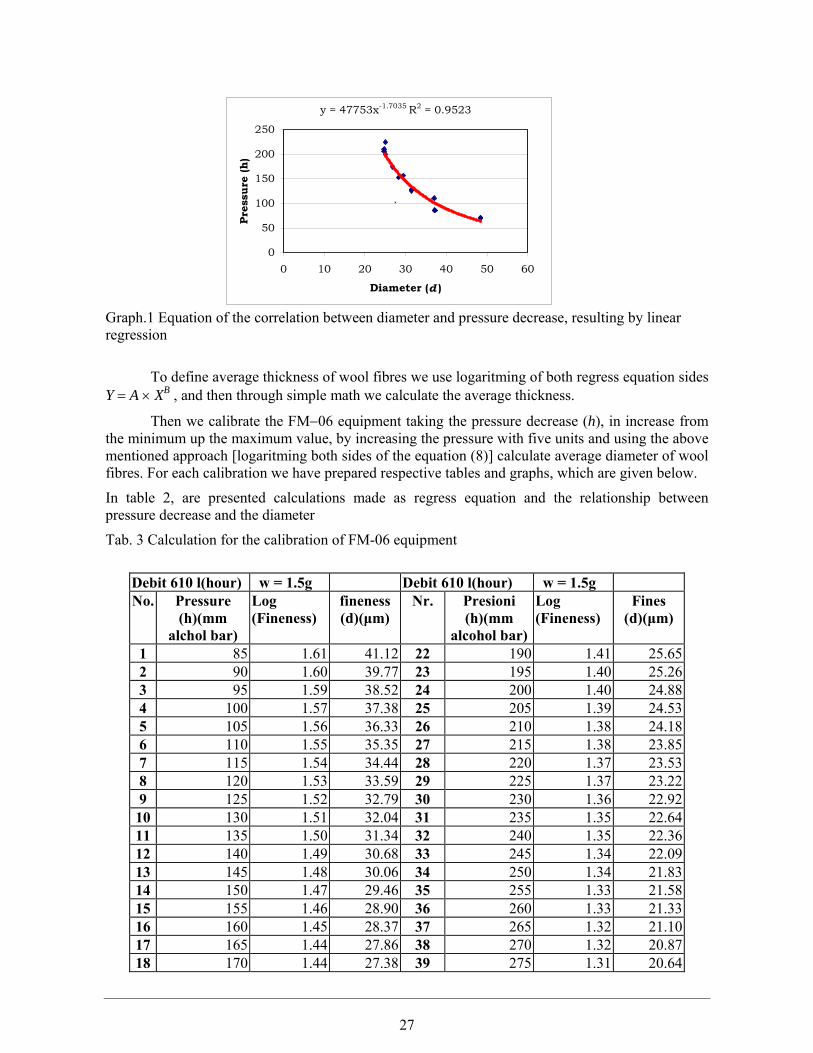
Graph.1 Equation of the correlation between diameter and pressure decrease, resulting by linear regression
To define average thickness of wool fibres we use logaritming of both regress equation sides Y = A × XB , and then through simple math we calculate the average thickness.
Then we calibrate the FM−06 equipment taking the pressure decrease (h), in increase from the minimum up the maximum value, by increasing the pressure with five units and using the above mentioned approach [logaritming both sides of the equation (8)] calculate average diameter of wool fibres. For each calibration we have prepared respective tables and graphs, which are given below.
In table 2, are presented calculations made as regress equation and the relationship between pressure decrease and the diameter
Tab. 3 Calculation for the calibration of FM-06 equipment
Debit 610 l(hour) w = 1.5g Debit 610 l(hour) w = 1.5g No. Pressure
(h)(mm alchol bar)
Log (Fineness)
fineness (d)(μm)
Nr. Presioni (h)(mm
alcohol bar)
Log (Fineness)
Fines (d)(μm)
1 85 1.61 41.12 22 190 1.41 25.652 90 1.60 39.77 23 195 1.40 25.263 95 1.59 38.52 24 200 1.40 24.884 100 1.57 37.38 25 205 1.39 24.535 105 1.56 36.33 26 210 1.38 24.186 110 1.55 35.35 27 215 1.38 23.857 115 1.54 34.44 28 220 1.37 23.538 120 1.53 33.59 29 225 1.37 23.229 125 1.52 32.79 30 230 1.36 22.9210 130 1.51 32.04 31 235 1.35 22.6411 135 1.50 31.34 32 240 1.35 22.3612 140 1.49 30.68 33 245 1.34 22.0913 145 1.48 30.06 34 250 1.34 21.8314 150 1.47 29.46 35 255 1.33 21.5815 155 1.46 28.90 36 260 1.33 21.3316 160 1.45 28.37 37 265 1.32 21.1017 165 1.44 27.86 38 270 1.32 20.8718 170 1.44 27.38 39 275 1.31 20.64
y = 47753x-1.7035 R2 = 0.9523
0
50
100
150
200
250
0 10 20 30 40 50 60
Diameter (d )
Pres
sure
(h)
`

28
19 175 1.43 26.91 40 280 1.31 20.4220 180 1.42 26.47 41 285 1.31 20.2121 185 1.42 26.05 42 290 1.30 20.01
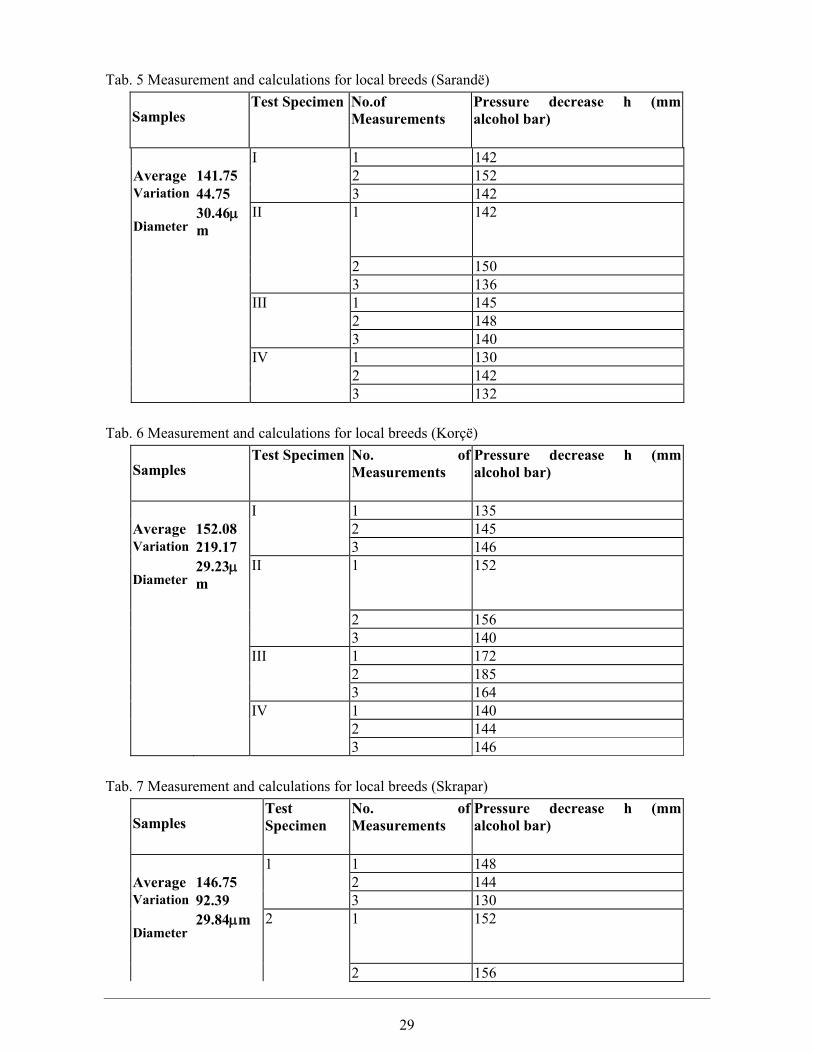
Upon equipment calibration we are ready to start measurement of the wool fibre samples taken from local breeds. Tests performed in the air penetrability equipment FM-06 are converted in tabular form and in such a way we can get average thickness of wool fibres. Below, we have presented the measurement results performed in air penetrability equipment FM-06, in the Textile Physic-Mechanic and Chemical Lab, using calibration made with reference samples.. Specimens are selected randomly, with a weight 1,5g from samples taken from different local breeds. Results are summarized below. Tab. 4 Measurement and calculations for local breeds (Shëngjergj)
Samples Test Specimen No. of
Measurements Pressure decrease h (mm alcohol bar)
I 1 186 Average 184.25 2 185 Coefficienof Variation
25.66 3 189
Diameter 26.11μm
II 1 190
2 186 3 180 III 1 178 2 174 3 180 IV 1 189 2 186 3 188
29
Tab. 5 Measurement and calculations for local breeds (Sarandë)
Samples Test Specimen No.of
Measurements Pressure decrease h (mm alcohol bar)
I 1 142 Average 141.75 2 152 Variation 44.75 3 142
Diameter 30.46μm
II 1 142
2 150 3 136 III 1 145 2 148 3 140 IV 1 130 2 142 3 132
Tab. 6 Measurement and calculations for local breeds (Korçë)
Samples Test Specimen No. of
Measurements Pressure decrease h (mm alcohol bar)
I 1 135 Average 152.08 2 145 Variation 219.17 3 146
Diameter 29.23μm
II 1 152
2 156 3 140 III 1 172 2 185 3 164 IV 1 140 2 144 3 146
Tab. 7 Measurement and calculations for local breeds (Skrapar)
Samples Test
Specimen No. of Measurements
Pressure decrease h (mm alcohol bar)
1 1 148 Average 146.75 2 144 Variation 92.39 3 130
Diameter 29.84μm 2 1 152
2 156

30
3 154 3 1 153 2 145 3 128 4 1 151 2 158 3 142
DISSCUSION OF RESULTS
From studying two standards, it was observed that FM-06 equipment of air penetrability, belongs the method of “constant flow” [1], and that was quite possible the application of this standard measurement (according to both international standards) in the Textile Physic-Mechanic and Chemical Lab of the Textile Department, accredited in compliance to ISO 17025. Side elements for the application of the methodology foreseen in the standard, which we could not realize in this study, were: - Use of manual combs or Shirley analysers to prepare testing specimens; - Periodic control of air flow in the equipment; - Periodic calibration, using reference samples previously tested from analogue accredited labs; To calibrate the FM-06 equipment are used measurements of diameters of wool fibres performed some years ago, with samples taken from local breeds, with the projection microscope (Lana meter). The above-mentioned study tented also to calibrate FM-06 equipment of air penetrability, but the calculations for calibration, as they are not referring to international standards, should be cautiously accepted. Standard calibration methodology leaded us in formulating an exponential equation of the relationship between pressure decrease h and average diameter d of the wool fibres, as well as in compiling a table presenting this relationship between those two parameters, which would serve during the tests performance. Test results from different wool fibres from local breeds, in relation to their thickness with the air penetrability method, according to international standards, classify them in between classes ½ rough and ½ thin, following also the Albanian standard, 56’S following English standard and Croisé II following French standard [9]. Conclusions
• In Albanian labs of the textile testing is quite possible the application of indirect method to measure thickness of wool fibres, in conformity of international standards.
• It is possible adoption of the ISO 1136:1976 standard as an Albanian standard, from the Technical Committee 248 Textiles of the General Directorate of Standardization (GDS).
• Wool fibres from local breeds according to measurements performed from this study, classify in fibres for spinning systems to produce low thickness wool yarns
• Wool fibres from local breeds of the northern regions have better thickness characteristics compared to those in southern regions of Albania.

31
References [1] ISO 1136:1976 Wool – Determination of mean diameter of fibres – Air permeability method, 1976 [2] IWTO (E)-6-86 Method of test for determination of the mean fibre diameter of wool fibres in combed sliver using airflow apparatus [3] Fishta, R Rritja e dhënve, Tiranë 1990, faqe 39-45 [4] The Airflow Apparatus IWTO without date [5] IWTO (E)-28-82, Determination by airflow method of the mean fibre diameter of core samples of raw wool [6] Monfort, S.L., Ann. Sci. Text. Belges, 1975, No. 1, page 58 [7] Kozeny, Wasserkraft und Wasserwirtshaft, 1931, I, page 67 [8] Grup autorësh, Aparatet matës në industrinë tekstile, Moskva 1972 faqe 123 [9] Fleis, F., Prove tessili, Mannuale di technologia tessile Roma 1991 faqe 1233 IV. PREVENTION OF THE POLLUTION IN THE ENVIRONMENT OF THE TEXTILE INDUSTRY
Spiro Drushku, Majlinda Hylli, Albania Abstract
This publication is focused mainly in pollutions that are caused and generated from the dyeing processes, printing and finishing because these are activities that have significant effects on the environment. Also they are evaluated like the biggest consummators to the consumption of resources, especially water, for this reason its pollution is treated as well. The best alternatives of the pollution prevention recommended are: redesigning of products, redesigning of processes, substitution of raw materials, new technologies, good housekeeping practices, opportunities for recycling at source, opportunities for waste recovery, external recycling, and energy recovery. The opportunities for the reduction of pollutions recommended are: redesigning of processes where the studies are focused in the substitution of raw materials, choice of new ranges of reactive dyes, substitution of conventional lubricants with hydrosoluble oils in the manufactured of knitted fabric, substitution of surfactants with biodegradable surfactants, replacement of the after chroming wool dyeing process with the dyeing process using reactive dyes, the use of new sulphur dyes. Another alternative for the reduction of the pollution level in the environment is recycling at source for which we can be mentioned: substitution of starch- type sizing products with synthetic soluble in water, for manufacturing woven fabric, membrane technology for recycling wastewater, etc. Introduction
The textiles sector encompasses a wide diversity of activities. Below we present one such possible group by subsectors:
• Washing and combing of wool and hair • Preparation and spinning of textile fibres • Manufacture of woven fabrics • Manufacture of knitted fabrics • Textile dyeing • Textile printing • Textile finishing • Apparel manufacture (garments) • Rug and carpet manufacture
32
• Manufacture of rope, twine, netting, etc. • Manufacture of non-woven fabrics This variety of activities, together with the diversity of existing fibres and combinations of
fibres, the handling requirements of each of them and the constant change in the market demand, subject to the dictates of fashion, make the textiles sector dynamic and of great interest, but at the same time a highly complex sector which is constantly evolving.
The situation of the textiles sector concerning environmental management is diverse, specifically in the dyeing, finishing and printing subsectors, given that both legal obligations and the infrastructures available in the different countries are also diverse. With regard to costs relating to environmental management, it can be concluded that the main costs concern the supply of water, the cost of treating wastewater and the taxes applicable as well as the cost of waste management. Other costs, such as taxes on water consumption, waste generation or emissions into the atmosphere, or the cost of treating these emissions are of less importance or are nonexistent.
As far as the description of the dyeing, printing and finishing subsectors are concerned, this has been limited to:
• Dyeing of cotton, wool, cellulosics and synthetic fibres and yarn, and blends of each of these with other fibres.
• Dyeing and finishing of cotton and wool fibres, and blends of both with other fibres. • Dyeing and finishing of cotton, wool and cellulosic knitwear, and blends of each of these
with other fibres. • Printing of cotton, wool, cellulosics and synthetics, and blends of each of these with other
fibres. 1.Description of the dyeing, finishing and printing processes 1.1. Textiles ennobling
The textiles ennobling subsector includes all those industries whose main activity is to provide textiles material with the suitable characteristics for their use as an intermediate or end product. These characteristics are:
• Colour and technical specifications of the colour (fastness) • Lustre • Texture • Dimensional stability • Tailority
Generally speaking, the material is prepared for dyeing or printing, is dyed or printed and, then, the sizing and finishing processes are applied. These processes are determined by a series of fundamental factors, such as:
• The fibres • The textile products (types of yarn and types of weave to make the fabrics) • The dyes • The auxiliary and chemical products • The temperature • The dyeing time • The machinery used • The water (quality and quantity)
The relationship between these factors depends on the following conditions:
• Each type of fibre requires a certain family of dyes • Each fabric requires certain, more suitable handling conditions (in rope form or open-width)

33
• A cycle of temperature variation with time and specific physical-chemical conditions of the aqueous dye solution (pH, redox potential, conductivity, etc.), which together must be optimised in each case, corresponds to the system which consists of the fibre, the dye and the type of machine.
• The textile machinery conditions the type of textile product and the dye cycle temperatures that
are usable. • The water affects the rest of factors.
Types of fibre Depending on their origin, fibres can be classified into:
• Natural fibres: these fibres are of vegetable or animal origin such as cotton, wool and silk. • Chemical fibres of natural polymers: they are so denominated because they are fibres that
are artificially obtained from a natural polymer such as cellulose. Rayon, cellulose acetate, etc. are artificial fibres. Later in this document, they shall be referred to as cellulosic fibres.
• Chemical fibres of synthetic polymers: these are obtained by the organic synthesis of petrochemical derivatives. They have a polymeric structure and among them, polyester, polyamide, acrylic fibres, polyolefin and spandex fibres are notable.
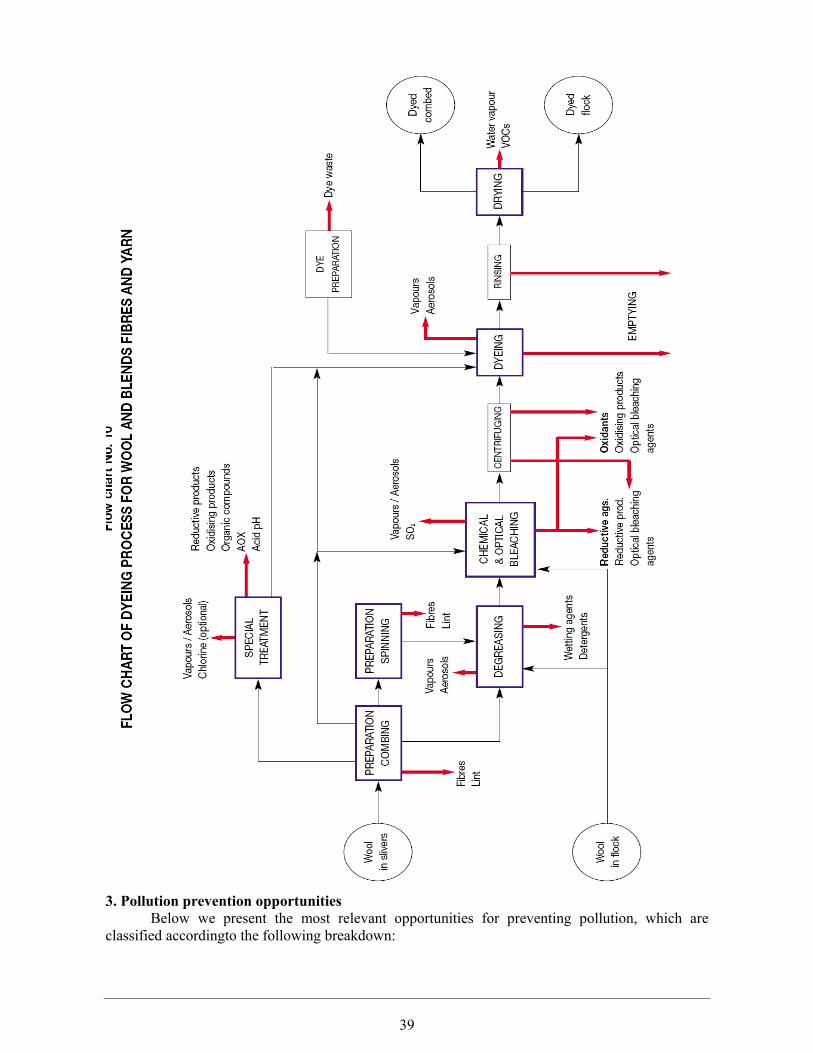
Figure 1. Dyeing, printing and finishing processes.
1.2. Dyeing and finishing processes
Here we present the basics of the most common dyeing and finishing processes. For each process,the most frequent unitary and auxiliary operations are analysed and the commonly used rawmaterials and chemical additives are identified. Most operations are performed “wet” and take place in a receptacle or vat filled with liquid (usually water), into which the raw materials and additives have been dissolved or in which they are suspended. The textile material is submerged in this liquid. Immediately following this, this material is pressed in order to remove the excess liquid, which is returned to the receptacle for reuse. Next, the washing operations are carried out in order to eliminate the remains of additives whose permanence in the material is not desired, so as not to hinder subsequent following operations. 1.2.1. Preparation
Preparation includes all operations prior to dyeing, whose aim is to ensure the physical and chemical properties of both the finished textiles, and, in some situations, of the intermediate products, favouring the later reactions that take place in dyeing. For this reason, some of these operations may be considered similar to the finishing operations and, in fact, they are not very different at all.

34
The aim, therefore, of preparation operations is to clean the textile materials of the impurities thatare present in them or to provide them with special qualities and characteristics. Among preparation operations, the following are noteworthy:
• Mercerising • Scouring • Degreasing • Carbonisation • Fulling • Singeing • Quenching • Chemical washing • Solvent washing • Chemical bleaching • Optical bleaching
1.2.2. Description of the dyeing process
Aimed at modifying the colour of a textile element, in any form, through the application of dye material, for both continuous procedures and batch dyeing. In either of the two cases, the aim is to achieve the bath exhaustion and fixation of as much dye as possible to the fabric or textile element, to limit dye losses in the later washing stages, and during its use. The application of any dye can be described according to the following stages:
• First stage: transfer of the dye from the dye bath to the fibre surface. • Second stage: diffusion or migration of the dye molecules from the surface of the fibre to the
interior of the material to be dyed. • Third stage: fixing of the dye on the reactive points of the fibre’s molecular structure.
1.2.3. The dyeing process The families of dyes used for the dyeing of yarn, fabric and knitwear are given in table 1. :
Table 1. Combination of the types of dye used in different applications
1.2.4. Description of the finishing process
Following dyeing, later treatments may be performed on the fabric in order to achieve special characteristics for the end textile product. The fabric’s characteristics may be changed by performing physical or mechanical treatments (dry finishing processes) or by applying chemicals (wet sizing processes). In some cases, the results

35
could be achieved in any of both ways, as is the case of lustre. In others, only one possible way exists, as is the case of impermeability or fire-retardant qualities. All wet treatments are principally based on the coating or impregnation of the fabric with different substances, which may be applied indistinctly to bleached or dyed fabrics. Normally, the wet finishing subprocesses follow the operations below:
• Application of the finishing products, by immersion in a bath containing the chemicals, and later squeezing in the foulard; application of finishes using minimal impregnation techniques; foam systems; scraper devices, etc.
• Fixation by the effect of temperature Types of finishing subprocesses are:
• Mechanical finishing (Heat setting Brushing and raising, Softening or calendaring, Embossing, Shearing, Sanforizing)
• Chemical finishes (Chemical softening, Anti-static treatment, Flame-retardant treatment, Shrink-resistant treatment, Waterproofing, Crease resistant treatment, Coating, Rot proofing treatment, mothproofing and fungicide treatment)
1.3. Dyeing and finishing process The process of the dyeing of fibres and yarn consists of the following operations.
Table 2. Main operations in dyeing process of fibres and yarn. Cotton Wool Cellulosics Synthetics Scouring Mercerising Caustisizing optical and chemical bleaching Colouring Drying
Preparation of combing or spinning of wool and blends Anti-felt treatment of combing Degreasing Optical and chemical bleaching Centrifuging Dyeing Drying
Scouring or washing Optical and chemical bleaching Dyeing and finishing Drying
Scouring or washing Steaming Bleaching (only when necessary) Dyeing Drying
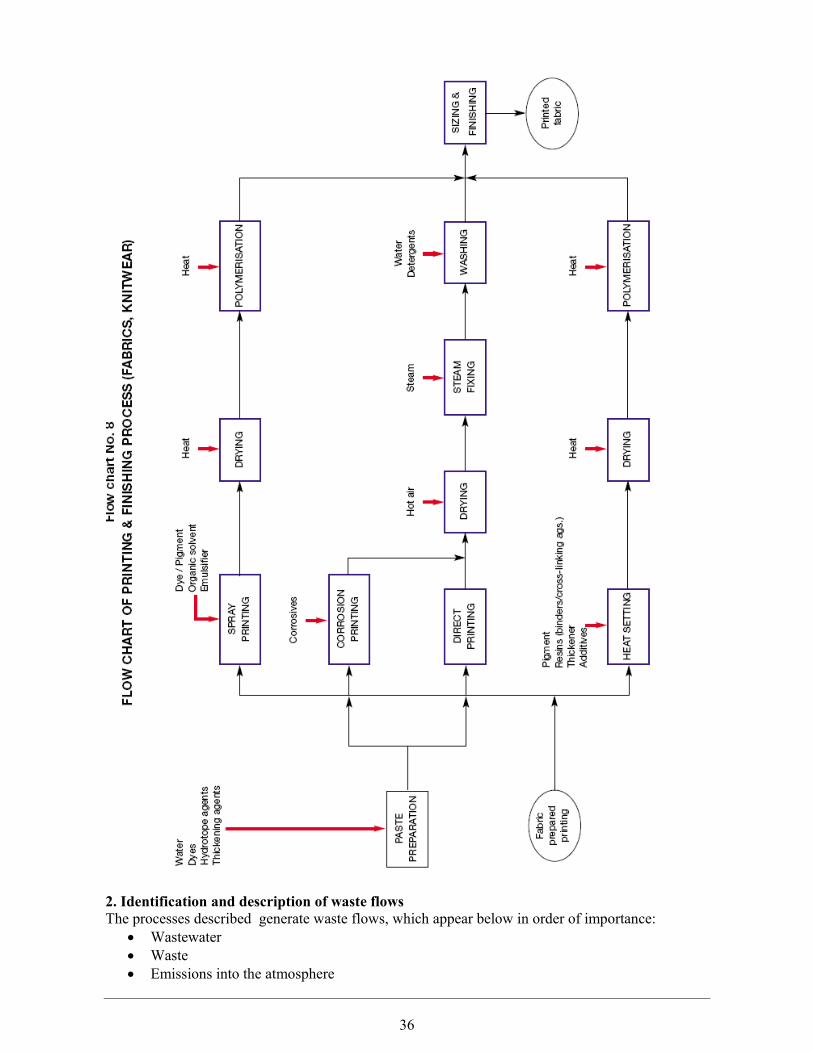
1.4. Printing and finishing processes
Printing is another type of process in which colour is given to the fabric. This colouring is not done uniformly but rather in the form of a drawing with the use of different technologies. Printing techniques are: Direct printing, Printing by corrosion, Reserve printing
Table 3.Kombination of dyes and pigments in printing
36
2. Identification and description of waste flows The processes described generate waste flows, which appear below in order of importance:
• Wastewater • Waste • Emissions into the atmosphere

37
Wastewater in general presents problems of colour, relatively high temperatures and high concentrationsof BOD5, COD, suspended solids, toxicity and conductivity. Its characteristics maypresent large variations due to the broad spectrum of dyes, pigments, auxiliary products and the processes used. Both the wastewater and the other waste flows are analysed in this chapter according to theirnature, and we present them as follows:
• Specific waste flows generated by the operations of the processes themselves • Associated waste flows • Other waste flows
2.1. Main waste flows generated by the processes 2.1.1. Dyeing of fibres and yarn Wastewater
Table 4. : Kharacterisation of fibre dyeing wastewater
Parameter Range of concentration Kotton Wool Cellulosics
PH 10-12 10-12 10-12 COD MG/L 800-1,200 500-900 500-900 BOD5 MG/L 200-400 150-300 150-300 Suspended solids mg/l
50-100 50-100 50-100
Colour mg Pt- Co/l 300-1,000 300-1,000 300-1,000 Conductivity μS/cm
3,000-6,000 3,000-6,000 3,000-6,000
Waste
In dye preparation waste may be generated if excess dye has been prepared. Emissions into the atmosphere
In scouring, alkaline vapour emissions are released into the atmosphere, which are given off in the boiling process, between 50 and 100º C. In dyeing operations, volatile organic compound emissions are produced. The drying operation produces the emission of water vapour and volatile organic compounds. 2.2. Main associated waste flows 2.2.1. Wastewater In the dyeing, printing and finishing processes, there are some operations exist that are not directly linked to the production process, but that become essential for the sequential development of production. 2.2.2. Waste The waste products not specifically generated by the processes respond to the most common waste flows, and may be classified as generic or repeated waste from all processes. There is a wide range of such waste products, which we identify below:
• Obsolete (out of fashion) and out of date dyes • Wooden pallets • Paper sacks • Containers for bulk products • Metal drums • Plastic bags and drums

38
• Cardboard boxes • Metal rings • Yarn cones (broken or discarded) • Dye trays and supports (broken or discarded) • Used oils and lubricants • Exhausted cleaning solvents • Plastic and paper packaging waste • End products that do not meet specifications • Rejected textile raw materials • Spilled solid/liquid products.
2.2.3. Atmospheric emissions Cleaning with solvents
Operations exist that are not linked directly with the production process, but which become essential in order to develop continuous production. This is the case for some cleaning done with solvents, which constitute sources of diffuse origin emissions.These solvents and degreasing agents are used for cleaning printing machines, specifically in the print injectors and other parts which are in contact with dyes, pigments and printing pastes. Also in some dyeing equipment. Storage of end products
Textiles stored can, in some cases, emit volatile compounds due to their use in the operations to which they have been subjected and the residual presence in manufactured products, especially auxiliary materials, with which the textile products are impregnated. Table 5. Origin of waste flow
39
3. Pollution prevention opportunities
Below we present the most relevant opportunities for preventing pollution, which are classified accordingto the following breakdown:

40
Opportunities for reduction at source • Redesigning of products • Redesigning of processes • Substitution of raw materials • New technologies • Good housekeeping practices
Opportunities for recycling at source Opportunities for waste recovery
• External recycling • Energy recovery
3.1. Opportunities for reduction at source Redesigning of processes 3.1.1. Substitution of raw materials 3.1.1.1.Choice of new ranges of reactive dyes
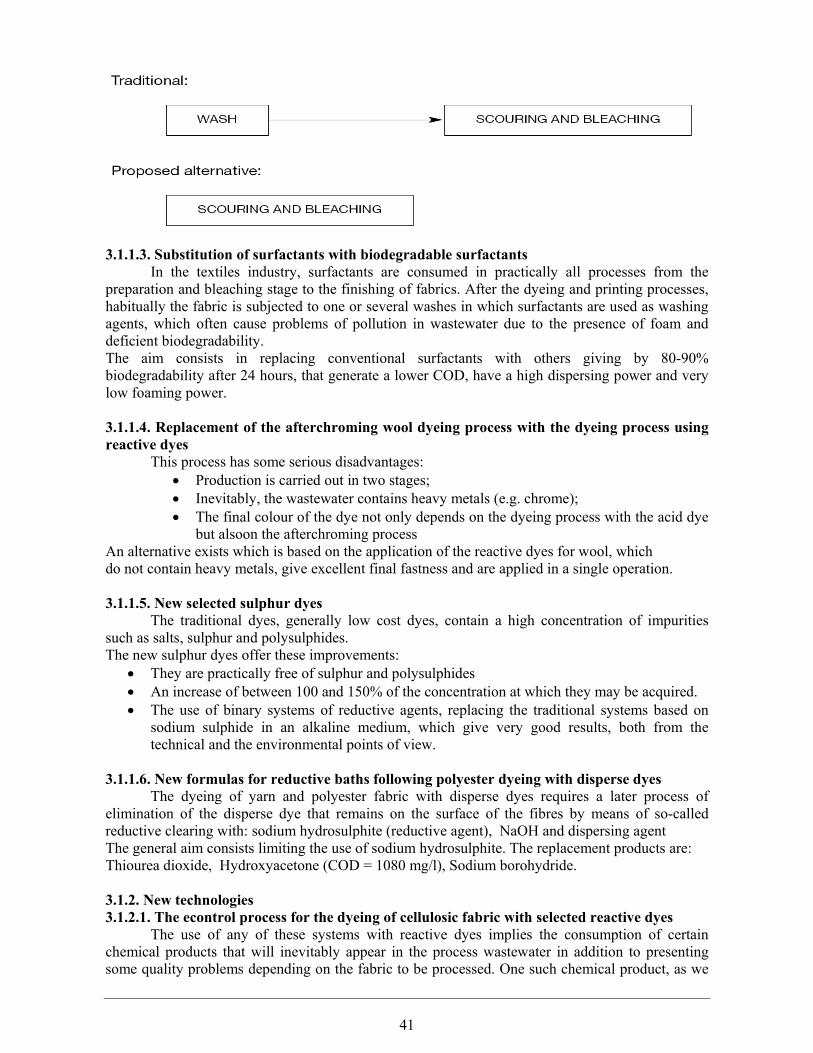
Reactive dyes are one of the most frequently used families of colouring agents for the dyeing of cotton, rayon and linen fabrics. Due to its inherent chemical characteristics, only part of the dye that is introduced into the dye bath reacts chemically with the fibre by means of a covalent bond. The rest of the dye reacts with the water and is known as hydrolysed dye. New ranges of reactive dyes have been designed: 1. They exhaust more onto the fibre (with this, less dye remains in the dye water). 2. Each molecule of dye contains more reactive groups and so the percentage of dye to react with the fibre is considerably higher (thus lowering the amount of hydrolysed reactive dye). 3. The reactive hydrolysed dye within the fibre is more easily removed (and thus the number of washing baths will be reduced). 4. They combine two or more chromophore groups in each dye molecule in order to obtain high optical density using the same concentration of dyes as in the old ranges. 5. They can be applied by reducing the concentration of the electrolyte necessary in the dye bath. 6. An increase in the adsorption of the dye in the activated sludge of the treatment works, if one is available. 3.1.1.2. Substitution of conventional lubricants with hydrosoluble oils in the manufacturing Of knitted fabric. The production of knitted fabrics requires the efficient lubrication of the mechanical elements of the knitting machine and the needles. The substitution of old lubricating oils which are non-biodegradable and non- self-emulsifying with new lubricants of a self-emulsifying nature for the manufacturing of knitted fabric, means that it can be eliminated from fabric in water at a temperature of 40º C, which means that scouring and bleaching can be done on the fabric in a single operation
41
3.1.1.3. Substitution of surfactants with biodegradable surfactants
In the textiles industry, surfactants are consumed in practically all processes from the preparation and bleaching stage to the finishing of fabrics. After the dyeing and printing processes, habitually the fabric is subjected to one or several washes in which surfactants are used as washing agents, which often cause problems of pollution in wastewater due to the presence of foam and deficient biodegradability. The aim consists in replacing conventional surfactants with others giving by 80-90% biodegradability after 24 hours, that generate a lower COD, have a high dispersing power and very low foaming power. 3.1.1.4. Replacement of the afterchroming wool dyeing process with the dyeing process using reactive dyes
This process has some serious disadvantages: • Production is carried out in two stages; • Inevitably, the wastewater contains heavy metals (e.g. chrome); • The final colour of the dye not only depends on the dyeing process with the acid dye
but alsoon the afterchroming process An alternative exists which is based on the application of the reactive dyes for wool, which do not contain heavy metals, give excellent final fastness and are applied in a single operation. 3.1.1.5. New selected sulphur dyes
The traditional dyes, generally low cost dyes, contain a high concentration of impurities such as salts, sulphur and polysulphides. The new sulphur dyes offer these improvements:
• They are practically free of sulphur and polysulphides • An increase of between 100 and 150% of the concentration at which they may be acquired. • The use of binary systems of reductive agents, replacing the traditional systems based on
sodium sulphide in an alkaline medium, which give very good results, both from the technical and the environmental points of view.
3.1.1.6. New formulas for reductive baths following polyester dyeing with disperse dyes
The dyeing of yarn and polyester fabric with disperse dyes requires a later process of elimination of the disperse dye that remains on the surface of the fibres by means of so-called reductive clearing with: sodium hydrosulphite (reductive agent), NaOH and dispersing agent The general aim consists limiting the use of sodium hydrosulphite. The replacement products are: Thiourea dioxide, Hydroxyacetone (COD = 1080 mg/l), Sodium borohydride. 3.1.2. New technologies 3.1.2.1. The econtrol process for the dyeing of cellulosic fabric with selected reactive dyes
The use of any of these systems with reactive dyes implies the consumption of certain chemical products that will inevitably appear in the process wastewater in addition to presenting some quality problems depending on the fabric to be processed. One such chemical product, as we

42
have already mentioned, is urea. Urea contributes to increasing the degree of nitrogen in wastewater and therefore its progressive reduction is advisable. The Econtrol process provides a fixing route in one stage, which allows, in today’s industry, for the efficient dyeing of long or short batches, avoiding long beaming times. The fundamental sequence of stages is shown in the figure below:
3.1.2.2. Kolorite
Habitually, the manufacturer of finished fabric must provide his clients with samples of the fabric,in the colours requested by the client.On other occasions, physical models of some sizes must be produced before the client decides to purchase a consignment. This involves a highly complex process of dyeing, printing and finishing of small yardages and garment-by-garment sewing, which lead to the consumption of resources and the generation of proportionally more effluents and waste products than those which are generated by larger consignments. Colorite is a computer programme by means of which it is possible to visualise the true colour of a sample on the screen and on different textures. It is possible to send this information via e-mail to any other part of the world with full guarantees that wherever it is sent, it will be seen in exactly the same colour (true colour). It is a new tool for colour.
3.1.2.3 Recovery and reuse of printing pastes
The printing paste that remains in the rotary printing system after the printing process finished is eliminated during the cleaning of the different elements of the equipment: moulds, scraper systems, conduits, drums, etc. This involves a great loss of dyes and printing paste, with all the chemical products that are necessary, and the corresponding wastewater pollution. The new patented technology is capable of cleaning and recovering the printing paste from the print system’s conduits. The recovered paste (between 60 and 75%) could be reused as a component for later printing pastes if colourimetry equipment is available and the software suitable, or it could be managed as waste. 3.1.2.4. Reductive treatment following the dyeing of polyester with disperse dyes in the same dye bath.
Traditionally, after polyester dyeing at 130ºC, the dye bath should be cooled to 70ºC and then thrown away, and the following products are added to the new bath:
• NaOH, • Sodium hydrosulphite (reductive agent), • Dispersing agent
The reductive bath is performed at 80ºC for 20 min. Then, the water is thrown away and one or two additional baths must be used in order to eliminate the reductive agents and waste alkalis. A new formulation of surfactant products often allows the reductive bath to be done in the same dye bath during the cooling cycle between 130 and 70ºC. At the end of dyeing at 130ºC, bath cooling is started. When a temperature of approximately 98ºC is reached, the following products are put in the machine:

43
Tenyclear PES..3g/l (a product that contains thiourea dioxide, alkali, dispersing agents,etc.) During the cooling process to 70ºC for 20 min, the product performs the reductive clearing of the polyester. 3.1.2.5. Liposomes as auxiliaries for the dyeing of wool
In addition to containing the necessary dyes and chemical products, dye baths must have sufficient quantities of equalising products and electrolytes (soluble salts), and thus the COD of dye wastewateris high. The use of liposomes as auxiliary products in the dyeing of wool with acid dyes makes it possible to dye wool obtaining good exhaustion, at 80ºC (this temperature is lower than that used in the traditionalsystem) for 40 min, which implies:
• Less superficial damage to the wool, • Energy savings • Not using electrolyte, • Lower COD in dye wastewater
3.1.2.7. Washing of knitted elastic fabric prior to the thermofixing process
Knitted elastic fabrics made of chemical fibres (polyester or polyamide) with Spandex filaments, are usually subjected to a preliminary stage of fabric thermofixing, which is done in a stenter in order to avoid flaws in the later stages of washing and dyeing.
The new process proposes the washing of the knitted elastic fabric in order to eliminate the weaving oils prior to thermofixing.
3.1.2.8. Samples by digital printing
The process, from the buying of a design, which is generally on paper, until the printed products Reach the market, is extraordinarily long and costly. Thanks to the new technique of digital stamping, samples of the designs created for printing can Be made on the fabric without the need to engrave and create cylinders, and with no need to carry Out the physical process of printing, as it will be done later in the factory. By connecting one or several cad (computer aided design) systems to a digital printer printing on fabric, it is possible to carry out samples with different types of dyes: reactive, acid, disperse and pigment dyes. This means that it is possible to later obtain a reproducibility with the results that are going to be obtained with the traditional method. The digital printer is controlled by a printing server (rip) which allows the storage of the work and the optimisation of its functioning.

44
3.1.2.9. Systems of minimum finish application
The application of finishes to bleached, dyed or printed fabrics is usually done by the full bath system, that is to say, that the fabric remains submerged for a certain time in a bath that contains the finishing product which is to be applied. Having finished the application, the fabric must be subjected to hydroextraction and drying, which, in addition to the generation of wastewater and the energy used for drying, generally, implies slow production. There are several possible alternative techniques to achieve the necessary quantity of finishing Product, but applying a minimal bath quantity on the fabric. The main ones are:
1. The application of unstable foams on the fabric: the finishing products are applied in a foaming Machine which speads the foam onto the fabric. With this, the fabric is impregnated to less than 30% .
2. Minimum bath application cylinder. This is an automatic machine which is based on an inductor cylinder that transports the bath from a trough to the fabric, while two bolsters determine the weight per square metre before and after the impregnation process. Impregnation in the region Of 30% is also achieved.
3.1.3. Good housekeeping practices 3.1.3.1. Substitution of traditional paraffin with synthetic paraffin in the formula for the sizing of cellulose warp threads and its blends with chemical fibres
The sizing must be eliminated in the desizing process, which is one of the first operations of the Textiles ennobling sector and, without doubt, is the operation that contributes the most to the wastewater pollutant load as far as cod and bod levels are concerned. When it is still technically not considered possible to substitute the so-called chemically modified Starch and starch-based semi-synthetic sizes (which are also mixed with 6 or 7 products, among Which are the lubricating agents such as paraffin) with the new hydrosoluble sizes, it is highly recommended to substitute conventional paraffin with the new synthetic paraffin which, being itself easily emulsifiable in water. 3.1.3.2. Demineralisation and desizing of woven cotton fabric
The processes of preparation (desizing-scouring) and bleaching are the object of continuous innovations since they affect almost the whole of textiles production. The traditional steps for the preparation and bleaching of woven cotton fabric may be innovated On the basis of the extraction of the cations of di- and trivalent metals that are contained in the Cotton fibre, using formulations of easily biodegradable products with high complexing power of The di- and trivalent cations and high power to disperse the impurities. For woven fabric, enzymatic desizing may be used to perform simultaneous demineralisation in such a way that following rinsing, the fabric can be directly subjected to peroxide bleaching, thus reducing the number of stages in the preparation and bleaching stages.

45
3.1.3.3. Washing and dyeing of knitted polyester fabrics in a single bath
Traditionally, the dyeing of polyester fabrics has needed a washing stage prior to dyeing given that although it is an essentially hydrophobic fibre, uniform hydrophility and absorbency must be achieved in all of the fabric to be dyed. This large number of stages implies a high consumption of water and energy and the generation of wastewater of different characteristics at each stage. Currently, by using special surfactants, it is possible to perform the washing and dyeing simultaneously in just one bath. 3.1.3.4. Single stage desizing, scouring and bleaching of cotton fabric. For woven cotton fabric and blends with synthetic fibres, a pretreatment routine consisting of Three stages has for many years been the standard procedure, and includes:
• Desizing, • Scouring, • Chemical bleaching the fact that three stages are needed implies a high level of water and
energy consumption and the generation of wastewater of different characteristics at each stage.
New formulations of new auxiliaries, combined with automatic dosage systems and steamers make this new process possible. The flash steam procedure unifies desizing, alkaline treatment (scouring) and pad-steam bleaching (padding - steaming) with hydrogen peroxide in a single stage, and so the efficiency of the process is increased. 3.1.3.5. Printing with pigments
The direct printing of fabrics requires, for each type of fibre, the use of the suitable dyes. A conventional direct printing process involves:
• The preparation of the printing paste, • The printing onto the fabric, • Drying, • Steaming, • Washing, • Finishin.
All of these operations require specific machinery and involve significant production time as well as water and energy consumption and the generation of wastewater in the wet processes and equipment cleaning operations. On the other hand, each type of fibre requires a specific dye for it to diffuse and fix in it. This complicates the printing formulas and processes in the frequent case of fibre mixtures. Printing with pigments is the most important printing technology in the world. It is estimated that Over 60% of all printed fabrics are made using this technique. The traditional dyes and printing systems may be replaced by printing with pigments given that with the right chemical means, pigments may be fixed onto all sorts of fibres. The main steps are:
• Printing, • Drying, • Polymerisation (with hot air at 160ºc for 4 min)

46
3.2. Opportunities for recycling at source 3.2.1. Recycling at source 3.2.1.1. Substitution of starch-type sizing products with synthetic, hydrosoluble sizes in the sizing of warps for manufacturing woven fabric
Sizing is an essential operation in order to allow the high-speed production of woven fabric. TheTraditional sizing formulas involve the mixing of a high number of components (often starch-type Components) which, once applied on the warp threads, are not dissolved by the wash water and so they must be eliminated from the fabric in the enzymatic desizing process, which is a long, costly process that pollutes wastewater. The substitution of starch-type sizing products with synthetic, hydrosoluble sizing products of the ethyl-vinyl-acetate or carboxymethyl-starch types, allows the substitution of enzymatic biotechnology with a simple wash to eliminate sizing products. 3.2.1.2. Membrane technology for recycling wastewater
Traditionally, wastewater is not usually recycled, not even once treated, and is dumped, either into public riverbeds or into the drainage network The membrane filtering system means that wastewater can be recycled, that is to say, it can be Reused in approximately the same processes in which it had previously been used. The technology of the membranes used is based on microfiltering, ultrafiltering and nanofiltering. 3.3. Opportunities for waste recovery The industries in the dyeing, printing and finishing sectors generate waste textiles (fabric or lint) Which, in some cases, may be reused in other industrial sectors. However, the existing options and the viability of each of them depend on large variety of factors such as the existing industrial structure in each geographical area or the environmental legislation that is in force. As far as the recovery of energy is concerned, some waste products, such as used lubricating oils, Used solvents or printing pastes, possess high calorific power and may be incinerated in order to Recover energy. Nevertheless, this is waste that may be regenerated or recycled, either at the same facilities where it has been generated or at specialised facilities. Recycling is considered as being the most environmentally correct option in waste manegement and has thus, priority over other options. Conclusions and recommendations Given the characteristics of the subsectors studied, it is considered that their main effects on the Environment are the following:
• High water and energy consumption. • Greater or lesser consumption of colouring agents, auxiliary and chemicals depending on the
available technology. • Large volume of wastewater with a significant pollutant load. (although the pollutant load of • Wastewater generated depends on the processes carried out, the parameters that are usually
most significant are cod, bod, total solids, aox, toxicity, and sometimes nitrogen). • Generation of colouring agents, auxiliary and out-of-date chemicals due to the great variety
that an establishment must handle and the changes in their level of consumption from one season to another generation of a large number of empty containers, corresponding to colouring agents, auxiliary and chemicals used in the process.
• Emission into the atmosphere of volatile organic compounds, if colouring agents and/or auxiliary products that contain such compounds have been used in formulating them.
However, this situation allows for the implementation of a great number of improvements in order to achieve pollution prevention and savings in natural resources. Broadly speaking, bearing in mind

47
The diversity of the sector, and in order to maintain competitiveness among companies, the solution lies in the introduction, in each particular case, of the improvement or improvements that are considered as being most suitable from among all those possible. A brief list of such improvements would be:
• The insulation of all pipes and equipment that use steam or hot water, in order to minimise energy loss.
• Assessing possibilities for heat recovery, whether by means of hot gases, steam or hot water. • Identifying the possibility of reducing the number of stages carried out wet, by carrying out
two or more stages in the same bath. In this way, usually, water and energy consumption as well as Auxiliary and chemical product consumption is reduced.
• The optimisation of processes and equipment in order to reduce the number of baths used and thus minimise water consumption.
• To implement the automatic control of the critical variables of the process in order to minimize the indices of “re-operation” and “additions”, with which not only are water, energy, colouring Agents, auxiliary and chemicals saved, but also the establishment’s productivity can be increased.
• The automation of the preparation of dye baths, pastes for printing and additives, by means of Automatic colour laboratories and the automatic dosage of auxiliaries in order to minimise potential errors which would have repercussions on a higher incidence of “re-operation” and “additions”.
• Identifying the possibilities of wastewater reuse in specific processes such as preliminary rinsing.
• Assessing the possibility of recycling at source some of the baths, some sizing agents and remains of printing pastes.
• The optimisation of machine and utensil cleaning operations. • A progressive increase in the use of dyes and processes that lead to high exhaustion onto
fibres. • The reduction, as far as possible, of the variety of colouring agents, auxiliary and chemicals
That are used; and the correct storage and control of stocks of all of these in order to reduce The generation of out-of-date products or products that are in a bad state that need to be managed as waste.
• The adaptation of the volume of the containers in which colouring agents, auxiliary and chemicals are acquired, to the degree of consumption of each product. In the cases in which consumption is high, it would be interesting to have facilities for the bulk reception of the product, given that in this way, the generation of empty containers would be avoided.
However, in order to carry out some of these measures, it is necessary to substitute certain raw Materials, acquire certain facilities and/or introduce certain new technology Session 2 V. FIBER INTERFRICTION
Artan Sinoimeri, Jean-Yves DREANi, France Abstract Textile fibers are characterized by many parameters, used as well by industrial users as by the researchers. Many studies focus on the effect of fiber length, fineness, maturity (only for cotton), tensile properties, etc. on the properties of intermediate products and yarns. Contrary, few studies concerning the fiber surface properties, especially the inter-fiber friction, appear in the scientific literature. A new and simple device is designed and used in the present study. It enables

48
measurement of inter-fiber friction force during the dissociation of a ordinary sliver. Contrary to what has previously been cited in the scientific literature, the study of a set of different cottons shows that the inter-fiber friction seem to obey the Amonton’s law rather than a more complex power model. The calculated inter-fiber friction coefficient helps to differentiate the different types of cotton and to bring to the fore the non negligible effect of the friction on yarn irregularity and imperfections, affecting this way indirectly the yarn tenacity. Meanwhile, this work has revealed a curious grouping of different types of cotton, which is not observed before. This phenomenon is undoubtedly due to the surface properties of fibers. I will present you now some research carried out in our laboratory concerning inter fiber friction properties. As you know, fibers may be natural, as cotton or wool, or chemicals. During the spinning process these fibers have to be gathered in yarns
Fiber to yarn
The fiber packages are processed first in the blowing room, then carded. The sliver obtained from the carding machine must be drafted, then probably twisted slightly in a roving structure, then twisted in yarns. Yarn quality depends on the fiber characteristics as well as on the process used.
A lot of fiber characteristics are used to predict yarn quality. The most used are the fiber length, fineness, maturity etc.
Blowroom SpinningAirjet
OE rotor
RingCarding
Combing
Drawing• doubling and
• roller draftingFlyer

49
Nevertheless, the fiber surface characteristics as the frictional one, are less used, perhaps because of the difficulties of the measurement and the interpretation. I have chosen these three devices. In the first device Postle used a single fiber drawn out of a fiber pad under pressure. It is relativly well adapted for long fibers but not at all for shorte ones. Lord and later El Moghasy used two identical fiber fringes under controlled pressure.
The question is: Can we do it otherwise and easier ? Let’s see first how fibers are arranged during the process, with individual fibers, fiber packages, sliver or roving and yarn. We have to do less manipulations. It’s better to use aligned fibers We have to control the lateral pressure The twist may disturb the pressure control. The solution is the sliver issued from the spinning process.
Let ’s see what is happening during the sliver dissociation under controlled pressure
Now let’s see a sliver. As you know, the fiber in the sliver can be presented with fibers arranged in this way
nf Fibrogram
Zero gage clamps
Postle et al.(52) Lord (55) El Mogahzy (93)i ti C tt i t fib f i ti C tt i t fib fi ti C tt i t fib f i ti C tt i t fib f i tii ti C tt i t fib f i tiC tt i t fib f i ti

50
Inter fiber Friction Measurement
DRDRimeriimeri
7189
10
Zero gage clamps
Zero gage clamps
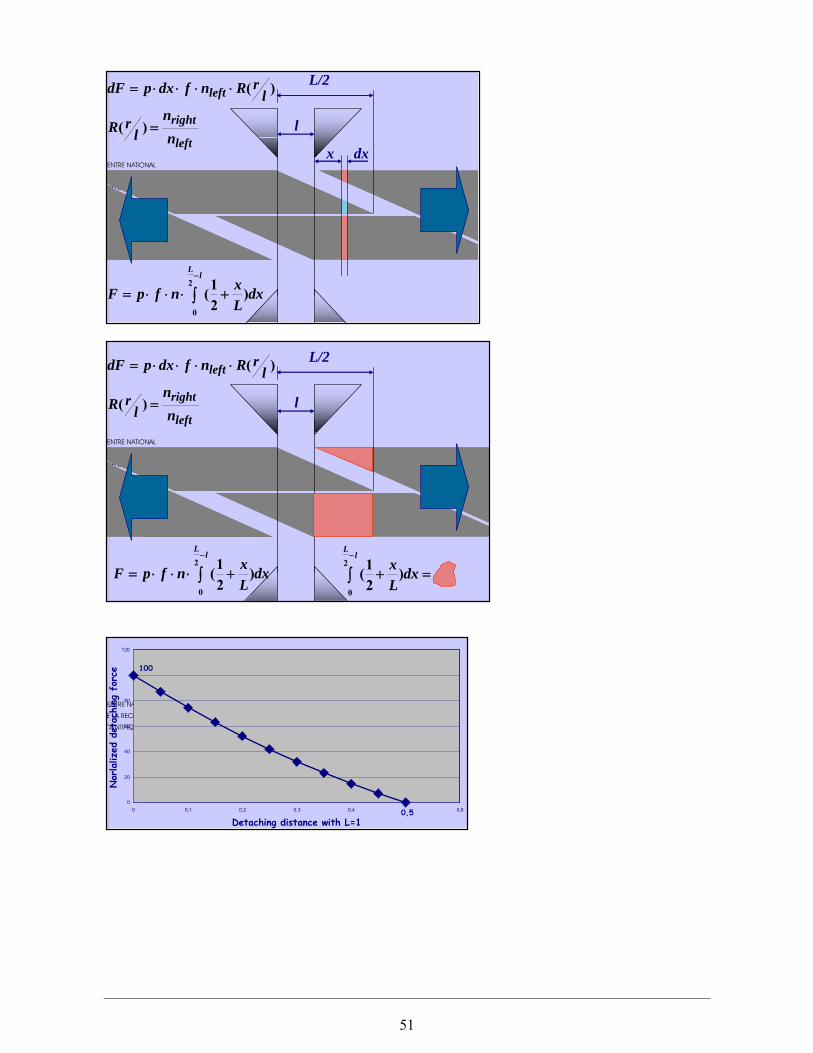
51
0
20
40
60
80
100
120
0 0,1 0,2 0,3 0,4 0,5 0,6
Detaching distance with L=1
Nor
laliz
edde
tach
ing
forc
e
l
L/2
dxLxnfpF
lL
)21(
2
0
+⋅⋅⋅= ∫−
=+∫−
dxLx
lL
)21(
2
0
left
right
left
nn
lrR
lrRnfdxpdF
=
⋅⋅⋅⋅=
)(
)(
l
L/2
x dxleft
right
left
nn
lrR
lrRnfdxpdF
=
⋅⋅⋅⋅=
)(
)(
dxLxnfpF
lL
)21(
2
0
+⋅⋅⋅= ∫−
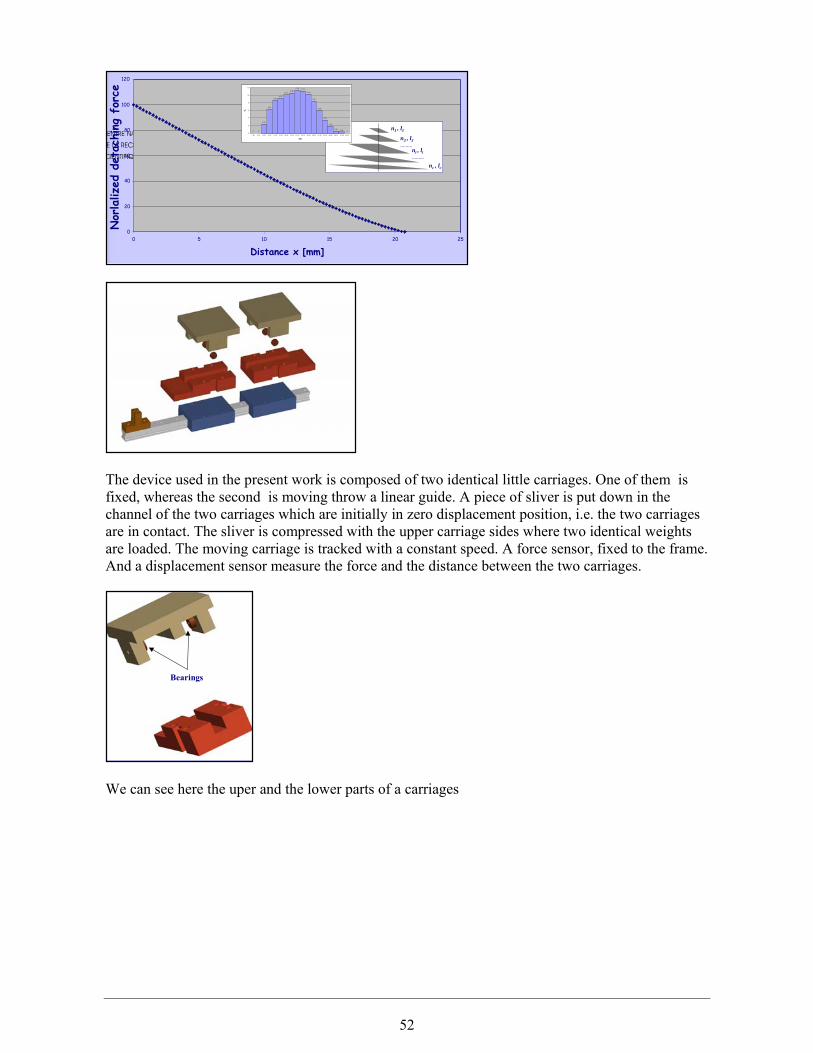
52
The device used in the present work is composed of two identical little carriages. One of them is fixed, whereas the second is moving throw a linear guide. A piece of sliver is put down in the channel of the two carriages which are initially in zero displacement position, i.e. the two carriages are in contact. The sliver is compressed with the upper carriage sides where two identical weights are loaded. The moving carriage is tracked with a constant speed. A force sensor, fixed to the frame. And a displacement sensor measure the force and the distance between the two carriages.
We can see here the uper and the lower parts of a carriages
Bearings
0
20
40
60
80
100
120
0 5 10 15 20 25
n1 , l1n2 , l2………
ni , li………
nc , lc
0 0
2,40
6,30
8,609,20
10,1010,60
11,30 11,10
10,24
8,45
5,95
3,45
1,79
0,540,30
00
2
4
6
8
10
12
1.25 3.75 6.25 8.75 11.25 13.75 16.25 18.75 21.25 23.75 26.25 28.75 31.25 33.75 36.25 38.75 41.25 43.75
mm
%
Nor
laliz
edde
tach
ing
forc
e
Distance x [mm]

53
And here is the device during e test.
The force-displacement curve for the all test is similar as shown in this Figure. The diagram can be divided into some segments. In the first OA segment the fibers start to straighten and the curve is approximately a straight line. The point B represents a threshold. After this point, the draft forces overcome the inter-fiber cohesion and friction forces and the fibers start sliding. During the BC segment, the fibers are pulled out of the clamps as a function of their length distribution. The BC region is like a plateau. After the point the friction force decreases rapidly because there are no more fibers clamped by both carriages. In the point B which represents the first moment when the slippage begins, all the fibers in the sliver cross-section are concerned by the slippage. The force value at this point seems to be a good indicator of inter-fiber frictional forces developed under controlled load.
We have first carried out same preliminary trials The model used is inspired by the classical model of Bowden and Tabor we have used three sliver counts and five pressure levels
Prelim inery trialsTypical curves force - displacement
Displacem ent
ForceDisplacem ent
Typical curves force - displacement
Displacement

54
We have used also different speeds, but in our experimental domain the effect of the speed is not significant Speed effect
It ’s interesting to remark that if the detaching force, which is the inter fiber frictional force, and the load are normalized with respect to the sliver count or the number of fiber in the sliver cross section, the model is simplified as shown here: Model estimation
We have proceed to a large scale verification of our model and device with eleven different cottons. Model verification 11- cottons
nnj
TWKT
TF
⎟⎠⎞
⎜⎝⎛= −+ 1 n
TWK
TF
⎟⎠⎞
⎜⎝⎛=⇒
Term Estimation St. deviation t Ratio Prob>|t| R2
Cotton 1
ln(K) -0.0764 0.0217 -3.51 < 0.0008
n 0.8612 0.0127 67.58 < 0.00010.985
Cotton 2
ln(K) -0.1911 0.013 -14.99 < 0.0001
n 0.9294 0.007 134.70 < 0.00010.997
njWKTF =n
njTWKT
TF
⎟⎠⎞
⎜⎝⎛= −+ 1
L(w)(mm)
SFC(w)%<12.5
L(n)(mm)
SFC(n)(mm)
Maturityratio
Coton1 25.67 5.8 21.19 18.9 0.95
Coton2 24.65 7.8 19.39 25.5 0.87
Model of Bowden & Tabor
Cottons used
Experimental conditions
Cotton 1 Cotton 2
Sliver count (ktex) 2nd DF 4.20 5.53 4.23 5.26
Weight (g) 1000, 2000, 3000, 4000, 5000
5 replications for each experiment
Preliminery trials Model

55
Fiber characteristics
The cotton used seem to be very different Spinning process: Micro Spinning
Here we have the calculated values of the logarithm of the friction constant and the power index n
25
26
27
28
29
L(w
)
C1 C11 C15 C17 C21 C26 C30 C50 C51 C52 C7
Coton
Student's t Tukey-Kramer
L(W
)L(
w)
0,86
0,88
0,9
0,92
0,94
0,96
0,98
1
Mat
urité
C1 C11 C15 C17 C21 C26 C30 C50 C51 C52 C7Coton
Student's t Tukey-Kramer0,86
0,88
0,9
0,92
0,94
0,96
0,98
1
Mat
urité
C1 C11 C15 C17 C21 C26 C30 C50 C51 C52 C7Coton
Student's t Tukey-Kramer
Cotton
Mat
urit
yL(
w)Neps L(w) CVL(w) SFC (w) UQL (w) L(n) CVL(n) SFC(n) Finesse Maturitén°
mm % mm mm mm % % mtex
1 103,3 26,0 33,1 6,2 31,4 21,5 46,1 19,5 178,5 0,878
7 136,0 28,9 32,0 4,4 34,5 24,0 45,2 16,2 161,3 0,920
11 36,5 24,7 32,1 6,0 29,3 20,7 44,0 18,6 178,3 0,938
15 95,3 26,7 33,6 5,6 32,1 21,9 46,8 18,9 163,5 0,930
17 77,5 26,6 31,8 4,9 31,7 22,4 43,5 16,4 185,0 0,955
21 68,0 27,2 30,9 4,3 32,4 23,1 41,9 14,4 186,3 0,958
26 92,5 26,2 32,2 5,7 31,5 21,8 45,1 18,5 174,8 0,893
30 60,8 25,5 32,5 5,4 30,3 21,6 43,0 16,7 181,8 0,935
50 39,5 26,0 30,4 4,5 30,8 22,0 42,4 15,8 185,5 0,933
51 106,3 25,7 33,0 5,4 30,6 21,1 46,8 19,2 170,3 0,908
52 32,3 28,3 28,2 2,7 32,6 24,9 37,4 10,3 188,5 0,980

56
We have tried to see if there are any relationships between fiber characteristics and the coefficient of friction. These results show that the cotton used seem to be somehow grouped
This remark is very evident if we plot the fiber modulus versus the friction coefficient. The relationship between K and the modulus is normal if we consider the classical microscopic model of the friction between two bodies, the shearing of the surface roughness.
0,95
0,96
0,97
0,98
0,99
1
1,01
1,02
1,03
0,5 0,55 0,6 0,65 0,7 0,75 0,8 0,85 0,9K
n
C11
C26C17
C15C1
C52
C50
C30C51 C21
C7
Group 1
Group 2
K
n
C1
C30C21C50 C51
C7
C52
C15
C17 C26
C11
-0,7
-0,6
-0,5
-0,4
-0,3
-0,2
-0,1
0
4,5 5 5,5 6 6,5 7
Module [cN/(tex*%)]
Ln(K
)
Group 1
Group 2
SFT results
Modulus [cN/(tex.%)]
Ln(K
)
Ténacité de fibre cN/tex
C1
C7
C51C21C30 C50 C52
C15
C26C17
C11
-0 7
-0,6
-0,5
-0,4
-0,3
-0,2
-0,1
026 27 28 29 30 31 32 33
Ln(K
)
MR
C7
C51C30
C50 C21
C52C15
C17
C1
C26
C11
,86 0,88 0,9 0,92 0,94 0,96 0,98 1
Taux de cire
C1
C51
C7
C50C30C21
C52
C15
C26C17
C11
-0,7
-0,6
-0,5
-0,4
-0,3
-0,2
-0,1
00,4 0,45 0,5 0,55 0,6 0
Ln(K
)
Elongation fibre %
C7
C21C51 C50 C30
C1C52
C15
C17 C26
C11
4,7 4,8 4,9 5 5,1 5,2 5,3 5,4 5,5
Fiber tenacity cN/tex
Maturity Ratio
Fiber elongation %
Waxes content %
SFT results
Coton Ln(K) σ(Ln(K)) n σ(n)1 -0,3264 0,1253 1,0040 0,0185
7 -0,1478 0,1691 1,0198 0,025011 -0,6030 0,0947 0,9576 0,014015 -0,3535 0,0841 1,0076 0,012417 -0,4553 0,1590 0,9843 0,0235
21 -0,2198 0,0974 1,0159 0,0144
26 -0,4697 0,1192 0,9835 0,017630 -0,2630 0,1286 1,0105 0,019050 -0,2558 0,0804 1,0052 0,011951 -0,2415 0,1404 1,0150 0,0207
52 -0,3060 0,0744 1,0117 0,0110
4 charge levels, 6 repetitions = 24 measures by cotton

57
The cotton grouping is confirmed if we plot the friction coefficient versus the power index Remark that the values of n are nearly 1 We have tried to see if another parameter is the responsible of the cotton grouping. No one of the parameters used is significantly different between the two groups. We can conclude for the instance that the responsible for the cotton grouping is the surface state of the fibers, which is not actually characterized by classical tests
We have tried to use the Principal Component Analyses for the two groups separately even the number of the cottons used is small. It ’s interesting to see that the fiber tenacity, the yarn tenacity and the friction coefficient are strongly correlated.
The same thing for the second group.
group2,Variables (axes F1 et F2 : 75,90 %)
Pilosité 20
B_200 20
PG_35 20
PM _40 20
CVm20
Allon33
Tén33
Allon25Tén25
Allon20
Tén20
VFMTrash
Dust
M R
IFC
UQL (w)
SFC (w)
L(w)
Nep
Cire
n nfLn(K) nf
Finesse
+ b
Rd
M aturity
M icronaire
Elongation
Strength
-1
-0,75
-0,5
-0,25
0
0,25
0,5
0,75
1
-1,5 -1 -0,5 0 0,5 1 1,5
Groupe 2
group1, V ar iable s (axe s F1 e t F2 : 69,57 %)
Tén f ib re
Elo ng at io n
M icro naireM at ur it y
R d
+b Finesse
Ln(K) nf
n nf
C ireN ep
L(w )
SFC (w )UQL (w )
IFC
M R
D ustTrashV FM
Tén2 0
A llo n2 0
Tén2 5
A llo n2 5
Tén3 3
A llo n3 3CV m2 0
PM _ 4 0 2 0
PG_ 3 5 2 0
B _ 2 0 0 2 0
Pilo sit é 2 0
-1
-0 ,75
-0 ,5
-0 ,2 5
0
0 ,2 5
0 ,5
0 ,75
1
-1,5 -1 -0 ,5 0 0 ,5 1 1,5
Groupe 1
26
28
30
32
34
Stre
ngth
G1 G2
groupe
Each PairStudent's t
0,1
0,84
0,85
0,86
0,87
0,88
0,89
0,9
Mat
urity
G1 G2
groupe
Each PairStudent's t
0,1
24
25
26
27
28
29
L(w
)
G1 G2
groupe
Each PairStudent's t
0,1
3,25
3,5
3,75
4
4,25
4,5
4,75
Mic
rona
ire
G1 G2
groupe
Each PairStudent's t
0,1

58
The comparison of the two previous pictures shows same differences concerning different influence of the fiber fineness, the maturity and the micronaire. Don ’t forget, there are few cottons concerned by this analysis, so we must be cautious. We have also observe that the the friction influence indirectly to the yarn tenacity by its effect on the yarn irregularity. The inter fiber friction affect directly the yarn irregularity, particularly small places, and there are these places and the irregularity which affect the yarn tenacity Fiber and yarn caracteristes versus friction
Conclusions: A new device SFT – Static Friction Tester: Friction fiber caracterisation: VI. RESPONSE SURFACE METHODOLOGY FOR GARMENT QUALITY ASSESSMENT.
Jorgaq Kaçani Ermira Shehi Albania
Abstract The deformation of the fabric during the sewing process is a continuous problem, while the quality control methods are being improved with difficulty. The conventional methods of the optimisation of the machine variables often tend to be subjective or determinant and also they need time because they depend on the technicians or managers skills. Most of the specialists in the process of the selection of the sewing seam specifications take the decision basing on one or several reasons as: Sewability, seam performance (seam resistance, seam strength, seam appearance (seam puckering, color, color resistance, fabric damage from the needle), availability of the sewn product, cost [2]. Seam performance will be studied here as the combination of only two factors. Seam strength and seam puckering.
Ln(K) n Fiber tenacity Yarn tenacity 20tex
Fiber tenacity 0,8052 0,6186 1 0,9590 Yarn tenacity 20 0,9145 0,8070 0,9590 1
CVm 20tex -0,8559 -0,5827 -0,9536 -0,9228 PF-40 20tex -0,9024 -0,7098 -0,9766 -0,9791
Some correlations within the 1st group vis-à-vis to the yarn ténacity
Some correlations within the 2nd group vis-à-vis to the yarn ténacity Ln(K) n Fiber tenacity Yarn tenacity 20tex
Fiber tenacity 0,8734 0,8496 1 0,7016 Yarn tenacity 20 0,9118 0,9192 0,7016 1
CVm 20tex -0,7999 -0,7724 -0,7842 -0,8775 PF-40 20tex -0,9008 -0,8846 -0,7902 -0,9591
group1, Variables (axes F1 et F2 : 69,57 %)
Tén fibre
Elongation
MicronaireMaturity
Rd
+b Finesse
Ln(K) nf
n nf
CireNep
L(w)
SFC (w)UQL (w)
IFC
MR
DustTrashVFM
Tén20
Allon20
Tén25
Allon25
Tén33
Allon33CVm20
PM_40 20
PG_35 20
B_200 20
Pilosité 20
-1
-0,75
-0,5
0,25
0
0,25
0,5
0,75
1
-1,5 -1 -0,5 0 0,5 1 1,5
group2,Variables (axes F1 et F2 : 75,90 %)
Pilosité 20
B_200 20
PG_35 20
PM_40 20
CVm20
Allon33
Tén33
Allon25Tén25
Allon20
Tén20
VFMTrash
Dust
MR
IFC
UQL (w)
SFC (w)
L(w)
Nep
Cire
n nfLn(K) nf
Finesse
+ b
Rd
Maturity
Micronaire
Elongation
Strength
-1
-0,75
-0,5
-0,25
0
0,25
0,5
0,75
1
-1,5 -1 -0,5 0 0,5 1 1,5

59
Key-Words: Input factors, Output responses, Seam strength, Seam puckering, Fabric damage, Optimisation, Experiment design, Desired area of work. Introduction
One of the main concerns in the textile and clothing industry is the correct and proper selection of some variables and their effect on the final product or process that we study. The use of the light weight and fine fabrics has been increasing and the request for micro fibres fabrics is also increasing. There are a lot of problems related to the deformation of the fabric during the sewing process. The non conventional methods of the control and quality evaluation in most of the cases are subjective and get improved with difficulty. The quality improvement for the sewn products and the sewing process including the decrease of the variation and performance improvement make this study important.
The main objective of this article is that through a mathematical methodology for the optimisation of the sewing machine parameters we could find a desirable position in the design area where the function(s) of the quality responses are stable over a certain number of the input factors (variables). We can analyse the affect of each machine factors in the quality parameters individually but this will give us only the role of each of them avoiding and not taking into consideration the interaction between factors themselves. In this article I have used the Design-Expert software that is built on the RSM methodology. The Response Surface Methodology is a collection of the statistical and mathematical techniques useful for the development, improvement and optimisation of the processes. This method has an important use in projection, development and formulation of the new products as well as in the improving of the existing ones. The most important application of the RSM [1] are in the industrial world, epsecially in those situations when some input variables strongly influence some measuring indicators of the performance or quality characteristics called responses. The real applications in practice include usually more then one response. The input variables often are called independent variables and are object of the control by the specialist or engineer atleast for the purpose of a test or epxeriment. The case of our problem is taking into consideration of multiple responses. This includes first of all design of a proper response surface model for every response and then the effort to find a set of operation conditions that in some contexts optimise all the responses or atleast covers keeps them in a desired area. This study applies the mathematical and statistical methods to evaluate and measure the qualitative indicators finding a designing area where the process most probably gives the desired results. The term “desired” is function of the supposed response. However, in many examples the term “desired” is function of more the one response as in the case of the textile and garment products. Seam quality includes these five following indicators [3]
• Sewability • Seam perforamnce • Seam Appearance • Availability • Cost
Five most important factors being considered as dominant during the seam quality tests are:

60
• type and weight of fabric • Sewing thread (number and fiber type) • Stitch and seam construction. • Stitch density. • stitch balance
The factors causing some defects are listed as follows • Non proper sewing thread for the fabric. • Thread defects. • Non proper needle fineness for the thread number. • Non proper thread tension. • Defects in the needle or wrong needle positions in the machine • Overheated needles • Damaged parts of the sewing machine • Not proper feed of the sewing machine or bad work of the worker.
Problem formulation The interpretation of the response surface can be done through contour plots as one of the most effective ways to illustrate and interpret the results. The contour plots are two dimensional plots or sometimes even three dimensional that show constant contours of the response with the coordinative system; only two variables change others are constant. The modern plots allow very interesting interpretation according the users needs. First step is choosing the right model of the RSM design, the one of Box-Behnken design.
Nr Factor Level -1 Level +1 A Thread Tension 1 3 B Needle Fineness 11 16 C Thread metric
number 65 100
D Stitch Density 2 6 Second step is determination of the responses:
Nr Responses R1 Seam Puckering R2 Seam Strength R3 Fabric Damage
Third step is automatic generation from the software of the runs table:
The software automatically generates the table with the possible combinations of the tests. There are two options for carrying out the tests: within one day only and by only one operator and in different days by different operators. This is possible by the block option and it is a technique useful to avoid the variation caused by some changes during the experiment procedure. Fore example, if we might need to use two diferent sewig machines for our experiment, or more then one operators should do the tests, in one or more days. We choose Block 1 this means that We are doing the tests in only one sewing machine, one dynamometer, by only one person and in one day.

61
The runs number and combinations are randomly generated. We will need to carry out 29 runs. After we complete the experiment in laboratory we fill out the table of runs for the respective responses: puckering , strength and fabric damage. No Test A B C D R1 R2 R3 17 1 1.00 13.5065.004.00 6 400 3 5 2 2.00 13.50 65.00 2.00 7 425 2.5 27 3 2.00 13.50 82.50 4.00 8 440 2.4 20 4 3.00 13.50 100.00 4.00 10 360 3.6 3 5 1.00 16.00 82.50 4.00 6 450 3.5 This is a part of the 29 automatically generated test combination. After all the tests have been the three response values (R1 – Seam puckering, R2 – Seam Strength and R3 – Fabric Damange) are entered in the respective columns. Step four. The model analysis This is a report of the design, factor, and response information. New items are the factor and response mean and standard deviation. There are four input factors and three responses. Design Graphic This is to plot any two columns against each other. By default, the first factor is plotted versus the first response. As we see from the Figure 1 the highest values of the puckering can be reached in higher upper thread tension.
Fig. 1: Graph column: A Thread Tension to Seam Puckering R1
Figure 1 shows the distribution of the tests results for the seam puckering to thread tension. It is clear that a minimal and average tension is neccessary for the low seam puckering or a better seam apperance.
Design-Expert® Software
Correlation: 0.651 Color points byRun
29 1
A: thread tension
R1: Seam puckering
3
3
2
3
6
66
2
3
3
2
66
6
2
2
3
2
6
3
6
33
666
6
1.00 1.50 2.00 2.50 3.00
6
7
8
9
10

62
Thread tension – Seam Strength From the plot below we see that the the thread tension doesn’t have any strong influence in the seam strength but we can see that for a minimal and maximal tension the seam strength is almost the same and it reaches the highest value for the average tension.
Fig. 2. Graph column: A Thread Tension to Seam Strength R2
Model (design) evaluation Model evaluation is used to analyse the statistical characteristics even before the data collection for the responses. The screen is used to choose the proper model which will evaluate our experiment. The main effect of the terms in the model will be quadratic and the terms will be polinomial.
Model Intercept Model A-Thread tension Model B-Needle fineness Model C-Thread metric umber Model D-Stitch density Model AB Model AC Model AD Model BC Model BD Model CD Model A2 Model B2 Model C2 Model D2 Out ABC Out ABD Out ACD Out BCD
Design-Expert® Software
291
A:Thread tension
Seam Strength 2 2
2
22
2
2222
1.00 1.50 2.00 2.50 3.00
350
382.5
415
447.5
480

63
Fig. 3: 3D Surface of Standard Error of Design.
Graphical assesment The plot of standard error of the mean shows how the error in the predicted response varies over the design space.
Fig. 4: The standard error plot
Step six. Responses Analysis For the analysis of the responses we have one factor graphs, factor interaction graph, contour plots, 3D surface, cubes graphs.
Fig. 5: Normal Plot of Residuals
Responses analysis In this phase the regres calculation starts to fit all the polinomial models for the selected function of the response.
The program generates statistics such as P-value, lack of fit, R – square for models comparisons. The result of the fit is shown in a screen through a report that can be printed out.
Design-Expert® Software
StdErr of DesignDesign Points1.
0.
X1 = A: thread tension X2 = B: needle fineness
Actual FactorsC: thread Nm= 82.50D: stitch density= 4.00
1.00 1.50 2.00 2.50 3.00
11.00
12.25
13.50
14.75
16.00StdErr of Design
A:Thread Tension
B:Needle fineness
0.479
0.536 0.536
0.536 0.536
0.593 0.593
0.593 0.593
0.650 0.650
55555
Design-Expert® Software
StdErr of Design 1.5 0.5
X1 = A thread tension: X2 = B: needle fineness Actual Factors C: thread Nm= 82.50D: Stitch density= 4.00
1.00
1.50
2.00
2.50
3.00
11.00
12.25
13.50
14.75
16.00
0.000
0.250
0.500
0.750
1.000
StdErr of Design
Thread Tension B: Needle fineness
Design-Expert® Software
Seam puckering
Internally Studentized Residuals
Normal % Probability
Normal Plot of Residuals
-2.41 -1.38 -0.35 0.68 1.71
1
5
10
2030
50
7080
90
95
99

64
If a statistically satisfied model can be found the program shows it as “suggested” and it becomes a default model. The program checks for the:
1. Highest order model with effect (low P – value) and not excluded from the analysis. 2. No lack of fit (P-value > 0.10) 3. Reasonable ration between the adjusted R – squared and the predicted R – squared (within
0.2 of each other).
The highest polinomial order model is selected where the additional terms are significant and the model is not aliased. We focus in the model with the highest values of the "Adjusted R-Squared" dhe"Predicted R-Squared R 2 – Seam puckering Intercept Model A-Thread Tension Model B-Needle fineness Model C-Thread metric number Model D-stitch density Model AB Model AC Model AD Model BC Model BD Model CD Model A2 Model B2 Model C2 Model R2 – Seam Strength Intercept Model A-thread tension Model B- needle fineness Model C- Thread metric number Model D- stitch density Model AB Model AC Model AD Model BC Model BD Model CD Model A2 Model B2 Model C2 Model D2 Model ABC Out ABD Out
ACD Out BCD Out

65
R3 – Fabric damage Intercept Model A-Thread tension Model B-Needle fineness Model C-Thread metric number Model D-Stitch density Model AB Model AC Model AD Model BC Model BD Model CD Model A2 Model B2 Model C2 Model D2 Model ANOVA (Analiza e variacionit) For the three responses we see that the chosen model is significant as well as the model terms and the lack of fit is not significant so the model is good. Highest values then 0.1000 show that the model terms are not significant. Non significant terms can be excluded at this phase of the experiment. The low lack of fit value shows for a very good model. Final equation in terms of actual factors for seam puckering: Seam puckering = +3.31232 +1.16667 * Thread tension -0.13333 * Needle fineness +0.038095 * Thread metric number +0.16667 * Stitch density Final Equation in Terms of Actual Factors for seam strength: R2 Seam strength = -20.29881 +89.45238 * A Thread tension -71.12857 * B Needle fineness +18.00476 * C Thread metric number +63.60714 * D Stitch density -1.00000 * A Thread tension * B Needle fineness -0.64286 * A Thread tension * C Thread number +1.25000 * A Thread tension * D Stitch density +0.11429 * B Needle fineness * C Thread metric number -2.00000 * B Needle fineness * D Stitch density -0.42857 * C Thread metric number * D Stitch density -8.33333 * A Thread tension 2 +2.76667 * B Needle fineness 2 -0.10476 * C Thread metric number 2 -0.98958 * D Stitch density 2

66
Final Equation in Terms of Actual Factors for fabric damage: R3 Fabric damage = +29.08847 -3.16690 * A Thread tension -2.44055 * B Needle fineness -0.28777 * C Thread metric number +0.86298 * D Stitch density +0.11000 * A Thread tension * B Needle fineness +4.28571E-003 * A Thread tension * C Thread metric number -0.062500 * A Thread tension * D Stitch density +5.14286E-003 * B Needle fineness * C Thread metric number -0.045000 * B Needle fineness * D Stitch density -3.57143E-003 * C Thread metric number * D Stitch density +0.45917 * A Thread tension 2 +0.081467 * B Needle fineness 2 +1.49932E-003 * C Thread metric number 2 +0.039792 * D Stitch density 2
At this phase we see the need for transformation through normal distribution of errors, residuals vs. Predicted, Externally Studentized Residuals) (Outlier t), Box Cox Plot for Power Transforms The normal probability plot shows whether the residuals (errors) folow a normal distribution, means that the points lie on a straight line. There might be some deviations excluding the cases of S-form, showing that a transformation of the response offers a better analysis. We consider our probability distribution as normal. Box-Cox Plot
Fig. 6. Box- Cox Plot for Power Transformationn – Seam puckering This Box – Cox plot shows that the selected model for analysing the seam puckering response does not need any transformation. The model graphs for the analysis of the factors influence to the responses.
Perturbation plot (interaction) of the factors effect to the seam puckering.
Design-Expert® SoftwareRrudhosja
LambdaCurrent = 1Best = 0.96Low C.I. = -1.46High C.I. = 3.24Recommend transform: None (Lambda = 1)
Lambda
Ln(ResidualSS)
Box-Cox Plot for Power Transforms
2.65
2.75
2.85
2.95
3.05
-3 -2 -1 0 1 2 3

67
Fig. 7. Perturbation Plot – Seam Puckerig
Perturbation plot (interaction) of the factors influence to the sewing strength. In the figure below it is clear the importance of the factors in the response seam strength. All factors have a considerable influence although it is clearly observed that the main role is of the metric thread number (C) and needle fineness (B) and then thread tension (A) and finally stitch density (D).
Fig. 8. Factors influence in the seam strength
Perturbation plot (interaction) of the factors influence to the fabric damage.
Fig. 9. Factors influence in fabric damage
Design-Expert® Software Seam strengthActual factorsA:Thread tension= 2.00 B: needle fineness= 13.50 C: thread Nm= 82.50D: stitch density= 4.00
Perturbation
Deviation from Reference Point (Coded Units)
Seam
Str
engt
h
-1.000 -0.500 0.000 0.500 1.000
350
382.5
415
447.5
480
A A
B B
C
C
D D
Design-Expert® Software
Seam puckering i Actual factors A: Thread tension= 2.00 B: Needle fineness= 13.50 C: Thread Nm = 82.50 D: Stitch density= 4.00
Perturbation
Deviation from Reference Point (Coded Units)
Seam
puc
keri
ng
-1.000 -0.500 0.000 0.500 1.000
6
7
8
9
10
A
A
B
B
C
C
D D
Design-Expert® Software Fabric damageActual Factors A: Thread tension= 2.00 B: Needle fineness= 13.50 C: Nm= 82.50
D: Stitch density= 4.00Perturbation Deviation from Reference Point (Coded Units)Fabric damage-1.000-0.5000.0000.5001.0001.8 2.653.54.355.2AA
B
B
C
C
D
D

68
One Factor plots for the responses
Fig. 10. One factor plot – seam puckering against thread tension
Figure11: One factor plot: Thread Number – Seam Strength
Fig. 12. One factor plot – Seam strength against thread tension
Design-Expert® Software
Seam puckering Design Points
X1 = A: Thread tension
Actual factorsB: needle fineness= 13.50Cthread Nm82.50D: Dendesia e hallkes = 4.00
1.00 1.50 2.00 2.50 3.00
6
7
8
9
10
A: Thread Tension
Seam puckering
One factor
3
Design-Expert® Software
Seam strengthDesign Points
X1 = A: thread tension
Actual FactorsB: Needle fineness= 13.50C: Nm= 82.50D: stitch density= 4.00
1.00 1.50 2.00 2.50 3.00
350
382.5
415
447.5
480
A: thread tension
Seam strength
One factorWarning! Factor involved in an interaction.
22
Design-Expert® Software
Seam strengthDesign Points
X1 = C: Thread Nm Actual FactorsA: Thread tension = 2.00 B: Needle = 13.50 D: Stitch density = 4.00
65.00 73.75 82.50 91.25 100.00
350
382.5
415
447.5
480
C:Thread Number
Seam Strength
One Factor
22

69
Interaction plots - factors to the seam strength Above we sa the main influence of each indicators: thread tension (A), needle fineness (B), thread fineness (C) and stitch density (D) in each of our repsonses. It is known that the main effects aremeaningless if the factors are involved i strong interaction with other factors. In many cases the interaction plots are the kew solutions to many problems and questions.
Fig. 13. One factor plot – Fabric damage against thread tension
Fig. 14. Interaction plot - thread metric number and stitch density to the seam strength
The red line responds to the interaction plot for high values of the stitch density – 6 stitches/cm. The black line responds to the CD interaction in low values of the stitch density. It is clear that the higher the thread metric number the stronger s the influence of the stitch density in the seam strength. On the other side the effect of the thread metric number is significant for both levels of the stitch density. The best value of the seam strength can be reached for the thread metric number 82.5 and the stitch density =6.
Design-Expert® Software
Seam strengthDesign Points
D- 2.000D+ 6.000
X1 = C: thread Nm X2 = D: stitch density
Actual Factors A: thread tension= 2.00 B: needle fineness= 13.50
D: Stitch
65.00 73.75 82.50 91.25 100.00
Interaction
C: Tread metric number
Seam
stre
ngth
330
367.5
405
442.5
480
2 3
Design-Expert® Software
Fabric damageDesign Points
X1 = A: thread tension Actual Factors B: needle fineness= 13.50C: Nm = 82.50D: Stitch density= 4.00
1.00 1.50 2.00 2.50 3.00
1.8
2.65
3.5
4.35
5.2
A: Thread tension
Fabric damage
One factorWarning! Factor involved in an interaction.
2
2

70
Fig. 15 Interaction plot – Seam puckering against needle fineness and thread tension
In the Fig 15 it is presented the interaction among the two factors (A and B) and the seam puckering (R1). Although the factors are not driectly and strongly involved in an interaction the graphs serve to decide on the best combinations for a good appearance of the sewing seam. In the interaction plot AB – R1 the optimal combination would be very high metric number of the sewing thread and low sewing tension (black line). Contour plots for the seam strength The influence of every two factors in the seam strength while the other two factors are constant has been shown in the figure below.
Fig. 16. Influence of needle fineness and thread tension to the seam strength
With the conotur plots we can find the desirable values through the coloured bar. The working area in our case (for the seam strength) is in the upper part of the plot, yellow – orange zone. Obviously we can receive as many conour plots as we can through different combinations of the actual factors. From the contour plot of Figure 18 we see that the puckering has higher values for higher needle numbers and higher thread number. For the two actual factors: Thread tension=2 and stitch density =4 the lowest values of seam puckering can be reached at Nm=65 – 75 and needle fineness = 14-16.
Design-Expert® Software
Rrudhosja nga tegeli Design Points
A- 1.000A+ 3.000
X1 = B: needle finenessX2 = A: tensioni Actual Factors C: thread Nm= 82.50D: stitch density = 4.00
A: tension
11.00 12.25 13.50 14.75 16.00
Interaction
B: needle fineness
Seam puckering
5.6
6.7
7.8
8.9
10
3 3 3
Design-Expert® Software
Seam strengthDesign Points480 35
X1 = A: thread tensionX2 = B: needle fineness
Actual FactorsC: Nm= 82.50D: Stitch density= 4.00
1.0 1.5 2.0 2.50 3.00
11.00
12.25
13.50
14.75
16.00Seam strength
A: Thread tension
B: N
eedl
e fin
enes
s
427.685434.482 434.482
441.278
441.278
448.074
454.87
5
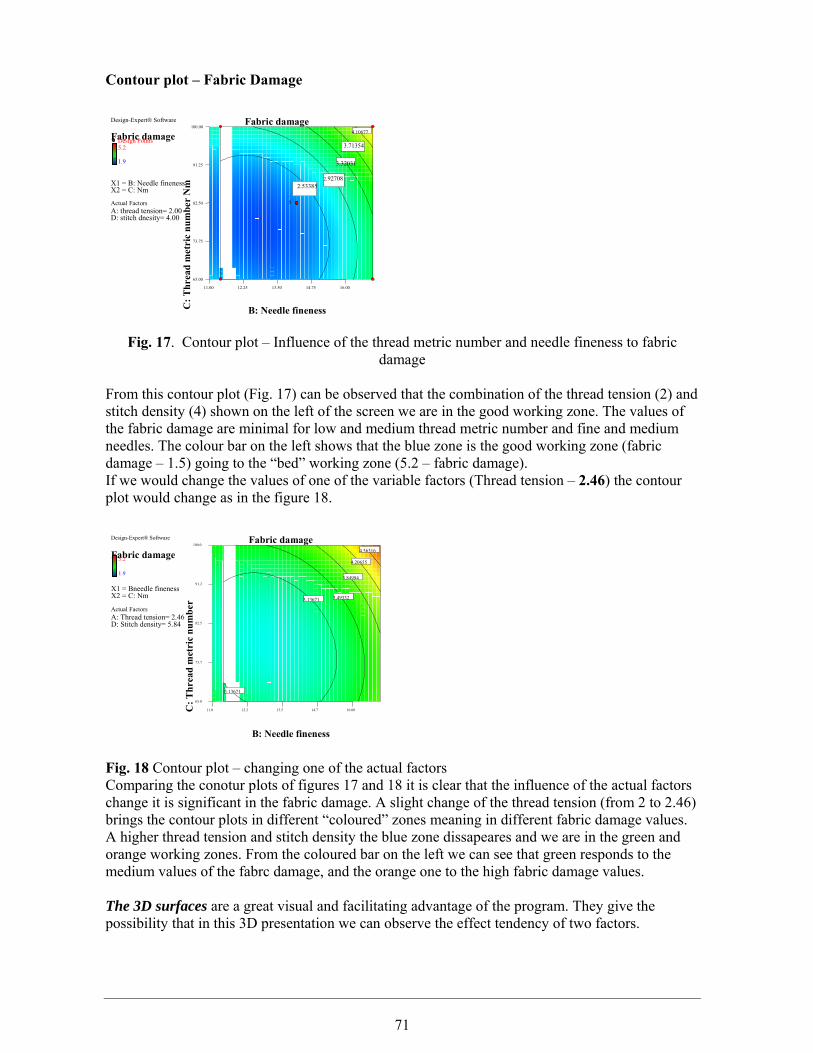
71
Contour plot – Fabric Damage
Fig. 17. Contour plot – Influence of the thread metric number and needle fineness to fabric
damage
From this contour plot (Fig. 17) can be observed that the combination of the thread tension (2) and stitch density (4) shown on the left of the screen we are in the good working zone. The values of the fabric damage are minimal for low and medium thread metric number and fine and medium needles. The colour bar on the left shows that the blue zone is the good working zone (fabric damage – 1.5) going to the “bed” working zone (5.2 – fabric damage). If we would change the values of one of the variable factors (Thread tension – 2.46) the contour plot would change as in the figure 18.
Fig. 18 Contour plot – changing one of the actual factors Comparing the conotur plots of figures 17 and 18 it is clear that the influence of the actual factors change it is significant in the fabric damage. A slight change of the thread tension (from 2 to 2.46) brings the contour plots in different “coloured” zones meaning in different fabric damage values. A higher thread tension and stitch density the blue zone dissapeares and we are in the green and orange working zones. From the coloured bar on the left we can see that green responds to the medium values of the fabrc damage, and the orange one to the high fabric damage values. The 3D surfaces are a great visual and facilitating advantage of the program. They give the possibility that in this 3D presentation we can observe the effect tendency of two factors.
Design-Expert® Software
Fabric damage 5.2
1.9
X1 = Bneedle finenessX2 = C: Nm
Actual Factors A: Thread tension= 2.46 D: Stitch density= 5.84
11.0 12.2 13.5 14.7 16.00
65.0
73.7
82.5
91.2
100.0Fabric damage
B: Needle fineness
C: T
hrea
d m
etri
c nu
mbe
r
3.13671
3.13671 3.49332
3.84994
4.20655
4.56316
Design-Expert® Software
Fabric damage Design Points5.2 1.9
X1 = B: Needle finenessX2 = C: Nm
Actual FactorsA: thread tension= 2.00 D: stitch dnesity= 4.00
11.00 12.25 13.50 14.75 16.00
65.00
73.75
82.50
91.25
100.00 Fabric damage
B: Needle finenessC: T
hrea
d m
etri
c nu
mbe
r N
m 2.533852.92708
3.32031
3.71354
4.10677
5

72
Fig. 19. 3D surface – Seam strength against needle fineness and thread tension
Fig. 20. 3D Surface – Seam puckering against needle fineness and thread metric number Cube for responses evaluation
For the analysis of the responses with the cube plots only one factor has been kept constant while the other three will be set determined on the X1, x2 and X3 axes. The cube plots are useful to show the effect of the three factors simultaneosly. These show the predicted values from the chosen model in terms of coded variables with the level combinations -1 and +1 of each of the input factors chosen at the beginning of the experiment. The not chosen factors, numerical or categorical, can be determined in a certain level through the menu.
Fig. 21. Cube – Seam puckering against needle fineness, thread tension and thread metric number
Design-Expert® Software
Seam puckeringX1 = A: thread tensionX2 = B: needle finenessX3 = C: thread NM
Actual factor D: stitch density= 4.00
CubeSeam puckering
A: Thread tension
B: N
eedl
e fin
enes
s
C: Thread metric number
A-: 1 A+: 3B-: 11.00
B+: 16.00
C-: 65.00
C+: 100.00
6.04
7.54
5.37
6.87
8.37
9.87
7.70
9.20
Design-Expert® Software
Seam puckering10 6
X1 = B: needle finenessX2 = C: thread metric number
Actual FactorsA: thread tension= 2.00D: stitch density = 4.00
11.00
12.25
13.50
14.75
16.00 65.00 73.75
82.50 91.25
100.00
6
6.75
7.5
8.25
9
Seam puckering
B: needle fineness C: thread metric number
Design-Expert® Software Seam strength
480 350
X1 = A: thread tensionX2 = B: Needle fineness
Actual Factors C: Thread number= 82.50 Dstitch density = 4.00
1.00
1.50
2.00
2.50
3.00
11.0
12.25
13.50
14.75
16.00
400
415.75
431.5
447.2
463
Seam
Str
engt
h
A: Thread tension B: Needle fineness

73
Step seven. Optimisation graphs The optimization module in Design – Expert asks for various combinations of basic variables that meet at the same time the preset requirements for each of the responses and input factors (variables). To enable the use of the optimization models the responses should be analysed first so that the proper model could be selected. The optimization of a response function or the simultaneous optimization of multiple response functions can be done graphically or numerically. By setting the prediction point all the models of the response functions can be analyzed for every dipendent variable. Numerical optimization – helps to set the desired goals for every response function generating the optimal conditions. Int his case the goalis minimize the R1. maximize R2 and minimize R3. Factors conditions:
• Thread Tension– within the range (1;3) • Needle fineness– within te range (11; 16)] • Thread metric number– within the range (65; 100)] • Stitch density– within the range (2; 6)].
Desired goals of the responses::
• Seam Puckering– [minimize] • Seam strength– [maximize] • Fabric damage– [minimize]
It is possible to set the more precise conditions like for example specific values for every input factor. The automatically generated solutions are listed below. The best solutions are the first in the list. The first selected and desired solution is: Thread tension 1.13 Needle number 15, Thread metric number 78, Stitch density 2, R1 seam puckering 6, R2 seam strength 453cN and R3 fabric damage 2.6. The desirability of this solution is 0.9 The other solutions selected by the porgram are with similar or aproximate values of the parameters and still the desirability goes to 0.85. In total there are 29 optimal combinations that can be presented graphically. Depending on the product destination or the reason of use we can decide on the specific combination. One factor plot for the numerical optimization The figure 22 shows the optimal solution for the fabric damage, while the set goal for this repsonse is minimize. The values of the thre other factors will be: needle fineness 15, thread metric number 78.9 and te stitch density 2. the thread tension should be kept in minimal values and the prediction for this point is the fabric damage 2.64.

74
Fig. 22. Optimal solution for the minimal fabric damage with one factor plot.
From the data showed on the screen we can read below we clearly observe that the first optimal solution for a minimal fabric damage has the highest desirability values (0.904). Contour plot for the numerical optimization In the figure 23 it is shown the contour plot for the optimal solutions for the preset goals: seam puckering-6, seam strength 460 and fabric damage minimal value. The program gives 42 good solutions with a high desirability coefficient. This is the case when we can preset values range for the responses we are aiming to reach. The first selected solution shown on the screen is” A – 1.13 (Thread tension) B – 15 (Needle fineness) C – 78 (Thread metric number) D – 2 (Stitch density) R1 – 5.999 (Seam puckering) R2 – 453.799 (Seam strength) R3 – 2.61 (Fabric damage) Desirability – 0.904
Fig. 23. Contour plot for the numerical optimization of the seam strength
Design-Expert® Software
Fabric damage
X1 = A: thread tensionActual Factors B: needle fineness= 15.01C: thread Nm= 78.91D: stitch density= 2.00
1.00 1.50 2.00 2.50 3.00
1.8
2.65
3.5
4.35
5.2
A: thread tension
Fabric damage
One FactorWarning! Factor involved in an interaction.
Prediction 2.61676Prediction 2.62439
Design-Expert® Software
Seam strength5.2
1.9
X1 = A: thread tensionX2 = B: needle fineness
Actual FactorsC: thread Nm= 78.87D: stitch density= 2.00
1.00 1.50 2.00 2.50 3.00
11.0
12.2
13.5
14.7
16.0Seam strength
A: thread tension
B needle fineness
429.568
438.309
438.309
447.05
455.791
464.531
Prediction 453.753

75
The whole red zone is the good working area for the seam strength. The prediction of the seam strength for the optimal solution is 453.753. In the same way we can obtain the contour plots for every response function.
Graphical optimization First the criteria for the desired area has been set (exact seam strength, seam puckering and fabric damage) and the optimization graphs are obtained. In the overlay plot below we can read the optimal values in the desired working area. We can set the criteria for all the indicators of the seam quality (responses) or some of them. The yellow area is the good one, where we can read the values of the input factors and responses in every point.
Figure 24. Overlay optimization plot for the three responses
Point Prediction
The final step in any experiment is to predict the response at the optimal settings. We foresee the seam puckering and seam strength for Thread tension = 2, needle fineness=13.5, Thread metric number = 82.5 and stitch density =4 . Thus, R1 is predicted 7.6 and R2=434. Conclusions
1. Seam quality is a general and very wide characteristic including variables such as seam appearance, seam strength, fabric damage from the needle penetration, seam slippage etc.
2. Estimating the seam quality is a very complex task including many interacting factors with each-other and also with strong effect on the quality indicators.
3. This article is an example of the use of Response Surface Methodology in the optimization of the sewing parameters.
4. Depending on the sewn products destination we can decide on the responses we estimate and the factors we optimize.
The correct selection of the indicators - variables and their effect in the final product or process is one of the main problematic concerns and tasks in the textile and clothing industry. [1]. One of the main requests in the clothing industry is a good garment quality and especially a good appearance of the sewing seams. Garments are the first in the list of the design demands to fit the objects and environment with the human body – the conception is focused on the user – from the point of view of wearing the garment and the one of the similarity of the form and dimensions of the product with the human body. [1] [4].
Design-Expert® Software
Overlay Plot Seam puckering Seam strength Fabric damage
X1 = A: thread tension X2 = B: needle fineness Actual Factors C: thread Nm= 78.87 D: stitch density= 2.00
1.00 1.50 2.00 2.50 3.00
11.00
12.25
13.50
14.75
16.00Overlay Plot
A: thread tension
B needle fineness
Rrudhosja nga tegeli: 7
Fortesia e tegelit: 440
Demtimi i pelhures: 1.9
Demtimi i pelhures: 3
puckerinf 5.99985strength 453.764damage 2.61547X1 1.13X2 15.01
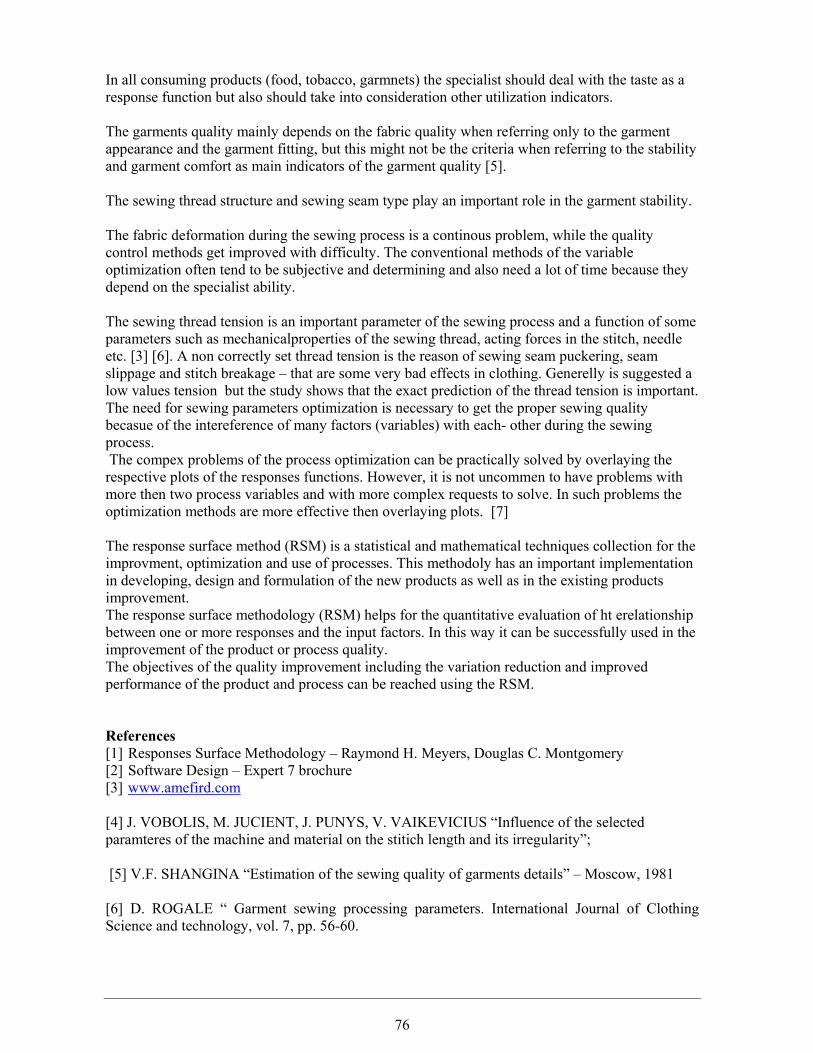
76
In all consuming products (food, tobacco, garmnets) the specialist should deal with the taste as a response function but also should take into consideration other utilization indicators. The garments quality mainly depends on the fabric quality when referring only to the garment appearance and the garment fitting, but this might not be the criteria when referring to the stability and garment comfort as main indicators of the garment quality [5]. The sewing thread structure and sewing seam type play an important role in the garment stability. The fabric deformation during the sewing process is a continous problem, while the quality control methods get improved with difficulty. The conventional methods of the variable optimization often tend to be subjective and determining and also need a lot of time because they depend on the specialist ability. The sewing thread tension is an important parameter of the sewing process and a function of some parameters such as mechanicalproperties of the sewing thread, acting forces in the stitch, needle etc. [3] [6]. A non correctly set thread tension is the reason of sewing seam puckering, seam slippage and stitch breakage – that are some very bad effects in clothing. Generelly is suggested a low values tension but the study shows that the exact prediction of the thread tension is important. The need for sewing parameters optimization is necessary to get the proper sewing quality becasue of the intereference of many factors (variables) with each- other during the sewing process. The compex problems of the process optimization can be practically solved by overlaying the respective plots of the responses functions. However, it is not uncommen to have problems with more then two process variables and with more complex requests to solve. In such problems the optimization methods are more effective then overlaying plots. [7] The response surface method (RSM) is a statistical and mathematical techniques collection for the improvment, optimization and use of processes. This methodoly has an important implementation in developing, design and formulation of the new products as well as in the existing products improvement. The response surface methodology (RSM) helps for the quantitative evaluation of ht erelationship between one or more responses and the input factors. In this way it can be successfully used in the improvement of the product or process quality. The objectives of the quality improvement including the variation reduction and improved performance of the product and process can be reached using the RSM. References [1] Responses Surface Methodology – Raymond H. Meyers, Douglas C. Montgomery [2] Software Design – Expert 7 brochure [3] www.amefird.com [4] J. VOBOLIS, M. JUCIENT, J. PUNYS, V. VAIKEVICIUS “Influence of the selected paramteres of the machine and material on the stitich length and its irregularity”; [5] V.F. SHANGINA “Estimation of the sewing quality of garments details” – Moscow, 1981 [6] D. ROGALE “ Garment sewing processing parameters. International Journal of Clothing Science and technology, vol. 7, pp. 56-60.

77
[7] EZEKIEL, M., Methods of Correlation Analysis, John Wiley & Sons, NY, 1953 Ezekiel, M., Methods of Correlation Analysis, John Wiley & Sons, NY, 1953

____________________________________________________________________________
______________________________________________________________________
78
VII. THE POTENTIAL OF SMART TEXTILES
Lieva Van Langenhove, Belgium Abstract Smart textiles are a new generation of textiles. They contain sensors, actuators, data processing components, and energy and communication systems. All active components have to be embedded in the textile. This requires textile compatible materials in terms of comfort and resistance normal conditions of use. Smart textiles can be used for a wide range of applications. The paper will give an overview on latest developments, EU projects and EU initiatives in general in the area of smart textiles. One particular project will be highlighted, namely the proetex project on smart textiles for rescue workers. This clothes have:
• Comfort • Design • Maintenance
And thay are true textile materials! We say Smart textiles because they are… Versatile Comfortable Familiar product Large contact area Easy to use Well defined conditions of use Smart stand alone suit: functions that thay have are;Sensoring Data processing Actuation Communication Energy Fully integrated and manufacturable This textile measures body and environment for example: Temperature Biopotentials: cardiogram, myographs, encephalographs Motion: respiration, motion Acoustic: heart, lungs, digestion, joints Ultrasound: blood flow Biological, chemical Pressure: blood Radiation: IR, spectroscopy Odour, sweat Mechanical skin parameters Electric (skin) parameters

____________________________________________________________________________
______________________________________________________________________
79
Textile sensors
Textrodes
First is heart and the second is respiration. Sensor concept

____________________________________________________________________________
______________________________________________________________________
80
OFET - sensor
Textile networks
Interconnections
1D
3D
(L. Moriarty)
2D

____________________________________________________________________________
______________________________________________________________________
81
Actuators are classificated in; Mechanical:
• Shape memory materials: reversibility • Muscle like structures: charge density, speed
Chemical: micro-encapsulation Optical: Light emission Thermal: heating/cooling Electro stimulation Shape memory alloys
Ni-Ti alloy: goes to predefined shape
above transition t° Micro capsules
Heating/cooling

____________________________________________________________________________
______________________________________________________________________
82
Energy harvesting Piezo electric materials: woven structure Photovoltaic fibres
Thermogenerator: Seebeck/Peltier
Cool area
Warm area
n-doped semiconductorp- doped semiconductorconductor
Infineon Communication between components
-
+
Wearable motherboard

____________________________________________________________________________
______________________________________________________________________
83
Textile antenna
Normal use can cause trouble for example:
Appearance Sensor function Artefacts Feel But can also be a blessing
Conductive yarns
Textile keyboard
Communication Woven display

____________________________________________________________________________
______________________________________________________________________
84
Intelligent textiles have this advantages: Advantages of production and use Versatility Complexity Cheap Part of our life VIII. HIGH TECHNOLOGY IN SEWING AND JOINING
Gjergji GJIKE, Albania Abstract For the first time the Seamsonic ultrasonic welding machine uniquely combines all the physical advantages of ultrasonic welding with the whole range of technological sewing experience. Versions: PFAFF 8310-041 Feed-off-the-arm
PFAFF 8310-042 Bottom sonotrode, flat-bed version with 65 mm diameter anvil wheel (standard)

____________________________________________________________________________
______________________________________________________________________
85
PFAFF 8310-043 Flat-bed version with 30 mm diameter anvil wheel, specially for narrow curves.
Applications for the PFAFF 8310 Filter bags, health care articles, medical mattresses and pillows, needle felts, operations sheets and clothing, foils, bullet proof vests, blinds and awnings, pleated filter, shower curtains and many more Garment section: Outdoor garment, Tyvek protective clothing, bras, lingerie, operations garment, Softshell and many more Automotive section: Protective car covers and many more. Technical data:
• Digital PLC-control • Operated through touch screen • Functions: manual or automatic operation with speed regulation via foot pedal,
amplitude from 50 – 100 %. New: Cut & Seal The hottest trend in joining textiles The PFAFF 8310 Cut & Seal combines the physical procedures of cutting and welding by ultrasonic. Based on the successfully established 8310-003 machine, a new generation of ultrasonic machines has been developed.

____________________________________________________________________________
______________________________________________________________________
86
Main advantages are: • Two manufacturing processes in one flow (Cut & Seal) • Minimum seam width (micro seam) at high firmness • High wearing comfort of welded materials • Flat seams after taping with PFAFF 8303 or PFAFF 8330
Applications: Ultrasonic welding with the Seamsonic is a modern and economic production method and complementary to the conventional sewing technology.
Technical Data: Welding speed: 0.5 - 20.0 m/min.

____________________________________________________________________________
______________________________________________________________________
87
Seam widths: 2 – 10 mm Throat: 400 mm Anvil wheel: dia. 65 mm, width and seam profile as per customer requirement Material thickness:> 50 μ Gap adjustment: 0 – 2 mm, fine adjustment 1/50 mm by graduated hand wheel Welding pressure: 0 – 800 N (5 bar) Power supply: 230 V, 50/60 cycles, 16 Amp. Consumption: 4 Amp., 800 VA Compressed air: 6 bar, 10 litres/min. Weight: gross 230 kg, net 182 kg Measures: 121 x 67 x 135 cm packed depending on the version The beginning of a new welding machine generation! PFAFF 8320 With the new PFAFF 8320 sealing sequences can be programmed, i.e. depending on the cutting and the fabric any parameters can be entered for a given segment and reproduced with 100% accuracy. An absolute innovation from PFAFF! A new dimension in process control
• Differential transport possible during sealing • Heat-up and cool-down cycles possible • Additional inputs and outputs available: • The 8320 can be easily integrated in a unit. • Different operating levels protected by passwords: • Selectable languages and units of measurement

____________________________________________________________________________
______________________________________________________________________
88
Reas of application PFAFF 8320 • Car covers • Flexible tanks • Swimming pool liners • Banners • Small tents • Inflatable materials • Convertible tops for cars • Filter
Programmable taping with the PFAFF 8330 The new hot-air welding machine, PFAFF 8330, was developed for welding continuous seams on water-resistant, waterproof and breathable materials. It can also be used for cross seams with 3 material plies. Innovations and technical refi nements are features of the PFAFF 8330, which make it unique: Maximum Quality Exact reproducibility with programmed taping Both individual segments and complete cycles can be programmed. Created programs and parameters can be transferred to other machines in the production process. Differential feed Two separate drive motors for the top and bottom feed roller guarantee an optimum adaptation to the operation (e.g. smooth seams or fullness for formed parts). Maximum productivity and effi ciency Dynamic Welding Automatic adjustment of the heating power to the variable speed. Two temperature sensors (optional) enable the control of the heating temperature. Automatic monitoring and adjustment of all pre-set or programmed parameters. Tape cutter with separate drive Trimming of the seam tape becomes unnecessary (welding from the beginning of the tape), resulting in a considerable reduction of the tape used. The tape cutter is electronically controlled, with precision adjustment for optimum setting. Optional: sensor-controlled, automatic tape cutting at the end of the material. Advantages: Advantages:
Method: Hot-air seam taping

____________________________________________________________________________
______________________________________________________________________
89
Method: Features:
• Traditional tape welding combined with the possibility of programmed welding • Touch screen for easy operation with pictograms • Various operator levels possible, with password protection, e.g. fixed parameters cannot be
altered by the operator • Monitoring of the heating temperature with two sensors (optional) • Individual segments as well as complete sequences can be programmed • Automatic monitoring and maintaining of all pre-set or programmed parameters • Variable post system (post width and position – depending on use) • During the production sequence programs and parameters can be transferred to other
machines • Software update by e-mail possible • HAreas of application:
For all tape welding operations which require a high level of process reliability and a reproducible quality.
• Outdoor and protective garments • Shoes • Automotive section like car seats, arm rests and similar to prevent the foam coming
through needle holes after sewing The 8330 can be used in all sectors where seams have to be welded with a tape. Techniweight: IX. A LINEAR REGRESSION MODEL FOR THE WOOLEN FIBERS
Dr. Luela Prifti, Prof.As. Akli FUNDOAlbania
Abstract This paper presents the regression analysis for modeling and investigating the relationship
between the resistance and extension of the woolen fibers. The aim of this work is to build a linear regression model for the Albanian data and to show how good this model is to predict the extension at a given resistance value. The graphics representing the regression model and the prediction bands are discussed. Introduction
The use of probability models and statistical methods for analysing data has become common practice in virtually all scientific disciplines. In this paper, we consider the resistance and extension of the Albanian woolen fibers. For this data base we build a linear regression model and show how good this model is to predict the extension at a given resistance value. This paper is organized as follows. In section 2, we recall the estimation of the parameters in a linear regression model and their properties. In section 3, we describe the data base in study, build the linear regression model and discuss the prediction bands of the extension for the given values of resistance.
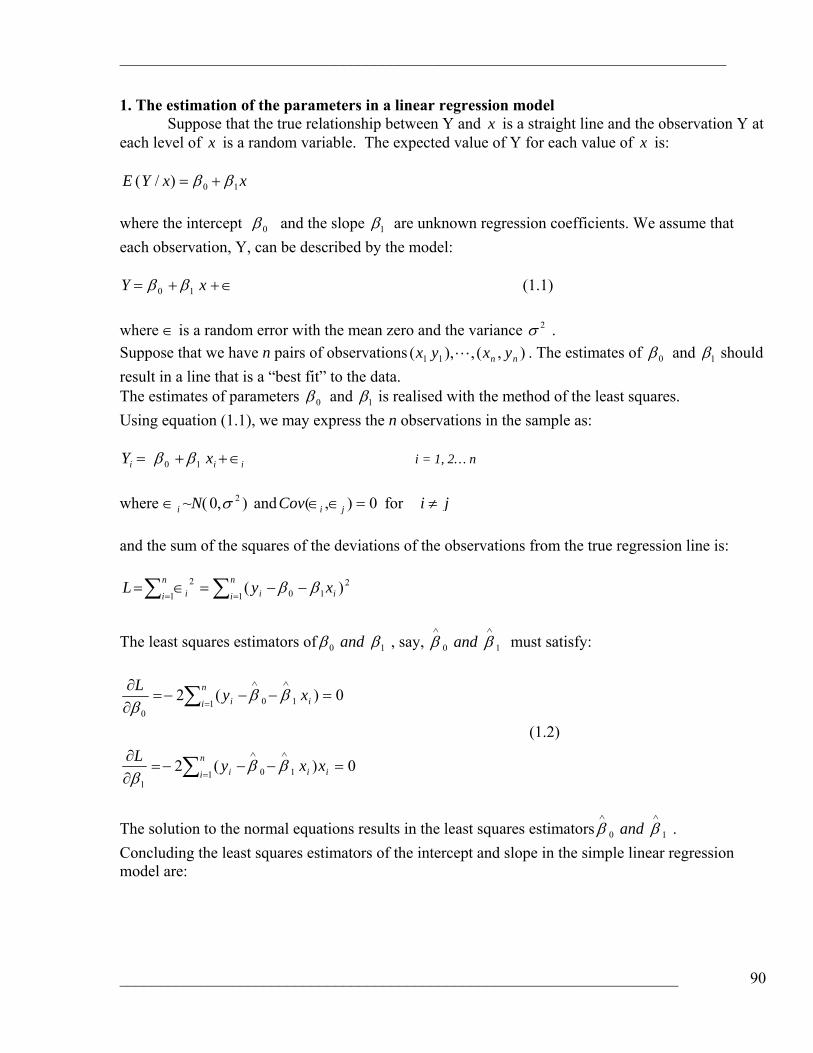
____________________________________________________________________________
______________________________________________________________________
90
1. The estimation of the parameters in a linear regression model Suppose that the true relationship between Y and x is a straight line and the observation Y at
each level of x is a random variable. The expected value of Y for each value of x is:
xxYE 10)/( ββ += where the intercept 0β and the slope 1β are unknown regression coefficients. We assume that each observation, Y, can be described by the model: =Y ∈++ x10 ββ (1.1)
where ∈ is a random error with the mean zero and the variance 2σ . Suppose that we have n pairs of observations ),(,),( 11 nn yxyx L . The estimates of 0β and 1β should result in a line that is a “best fit” to the data. The estimates of parameters 0β and 1β is realised with the method of the least squares. Using equation (1.1), we may express the n observations in the sample as: =iY iix ∈++ 10 ββ i = 1, 2… n
where i∈ ~N( ),0 2σ and 0),( =∈∈ jiCov for ji ≠ and the sum of the squares of the deviations of the observations from the true regression line is:
21011
2 )( in
i in
i i xyL ββ −−=∈= ∑∑ ==
The least squares estimators of 10 ββ and , say, 10
∧∧
ββ and must satisfy:
0)(2
0)(2
1011
1010
=−−−=∂∂
=−−−=∂∂
∧∧
=
∧∧
=
∑
∑
iin
i i
in
i i
xxyL
xyL
βββ
βββ
(1.2)
The solution to the normal equations results in the least squares estimators 10
∧∧
ββ and . Concluding the least squares estimators of the intercept and slope in the simple linear regression model are:

____________________________________________________________________________
______________________________________________________________________
91
)4.1()(
)3.1(
11
22
11 1
1
10
∑ ∑∑ ∑ ∑
==
== =
∧
∧∧
−
−=
−=
n
i
n
i ii
n
i
n
i
n
i iiii
nx
x
nxy
xy
xy
β
ββ
where ∑ ==
n
i iyn
y1
1 and ∑==
n
i ixn
x1
1
We can present 1
∧
β as:
xx
xY
SS
=∧
1β
where
2
11
221
)()(
nx
xxxSn
i in
i in
i ixx∑∑∑ =
==−=−= (1.5)
and n
yxyxxxyS
n
i
n
i iin
i iin
i iixy∑ ∑∑∑ = =
==−=−= 1 1
11
)()()( (1.6)
The fitted or estimated regression line is therefore:
xy 10
∧∧∧
+= ββ (1.7) Note that each pair of observations ),(,),( 11 nn yxyx L satisfies the relationship:
iii xy εββ ++=∧∧∧
10 i=1…n (1.8) where iε is the residual.
The estimators 10 ,∧∧
ββ taken from (1.3) and (1.4) are the unbiased estimators of the true slope 1β and
the true intercept 0β .

____________________________________________________________________________
______________________________________________________________________
92
The covariance of the random variables 0
∧
β and 1
∧
β is:
xxSxCov 210 ),( σββ −=∧∧
.
To draw inferences concerning the regression coefficients 0β and 1β , it is necessary to estimate the variance 2σ . The residuals are used in computing the estimate of 2σ . The sum of the squares of the residuals, or the error sum of squares is:
.)( 211
2∧
==−== ∑∑ i
n
i in
i iE yySS ε (1.9)
Therefore, ∧
2σ is an unbiased estimator of 2σ .
)10.1()2(
2
−=
∧
nSSEσ
In simple linear regression the estimated standard error of the slope and the estimated standard error of the intercept are:
xxSS
∧
=2
1
σβ
⎥⎥⎦
⎤
⎢⎢⎣
⎡+=
∧
xxSx
nS
22 1
0σβ (1.11)
2. Linear Regression Model for the Albanian data
Measurements of the resistance and the extension of the woolen fibers from, Korce, Albania were obtained from the work in the Physical-Mechanical and Chemical laboratory of Textile and Mode in Polytechnic University of Tirana, acredited above the international standart ISO/IEC 17025: 2005. Figure 1 presents the scatter diagram of the data. This is just a graph on which each of the 50 pairs is represented as a point ploted in two-dimensional coordinate system. Inspection of this scatter diagram indicates that, although no simple curve will pass exactly through all the points, there is an indication that the points lie scattered randomly around a straight line. The points lie close to each-other, some of them for the extension values in ] [25;15 and resistance
value in ] [2;5,0 are very closed to each-other.
20 30 40 50 60 70 80 90
1
2
3
4
5
6
7
8
9
10
Resistance
Exte
nsio
n

____________________________________________________________________________
______________________________________________________________________
93
3. Linear Regression Model for the given data Several tests have been carried out in order to have the best linear regression model for the data in study. We choose to model the relationship between the resistance and the extension with a quadratic model. It is plotted in Figure 2, along with the sample data. The statistics S, R –Sq, R –Sq (adj) are used to estimate the model.
Figure 2. Scatter plot of extension versus resistance and the regression model. The fitted linear regression model is:
2log24447,2log69622,846703,7log XXY −+−= (1.13) We can present (1.13) as:
VU 20728,446703,7 +−= (1.14) where U = logY and V =logX. Note that the estimated standard deviation about the regression line is S = 0,102624 and the coefficient of determination is 0
06,90=− qsR .
The large value for the coefficient of determination shows a good linearity between Y and ∧
Y , and the small value for the estimated standard deviation shows that the observed points will tend to fall very close to the true line.
9080706050403020
10
9
8
7
6
5
4
3
2
1
0
Resistance
Ext
ensi
on

____________________________________________________________________________
______________________________________________________________________
94
The residuals plots procedure generates four plots in one graph window. The normal plot shows an approximately linear pattern that is consistent with a normal distribution. Similarly, the histogram exhibits a pattern that is consistent with a sample from a normal distribution.
Figure 3. Residuals Plots However, the I Chart (a control chart of individual observations) reveals that one point labeled with a 1 -the forty-five value is outside the three sigma limits, and another point labeled with a 6 -the forty-six value is flagged because it is 4 out of 5 points more than one sigma from the center line. The plot of residuals versus fits shows that the fit tends to be better for higher predicted values. The quadratic model appears to provide a good fit to the data.
43210-1-2
10
5
0
Residual
Freq
uenc
y
Histogram of Residuals
50403020100
43210
-1-2-3-4
Observation Number
Res
idua
l
I Chart of Residuals1
6
Mean=0,1176
UCL=3,209
LCL=-2,974
9876543210
4
3
2
1
0
-1
-2
Fit
Res
idua
lResiduals vs. Fits
210-1-2
4
3
2
1
0
-1
-2
Normal Plot of Residuals
Normal Score
Res
idua
l
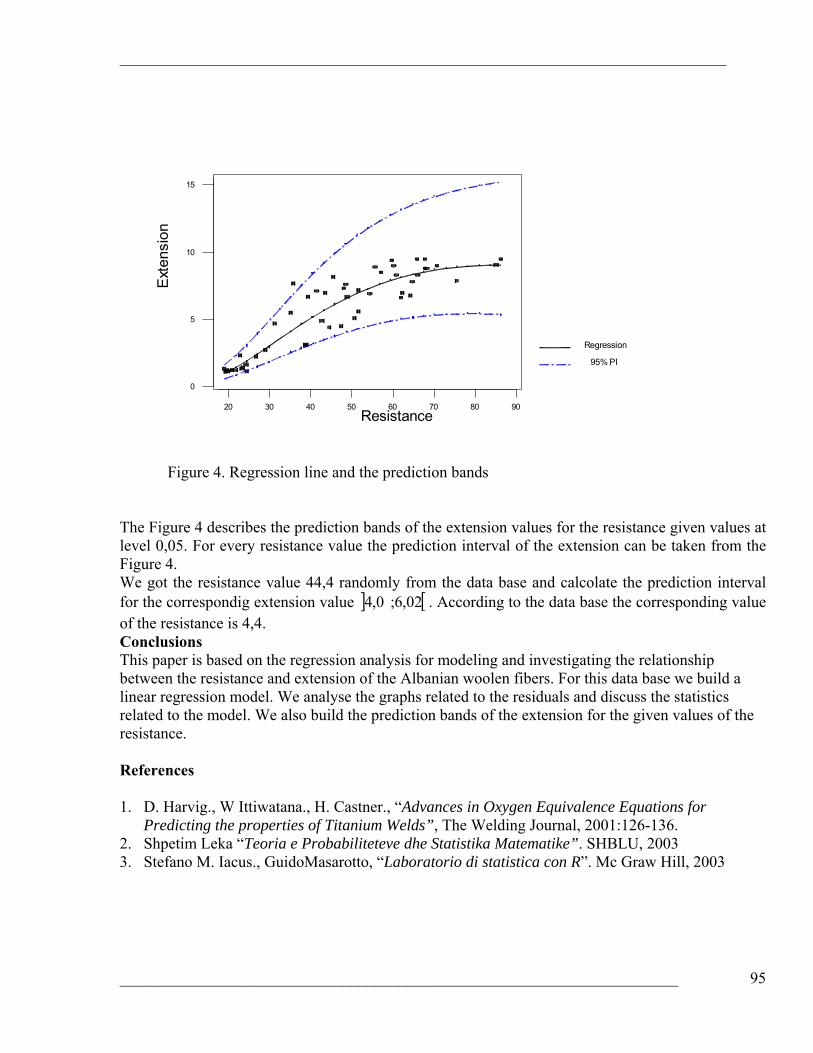
____________________________________________________________________________
______________________________________________________________________
95
Figure 4. Regression line and the prediction bands The Figure 4 describes the prediction bands of the extension values for the resistance given values at level 0,05. For every resistance value the prediction interval of the extension can be taken from the Figure 4. We got the resistance value 44,4 randomly from the data base and calcolate the prediction interval for the correspondig extension value ] [02,6;0,4 . According to the data base the corresponding value of the resistance is 4,4. Conclusions This paper is based on the regression analysis for modeling and investigating the relationship between the resistance and extension of the Albanian woolen fibers. For this data base we build a linear regression model. We analyse the graphs related to the residuals and discuss the statistics related to the model. We also build the prediction bands of the extension for the given values of the resistance. References 1. D. Harvig., W Ittiwatana., H. Castner., “Advances in Oxygen Equivalence Equations for
Predicting the properties of Titanium Welds”, The Welding Journal, 2001:126-136. 2. Shpetim Leka “Teoria e Probabiliteteve dhe Statistika Matematike”. SHBLU, 2003 3. Stefano M. Iacus., GuidoMasarotto, “Laboratorio di statistica con R”. Mc Graw Hill, 2003
20 30 40 50 60 70 80 90
0
5
10
15
Resistance
Exte
nsio
n
Regression
95% PI
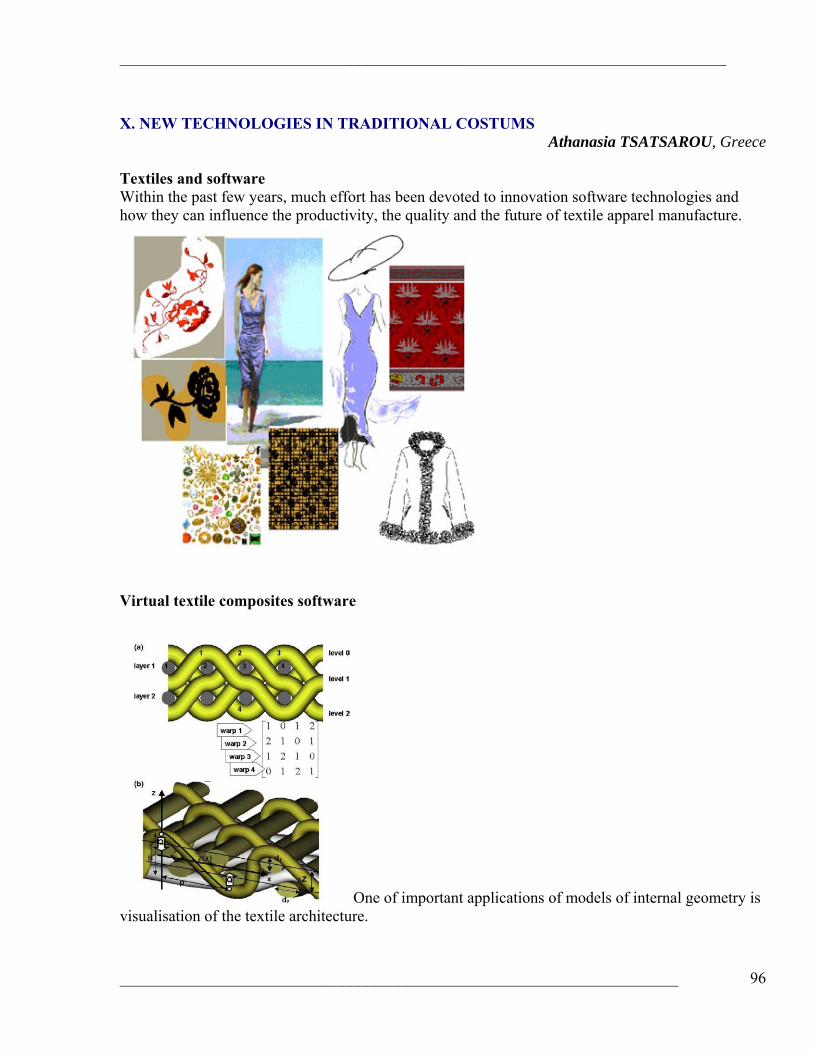
____________________________________________________________________________
______________________________________________________________________
96
X. NEW TECHNOLOGIES IN TRADITIONAL COSTUMS
Athanasia TSATSAROU, Greece Textiles and software Within the past few years, much effort has been devoted to innovation software technologies and how they can influence the productivity, the quality and the future of textile apparel manufacture.
Virtual textile composites software
One of important applications of models of internal geometry is visualisation of the textile architecture.

____________________________________________________________________________
______________________________________________________________________
97
Model of internal structure of woven fabric: (a) coding of the weave; (b) description of the yarn paths.
One of important applications of models of internal geometry is visualization of the textile architecture. The ultimate result of visualization of a model is the creation of a virtual reality (VR) world. Up to now, complicated textile VR is being created mostly on macro-level, displaying drape of a cloth and serving needs of garment designers and producers of animations, supported by the appeal for the wide public. Micro-level (internal structure) textile VR (below we will also use a shortened term ‘‘micro-VR’’) attracts lesser attention. However, such an application is of great interest for textile education and for the popularization of textile industry and science (e.g., interactive exhibits for industrial and science museums). It can be also used for research purposes in the same way as stereo-chemistry takes advantage of 3D-models of large molecules. Designing with laser
In the system that has been designed, the laser beam at a selected wavelength and intensity was directed onto a selected textile surface and a computer-controlled laser beam source was used to the color substances on the textile surface. The following steps have been taken as a basis for this operation: Preparing the designs on the computer and transferring them to the computer after scanning and making necessary adjustments Preparing the cloth markers Marking the designs on clothes using laser beams Creating a faded-used look on clothes by blasting quartz sand under high pressure Washing the clothes.

____________________________________________________________________________
______________________________________________________________________
98
By using the mannequin the analogies are followed and the colout transformations can be easily done without re-sketching the clothing.
Collection’s pallete
Collection
Details
Colour Variations

____________________________________________________________________________
______________________________________________________________________
99
BEO1KO8
Simplified fabric Option Α Option Β Option C

____________________________________________________________________________
______________________________________________________________________
100
Simplified fabric
Option Α
Option Β
Option C
Design and repeat
• Used in the garment Design. • It easily modifies the basic motif saving considerable time • It multiplies the motif meeting the desirable symmetry functions • The procedure is safe from errors
Dynamic measurement chart: Pattern and chart work interactively! This new software provides faster checking possibilities and wider internal or external communication capabilities.
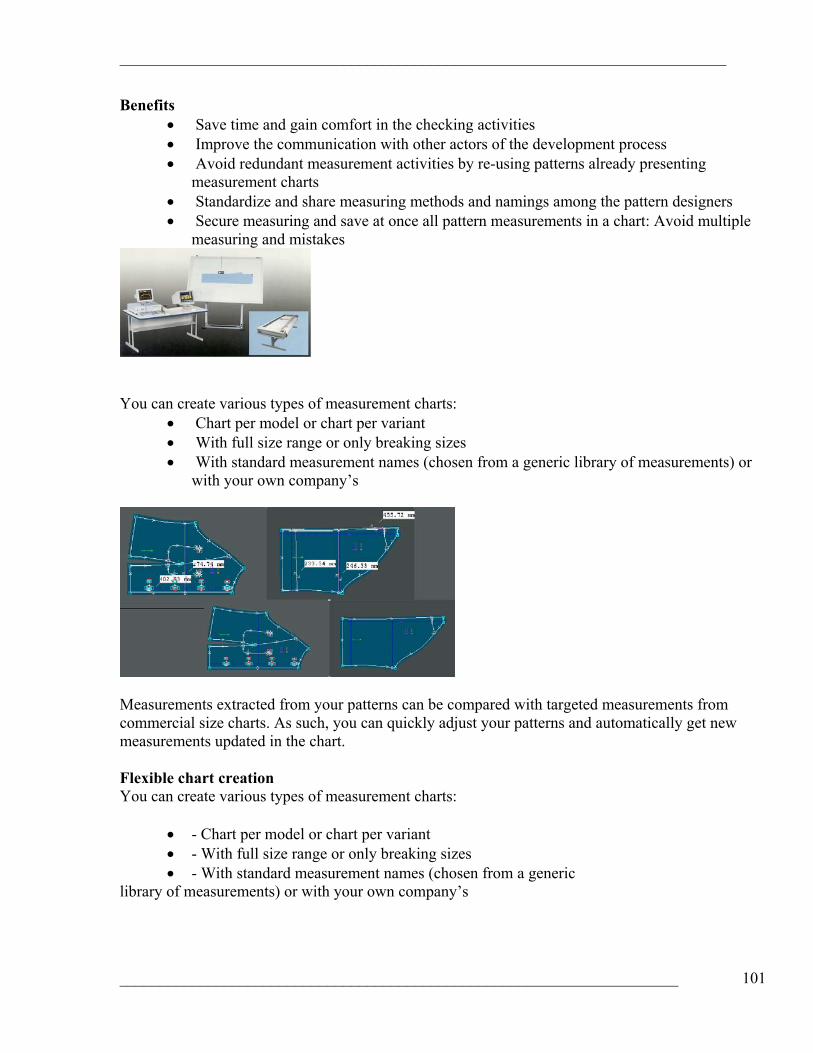
____________________________________________________________________________
______________________________________________________________________
101
Benefits • Save time and gain comfort in the checking activities • Improve the communication with other actors of the development process • Avoid redundant measurement activities by re-using patterns already presenting
measurement charts • Standardize and share measuring methods and namings among the pattern designers • Secure measuring and save at once all pattern measurements in a chart: Avoid multiple
measuring and mistakes
You can create various types of measurement charts:
• Chart per model or chart per variant • With full size range or only breaking sizes • With standard measurement names (chosen from a generic library of measurements) or
with your own company’s
Measurements extracted from your patterns can be compared with targeted measurements from commercial size charts. As such, you can quickly adjust your patterns and automatically get new measurements updated in the chart. Flexible chart creation You can create various types of measurement charts:
• - Chart per model or chart per variant • - With full size range or only breaking sizes • - With standard measurement names (chosen from a generic
library of measurements) or with your own company’s

____________________________________________________________________________
______________________________________________________________________
102
Everything can be tested before production
• Greater speed in modifications and greater creative capacity. • Reduction of time spent in implementing transformations. • Automatic creation of simple patterns. • Quick design of all related pieces: facings, linings, interlinings, etc • Reduction of time necessary for sending patterns into production. • Automatic measuring. • Simplification of grading process and Time reduction in grading process. • Greater precision in grading • Easy modifications in grading • Different types of grading possible • Reduction of errors in grading
Markings • Speed in the study of marking and the reduction of time. • Savings of raw material • Reduction of errors in marking • Automatic or semi-automatic marking • Easy marking of squares or stripes • Unlimited reproduction of markings with the same quality • Reduction of time in reproducing markings

____________________________________________________________________________
______________________________________________________________________
103
3-D Simulation
Garment deformation under different body poses.
Comparison between the virtual clothing we designed and real replicas sewn from the patterns we output. ERP-Software
• Quick location of pieces, models, markings, etc • Direct access to data different departments • Reduction or errors caused by a confusion of patterns or markings • Elimination of possible loss of patterns or markings • Reduction of space used for filing patterns
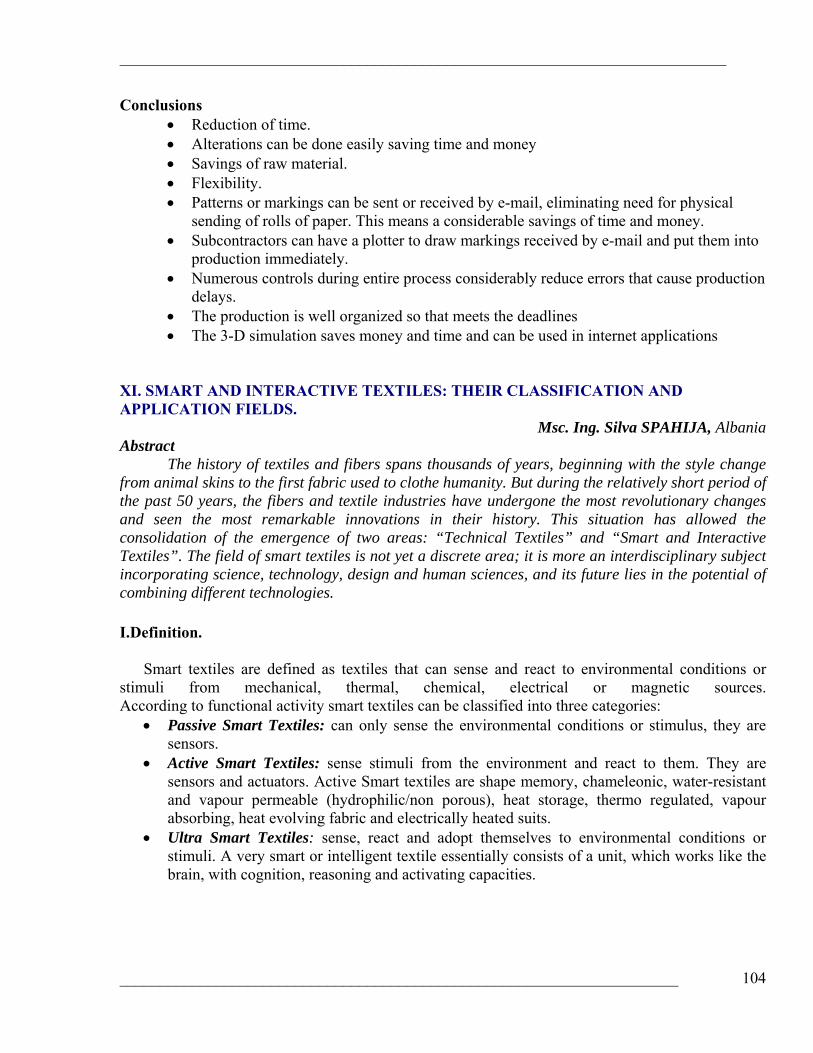
____________________________________________________________________________
______________________________________________________________________
104
Conclusions • Reduction of time. • Alterations can be done easily saving time and money • Savings of raw material. • Flexibility. • Patterns or markings can be sent or received by e-mail, eliminating need for physical
sending of rolls of paper. This means a considerable savings of time and money. • Subcontractors can have a plotter to draw markings received by e-mail and put them into
production immediately. • Numerous controls during entire process considerably reduce errors that cause production
delays. • The production is well organized so that meets the deadlines • The 3-D simulation saves money and time and can be used in internet applications
XI. SMART AND INTERACTIVE TEXTILES: THEIR CLASSIFICATION AND APPLICATION FIELDS.
Msc. Ing. Silva SPAHIJA, Albania Abstract
The history of textiles and fibers spans thousands of years, beginning with the style change from animal skins to the first fabric used to clothe humanity. But during the relatively short period of the past 50 years, the fibers and textile industries have undergone the most revolutionary changes and seen the most remarkable innovations in their history. This situation has allowed the consolidation of the emergence of two areas: “Technical Textiles” and “Smart and Interactive Textiles”. The field of smart textiles is not yet a discrete area; it is more an interdisciplinary subject incorporating science, technology, design and human sciences, and its future lies in the potential of combining different technologies. I.Definition.
Smart textiles are defined as textiles that can sense and react to environmental conditions or stimuli from mechanical, thermal, chemical, electrical or magnetic sources. According to functional activity smart textiles can be classified into three categories:
• Passive Smart Textiles: can only sense the environmental conditions or stimulus, they are sensors.
• Active Smart Textiles: sense stimuli from the environment and react to them. They are sensors and actuators. Active Smart textiles are shape memory, chameleonic, water-resistant and vapour permeable (hydrophilic/non porous), heat storage, thermo regulated, vapour absorbing, heat evolving fabric and electrically heated suits.
• Ultra Smart Textiles: sense, react and adopt themselves to environmental conditions or stimuli. A very smart or intelligent textile essentially consists of a unit, which works like the brain, with cognition, reasoning and activating capacities.

____________________________________________________________________________
______________________________________________________________________
105
II. New/Smart Materials and fibres used in Smart Textiles.
A summary of some of the smart materials used in textiles will be made, with some brief descriptions of their applications.
II.1. Phase changing Materials for thermoregulation.
These materials possess the capability to improve the thermal comfort for someone exposed to extreme temperatures when they are integrated into the garment. Phase change materials (PCM) change their state of matter at a certain temperature, from liquid to solid and vice versa. An example of these materials is that of a bed-fleece as part of interior textile sector.
II. 2. Shape Memory Materials.
Shape memory materials are materials that can revert from their current shape to a previously held shape, usually under the action of heat. Shape memory materials are applied in textiles in form of alloys, polymers or gels.

____________________________________________________________________________
______________________________________________________________________
106
II. 3. Conductive Materials. There are two strategies to create electrical or thermal conductive fabrics and two types of
materials, the metals and the polymers. The same materials could be used for the both conductivity (thermal and electric), because the two processes are similar and results of an electronic agitation/ conductor. Examples of conductive yarns and inks used in textiles:

____________________________________________________________________________
______________________________________________________________________
107
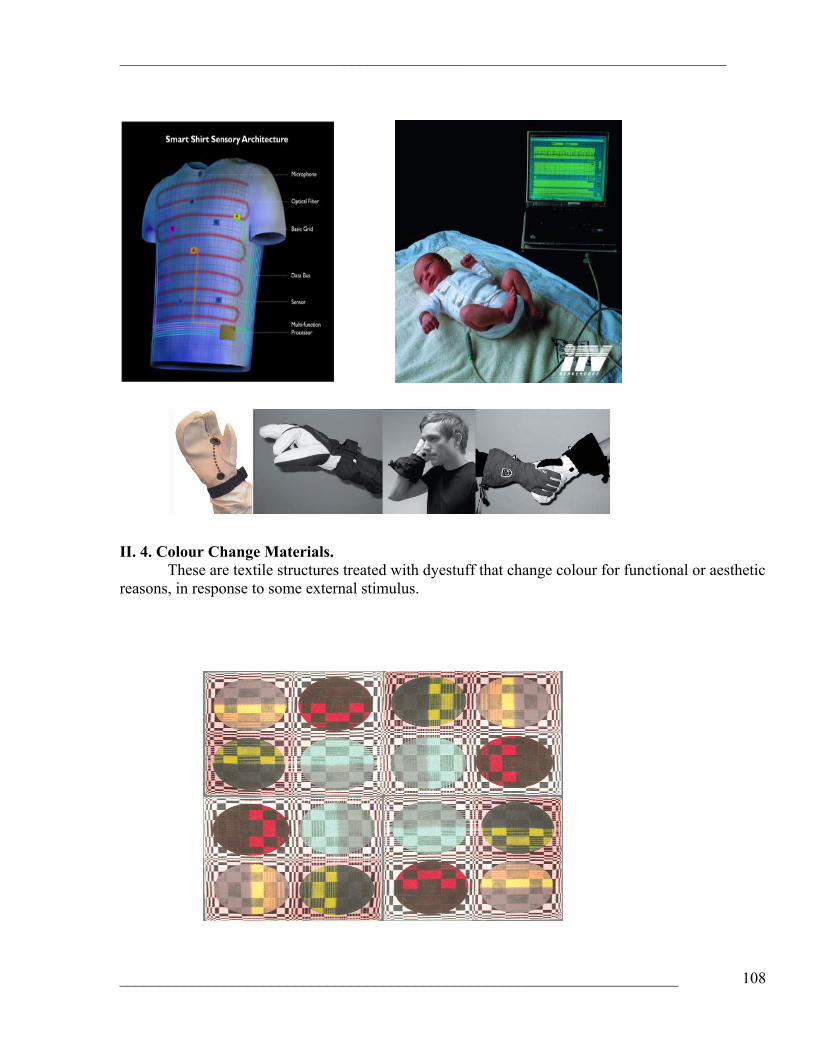
____________________________________________________________________________
______________________________________________________________________
108
II. 4. Colour Change Materials.
These are textile structures treated with dyestuff that change colour for functional or aesthetic reasons, in response to some external stimulus.

____________________________________________________________________________
______________________________________________________________________
109
II. 5. Optical fibres. Glass is a material, which is not associated with textiles. Fibres of glass are often referred to
as optical fibres, which are used to carry signals in form of pulses of light over distances up to 50 km without the need of repeaters. These signals may code voice communications or computer data.
III. Conclusions.
A few years ago, smart textiles were presented as imaginary products and as a non competitive market. After scientific efforts and development phases, nowadays smart textiles are an implanted customer interest and are presented as the future of the textile industry. A lot of commercial products are available and a lot of scientist are developing new solutions, ideas and concrete products. XII. THE PRODUCTION OF ELASTIC CONDUCTIVE YARN WITH STAINLESS STEEL THREAD.
Dr. Genti GUXHO, Msc. Ilda KAZANI Albania Abstract
The aim of the research is to achieve elastic conductive yarns which are electrically conductive without changing their conductivity when elongated and which offer improved stretching behavior. So far, the use of electrically conductive textiles leads to some problems after using them on a long term basis, when stretching and deforming them repetitively. Typically, the conductive yarns will come out of the fabric, forming loops on the fabric surface. Against this background, the aim is at improving the long term performances of electrically conductive textiles in terms of stretch ability, conductivity, wash ability and wearing properties. To achieve this are produced different elastic conductive yarns from stainless steel threads and wire around the elastic core threads. Fabrics will be produced by these yarns and will be used in medical textiles. Keywords Elastic conductive yarn, stainless steel thread, resistance, resistivity.
____________________________________________________________________________
______________________________________________________________________
110
1. Introduction In the last 20 years many new synthetic have entered the market and today fibres can be flame-retardant, heat-resistant, weight-supporting, antibacterial and even help those suffering from allergies to dust mites. These high-tech, value-added products, known as technical textiles, are used in cars, trains and planes; for health care and protective clothing; and for sport and leisure wear. Today technical textiles are the fastest growing area in textiles and clothing. In sectors such health and the building industry new products are continuously being developed and combined with advanced technology to improve functionality and improve quality. 1 The development of this new field of textile has many motivating factors but out of all those, there are two most significant. One is the tremendous development in the field of microchips and electronics, one time huge mother boards have been converted into pinhead size chips with better functionality than ever before. Second is the death of the traditional textile and clothing industry in Europe, North America and other developed nations. Research on Smart Textiles is going on with a focus of applications in different fields ranging from Defense systems to the daily life usage. Smart textiles and wearable technology solutions gives added value to a large variety of products. Potential application areas are: 2
• Health care, e.g. patients’ clothing with integrated sensors. • Protective clothing for extreme working conditions, e.g. fire fighters. • Technical textiles. • Sport and leisure wear. • Military clothing.
In the coming years, clothing products will increasingly assume intelligent functions. Clothing will combine the functions of medium, carrier and interface for an extremely wide range of micro system applications. This new generation of "intelligent clothing" places considerable new demands on innovative ability within the clothing industry, demands which also offer huge potential for future business sectors.3 Pioneers of the "smart clothes" concept defines intelligent clothing as the combination of mobile multimedia technology with wireless communication and portable computers integrated into clothing. They make a distinction between clothing which is worn to carry out a specific profession (smart uniforms) and clothing which anyone could wear, even in their leisure time (smart clothing). This distinction does not relate to the technological level.
2. The materials used.
The materials that are used to produce these yarns are conductive and nonconductive threads. • Electro conductive materials: 1. Hog 1 - Stainless steel Bekinox (staple fibers) 2. Hog 2 - Stainless steel Bekinox (filament VN 14/1 x 90/100Z/316 L/HT) 3. Hog 3 - Stainless steel Bekinox (filament VN 12/2 x 275/175S/316 L/HT) 4. Hog 4 - Stainless steel Bekinox (AlSI, monofilament)

____________________________________________________________________________
______________________________________________________________________
111
• Nonconductive materials: 1. Hog 5 - Rubber, elastic yarn (monofilamet) 2. Hog 6 - Bota, elastic yarn (composite elastic yarn,) 3. Hog 7 - Elasta, elastic yarn (composite elastic yarn, black) 4. Hog 8 - Elasta, elastic yarn (composite elastic yarn, white )
3. Electro conductive elastic yarns. In the photos below are illustrated the yarns that are produce.

____________________________________________________________________________
______________________________________________________________________
112
Fig.1 Photo of the yarns that are produce.

____________________________________________________________________________
______________________________________________________________________
113
4. Tests results
4. 1. Electro conductive yarn (input)
4. 1. a. Physical properties
1. Linear density and tensile strength Table. 1
Nr.
Input yarn
1 Linear density
(Tex) Tensile strength
(N)
1 Hog 1 186 16.36
2 Hog 2 103 19.51
3 Hog 3 505 86.79
4 Hog 4 10 0.91
4. 1. b. Electrical properties
1. Electrical resistance From this test we have the following data for the electro conductive yarns:
Table. 2 Nr.
Input yarn 1
Electrical resistance R (Ω/m)
1 Hog 1 58
2 Hog 2 71.6
3 Hog 3 14.5
4 Hog 4 1026
4. 2. Elastic yarn (input)
4. 2. a. Physical properties
1. Elastic recovery, tensile strength Table. 3
Nr. Input yarn 2 Elastic recovery (%) Tensile strength (N)
1 Hog 5 No with the load
1.5 N 1.17
2 Hog 6 89.9 2.55
3 Hog 7 92.48 1.84
4 Hog 8 86.39 2.47
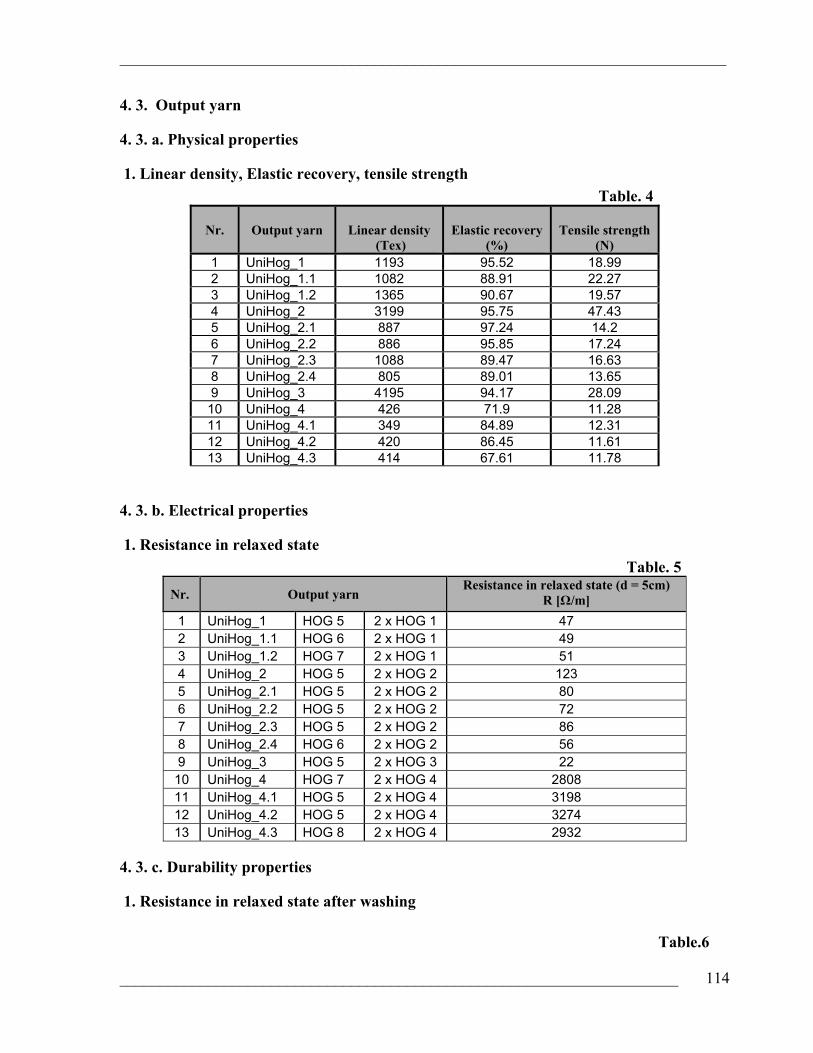
____________________________________________________________________________
______________________________________________________________________
114
4. 3. Output yarn
4. 3. a. Physical properties
1. Linear density, Elastic recovery, tensile strength Table. 4
Nr.
Output yarn
Linear density
(Tex)
Elastic recovery
(%)
Tensile strength
(N) 1 UniHog_1 1193 95.52 18.99 2 UniHog_1.1 1082 88.91 22.27 3 UniHog_1.2 1365 90.67 19.57 4 UniHog_2 3199 95.75 47.43 5 UniHog_2.1 887 97.24 14.2 6 UniHog_2.2 886 95.85 17.24 7 UniHog_2.3 1088 89.47 16.63 8 UniHog_2.4 805 89.01 13.65 9 UniHog_3 4195 94.17 28.09 10 UniHog_4 426 71.9 11.28 11 UniHog_4.1 349 84.89 12.31 12 UniHog_4.2 420 86.45 11.61 13 UniHog_4.3 414 67.61 11.78
4. 3. b. Electrical properties
1. Resistance in relaxed state Table. 5
Nr. Output yarn Resistance in relaxed state (d = 5cm)
R [Ω/m] 1 UniHog_1 HOG 5 2 x HOG 1 47 2 UniHog_1.1 HOG 6 2 x HOG 1 49 3 UniHog_1.2 HOG 7 2 x HOG 1 51 4 UniHog_2 HOG 5 2 x HOG 2 123 5 UniHog_2.1 HOG 5 2 x HOG 2 80 6 UniHog_2.2 HOG 5 2 x HOG 2 72 7 UniHog_2.3 HOG 5 2 x HOG 2 86 8 UniHog_2.4 HOG 6 2 x HOG 2 56 9 UniHog_3 HOG 5 2 x HOG 3 22 10 UniHog_4 HOG 7 2 x HOG 4 2808 11 UniHog_4.1 HOG 5 2 x HOG 4 3198 12 UniHog_4.2 HOG 5 2 x HOG 4 3274 13 UniHog_4.3 HOG 8 2 x HOG 4 2932
4. 3. c. Durability properties
1. Resistance in relaxed state after washing Table.6
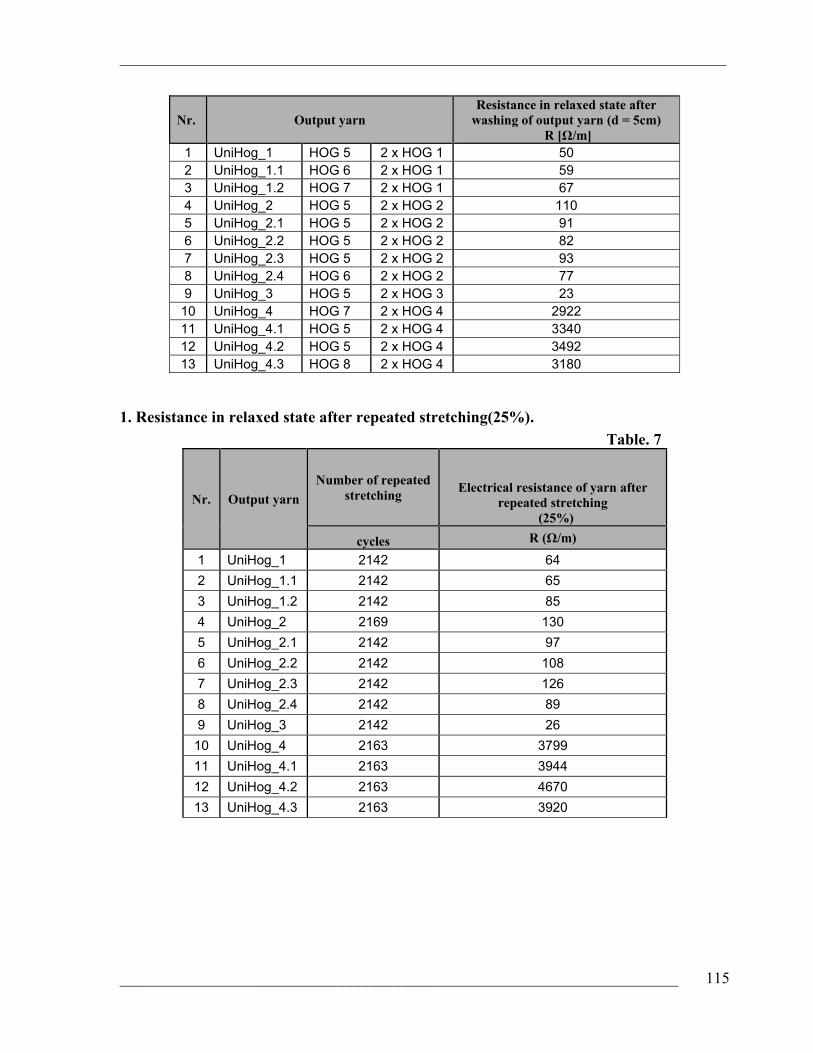
____________________________________________________________________________
______________________________________________________________________
115
Nr. Output yarn Resistance in relaxed state after
washing of output yarn (d = 5cm) R [Ω/m]
1 UniHog_1 HOG 5 2 x HOG 1 50 2 UniHog_1.1 HOG 6 2 x HOG 1 59 3 UniHog_1.2 HOG 7 2 x HOG 1 67 4 UniHog_2 HOG 5 2 x HOG 2 110 5 UniHog_2.1 HOG 5 2 x HOG 2 91 6 UniHog_2.2 HOG 5 2 x HOG 2 82 7 UniHog_2.3 HOG 5 2 x HOG 2 93 8 UniHog_2.4 HOG 6 2 x HOG 2 77 9 UniHog_3 HOG 5 2 x HOG 3 23 10 UniHog_4 HOG 7 2 x HOG 4 2922 11 UniHog_4.1 HOG 5 2 x HOG 4 3340 12 UniHog_4.2 HOG 5 2 x HOG 4 3492 13 UniHog_4.3 HOG 8 2 x HOG 4 3180
1. Resistance in relaxed state after repeated stretching(25%). Table. 7
Nr. Output yarn Number of repeated
stretching Electrical resistance of yarn after repeated stretching
(25%)
cycles R (Ω/m)
1 UniHog_1 2142 64 2 UniHog_1.1 2142 65 3 UniHog_1.2 2142 85 4 UniHog_2 2169 130 5 UniHog_2.1 2142 97 6 UniHog_2.2 2142 108 7 UniHog_2.3 2142 126 8 UniHog_2.4 2142 89 9 UniHog_3 2142 26 10 UniHog_4 2163 3799 11 UniHog_4.1 2163 3944 12 UniHog_4.2 2163 4670 13 UniHog_4.3 2163 3920
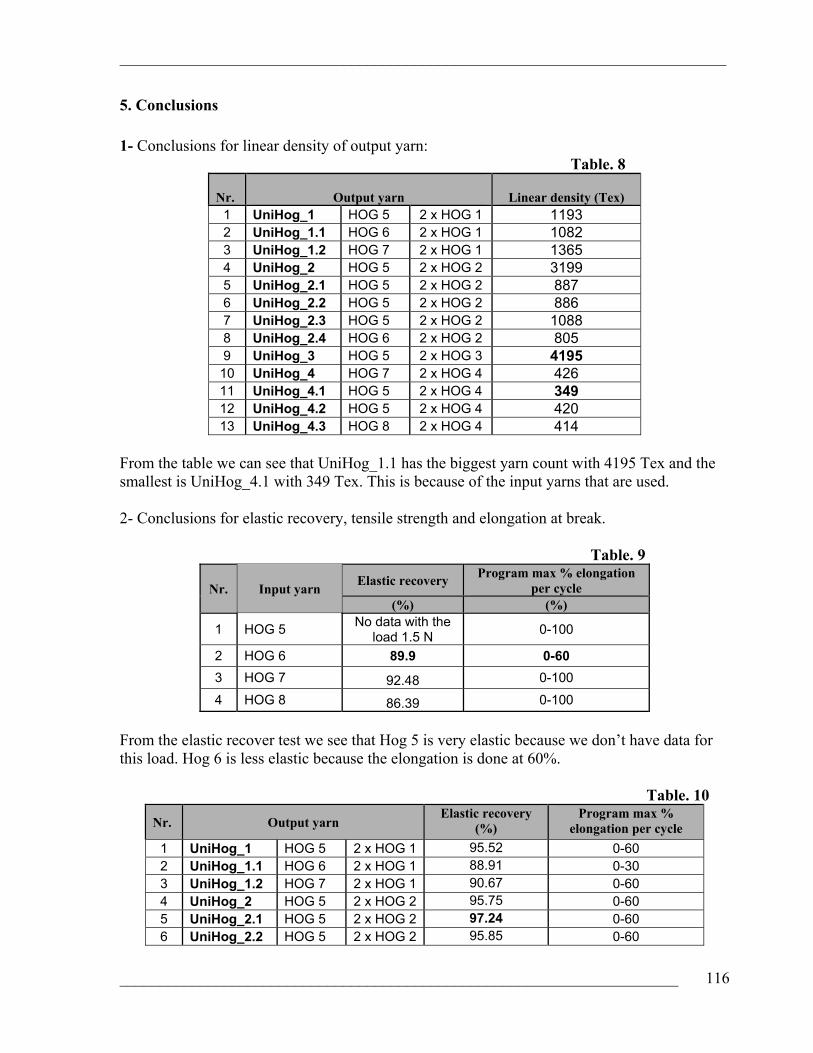
____________________________________________________________________________
______________________________________________________________________
116
5. Conclusions 1- Conclusions for linear density of output yarn: Table. 8
Nr.
Output yarn
Linear density (Tex)
1 UniHog_1 HOG 5 2 x HOG 1 1193 2 UniHog_1.1 HOG 6 2 x HOG 1 1082 3 UniHog_1.2 HOG 7 2 x HOG 1 1365 4 UniHog_2 HOG 5 2 x HOG 2 3199 5 UniHog_2.1 HOG 5 2 x HOG 2 887 6 UniHog_2.2 HOG 5 2 x HOG 2 886 7 UniHog_2.3 HOG 5 2 x HOG 2 1088 8 UniHog_2.4 HOG 6 2 x HOG 2 805 9 UniHog_3 HOG 5 2 x HOG 3 4195 10 UniHog_4 HOG 7 2 x HOG 4 426 11 UniHog_4.1 HOG 5 2 x HOG 4 349 12 UniHog_4.2 HOG 5 2 x HOG 4 420 13 UniHog_4.3 HOG 8 2 x HOG 4 414
From the table we can see that UniHog_1.1 has the biggest yarn count with 4195 Tex and the smallest is UniHog_4.1 with 349 Tex. This is because of the input yarns that are used. 2- Conclusions for elastic recovery, tensile strength and elongation at break.
Table. 9
Nr. Input yarn Elastic recovery Program max % elongation per cycle
(%) (%)
1 HOG 5 No data with the load 1.5 N 0-100
2 HOG 6 89.9 0-60 3 HOG 7 92.48 0-100
4 HOG 8 86.39 0-100
From the elastic recover test we see that Hog 5 is very elastic because we don’t have data for this load. Hog 6 is less elastic because the elongation is done at 60%.
Table. 10
Nr. Output yarn Elastic recovery (%)
Program max % elongation per cycle
1 UniHog_1 HOG 5 2 x HOG 1 95.52 0-60 2 UniHog_1.1 HOG 6 2 x HOG 1 88.91 0-30 3 UniHog_1.2 HOG 7 2 x HOG 1 90.67 0-60 4 UniHog_2 HOG 5 2 x HOG 2 95.75 0-60 5 UniHog_2.1 HOG 5 2 x HOG 2 97.24 0-60 6 UniHog_2.2 HOG 5 2 x HOG 2 95.85 0-60

____________________________________________________________________________
______________________________________________________________________
117
7 UniHog_2.3 HOG 5 2 x HOG 2 89.47 0-100 8 UniHog_2.4 HOG 6 2 x HOG 2 89.01 0-30 9 UniHog_3 HOG 5 2 x HOG 3 94.17 0-60 10 UniHog_4 HOG 7 2 x HOG 4 71.9 0-100 11 UniHog_4.1 HOG 5 2 x HOG 4 84.89 0-60 12 UniHog_4.2 HOG 5 2 x HOG 4 86.45 0-60 13 UniHog_4.3 HOG 8 2 x HOG 4 67.61 0-100
UniHog_2.1 (with Hog 5) has the highest elastic recovery with 97.24% and UniHog_4.3 (with Hog 8) has the lowest with 67.61%. This happened because of metallic yarn and also the amount of the level of twist. 3- Conclusions for tensile strength and elongation at break. With the number of cycle (1-10) the strength of the yarns is decreasing and the yarn is becoming fatigue.
Table. 11 Nr.
Input yarn 1
Tensile strength (N)
Elongation at break (%)
1 Hog 1 16.36 1.03 2 Hog 2 19.51 1.31 3 Hog 3 86.79 1.99 4 Hog 4 0.91 35.10 5 Hog 5 13.17 483.1 6 Hog 6 12.06 161.5 7 Hog 7 10.56 239.5 8 Hog 8 11.46 239.5
Table. 12
Nr. Output yarn Tensile strength
(N) Elongation at break
(%) 1 UniHog_1 HOG 5 2 x HOG 1 18.99 92 2 UniHog_1.1 HOG 6 2 x HOG 1 22.27 48.2 3 UniHog_1.2 HOG 7 2 x HOG 1 19.57 84.62 4 UniHog_2 HOG 5 2 x HOG 2 47.43 121.18 5 UniHog_2.1 HOG 5 2 x HOG 2 14.2 111.04 6 UniHog_2.2 HOG 5 2 x HOG 2 17.24 137 7 UniHog_2.3 HOG 5 2 x HOG 2 16.63 183 8 UniHog_2.4 HOG 6 2 x HOG 2 13.65 42.8 9 UniHog_3 HOG 5 2 x HOG 3 28.09 214.8 10 UniHog_4 HOG 7 2 x HOG 4 11.28 155.2 11 UniHog_4.1 HOG 5 2 x HOG 4 12.31 106.16 12 UniHog_4.2 HOG 5 2 x HOG 4 11.61 117.05 13 UniHog_4.3 HOG 8 2 x HOG 4 11.78 156.6
In both cases are the metallic yarn that influence at this value, increasing the tensile strength and decrease elongation at break.

____________________________________________________________________________
______________________________________________________________________
118
UniHog_2 (with Hog 5 and Hog 2) has the highest tensile strength with 47.43 N and UniHog_4 (with Hog 7 and Hog 4) has the lowest with 11.28 N. From the table of output yarns we see that is Hog 3 the one that has the highest tensile strength but during the production of UniHog_3 the tensile strength decreases because the number of torsions, of metallic yarn, here is bigger than UniHog_2. Hog 3 is very abrasive and this can damage the elastic core influencing in the tensile strength of UniHog_3 and decreasing it. Here we see that the tensile strength of output yarn has bigger values than input yarns. This happened because of elastic and metallic yarns that are used. UniHog_3 (with Hog 5 and Hog 3) has the highest elongation at break with 214.8% and UniHog_2.4 (with Hog 6 and Hog 2) has the lowest elongation at break with 42.8%. Here we see that the output yarns have bigger value than input yarns. This happened because of elastic input yarns that are used Hog 5 has the highest elongation at break with 483.1% and Hog 6 the lowest with 161.5% 4- Conclusions for the resistance of output yarn: a. From input yarn to output yarn the resistivity is increased because are used 2 metallic yarns and 1m of output yarn contain more meters of input yarns. The stainless steel wire has the highest resistivity because is only one filament, for more filaments we will have less resistivity, because the multifilament are in parallel. b. Resistivity of stainless steel can be changed by the section area:
Al
×ρ=R
c. The resistivity after washing test is a little bit higher than before the washing test, because are used chemical and mechanical movement during the process of washing that can causes less contact between fibers. d. In the second group, with multifilament conductive yarn, we see that with the decreasing of the twist the resistivity is decreased. For the production of UniHog_2, UniHog_2.1, UniHog_2.2, UniHog_2.3 are used the same elastic yarns.
Table. 13
Twist
1
Twist
2
Resistivity before wash
R (Ω/m)
Resistivity after wash
R (Ω/m)
UniHog_2.3 1000 1000 86 93
UniHog_2.2 900 900 72 82
UniHog_2.4 700 700 56 77
UniHog_2.1 600 700 89 91
UniHog_2 700 600 99 110

____________________________________________________________________________
______________________________________________________________________
119
e. In the fourth group, with monofilament conductive yarn, we see that with the decreasing of the twist the resistivity is decreased. For the production of UniHog_4.1 and UniHog_4.2 are used the same elastic yarns.
Table. 14
Twist
1
Twist
2
Resistivity before wash
R (Ω/m)
Resistivity after wash
R (Ω/m)
UniHog_4.2 6000 6000 3274 3492
UniHog_4.1 5000 5000 3198 3340
UniHog_4.3 5000 5000 2932 3180
UniHog_4 5000 5000 2808 2922
5- Conclusions for the electric resistance of yarn in relaxed state after repeated stretching. Table. 15
Nr. Output yarn Input yarn
Resistance in relaxed state before wash
(d = 5cm)
Resistance in relaxed state after repeated stretching
(25%)
R (Ω/m) R (Ω/m)
1 UniHog_1 HOG 8 2 x HOG 1 47 64 2 UniHog_1.1 HOG 9 2 x HOG 1 64 65 3 UniHog_1.2 HOG 10 2 x HOG 1 51 85 4 UniHog_2 HOG 8 2 x HOG 3 99 130 5 UniHog_2.1 HOG 8 2 x HOG 3 89 97 6 UniHog_2.2 HOG 8 2 x HOG 3 72 108 7 UniHog_2.3 HOG 8 2 x HOG 3 86 126 8 UniHog_2.4 HOG 9 2x HOG 3 56 89 9 UniHog_3 HOG 8 2 x HOG 4 22 26 10 UniHog_4 HOG 10 2 x HOG 7 2808 3799 11 UniHog_4.1 HOG 8 2 x HOG 7 3198 3944 12 UniHog_4.2 HOG 8 2 x HOG 7 3274 4670 13 UniHog_4.3 HOG 11 2 x HOG 7 2932 3920 After repeating the stretching and measured the resistance we see that the resistance is increasing after the stretching, more than before and after the washing test.

120
Summary table of properties of output yarns.
Name Physical properties Electrical properties Durability properties
Nr. Output yarns Input yarns
Yarn count
Elastic recovery Tensile strength
Resistance in relaxed state
Resistance in relaxed state after
washing
Resistance in relaxed state after repeated stretching
(25%) Tex % N Ω/m Ω/m Ω/m
1 UniHog_1 HOG 5 2 x HOG 1 1193 95.52 18.99 47 50 64 2 UniHog_1.1 HOG 6 2 x HOG 1 1082 88.91 22.27 49 59 65 3 UniHog_1.2 HOG 7 2 x HOG 1 1365 90.67 19.57 51 67 85 4 UniHog_2 HOG 5 2 x HOG 2 3199 95.75 47.43 99 110 130 5 UniHog_2.1 HOG 5 2 x HOG 2 887 97.24 14.2 89 91 97 6 UniHog_2.2 HOG 5 2 x HOG 2 886 95.85 17.24 72 82 108 7 UniHog_2.3 HOG 5 2 x HOG 2 1088 89.47 16.63 86 93 126 8 UniHog_2.4 HOG 6 2 x HOG 2 805 89.01 13.65 56 77 89 9 UniHog_3 HOG 5 2 x HOG 3 4195 94.17 28.09 22 23 26
10 UniHog_4 HOG 7 2 x HOG 4 426 71.90 11.28 2808 2922 3799 11 UniHog_4.1 HOG 5 2 x HOG 4 349 84.89 12.31 3198 3340 3944 12 UniHog_4.2 HOG 5 2 x HOG 4 420 86.45 11.61 3274 3492 4670 13 UniHog_4.3 HOG 8 2 x HOG 4 414 67.61 11.78 2932 3180 3920
121
The yarns with the best parameters and regularity are: UniHog_1, UniHog_1.2, UniHog_2.2 and UniHog_2.3. We can use these yarns to produce fabrics that will be used in medical textiles.
6. References
____________________________ 1 Tao X., “Smart fibres, fabric and clothing”, Woodhead Publishing Ltd, Cambridge England (2001). References ESA (European Space Agency) - Technology Transfer – i – WEAR Fashion Show in Paris (http://www.esa.int/SPECIALIST/Technology_Transfer/SEM3CKWLDMD_2.html)
2 Heikki Mattila, Project 03123, Nordic CoE for Smart Textiles and Wearable Technology NEST, Final Report
3 http://www.reimasmart.com/
http://www.research.philips.com/pressmedia/releases/990802.html
http://www.starlab.org/bits/intell_clothing/
XIII. BEST AVAILABLE TECHNIQUES FOR THE TEXTILES INDUSTRY. Ing. Majlinda HYLLI, Albania
Abstract This poster, it is confined to those activities in the textile industry that involve wet processes. This means primarily activities classifications:
• textile finishing • industrial and other textiles (including Carpets and Wool Scouring) • home textiles.
The essence of textile finishing is giving fabrics the visual, physical and aesthetic
properties which consumers demand. The main processes involved are bleaching, dyeing (of yarn, fabric and ready-made garments), printing, coating / impregnating and the application of various functional finishings.
In most cases, the textile finishing process is combined with a manufacturing process, which gives the final product its particular shape. The main product categories cover clothing textiles, interior textiles (furnishing fabrics, curtains and carpets), household textiles (bed / bath and table linen) and technical textiles (automotive fabrics, geoand medical textiles).

122
Figure 1: EU Textile Finishing Production 2. Main environmental issues
The main environmental issues arising from the activities in the textile industry regard primarily emissions to water and air and energy consumption
The share of the main types of fibres used in the textile finishing
industry is: - cotton 45 - wool 8 - polyester 14 - silk 2 - viscose 12 - acrylic 4 - others 15
Total 100 %
The fibres end up in processed goods, the main categories in
percentage being:
- clothing textiles 45 - household textiles 20 - interior textiles 10 - technical textiles 18 - others 7 Total 100 %

123
Table 1: Main charging loads from textile industry in Europe
It appears that a large percentage of the total emission load from textile industry
activities is attributable to substances that are already on the raw material before it enters the finishing process sequence. Typically these are:
• sizing agents • preparation agents • natural fibres impurities and associated material
3. Applied processes and techniques
The textile chain begins with the production or harvest of raw fibre. The basic steps in this chain are schematically represented in the following diagram

124
Figure 2: General diagram of processes in the textile industry

125
4. Dyeing 4.1. General principles of dyeing
Textile dyeing involves the use of a number of different chemicals and auxiliaries to assist the dyeing process. Some of them are process-specific, while others are also used in other operations. Some auxiliaries (e.g. dispersing agents) are already contained in the dyestuff formulation, but more commonly auxiliary agents are added at a later stage to the dye liquor. Since auxiliaries in general do not remain on the substrate after dyeing, they are ultimately found in the emissions. Various dyeing techniques exist:
• mass dyeing/gel dyeing, in which a dye is incorporated in the synthetic fibre during its production (this technique is the most commonly applied process for PP fibres)
• pigment dyeing, in which an insoluble pigment, without affinity for the fibre, is deposited onto the textile substrate and then fixed with a binder
• dyeing processes which involve the diffusion of a dissolved or at least partially dissolved dye into the fibre
4.2. Environmental issues
Potential sources and types of emissions associated with dyeing processes are summarised in the following table.
Table 2: Overview of the typical emissions generated in dyeing processes

126
5. Emission and consumption level The textiles industry has always been regarded as a water-intensive sector. The
main environmental concern is therefore about the amount of water discharged and the chemical load it carries.
Other important issues are energy consumption, air emissions and solid wastes and odours, which can be a significant nuisance in certain treatments.
Air emissions are usually collected at their point of origin. Because they have been controlled for quite a long time in different countries, there are good historical data on air emissions from specific processes.
This is not the case with emissions to water. The various streams coming from the different processes are mixed together to produce a final effluent whose characteristics are the result of a complex combination of factors:
• the types of fibres involved • the types of make-ups processed • the techniques applied • the types of chemicals and auxiliaries used in the process
Figure 3: Composition of the COD load

127
6. Techniques to consider in the determination of bat
Figure 3: Scheme for annual input/output overview at site level

128
6.1. General good management practices -Automated preparation and dispensing of chemicals
Great improvements have been made in recent years in the automation of traditionally manual process steps, such as the preparation and dosing/dispensing of chemicals (as aqueous solutions, powder or pastes) and even laboratory operations.
Automated color kitchens and automated chemicals dosing and dispensing systems are now commonly applied in many companies in the textile industry. Automation leads to a number of environmental benefits.
First of all, tighter control of the process allows for improved right-first-time performance, which means minimizing corrective measures such as reworks, re-dyes, stripping and shade adjustment.
Secondly, automated systems with just-in-time preparation of liquors and separate dispensing of the different chemicals (i.e. no premixing) allow a significant reduction of waste water pollution and wasted chemicals thanks to the minimisation/ avoidance of liquor residues that would otherwise need to be disposed of at the end of the process.
This is particularly important in continuous and semi-continuous processing. -Optimising water consumption in textile operations
• Controlling water consumption • Reducing water consumption - by improved working practices - by reducing liquor ratio - by improving washing efficiency - by combining processes • Re-using water
Significant savings in water and energy consumption are possible (energy is used to a great extent to heat up the process baths). - Insulation of High Temperature (HT) machines
• Insulation of pipes, valves, tanks and machines is a general principle of good housekeepingpractice that should be applied at the general level in all processes.
• More rational use of energy. 6.2 Quality management of incoming fibre
• Man-made fibre preparation agents with improved environmental performance • Mineral oils substitution in wool spinning lubricants • Mineral oils substitution in knitted fabric manufacturing • Selection of sizing agents with improved environmental performance • Minimising sizing agent add-on by pre-wetting the warp yarns

129
• Use of techniques that allow reduced load of sizing agents on the fibre (compact spinning)
• Minimising residues of organophosphate and synthetic pyrethroid ectoparasiticides in the raw material by substitution
• Minimising residues of organochlorine ectoparasiticides in the raw material by substitution
6.3 Selection/ substitution of chemicals used
• Selection of textile dyes and auxiliaries according to their waste water relevance • Substitution for alkylphenol ethoxylates (and other hazardous surfactants) • Selection of biodegradable/bioeliminable complexing agents in pretreatment and
dyeing processes • Selection of antifoaming agents with improved environmental performance • Recovery of sizing agents by ultrafiltration • Use of integrated dirt removal/grease recovery loops combined with evaporation
of the effluent and incineration of the sludge • Minimising energy consumption in wool scouring installations • Wool scouring with organic solvent • Dispersing agents with higher bioeliminability in dye formulations • One-step continuous vat dyeing in pastel to pale shades • Aftertreatment in PES dyeing

130
Figure 4.: Schematic diagram of the effluent and waste management system

131
XIV. HIGH PERFORMANCE OF PE FIBERS IN ARTIFICIAL TURF Blerina Kolgjini, Prof. Paul Kiekens, Dr. Ermira Shehi.
Abstract Based on FIFA’s and UEFA’s standards for the fieldst of football, today artificial
turf has gained importance. Such standards require the implementation of a series of stipulations, whereby the most important issue involves the stability of the pile, which entails selecting polymers with the best physical, mechanical, and economical indicators for usage with filaments of artificial turf. In practical terms, the PE fibers in terms of such parameters are fulfilled in the best possible way.
However, the performance assessment of the artificial turf is related directly with the evaluation of resilience of the filaments as part of the pile in artificial turf. Lack of resilience is one of the more problematic issues which is encountered in the field of artificial turf. After some time the filament does not remain in its normal position, vertically straight as a result of the intensive movement of the ball and of the competitors during the game and training.
The chemical and physical processes of the production of the filaments appears to be considerably influenced in terms of the filament’s mechanical and physical properties. The same influence also emerges concerning the parameters of the production process of the filaments with extrusion under laboratory conditions. These indicators suggest a classification of filaments that are dependent on production conditions. Methodology
The evolution of resilience was done by using the Favimat R method (figure 1). The strength of the filament evolution and resilience involves the parameters of the production process and temperature. Resilience
Strength

132
Results

133
Conclusions • The assessment of the performance of the artificial turf is directly related to the
• evolution of the filament performance as an integral part of the pile.
• The usage of the new Favimat R method is advantageous for measuring resilience, expecialy in regards to time and cost.
• The results of resilience are directly related to the parameters of the process.
• Anaeling of filament under laboratory conditions yields improved resilience and strength (and does not have negative effects).
References Fifa quality concepts for football ture August 2006. Joosten T. 2003 Players experiences of artificial turf IS.SS . Stadio Turf Summit, Amsterdam.