pooja sharma shanti ragathi vaishnavi kasala. revisiting business needs there is a greater need for...
TRANSCRIPT

Pooja SharmaShanti RagathiVaishnavi Kasala

Revisiting Business Needs
There is a greater need for strategic information that will ensure the long term survival of Lowe’s Corporation’
What quarter is least successful by state? We could enhance marketing in that quarter.
What Store sells the most in each year? We could use this data to find out where we would like to open new stores.
What kind of product is selling the most in each state? We would know to order more of that product in that state.

Brief Overview
Dimensions Have Been Altered Slightly and a new Dimension have been added.
The modified dimensional modeling consists of Four dimensions
• DimProduct
• DimDate
• DimStore (previously it is location)
• DimChannel (Newly added dimension)

Brief Overview
Hierarchies
The Product Dimension has two Hierarchies:
• DimProductSubCategory
• DimProductCategory
The Store Dimension has a single Hierarchy
• DimLocation

Database
The database used in our project is a sample database from www.codeproject.com Site .
The products like Computer hardware , cell phone accessories etc used in the sample database do not depict the actual products that Lowes store sells.

Modified Dimensional Modeling:Snow Flake Schema

Important Steps involved in importing access database to SBUS-DB
Step1
• Database -> right-click-> select New database
• Now enter a database name “Lowes” to create a database.

Step 2: Importing Access database in SQL Server
• Now right-click on the Ragathi database and select the Import Data option.
• database Name -> Tasks -> Import data

The new database will be shown in the Object Explorer:

Step 3: Establishing Connection String

Step 4: Adding Data Source View(Adding Tables from the Database)
Step 5: Define Cube
Select FactSales table as Measure Group
Add Dimensions
Add Profit as a Calculated column
Defining Hierarchies

Implemented Cube

REPORTS

Report 1 Overall Profit of Lowes Store from 2007-2009
Conclusion:
The first conclusion we can draw from the reports that the overall profit of Lowes Corp kept decreasing from 2007 to 2009.This clearly shows that Lowes Corporation is in need of strategic information gathered from data warehousing to regain its position.

Report 2 Sales of products by year
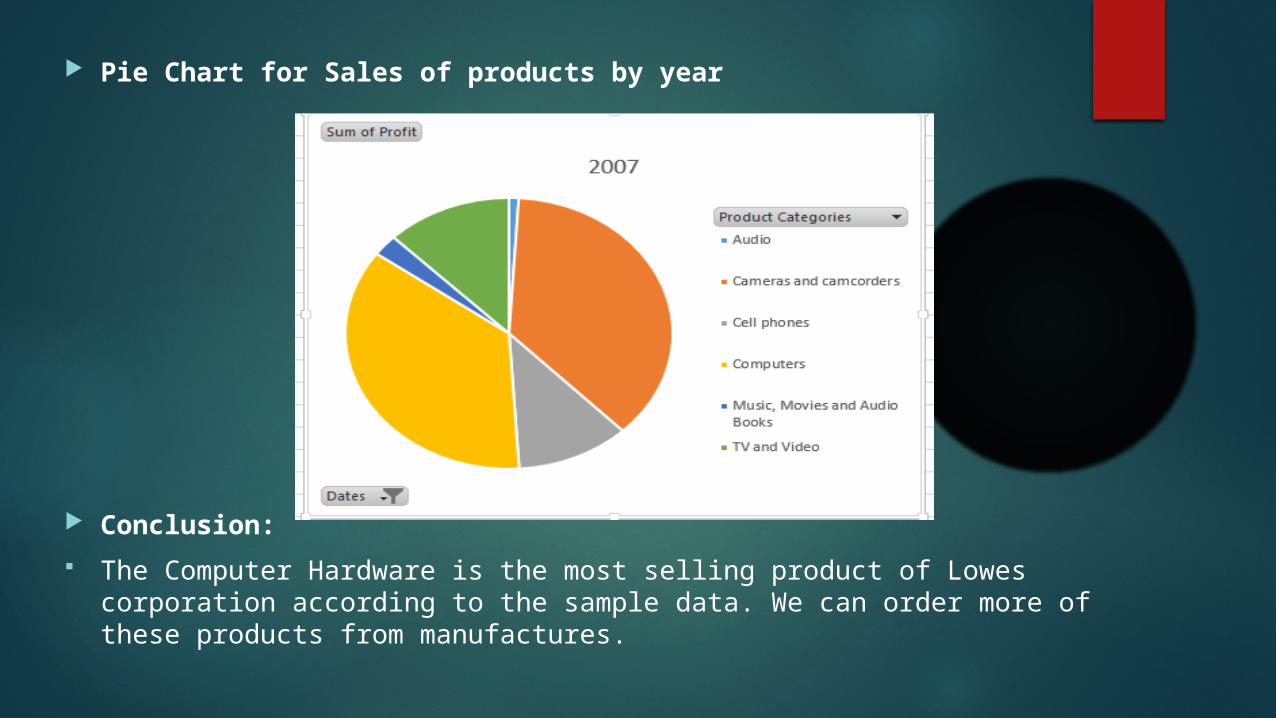
Pie Chart for Sales of products by year
Conclusion:
The Computer Hardware is the most selling product of Lowes corporation according to the sample data. We can order more of these products from manufactures.

Report 3 Sales of products by state and by year

Pie Chart for Sales by state and by year
Conclusion:
The Sales are highest for Maryland State from 2007-2009.We could use this data to find out where we would like to open new stores.
The Sales are lowest for Alaska state and Lowes should concentrate on improving their business in this state.

Report 4 Sales by state by store by quarter and year

Bar Chart Sales by state by store by quarter and year
Conclusion: Lowe’s Anchorage store in Alaska and Lowe’s Milliken store in Colorado performed badly in 2007,We can either close these stores or enhance the marketing strategies while the Lowe’s Catalog store in Maryland performed extremely well.
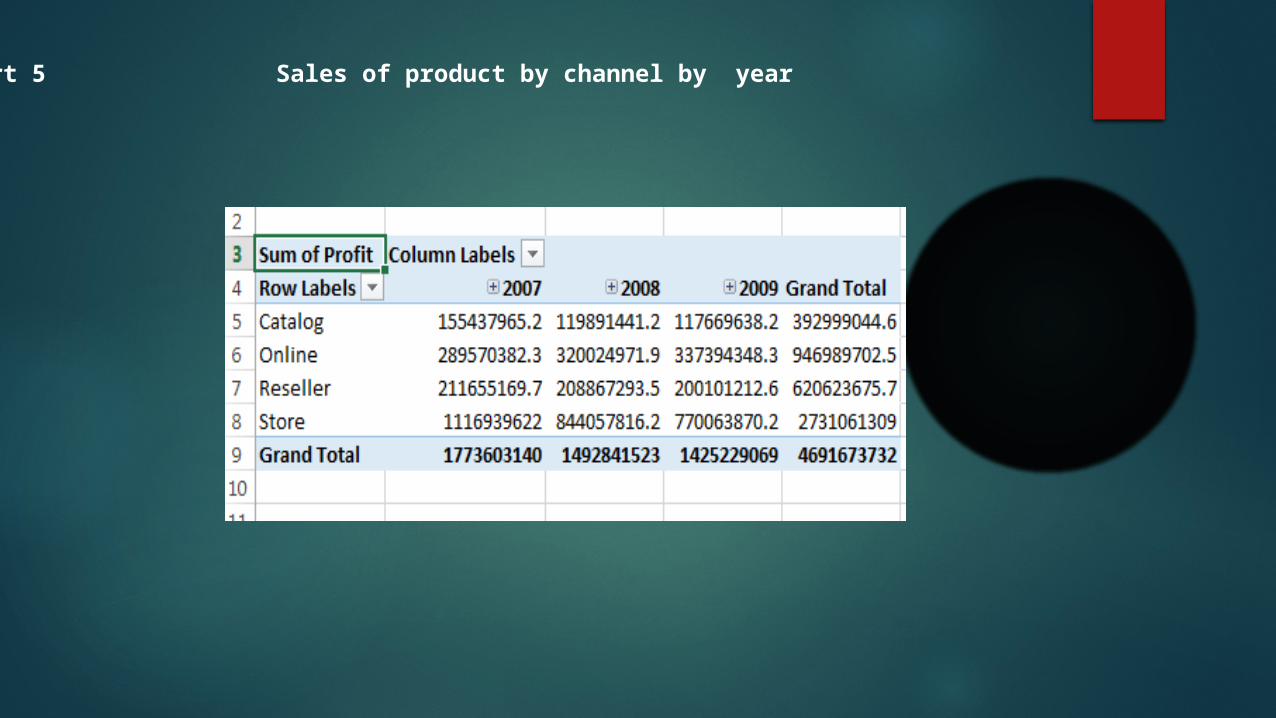
Report 5 Sales of product by channel by year

Pie Chart of Sales by product by channel by year
Conclusion:
In - Store channel sales are higher compare to other channels.
They can concentrate on increasing the online sales by various promotional activities

Thank you.