pooled investment funds - secure.mfa.bc.ca
TRANSCRIPT
Pool
ed In
vest
men
t Fu
nds
20 19

B Municipal Finance Authority of British Columbia | 2019 Pooled Investment Funds
Municipal Finance Authority of British Columbia | 2019 Pooled Investment Funds 1
MONEY MARKET, INTERMEDIATE, AND BOND POOLED INVESTMENT FUNDS
Reports and Notes 3
SCHEDULES
Investment Portfolio 9
Participants 17
HIGH INTEREST SAVINGS ACCOUNT POOLED INVESTMENT FUNDS
Reports and Notes 19
SCHEDULE
Participants 24
Contents
Municipal Finance Authority of British Columbia | 2019 Pooled Investment Funds 1

2 Municipal Finance Authority of British Columbia | 2019 Pooled Investment Funds2 Municipal Finance Authority of British Columbia | 2019 Pooled Investment Funds
Municipal Finance Authority of British Columbia | 2019 Pooled Investment Funds 3
Money Market, Intermediate, and Bond Pooled Investment Funds
REPORTS
Net Assets 4
Operations and Unitholders’ Equity 5
Changes in Net Assets 6
Notes 7
SCHEDULES OF INVESTMENTS
Money Market 9
Intermediate 12
Bond 13
Participants 17
Municipal Finance Authority of British Columbia | 2019 Pooled Investment Funds 3
4 Municipal Finance Authority of British Columbia | 2019 Pooled Investment Funds
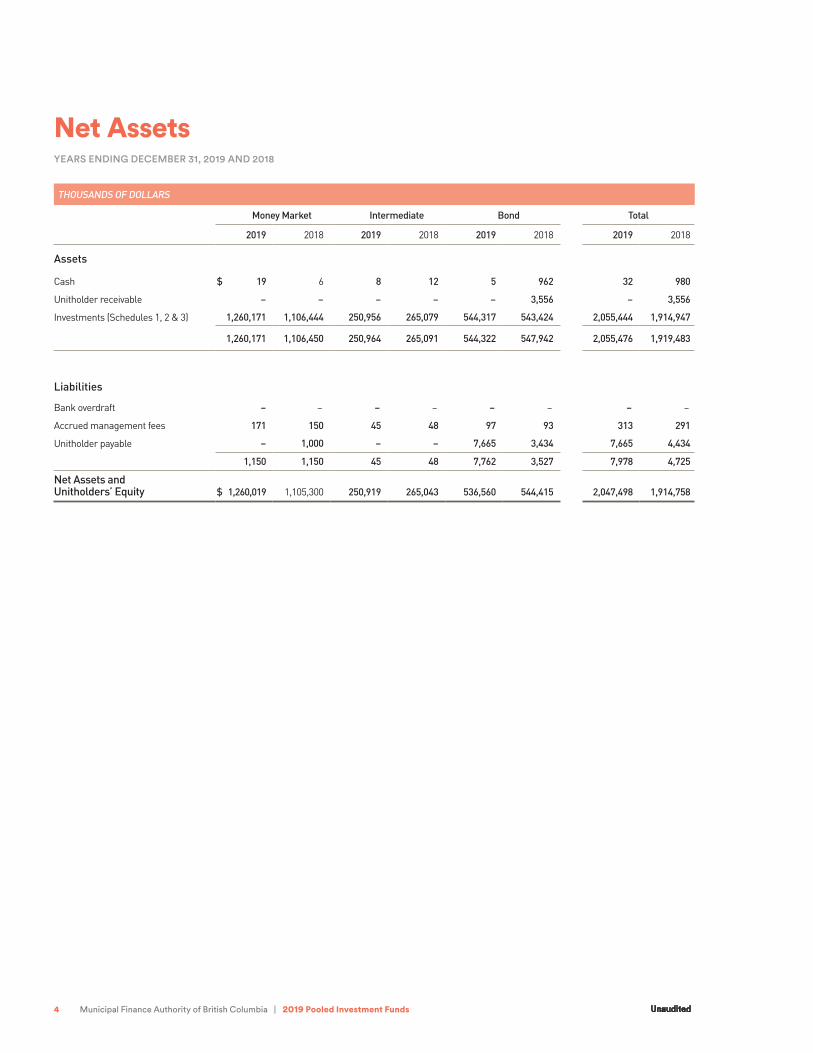
Net AssetsYEARS ENDING DECEMBER 31, 2019 AND 2018
THOUSANDS OF DOLLARS
Money Market Intermediate Bond Total
2019 2018 2019 2018 2019 2018 2019 2018
Assets
Cash $ 19 6 8 12 5 962 32 980
Unitholder receivable – – – – – 3,556 – 3,556
Investments (Schedules 1, 2 & 3) 1,260,171 1,106,444 250,956 265,079 544,317 543,424 2,055,444 1,914,947
1,260,171 1,106,450 250,964 265,091 544,322 547,942 2,055,476 1,919,483
Liabilities
Bank overdraft – – – – – – – –
Accrued management fees 171 150 45 48 97 93 313 291
Unitholder payable – 1,000 – – 7,665 3,434 7,665 4,434
1,150 1,150 45 48 7,762 3,527 7,978 4,725
Net Assets and Unitholders’ Equity $ 1,260,019 1,105,300 250,919 265,043 536,560 544,415 2,047,498 1,914,758
Unaudited
Municipal Finance Authority of British Columbia | 2019 Pooled Investment Funds 5
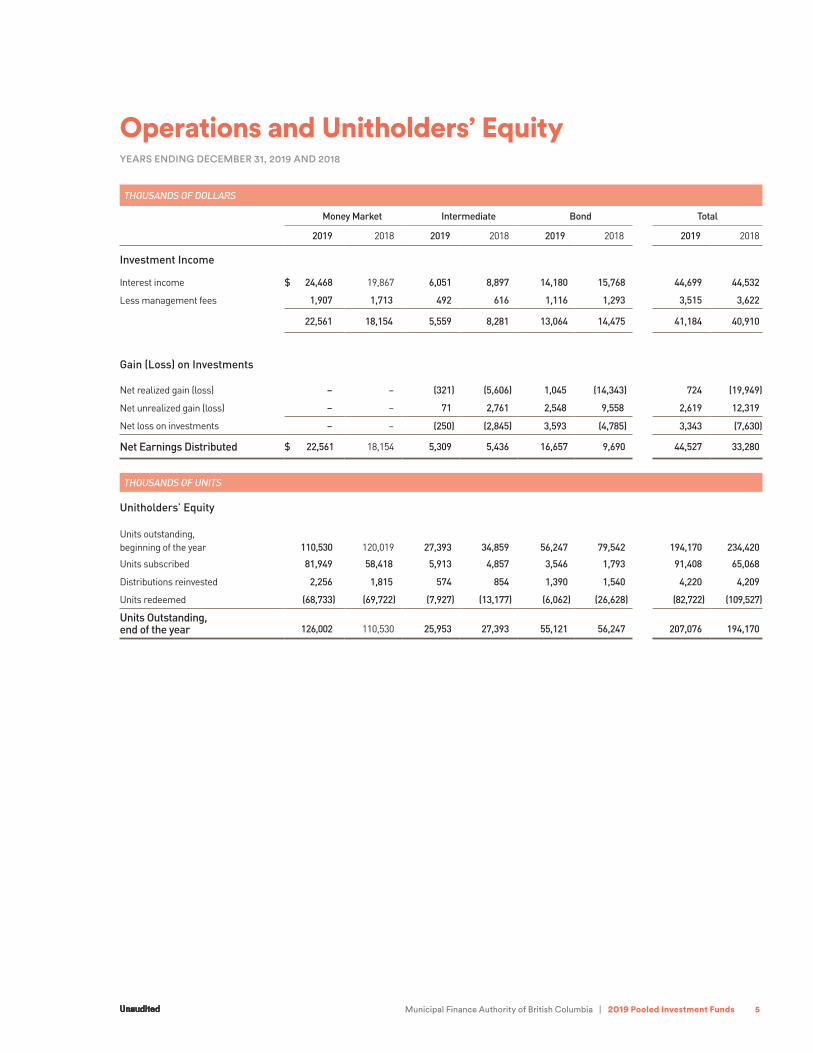
Operations and Unitholders’ EquityYEARS ENDING DECEMBER 31, 2019 AND 2018
THOUSANDS OF DOLLARS
Money Market Intermediate Bond Total
2019 2018 2019 2018 2019 2018 2019 2018
Investment Income
Interest income $ 24,468 19,867 6,051 8,897 14,180 15,768 44,699 44,532
Less management fees 1,907 1,713 492 616 1,116 1,293 3,515 3,622
22,561 18,154 5,559 8,281 13,064 14,475 41,184 40,910
Gain (Loss) on Investments
Net realized gain (loss) – – (321) (5,606) 1,045 (14,343) 724 (19,949)
Net unrealized gain (loss) – – 71 2,761 2,548 9,558 2,619 12,319
Net loss on investments – – (250) (2,845) 3,593 (4,785) 3,343 (7,630)
Net Earnings Distributed $ 22,561 18,154 5,309 5,436 16,657 9,690 44,527 33,280
THOUSANDS OF UNITS
Unitholders’ Equity
Units outstanding, beginning of the year 110,530 120,019 27,393 34,859 56,247 79,542 194,170 234,420
Units subscribed 81,949 58,418 5,913 4,857 3,546 1,793 91,408 65,068
Distributions reinvested 2,256 1,815 574 854 1,390 1,540 4,220 4,209
Units redeemed (68,733) (69,722) (7,927) (13,177) (6,062) (26,628) (82,722) (109,527)
Units Outstanding,end of the year 126,002 110,530 25,953 27,393 55,121 56,247 207,076 194,170
Unaudited
6 Municipal Finance Authority of British Columbia | 2019 Pooled Investment Funds
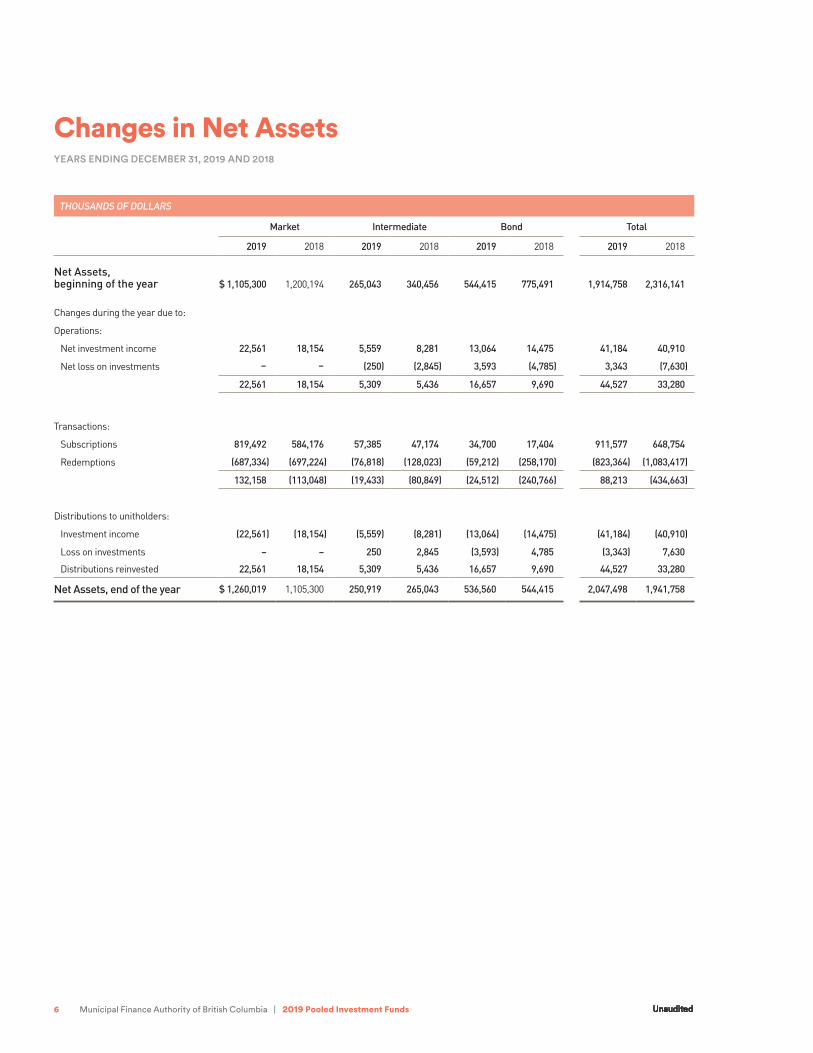
Changes in Net AssetsYEARS ENDING DECEMBER 31, 2019 AND 2018
THOUSANDS OF DOLLARS
Market Intermediate Bond Total
2019 2018 2019 2018 2019 2018 2019 2018
Net Assets,beginning of the year $ 1,105,300 1,200,194 265,043 340,456 544,415 775,491 1,914,758 2,316,141
Changes during the year due to:
Operations:
Net investment income 22,561 18,154 5,559 8,281 13,064 14,475 41,184 40,910
Net loss on investments – – (250) (2,845) 3,593 (4,785) 3,343 (7,630)
22,561 18,154 5,309 5,436 16,657 9,690 44,527 33,280
Transactions:
Subscriptions 819,492 584,176 57,385 47,174 34,700 17,404 911,577 648,754
Redemptions (687,334) (697,224) (76,818) (128,023) (59,212) (258,170) (823,364) (1,083,417)
132,158 (113,048) (19,433) (80,849) (24,512) (240,766) 88,213 (434,663)
Distributions to unitholders:
Investment income (22,561) (18,154) (5,559) (8,281) (13,064) (14,475) (41,184) (40,910)
Loss on investments – – 250 2,845 (3,593) 4,785 (3,343) 7,630
Distributions reinvested 22,561 18,154 5,309 5,436 16,657 9,690 44,527 33,280
Net Assets, end of the year $ 1,260,019 1,105,300 250,919 265,043 536,560 544,415 2,047,498 1,941,758
Unaudited
Municipal Finance Authority of British Columbia | 2019 Pooled Investment Funds 7
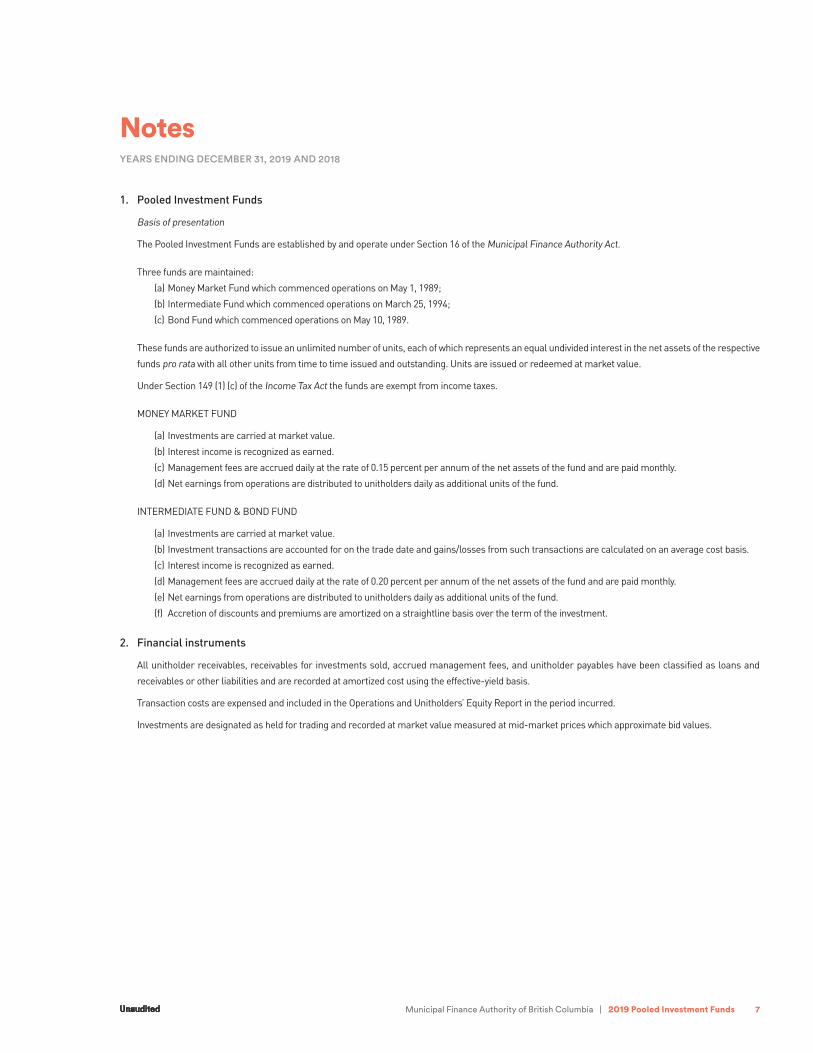
NotesYEARS ENDING DECEMBER 31, 2019 AND 2018
1. Pooled Investment Funds
Basis of presentation
The Pooled Investment Funds are established by and operate under Section 16 of the Municipal Finance Authority Act.
Three funds are maintained:
(a) Money Market Fund which commenced operations on May 1, 1989;
(b) Intermediate Fund which commenced operations on March 25, 1994;
(c) Bond Fund which commenced operations on May 10, 1989.
These funds are authorized to issue an unlimited number of units, each of which represents an equal undivided interest in the net assets of the respective
funds pro rata with all other units from time to time issued and outstanding. Units are issued or redeemed at market value.
Under Section 149 (1) (c) of the Income Tax Act the funds are exempt from income taxes.
MONEY MARKET FUND
(a) Investments are carried at market value.
(b) Interest income is recognized as earned.
(c) Management fees are accrued daily at the rate of 0.15 percent per annum of the net assets of the fund and are paid monthly.
(d) Net earnings from operations are distributed to unitholders daily as additional units of the fund.
INTERMEDIATE FUND & BOND FUND
(a) Investments are carried at market value.
(b) Investment transactions are accounted for on the trade date and gains/losses from such transactions are calculated on an average cost basis.
(c) Interest income is recognized as earned.
(d) Management fees are accrued daily at the rate of 0.20 percent per annum of the net assets of the fund and are paid monthly.
(e) Net earnings from operations are distributed to unitholders daily as additional units of the fund.
(f) Accretion of discounts and premiums are amortized on a straightline basis over the term of the investment.
2. Financial instruments
All unitholder receivables, receivables for investments sold, accrued management fees, and unitholder payables have been classified as loans and
receivables or other liabilities and are recorded at amortized cost using the effective-yield basis.
Transaction costs are expensed and included in the Operations and Unitholders’ Equity Report in the period incurred.
Investments are designated as held for trading and recorded at market value measured at mid-market prices which approximate bid values.
Unaudited

8 Municipal Finance Authority of British Columbia | 2019 Pooled Investment Funds
Notes continued
YEARS ENDING DECEMBER 31, 2019 AND 2018
3. Financial instruments risk
a. Risk management
Risk management is achieved through segregation of duties whereby the investment management decisions are undertaken by a professional
fund manager (Phillips, Hager & North Investment Management Ltd.), custody of the assets and accounting functions undertaken by a professional
custodian (CIBC Mellon Trust Company), and overall governance of the funds monitored by the Investment Advisory Committee comprised of
Trustees of the Municipal Finance Authority of BC. The Investment Advisory Committee establishes the investing guidelines, reviews the fund
manager’s compliance, and assesses performance in comparison to the FTSE TMX 30-Day Treasury Bill Index, the FTSE TMX 365-Day Treasury
Bill Index, and the FTSE TMX Short Term Index.
b. Liquidity risk
Liquidity risk is the risk that a portfolio may not be able to settle or meet its obligation on time or at a reasonable price.
Each portfolio is exposed to daily cash redemptions of units at the current Net Assets Value per unit at the option of the unitholder. The funds
invest the majority of their assets in securities that are traded in an active market and can be readily disposed of. In addition each Fund
retains sufficient cash and cash-equivalent positions to maintain liquidity.
As of December 31, 2019 the duration of each of the funds was as follows: 39 days for Money Market Fund, 1.0 years for the Intermediate
Fund, and 2.8 years for the Bond Fund.
c. Interest rate risk
Interest rate risk arises from the possibility that changes in interest rates will affect future cash flows or fair values of financial instruments.
The funds invest primarily in interest-bearing securities and are therefore susceptible to market rate fluctuations. The short duration of the investments
lessens the effect of changes in interest rates.
d. Credit risk
Credit risk is the risk that a counterparty to a financial instrument will fail to discharge its obligation or commitment.
The fund manager moderates risk through a conservative selection of securities and diversification within the parameters of the investment policy.
The investment portfolio is carried at fair value and represents the maximum credit risk exposure as at December 31, 2019.
e. Currency risk
The funds are not subject to currency risk. The functional currency is the Canadian dollar and all transactions are denominated in Canadian dollars.
Unaudited
Municipal Finance Authority of British Columbia | 2019 Pooled Investment Funds 9
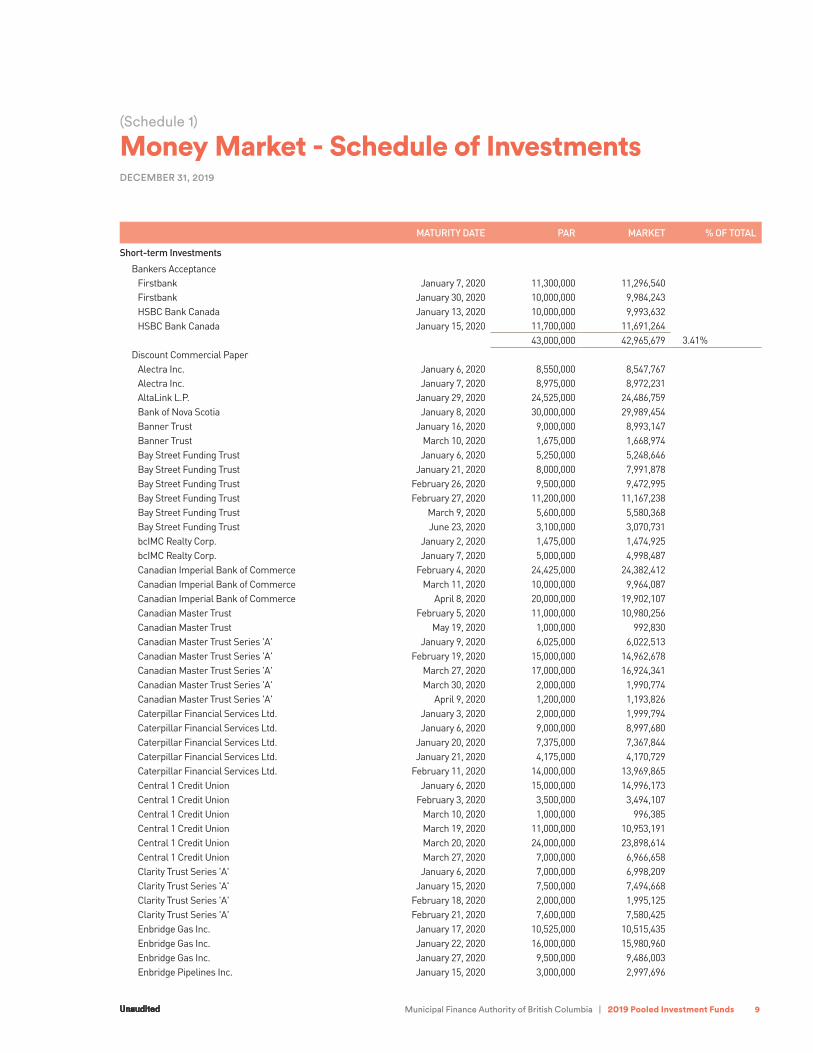
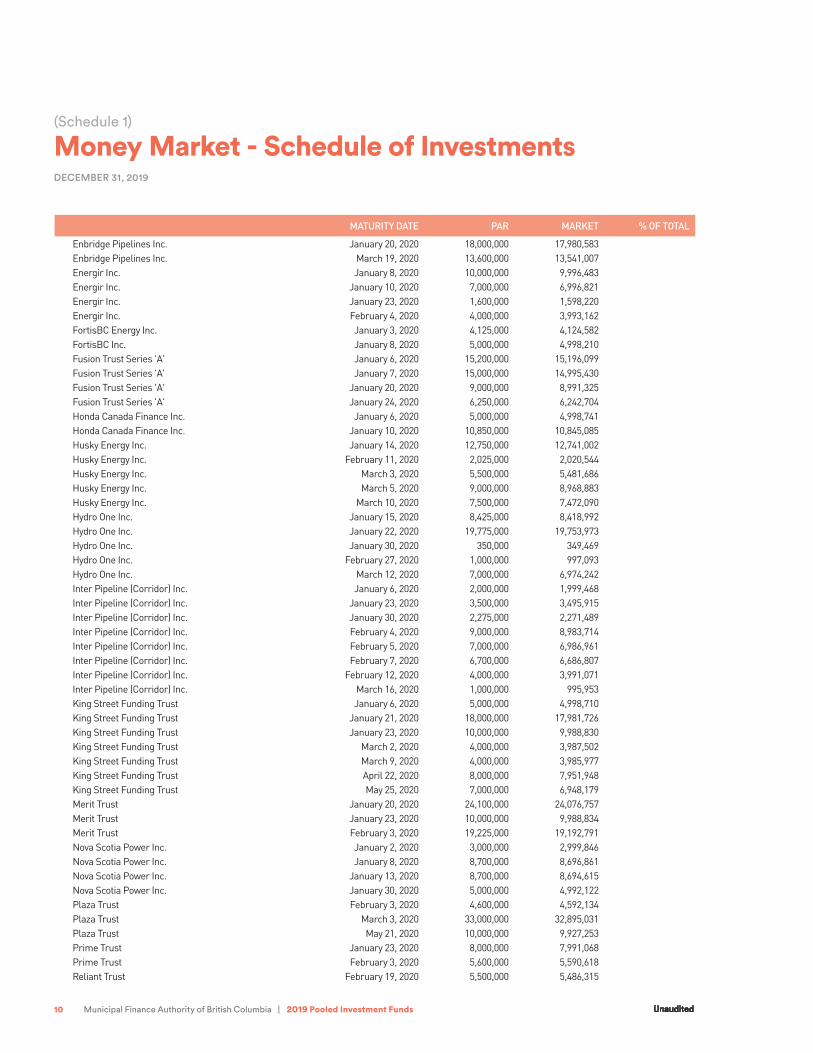
(Schedule 1)
Money Market - Schedule of InvestmentsDECEMBER 31, 2019
MATURITY DATE PAR MARKET % OF TOTAL
Short-term Investments
Bankers AcceptanceFirstbank January 7, 2020 11,300,000 11,296,540 Firstbank January 30, 2020 10,000,000 9,984,243 HSBC Bank Canada January 13, 2020 10,000,000 9,993,632 HSBC Bank Canada January 15, 2020 11,700,000 11,691,264
43,000,000 42,965,679 3.41% Discount Commercial Paper
Alectra Inc. January 6, 2020 8,550,000 8,547,767 Alectra Inc. January 7, 2020 8,975,000 8,972,231 AltaLink L.P. January 29, 2020 24,525,000 24,486,759 Bank of Nova Scotia January 8, 2020 30,000,000 29,989,454 Banner Trust January 16, 2020 9,000,000 8,993,147 Banner Trust March 10, 2020 1,675,000 1,668,974 Bay Street Funding Trust January 6, 2020 5,250,000 5,248,646 Bay Street Funding Trust January 21, 2020 8,000,000 7,991,878 Bay Street Funding Trust February 26, 2020 9,500,000 9,472,995 Bay Street Funding Trust February 27, 2020 11,200,000 11,167,238 Bay Street Funding Trust March 9, 2020 5,600,000 5,580,368 Bay Street Funding Trust June 23, 2020 3,100,000 3,070,731 bcIMC Realty Corp. January 2, 2020 1,475,000 1,474,925 bcIMC Realty Corp. January 7, 2020 5,000,000 4,998,487 Canadian Imperial Bank of Commerce February 4, 2020 24,425,000 24,382,412 Canadian Imperial Bank of Commerce March 11, 2020 10,000,000 9,964,087 Canadian Imperial Bank of Commerce April 8, 2020 20,000,000 19,902,107 Canadian Master Trust February 5, 2020 11,000,000 10,980,256 Canadian Master Trust May 19, 2020 1,000,000 992,830 Canadian Master Trust Series 'A' January 9, 2020 6,025,000 6,022,513 Canadian Master Trust Series 'A' February 19, 2020 15,000,000 14,962,678 Canadian Master Trust Series 'A' March 27, 2020 17,000,000 16,924,341 Canadian Master Trust Series 'A' March 30, 2020 2,000,000 1,990,774 Canadian Master Trust Series 'A' April 9, 2020 1,200,000 1,193,826 Caterpillar Financial Services Ltd. January 3, 2020 2,000,000 1,999,794 Caterpillar Financial Services Ltd. January 6, 2020 9,000,000 8,997,680 Caterpillar Financial Services Ltd. January 20, 2020 7,375,000 7,367,844 Caterpillar Financial Services Ltd. January 21, 2020 4,175,000 4,170,729 Caterpillar Financial Services Ltd. February 11, 2020 14,000,000 13,969,865 Central 1 Credit Union January 6, 2020 15,000,000 14,996,173 Central 1 Credit Union February 3, 2020 3,500,000 3,494,107 Central 1 Credit Union March 10, 2020 1,000,000 996,385 Central 1 Credit Union March 19, 2020 11,000,000 10,953,191 Central 1 Credit Union March 20, 2020 24,000,000 23,898,614 Central 1 Credit Union March 27, 2020 7,000,000 6,966,658 Clarity Trust Series 'A' January 6, 2020 7,000,000 6,998,209 Clarity Trust Series 'A' January 15, 2020 7,500,000 7,494,668 Clarity Trust Series 'A' February 18, 2020 2,000,000 1,995,125 Clarity Trust Series 'A' February 21, 2020 7,600,000 7,580,425 Enbridge Gas Inc. January 17, 2020 10,525,000 10,515,435 Enbridge Gas Inc. January 22, 2020 16,000,000 15,980,960 Enbridge Gas Inc. January 27, 2020 9,500,000 9,486,003 Enbridge Pipelines Inc. January 15, 2020 3,000,000 2,997,696
Unaudited
10 Municipal Finance Authority of British Columbia | 2019 Pooled Investment Funds
(Schedule 1)
Money Market - Schedule of InvestmentsDECEMBER 31, 2019
MATURITY DATE PAR MARKET % OF TOTAL
Enbridge Pipelines Inc. January 20, 2020 18,000,000 17,980,583 Enbridge Pipelines Inc. March 19, 2020 13,600,000 13,541,007 Energir Inc. January 8, 2020 10,000,000 9,996,483 Energir Inc. January 10, 2020 7,000,000 6,996,821 Energir Inc. January 23, 2020 1,600,000 1,598,220 Energir Inc. February 4, 2020 4,000,000 3,993,162 FortisBC Energy Inc. January 3, 2020 4,125,000 4,124,582 FortisBC Inc. January 8, 2020 5,000,000 4,998,210 Fusion Trust Series 'A' January 6, 2020 15,200,000 15,196,099 Fusion Trust Series 'A' January 7, 2020 15,000,000 14,995,430 Fusion Trust Series 'A' January 20, 2020 9,000,000 8,991,325 Fusion Trust Series 'A' January 24, 2020 6,250,000 6,242,704 Honda Canada Finance Inc. January 6, 2020 5,000,000 4,998,741 Honda Canada Finance Inc. January 10, 2020 10,850,000 10,845,085 Husky Energy Inc. January 14, 2020 12,750,000 12,741,002 Husky Energy Inc. February 11, 2020 2,025,000 2,020,544 Husky Energy Inc. March 3, 2020 5,500,000 5,481,686 Husky Energy Inc. March 5, 2020 9,000,000 8,968,883 Husky Energy Inc. March 10, 2020 7,500,000 7,472,090 Hydro One Inc. January 15, 2020 8,425,000 8,418,992 Hydro One Inc. January 22, 2020 19,775,000 19,753,973 Hydro One Inc. January 30, 2020 350,000 349,469 Hydro One Inc. February 27, 2020 1,000,000 997,093 Hydro One Inc. March 12, 2020 7,000,000 6,974,242 Inter Pipeline (Corridor) Inc. January 6, 2020 2,000,000 1,999,468 Inter Pipeline (Corridor) Inc. January 23, 2020 3,500,000 3,495,915 Inter Pipeline (Corridor) Inc. January 30, 2020 2,275,000 2,271,489 Inter Pipeline (Corridor) Inc. February 4, 2020 9,000,000 8,983,714 Inter Pipeline (Corridor) Inc. February 5, 2020 7,000,000 6,986,961 Inter Pipeline (Corridor) Inc. February 7, 2020 6,700,000 6,686,807 Inter Pipeline (Corridor) Inc. February 12, 2020 4,000,000 3,991,071 Inter Pipeline (Corridor) Inc. March 16, 2020 1,000,000 995,953 King Street Funding Trust January 6, 2020 5,000,000 4,998,710 King Street Funding Trust January 21, 2020 18,000,000 17,981,726 King Street Funding Trust January 23, 2020 10,000,000 9,988,830 King Street Funding Trust March 2, 2020 4,000,000 3,987,502 King Street Funding Trust March 9, 2020 4,000,000 3,985,977 King Street Funding Trust April 22, 2020 8,000,000 7,951,948 King Street Funding Trust May 25, 2020 7,000,000 6,948,179 Merit Trust January 20, 2020 24,100,000 24,076,757 Merit Trust January 23, 2020 10,000,000 9,988,834 Merit Trust February 3, 2020 19,225,000 19,192,791 Nova Scotia Power Inc. January 2, 2020 3,000,000 2,999,846 Nova Scotia Power Inc. January 8, 2020 8,700,000 8,696,861 Nova Scotia Power Inc. January 13, 2020 8,700,000 8,694,615 Nova Scotia Power Inc. January 30, 2020 5,000,000 4,992,122 Plaza Trust February 3, 2020 4,600,000 4,592,134 Plaza Trust March 3, 2020 33,000,000 32,895,031 Plaza Trust May 21, 2020 10,000,000 9,927,253 Prime Trust January 23, 2020 8,000,000 7,991,068 Prime Trust February 3, 2020 5,600,000 5,590,618 Reliant Trust February 19, 2020 5,500,000 5,486,315
Unaudited
Municipal Finance Authority of British Columbia | 2019 Pooled Investment Funds 11
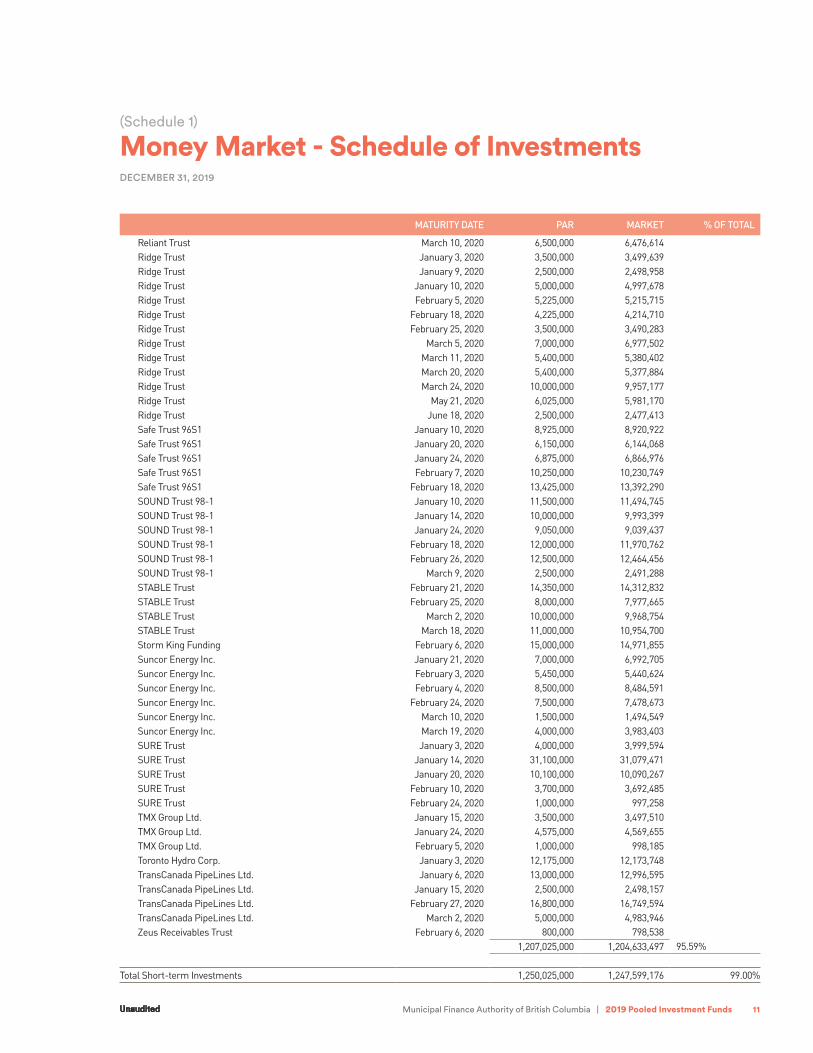
(Schedule 1)
Money Market - Schedule of InvestmentsDECEMBER 31, 2019
MATURITY DATE PAR MARKET % OF TOTAL
Reliant Trust March 10, 2020 6,500,000 6,476,614 Ridge Trust January 3, 2020 3,500,000 3,499,639 Ridge Trust January 9, 2020 2,500,000 2,498,958 Ridge Trust January 10, 2020 5,000,000 4,997,678 Ridge Trust February 5, 2020 5,225,000 5,215,715 Ridge Trust February 18, 2020 4,225,000 4,214,710 Ridge Trust February 25, 2020 3,500,000 3,490,283 Ridge Trust March 5, 2020 7,000,000 6,977,502 Ridge Trust March 11, 2020 5,400,000 5,380,402 Ridge Trust March 20, 2020 5,400,000 5,377,884 Ridge Trust March 24, 2020 10,000,000 9,957,177 Ridge Trust May 21, 2020 6,025,000 5,981,170 Ridge Trust June 18, 2020 2,500,000 2,477,413 Safe Trust 96S1 January 10, 2020 8,925,000 8,920,922 Safe Trust 96S1 January 20, 2020 6,150,000 6,144,068 Safe Trust 96S1 January 24, 2020 6,875,000 6,866,976 Safe Trust 96S1 February 7, 2020 10,250,000 10,230,749 Safe Trust 96S1 February 18, 2020 13,425,000 13,392,290 SOUND Trust 98-1 January 10, 2020 11,500,000 11,494,745 SOUND Trust 98-1 January 14, 2020 10,000,000 9,993,399 SOUND Trust 98-1 January 24, 2020 9,050,000 9,039,437 SOUND Trust 98-1 February 18, 2020 12,000,000 11,970,762 SOUND Trust 98-1 February 26, 2020 12,500,000 12,464,456 SOUND Trust 98-1 March 9, 2020 2,500,000 2,491,288 STABLE Trust February 21, 2020 14,350,000 14,312,832 STABLE Trust February 25, 2020 8,000,000 7,977,665 STABLE Trust March 2, 2020 10,000,000 9,968,754 STABLE Trust March 18, 2020 11,000,000 10,954,700 Storm King Funding February 6, 2020 15,000,000 14,971,855 Suncor Energy Inc. January 21, 2020 7,000,000 6,992,705 Suncor Energy Inc. February 3, 2020 5,450,000 5,440,624 Suncor Energy Inc. February 4, 2020 8,500,000 8,484,591 Suncor Energy Inc. February 24, 2020 7,500,000 7,478,673 Suncor Energy Inc. March 10, 2020 1,500,000 1,494,549 Suncor Energy Inc. March 19, 2020 4,000,000 3,983,403 SURE Trust January 3, 2020 4,000,000 3,999,594 SURE Trust January 14, 2020 31,100,000 31,079,471 SURE Trust January 20, 2020 10,100,000 10,090,267 SURE Trust February 10, 2020 3,700,000 3,692,485 SURE Trust February 24, 2020 1,000,000 997,258 TMX Group Ltd. January 15, 2020 3,500,000 3,497,510 TMX Group Ltd. January 24, 2020 4,575,000 4,569,655 TMX Group Ltd. February 5, 2020 1,000,000 998,185 Toronto Hydro Corp. January 3, 2020 12,175,000 12,173,748 TransCanada PipeLines Ltd. January 6, 2020 13,000,000 12,996,595 TransCanada PipeLines Ltd. January 15, 2020 2,500,000 2,498,157 TransCanada PipeLines Ltd. February 27, 2020 16,800,000 16,749,594 TransCanada PipeLines Ltd. March 2, 2020 5,000,000 4,983,946 Zeus Receivables Trust February 6, 2020 800,000 798,538
1,207,025,000 1,204,633,497 95.59%
Total Short-term Investments 1,250,025,000 1,247,599,176 99.00%
Unaudited
12 Municipal Finance Authority of British Columbia | 2019 Pooled Investment Funds
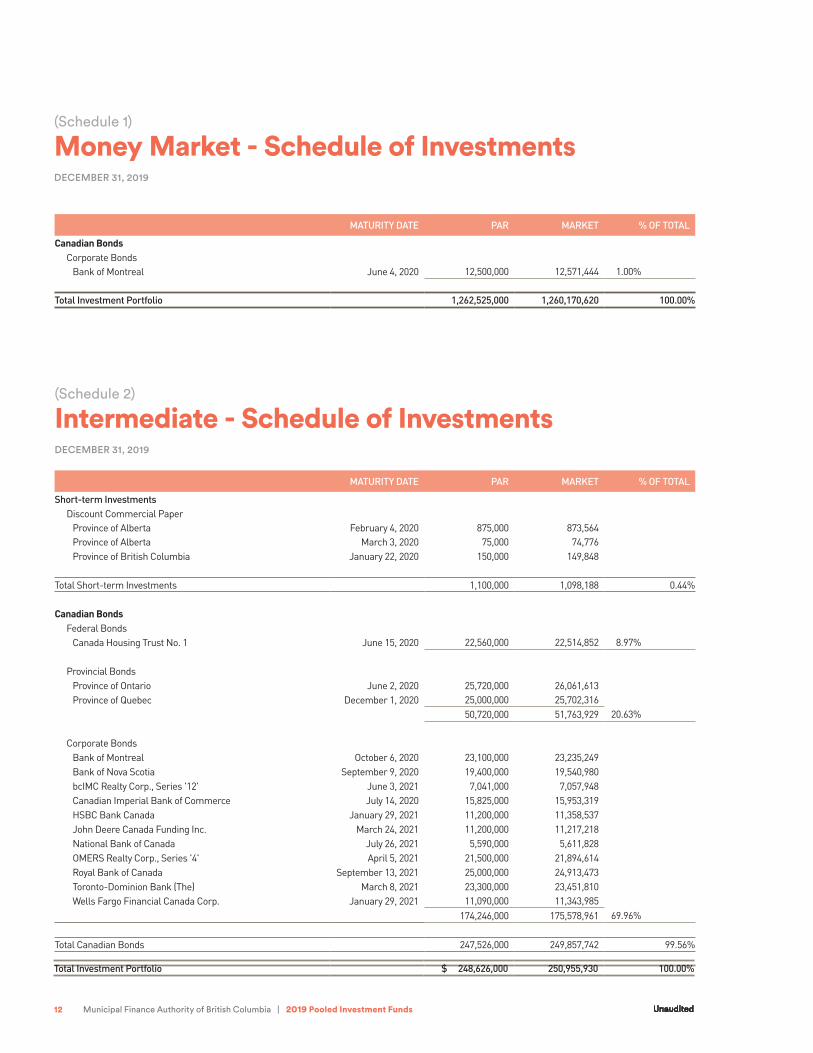
(Schedule 1)
Money Market - Schedule of InvestmentsDECEMBER 31, 2019
MATURITY DATE PAR MARKET % OF TOTAL
Canadian Bonds Corporate Bonds
Bank of Montreal June 4, 2020 12,500,000 12,571,444 1.00%
Total Investment Portfolio 1,262,525,000 1,260,170,620 100.00%
(Schedule 2)
Intermediate - Schedule of InvestmentsDECEMBER 31, 2019
MATURITY DATE PAR MARKET % OF TOTAL
Short-term Investments Discount Commercial Paper
Province of Alberta February 4, 2020 875,000 873,564Province of Alberta March 3, 2020 75,000 74,776Province of British Columbia January 22, 2020 150,000 149,848
Total Short-term Investments 1,100,000 1,098,188 0.44%
Canadian Bonds Federal Bonds
Canada Housing Trust No. 1 June 15, 2020 22,560,000 22,514,852 8.97%
Provincial BondsProvince of Ontario June 2, 2020 25,720,000 26,061,613 Province of Quebec December 1, 2020 25,000,000 25,702,316
50,720,000 51,763,929 20.63%
Corporate BondsBank of Montreal October 6, 2020 23,100,000 23,235,249 Bank of Nova Scotia September 9, 2020 19,400,000 19,540,980 bcIMC Realty Corp., Series '12' June 3, 2021 7,041,000 7,057,948 Canadian Imperial Bank of Commerce July 14, 2020 15,825,000 15,953,319 HSBC Bank Canada January 29, 2021 11,200,000 11,358,537 John Deere Canada Funding Inc. March 24, 2021 11,200,000 11,217,218 National Bank of Canada July 26, 2021 5,590,000 5,611,828 OMERS Realty Corp., Series '4' April 5, 2021 21,500,000 21,894,614 Royal Bank of Canada September 13, 2021 25,000,000 24,913,473 Toronto-Dominion Bank (The) March 8, 2021 23,300,000 23,451,810 Wells Fargo Financial Canada Corp. January 29, 2021 11,090,000 11,343,985
174,246,000 175,578,961 69.96%
Total Canadian Bonds 247,526,000 249,857,742 99.56%
Total Investment Portfolio $ 248,626,000 250,955,930 100.00%
Unaudited
Municipal Finance Authority of British Columbia | 2019 Pooled Investment Funds 13
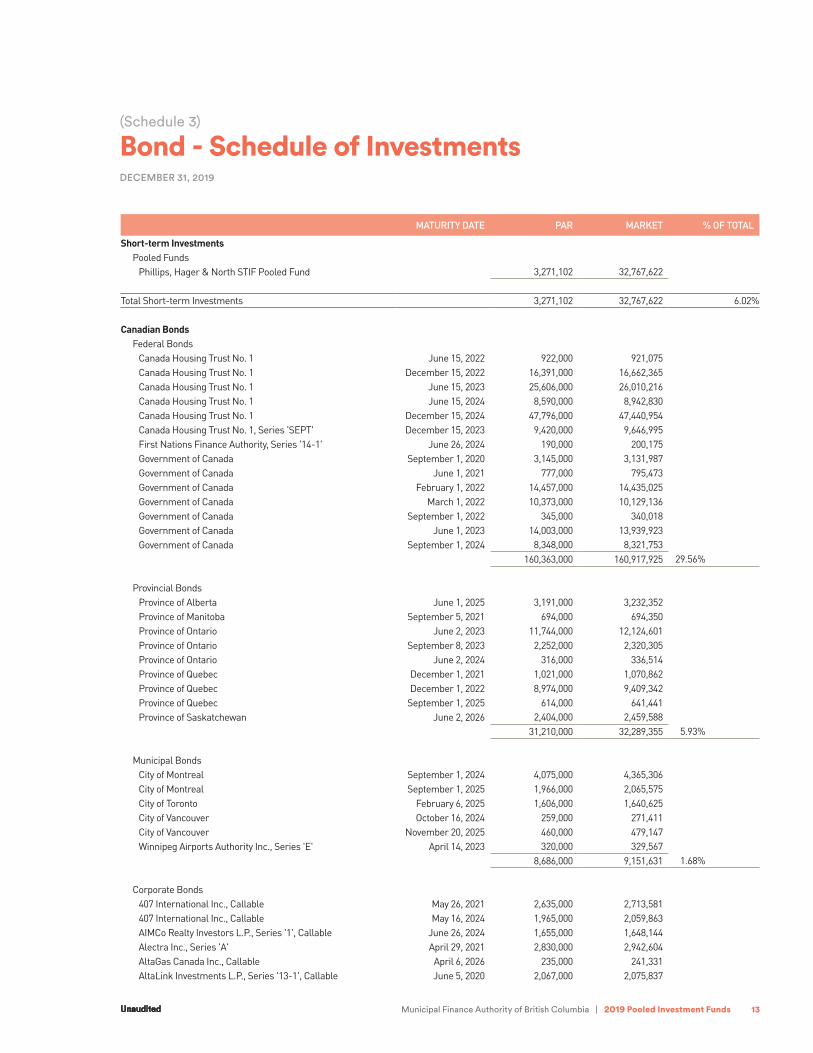
(Schedule 3)
Bond - Schedule of InvestmentsDECEMBER 31, 2019
MATURITY DATE PAR MARKET % OF TOTAL
Short-term Investments Pooled Funds
Phillips, Hager & North STIF Pooled Fund 3,271,102 32,767,622
Total Short-term Investments 3,271,102 32,767,622 6.02%
Canadian Bonds Federal Bonds
Canada Housing Trust No. 1 June 15, 2022 922,000 921,075 Canada Housing Trust No. 1 December 15, 2022 16,391,000 16,662,365 Canada Housing Trust No. 1 June 15, 2023 25,606,000 26,010,216 Canada Housing Trust No. 1 June 15, 2024 8,590,000 8,942,830 Canada Housing Trust No. 1 December 15, 2024 47,796,000 47,440,954 Canada Housing Trust No. 1, Series 'SEPT' December 15, 2023 9,420,000 9,646,995 First Nations Finance Authority, Series '14-1' June 26, 2024 190,000 200,175 Government of Canada September 1, 2020 3,145,000 3,131,987 Government of Canada June 1, 2021 777,000 795,473 Government of Canada February 1, 2022 14,457,000 14,435,025 Government of Canada March 1, 2022 10,373,000 10,129,136 Government of Canada September 1, 2022 345,000 340,018 Government of Canada June 1, 2023 14,003,000 13,939,923 Government of Canada September 1, 2024 8,348,000 8,321,753
160,363,000 160,917,925 29.56%
Provincial BondsProvince of Alberta June 1, 2025 3,191,000 3,232,352 Province of Manitoba September 5, 2021 694,000 694,350 Province of Ontario June 2, 2023 11,744,000 12,124,601 Province of Ontario September 8, 2023 2,252,000 2,320,305 Province of Ontario June 2, 2024 316,000 336,514 Province of Quebec December 1, 2021 1,021,000 1,070,862 Province of Quebec December 1, 2022 8,974,000 9,409,342 Province of Quebec September 1, 2025 614,000 641,441 Province of Saskatchewan June 2, 2026 2,404,000 2,459,588
31,210,000 32,289,355 5.93%
Municipal BondsCity of Montreal September 1, 2024 4,075,000 4,365,306 City of Montreal September 1, 2025 1,966,000 2,065,575 City of Toronto February 6, 2025 1,606,000 1,640,625 City of Vancouver October 16, 2024 259,000 271,411 City of Vancouver November 20, 2025 460,000 479,147 Winnipeg Airports Authority Inc., Series 'E' April 14, 2023 320,000 329,567
8,686,000 9,151,631 1.68%
Corporate Bonds407 International Inc., Callable May 26, 2021 2,635,000 2,713,581 407 International Inc., Callable May 16, 2024 1,965,000 2,059,863 AIMCo Realty Investors L.P., Series '1', Callable June 26, 2024 1,655,000 1,648,144 Alectra Inc., Series 'A' April 29, 2021 2,830,000 2,942,604 AltaGas Canada Inc., Callable April 6, 2026 235,000 241,331 AltaLink Investments L.P., Series '13-1', Callable June 5, 2020 2,067,000 2,075,837
Unaudited
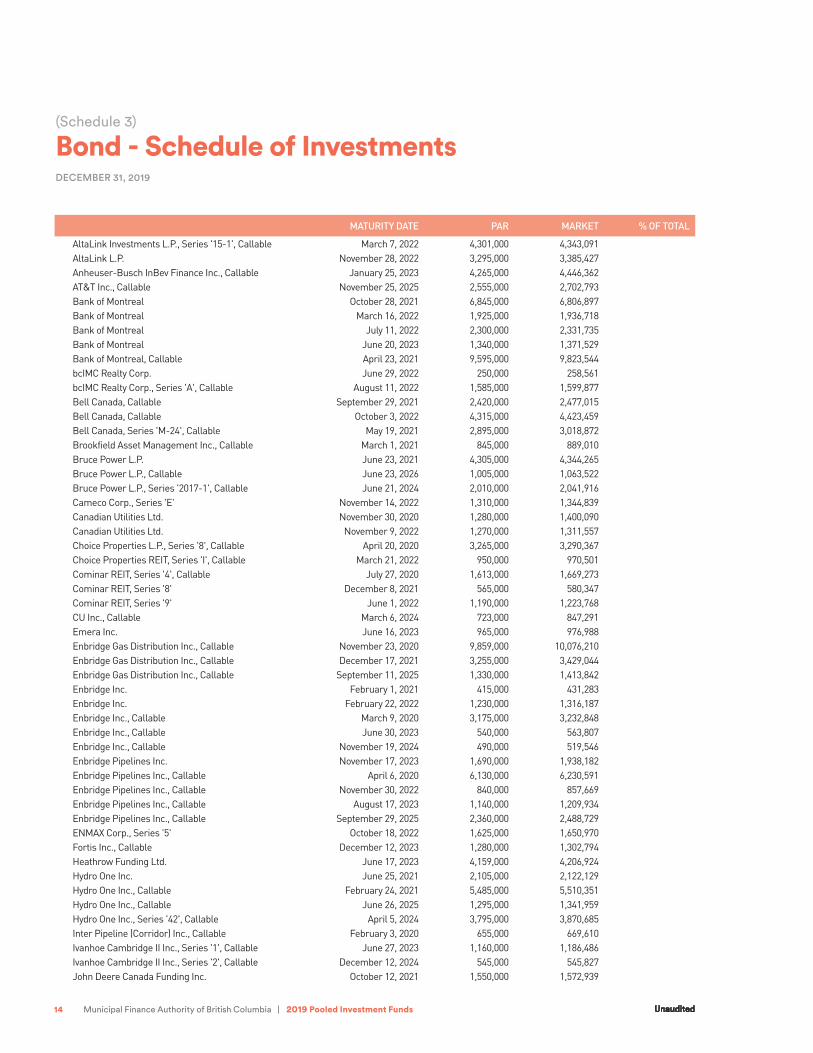
14 Municipal Finance Authority of British Columbia | 2019 Pooled Investment Funds
(Schedule 3)
Bond - Schedule of InvestmentsDECEMBER 31, 2019
MATURITY DATE PAR MARKET % OF TOTAL
AltaLink Investments L.P., Series '15-1', Callable March 7, 2022 4,301,000 4,343,091 AltaLink L.P. November 28, 2022 3,295,000 3,385,427 Anheuser-Busch InBev Finance Inc., Callable January 25, 2023 4,265,000 4,446,362 AT&T Inc., Callable November 25, 2025 2,555,000 2,702,793 Bank of Montreal October 28, 2021 6,845,000 6,806,897 Bank of Montreal March 16, 2022 1,925,000 1,936,718 Bank of Montreal July 11, 2022 2,300,000 2,331,735 Bank of Montreal June 20, 2023 1,340,000 1,371,529 Bank of Montreal, Callable April 23, 2021 9,595,000 9,823,544 bcIMC Realty Corp. June 29, 2022 250,000 258,561 bcIMC Realty Corp., Series 'A', Callable August 11, 2022 1,585,000 1,599,877 Bell Canada, Callable September 29, 2021 2,420,000 2,477,015 Bell Canada, Callable October 3, 2022 4,315,000 4,423,459 Bell Canada, Series 'M-24', Callable May 19, 2021 2,895,000 3,018,872 Brookfield Asset Management Inc., Callable March 1, 2021 845,000 889,010 Bruce Power L.P. June 23, 2021 4,305,000 4,344,265 Bruce Power L.P., Callable June 23, 2026 1,005,000 1,063,522 Bruce Power L.P., Series '2017-1', Callable June 21, 2024 2,010,000 2,041,916 Cameco Corp., Series 'E' November 14, 2022 1,310,000 1,344,839 Canadian Utilities Ltd. November 30, 2020 1,280,000 1,400,090 Canadian Utilities Ltd. November 9, 2022 1,270,000 1,311,557 Choice Properties L.P., Series '8', Callable April 20, 2020 3,265,000 3,290,367 Choice Properties REIT, Series 'I', Callable March 21, 2022 950,000 970,501 Cominar REIT, Series '4', Callable July 27, 2020 1,613,000 1,669,273 Cominar REIT, Series '8' December 8, 2021 565,000 580,347 Cominar REIT, Series '9' June 1, 2022 1,190,000 1,223,768 CU Inc., Callable March 6, 2024 723,000 847,291 Emera Inc. June 16, 2023 965,000 976,988 Enbridge Gas Distribution Inc., Callable November 23, 2020 9,859,000 10,076,210 Enbridge Gas Distribution Inc., Callable December 17, 2021 3,255,000 3,429,044 Enbridge Gas Distribution Inc., Callable September 11, 2025 1,330,000 1,413,842 Enbridge Inc. February 1, 2021 415,000 431,283 Enbridge Inc. February 22, 2022 1,230,000 1,316,187 Enbridge Inc., Callable March 9, 2020 3,175,000 3,232,848 Enbridge Inc., Callable June 30, 2023 540,000 563,807 Enbridge Inc., Callable November 19, 2024 490,000 519,546 Enbridge Pipelines Inc. November 17, 2023 1,690,000 1,938,182 Enbridge Pipelines Inc., Callable April 6, 2020 6,130,000 6,230,591 Enbridge Pipelines Inc., Callable November 30, 2022 840,000 857,669 Enbridge Pipelines Inc., Callable August 17, 2023 1,140,000 1,209,934 Enbridge Pipelines Inc., Callable September 29, 2025 2,360,000 2,488,729 ENMAX Corp., Series '5' October 18, 2022 1,625,000 1,650,970 Fortis Inc., Callable December 12, 2023 1,280,000 1,302,794 Heathrow Funding Ltd. June 17, 2023 4,159,000 4,206,924 Hydro One Inc. June 25, 2021 2,105,000 2,122,129 Hydro One Inc., Callable February 24, 2021 5,485,000 5,510,351 Hydro One Inc., Callable June 26, 2025 1,295,000 1,341,959 Hydro One Inc., Series '42', Callable April 5, 2024 3,795,000 3,870,685 Inter Pipeline (Corridor) Inc., Callable February 3, 2020 655,000 669,610 Ivanhoe Cambridge II Inc., Series '1', Callable June 27, 2023 1,160,000 1,186,486 Ivanhoe Cambridge II Inc., Series '2', Callable December 12, 2024 545,000 545,827 John Deere Canada Funding Inc. October 12, 2021 1,550,000 1,572,939
Unaudited
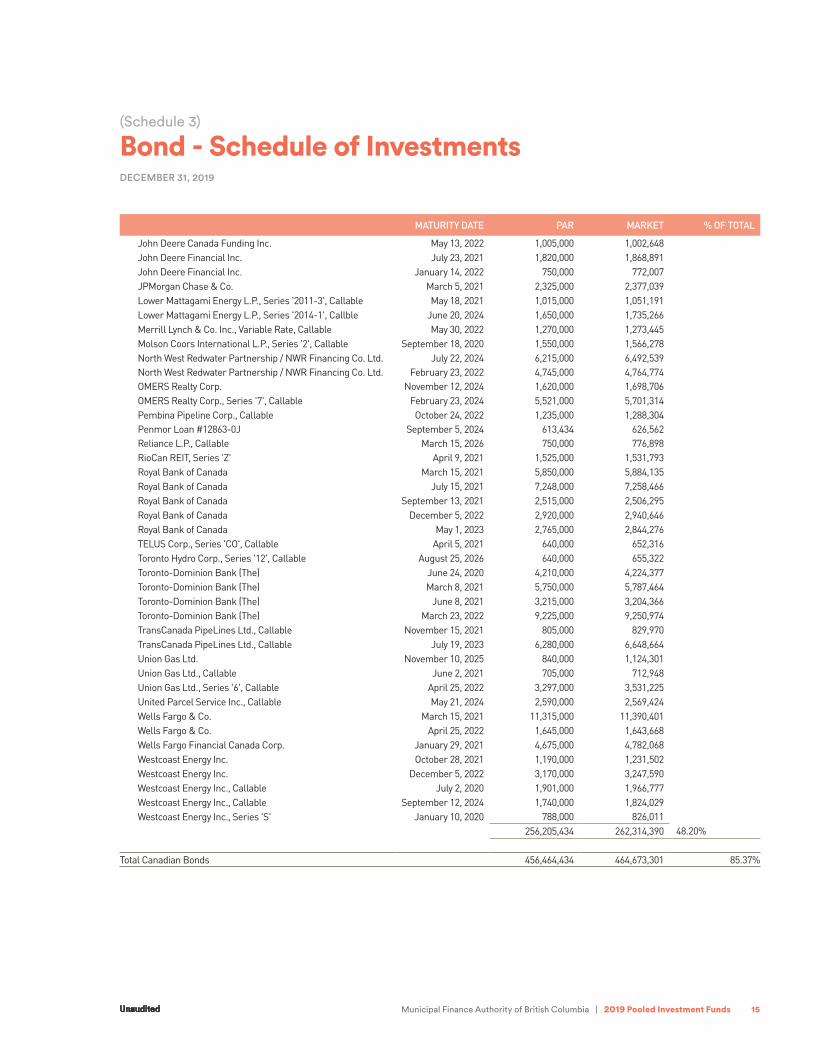
Municipal Finance Authority of British Columbia | 2019 Pooled Investment Funds 15
MATURITY DATE PAR MARKET % OF TOTAL
John Deere Canada Funding Inc. May 13, 2022 1,005,000 1,002,648John Deere Financial Inc. July 23, 2021 1,820,000 1,868,891John Deere Financial Inc. January 14, 2022 750,000 772,007JPMorgan Chase & Co. March 5, 2021 2,325,000 2,377,039Lower Mattagami Energy L.P., Series '2011-3', Callable May 18, 2021 1,015,000 1,051,191Lower Mattagami Energy L.P., Series '2014-1', Callble June 20, 2024 1,650,000 1,735,266Merrill Lynch & Co. Inc., Variable Rate, Callable May 30, 2022 1,270,000 1,273,445Molson Coors International L.P., Series '2', Callable September 18, 2020 1,550,000 1,566,278North West Redwater Partnership / NWR Financing Co. Ltd. July 22, 2024 6,215,000 6,492,539North West Redwater Partnership / NWR Financing Co. Ltd. February 23, 2022 4,745,000 4,764,774OMERS Realty Corp. November 12, 2024 1,620,000 1,698,706OMERS Realty Corp., Series '7', Callable February 23, 2024 5,521,000 5,701,314Pembina Pipeline Corp., Callable October 24, 2022 1,235,000 1,288,304Penmor Loan #12863-0J September 5, 2024 613,434 626,562Reliance L.P., Callable March 15, 2026 750,000 776,898RioCan REIT, Series 'Z' April 9, 2021 1,525,000 1,531,793Royal Bank of Canada March 15, 2021 5,850,000 5,884,135Royal Bank of Canada July 15, 2021 7,248,000 7,258,466Royal Bank of Canada September 13, 2021 2,515,000 2,506,295Royal Bank of Canada December 5, 2022 2,920,000 2,940,646Royal Bank of Canada May 1, 2023 2,765,000 2,844,276TELUS Corp., Series 'CO', Callable April 5, 2021 640,000 652,316Toronto Hydro Corp., Series '12', Callable August 25, 2026 640,000 655,322Toronto-Dominion Bank (The) June 24, 2020 4,210,000 4,224,377Toronto-Dominion Bank (The) March 8, 2021 5,750,000 5,787,464Toronto-Dominion Bank (The) June 8, 2021 3,215,000 3,204,366Toronto-Dominion Bank (The) March 23, 2022 9,225,000 9,250,974TransCanada PipeLines Ltd., Callable November 15, 2021 805,000 829,970TransCanada PipeLines Ltd., Callable July 19, 2023 6,280,000 6,648,664Union Gas Ltd. November 10, 2025 840,000 1,124,301Union Gas Ltd., Callable June 2, 2021 705,000 712,948Union Gas Ltd., Series '6', Callable April 25, 2022 3,297,000 3,531,225United Parcel Service Inc., Callable May 21, 2024 2,590,000 2,569,424Wells Fargo & Co. March 15, 2021 11,315,000 11,390,401Wells Fargo & Co. April 25, 2022 1,645,000 1,643,668Wells Fargo Financial Canada Corp. January 29, 2021 4,675,000 4,782,068Westcoast Energy Inc. October 28, 2021 1,190,000 1,231,502Westcoast Energy Inc. December 5, 2022 3,170,000 3,247,590Westcoast Energy Inc., Callable July 2, 2020 1,901,000 1,966,777Westcoast Energy Inc., Callable September 12, 2024 1,740,000 1,824,029Westcoast Energy Inc., Series 'S' January 10, 2020 788,000 826,011
256,205,434 262,314,390 48.20%
Total Canadian Bonds 456,464,434 464,673,301 85.37%
(Schedule 3)
Bond - Schedule of InvestmentsDECEMBER 31, 2019
Unaudited
16 Municipal Finance Authority of British Columbia | 2019 Pooled Investment Funds
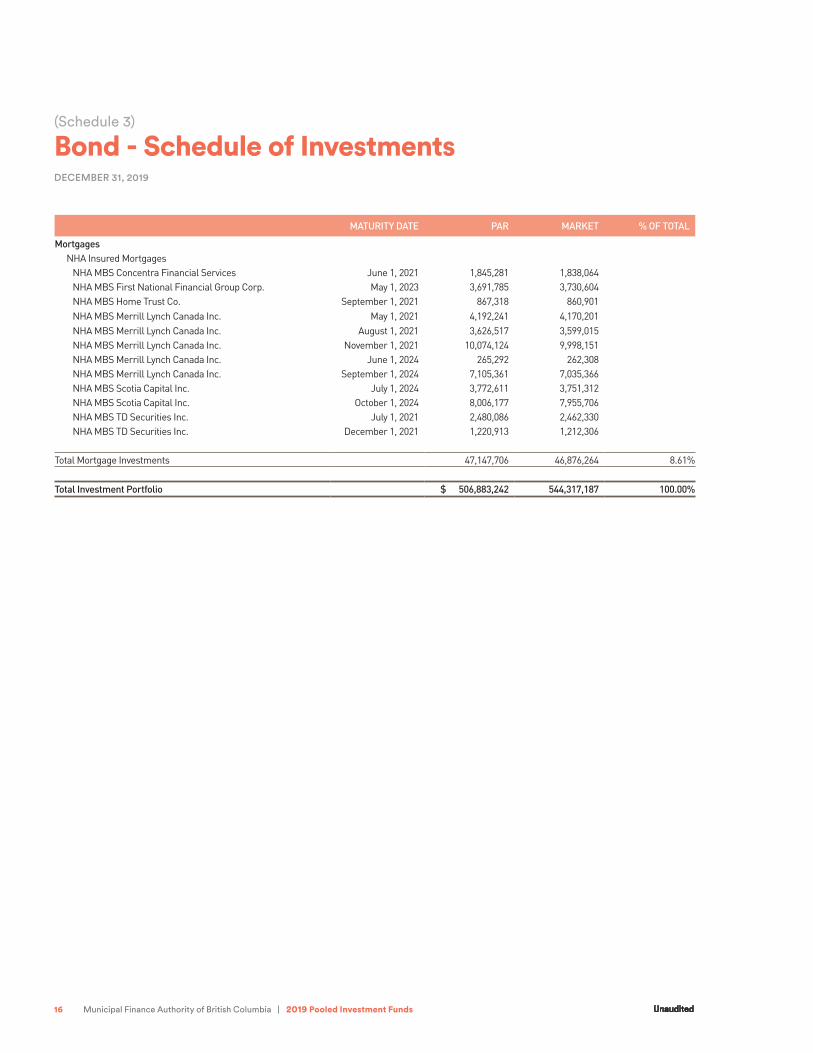
(Schedule 3)
Bond - Schedule of InvestmentsDECEMBER 31, 2019
MATURITY DATE PAR MARKET % OF TOTAL
Mortgages NHA Insured Mortgages
NHA MBS Concentra Financial Services June 1, 2021 1,845,281 1,838,064 NHA MBS First National Financial Group Corp. May 1, 2023 3,691,785 3,730,604 NHA MBS Home Trust Co. September 1, 2021 867,318 860,901 NHA MBS Merrill Lynch Canada Inc. May 1, 2021 4,192,241 4,170,201 NHA MBS Merrill Lynch Canada Inc. August 1, 2021 3,626,517 3,599,015 NHA MBS Merrill Lynch Canada Inc. November 1, 2021 10,074,124 9,998,151 NHA MBS Merrill Lynch Canada Inc. June 1, 2024 265,292 262,308 NHA MBS Merrill Lynch Canada Inc. September 1, 2024 7,105,361 7,035,366 NHA MBS Scotia Capital Inc. July 1, 2024 3,772,611 3,751,312 NHA MBS Scotia Capital Inc. October 1, 2024 8,006,177 7,955,706 NHA MBS TD Securities Inc. July 1, 2021 2,480,086 2,462,330 NHA MBS TD Securities Inc. December 1, 2021 1,220,913 1,212,306
Total Mortgage Investments 47,147,706 46,876,264 8.61%
Total Investment Portfolio $ 506,883,242 544,317,187 100.00%
Unaudited

Municipal Finance Authority of British Columbia | 2019 Pooled Investment Funds 17
Participants
MUNICIPALITIES
REGIONAL DISTRICTS
100 Mile House
Abbotsford
Anmore
Armstrong
Ashcroft
Belcarra
Bowen Island
Burnaby
Burns Lake
Cache Creek
Campbell River
Canal Flats
Castlegar
Central Saanich
Chase
Chetwynd
Chilliwack
Clearwater
Clinton
Coldstream
Colwood
Comox
Courtenay
Creston
Cumberland
Dawson Creek
Duncan
Enderby
Esquimalt
Fernie
Fraser Lake
Gibsons
Golden
Granisle
Hazelton
Highlands
Hope
Houston
Kamloops
Kaslo
Kelowna
Keremeos
Kimberley
Kitimat
Ladysmith
Lake Cowichan
Lantzville
Lillooet
Lytton
Mackenzie
Masset
McBride
Merritt
Metchosin
Midway
Montrose
Nakusp
Nanaimo
Nelson
New Denver
New Hazelton
New Westminster
North Cowichan
North Vancouver
Oak Bay
Oliver
Peachland
Pemberton
Penticton
Pitt Meadows
Port Alberni
Port Alice
Port Clements
Port Coquitlam
Port Edward
Port Hardy
Port McNeill
Pouce Coupe
Powell River
Prince George
Princeton
Qualicum Beach
Queen Charlotte
Quesnel
Radium Hot Springs
Revelstoke
Richmond
Rossland
Saanich
Salmo
Salmon Arm
Sayward
Sechelt
Silverton
Slocan
Smithers
Sooke
Spallumcheen
Sparwood
Stewart
Summerland
Sun Peaks
Tahsis
Taylor
Telkwa
Terrace
Tofino
Trail
Valemount
Vernon
Victoria
View Royal
Warfield
West Vancouver
Whistler
White Rock
Zeballos
Capital
Cariboo
Central Coast
Central Kootenay
Columbia Shuswap
Comox Valley
Cowichan Valley
East Kootenay
Fraser-Fort George
Kitimat-Stikine
Kootenay Boundary
Nanaimo
Okanagan-Similkameen
Peace River
qathet
Squamish-Lillooet
Strathcona
Sunshine Coast
Thompson-Nicola
Unaudited
18 Municipal Finance Authority of British Columbia | 2019 Pooled Investment Funds
Association of Vancouver Island and Coastal Communities
Barriere Improvement District
Board of Cemetery Trustees of Greater Victoria
CAGFO (formerly GFOA Western Canada)
Capital Region Housing
Carmacks
CivicInfo BC
College of the Rockies
Comox Fire Protection District
Cultus Lake Park
Faro
First Nations Finance Authority
Fraser Basin Council
Fraser Valley Library
Government Finance Officers Association of BC
Integrated Cadastral Information Society
Islands Trust Conservancy
Kelowna General Hospital Foundation
Kootenay & Boundary LGA
Local Government Management Association
Lower Mainland Government Association
Mission School District
Mount Parke Estates Improvement District
North Island-Coast Development Initiative Trust
Okanagan-Kootenay Sterile Insect Release Board
Old Massett Village Council
Port Alberni Harbour
Prince George Library
Queen Charlotte School District
Razor Point Improvement District
Shawnigan Improvement District
Southern Interior Local Government Association
Union of BC Municipalities
University of Northern BC
Vancouver Island Regional Library
Vancouver Island Local Government Management Association
Victoria Public Library
Yukon Communities
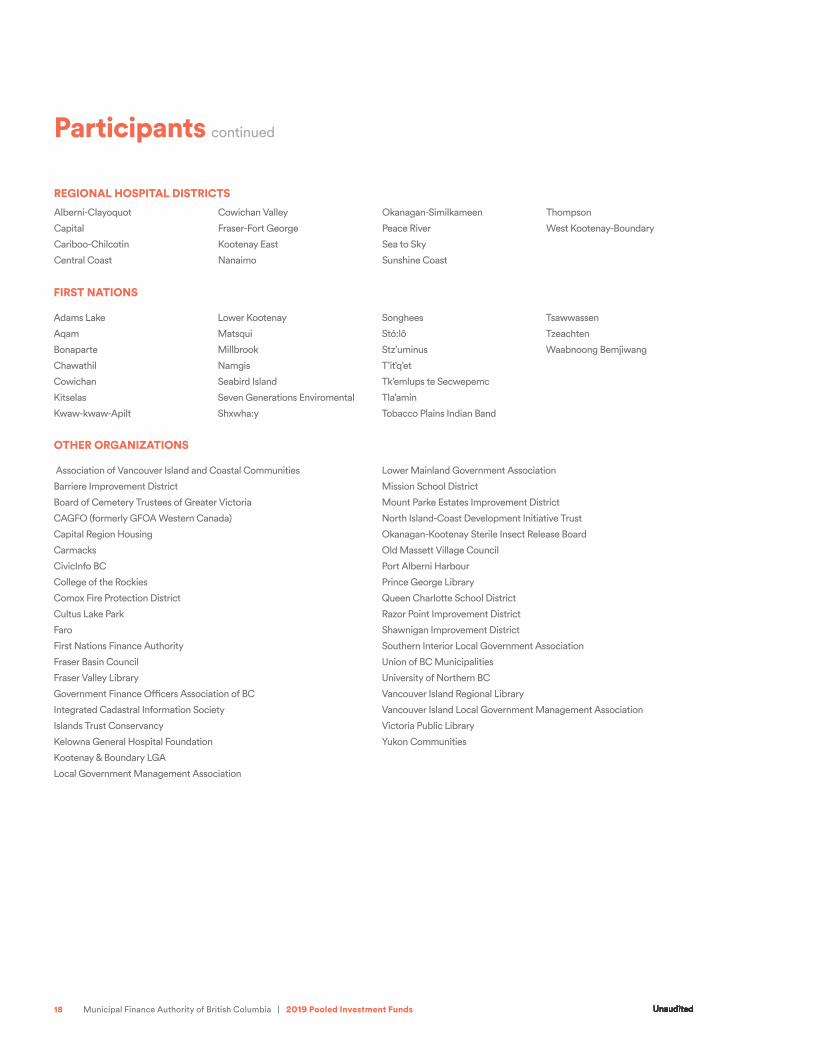
OTHER ORGANIZATIONS
Adams Lake
Aqam
Bonaparte
Chawathil
Cowichan
Kitselas
Kwaw-kwaw-Apilt
Lower Kootenay
Matsqui
Millbrook
Namgis
Seabird Island
Seven Generations Enviromental
Shxwha:y
Songhees
Stó:lõ
Stz’uminus
T’it’q’et
Tk’emlups te Secwepemc
Tla’amin
Tobacco Plains Indian Band
Tsawwassen
Tzeachten
Waabnoong Bemjiwang
FIRST NATIONS
Alberni-Clayoquot
Capital
Cariboo-Chilcotin
Central Coast
Cowichan Valley
Fraser-Fort George
Kootenay East
Nanaimo
Okanagan-Similkameen
Peace River
Sea to Sky
Sunshine Coast
Thompson
West Kootenay-Boundary
Participants continued
REGIONAL HOSPITAL DISTRICTS
Unaudited
Municipal Finance Authority of British Columbia | 2019 Pooled Investment Funds 19
High Interest Savings AccountPooled Investment Funds
REPORTS
Net Assets 20
Operations and Clients’ Equity 21
Changes in Net Assets 22
Notes 23
SCHEDULE
Participants 24
20 Municipal Finance Authority of British Columbia | 2019 Pooled Investment Funds
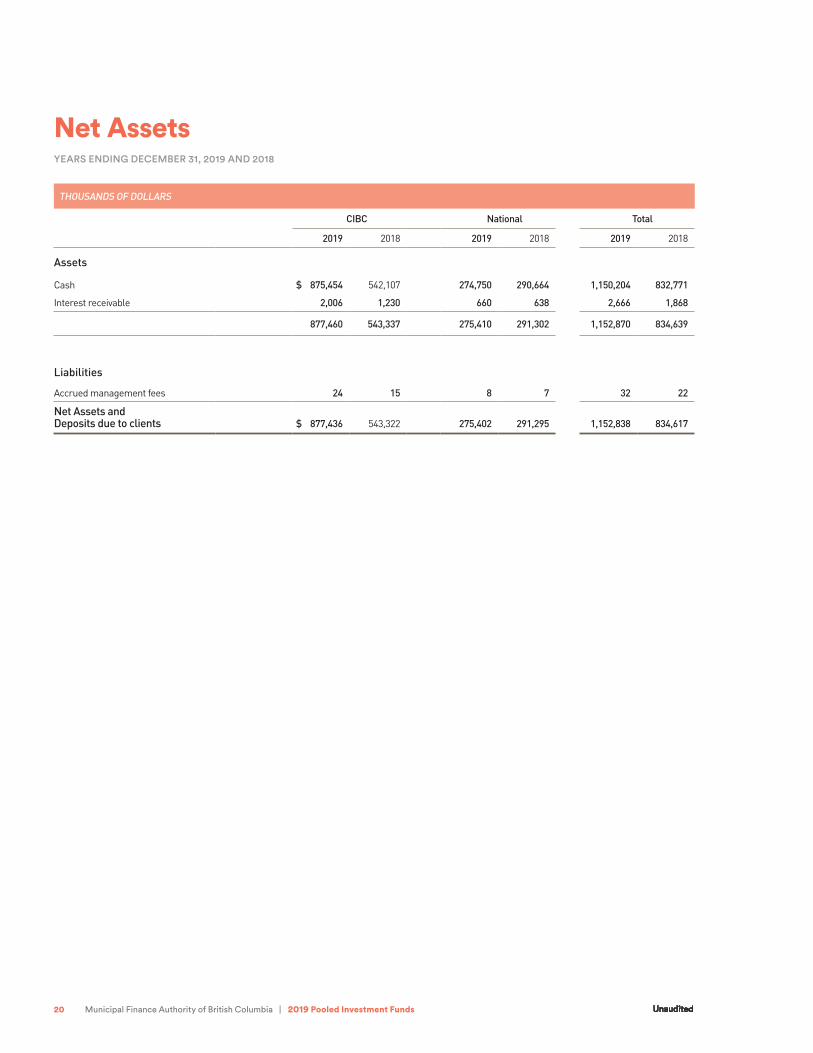
Net AssetsYEARS ENDING DECEMBER 31, 2019 AND 2018
THOUSANDS OF DOLLARS
CIBC National Total
2019 2018 2019 2018 2019 2018
Assets
Cash $ 875,454 542,107 274,750 290,664 1,150,204 832,771
Interest receivable 2,006 1,230 660 638 2,666 1,868
877,460 543,337 275,410 291,302 1,152,870 834,639
Liabilities
Accrued management fees 24 15 8 7 32 22
Net Assets and Deposits due to clients $ 877,436 543,322 275,402 291,295 1,152,838 834,617
Unaudited
Municipal Finance Authority of British Columbia | 2019 Pooled Investment Funds 21
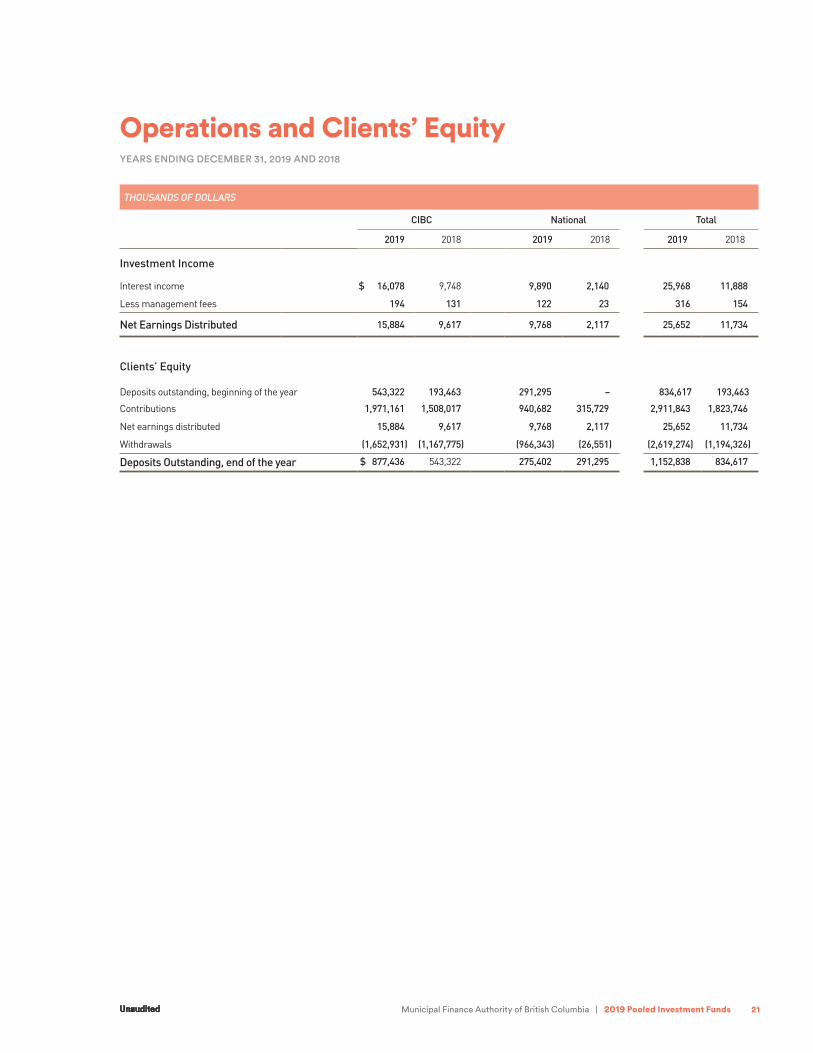
Operations and Clients’ EquityYEARS ENDING DECEMBER 31, 2019 AND 2018
THOUSANDS OF DOLLARS
CIBC National Total
2019 2018 2019 2018 2019 2018
Investment Income
Interest income $ 16,078 9,748 9,890 2,140 25,968 11,888
Less management fees 194 131 122 23 316 154
Net Earnings Distributed 15,884 9,617 9,768 2,117 25,652 11,734
Clients’ Equity
Deposits outstanding, beginning of the year 543,322 193,463 291,295 – 834,617 193,463
Contributions 1,971,161 1,508,017 940,682 315,729 2,911,843 1,823,746
Net earnings distributed 15,884 9,617 9,768 2,117 25,652 11,734
Withdrawals (1,652,931) (1,167,775) (966,343) (26,551) (2,619,274) (1,194,326)
Deposits Outstanding, end of the year $ 877,436 543,322 275,402 291,295 1,152,838 834,617
Unaudited
22 Municipal Finance Authority of British Columbia | 2019 Pooled Investment Funds
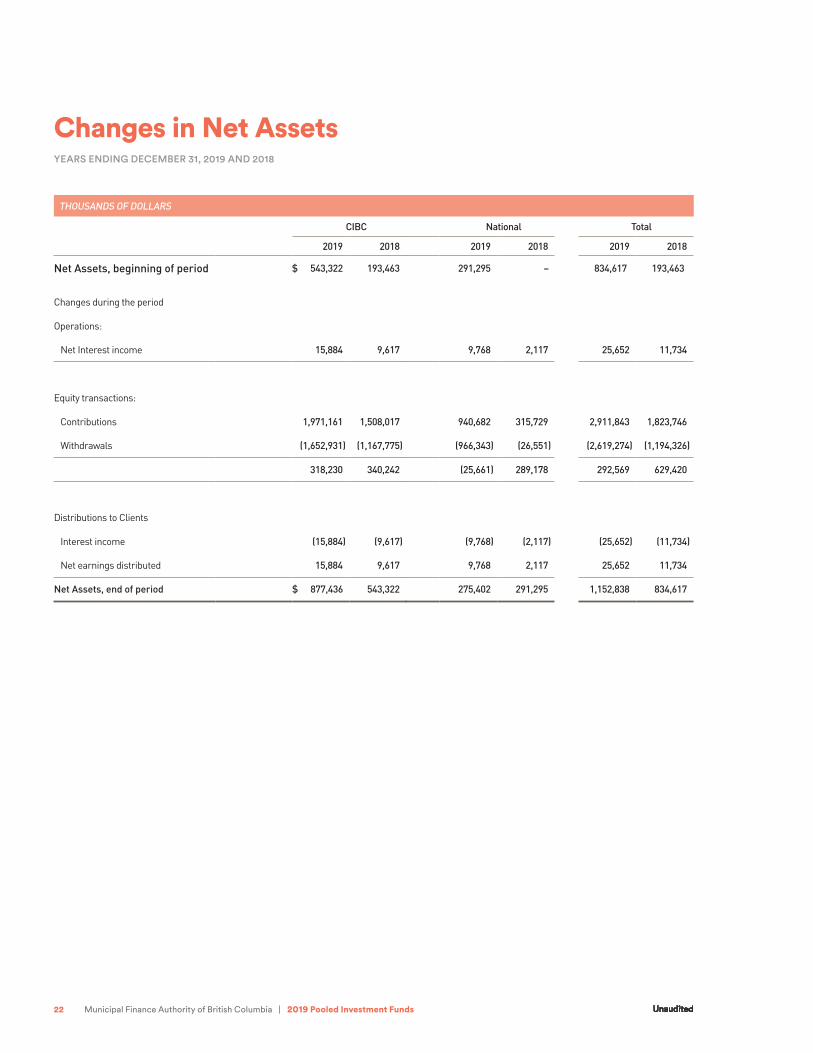
Changes in Net AssetsYEARS ENDING DECEMBER 31, 2019 AND 2018
THOUSANDS OF DOLLARS
CIBC National Total
2019 2018 2019 2018 2019 2018
Net Assets, beginning of period $ 543,322 193,463 291,295 – 834,617 193,463
Changes during the period
Operations:
Net Interest income 15,884 9,617 9,768 2,117 25,652 11,734
Equity transactions:
Contributions 1,971,161 1,508,017 940,682 315,729 2,911,843 1,823,746
Withdrawals (1,652,931) (1,167,775) (966,343) (26,551) (2,619,274) (1,194,326)
318,230 340,242 (25,661) 289,178 292,569 629,420
Distributions to Clients
Interest income (15,884) (9,617) (9,768) (2,117) (25,652) (11,734)
Net earnings distributed 15,884 9,617 9,768 2,117 25,652 11,734
Net Assets, end of period $ 877,436 543,322 275,402 291,295 1,152,838 834,617
Unaudited
Municipal Finance Authority of British Columbia | 2019 Pooled Investment Funds 23
NotesYEARS ENDING DECEMBER 31, 2019 AND 2018
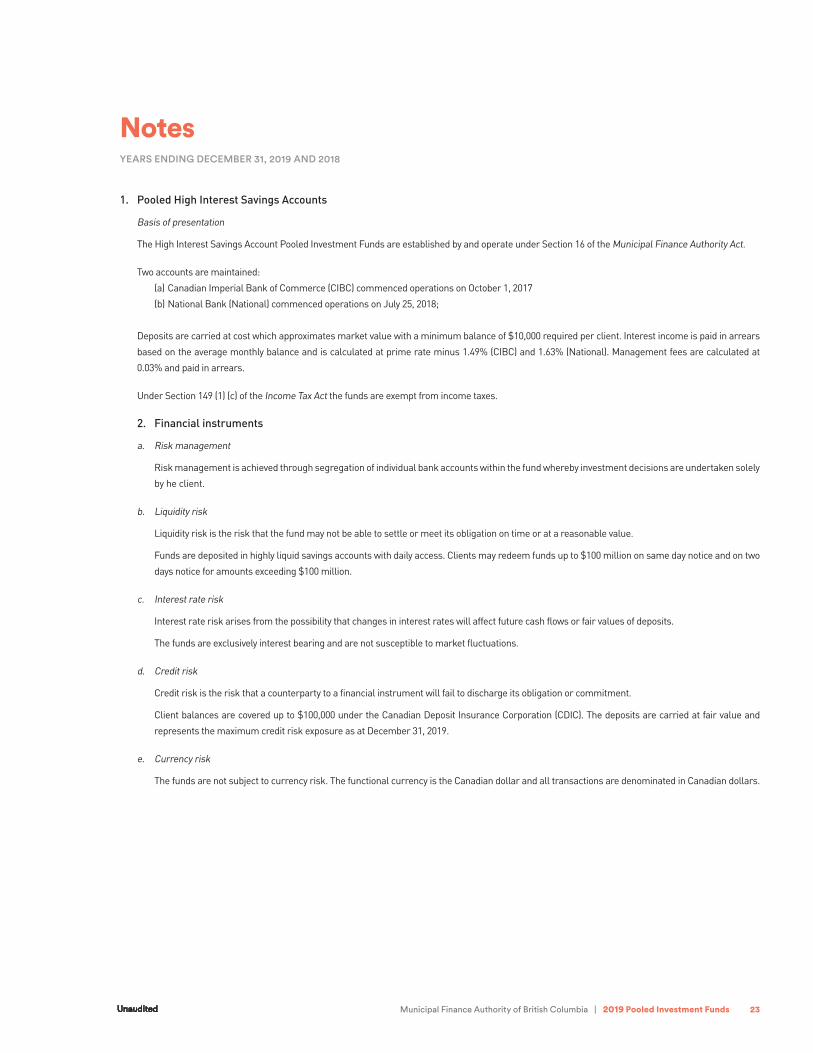
1. Pooled High Interest Savings Accounts
Basis of presentation
The High Interest Savings Account Pooled Investment Funds are established by and operate under Section 16 of the Municipal Finance Authority Act.
Two accounts are maintained:
(a) Canadian Imperial Bank of Commerce (CIBC) commenced operations on October 1, 2017
(b) National Bank (National) commenced operations on July 25, 2018;
Deposits are carried at cost which approximates market value with a minimum balance of $10,000 required per client. Interest income is paid in arrears
based on the average monthly balance and is calculated at prime rate minus 1.49% (CIBC) and 1.63% (National). Management fees are calculated at
0.03% and paid in arrears.
Under Section 149 (1) (c) of the Income Tax Act the funds are exempt from income taxes.
2. Financial instruments
a. Risk management
Risk management is achieved through segregation of individual bank accounts within the fund whereby investment decisions are undertaken solely
by he client.
b. Liquidity risk
Liquidity risk is the risk that the fund may not be able to settle or meet its obligation on time or at a reasonable value.
Funds are deposited in highly liquid savings accounts with daily access. Clients may redeem funds up to $100 million on same day notice and on two
days notice for amounts exceeding $100 million.
c. Interest rate risk
Interest rate risk arises from the possibility that changes in interest rates will affect future cash flows or fair values of deposits.
The funds are exclusively interest bearing and are not susceptible to market fluctuations.
d. Credit risk
Credit risk is the risk that a counterparty to a financial instrument will fail to discharge its obligation or commitment.
Client balances are covered up to $100,000 under the Canadian Deposit Insurance Corporation (CDIC). The deposits are carried at fair value and
represents the maximum credit risk exposure as at December 31, 2019.
e. Currency risk
The funds are not subject to currency risk. The functional currency is the Canadian dollar and all transactions are denominated in Canadian dollars.
Unaudited

24 Municipal Finance Authority of British Columbia | 2019 Pooled Investment Funds
Participants
Burnaby
Burns Lake
Cache Creek
Central Saanich
Chetwynd
Coldstream
Colwood
Comox
Coquitlam
Cranbrook
Dawson Creek
Delta
Gibsons
Gold River
Granisle
Hazelton
Kelowna
Langley (Township)
Mackenzie
Maple Ridge
Masset
McBride
Metchosin
Mission
Nakusp
Nelson
New Westminster
North Cowichan
North Vancouver (District)
Oak Bay
Port Clements
Port Coquitlam
Port Hardy
Port McNeill
Prince George
Prince Rupert
Queen Charlotte
Richmond
Saanich
Sechelt
Sidney
Slocan
Surrey
Ucluelet
Vancouver
Victoria
West Vancouver
MUNICIPALITIES
Bulkley-Nechako
Capital
Comox Valley
Fraser Valley
Fraser-Fort George
Kootenay Boundary
Metro Vancouver
Mount Waddington
Nanaimo
North Coast
North Okanagan
Okanagan-Similkameen
Peace River
Sunshine Coast
Thompson-Nicola
Capital
Comox-Strathcona
Fraser-Fort George
Okanagan-Similkameen
Peace River
Thompson
Capital Regional Housing Corporation
CivicInfo BC
Local Government Management Association
of BC
Union of BC Municipalities
Greater Victoria Labour Relations Association
REGIONAL HOSPITAL DISTRICTSREGIONAL DISTRICTS OTHER ORGANIZATIONS
Unaudited

Municipal Finance Authority of British Columbia | 2019 Pooled Investment Funds 25

217–3680 Uptown Boulevard Victoria, BC V8Z 0B9 T 250.383.1181 www.mfa.bc.ca