pop-pop cycle preliminary theory and practice
TRANSCRIPT
1/14Pop-pop cycle
Theory and practice
0. Forewords:
The following study relates to the pressure-volume cycle of a pop-pop engine during its normal working; ie the mean running conditions that it is able to ensure during several minutes. It follows various theoretical predictive studies (see www.eclecticspace.net, pop-pop topic, "La page de Jean-Yves", more particularly “Diagram of the water-steam cycle”) that it resumes partly (1. Theory) and especially that it completes with the experimental building, and in that sense real, of the pressure-volume diagram of a pop-pop engine, what seems something that has never been done before now (end of 2009) (2. Practice).
Note: The goal for several years was to simulate the behavior and then to check by experiments. Due to difficulties met with various programs the simulation has been delayed. The experimental measurements went before.
1. Theory.
This first part is the deepening in progress of the predictive study of the working characteristics of a pop-pop engine based on its physical characteristics. In the actual state of things this part is not complete. You are kindly invited to refer to the documents “The water snake movements” and “Diagram of the water-steam cycle” for this “theoretical” approach.
A pop-pop engine is a priori a Van der Pol resonator of which the movements are kept going at the beginning by a succession of vaporizations and condensations, and then in stabilized conditions which works more closely as a hot air engine (the simplest of the Stirling engines). In order to do that, it is made of a hot section containing gas (including steam, but not only steam) and of one or several tubes containing water. For the following study we will consider the simplest engine: a single tube closes at its upper end. This choice is justified by the fact what matters is the volume of gas, and this volume can as well be located into a cylindrical housing.
To carry on with “simplifications” we will suppose that the whole hot part (in red on the following sketch) is at the same temperature. This simplification is fully justified for engines with vaporizer made of thick copper. And this will be the case for our test engine, of which the rest of the tube will be in stainless steel.
Jean-Yves Renaud – www.eclecticspace.net – Dec.12, 2009 – Last updating June 16, 2011
Preliminary
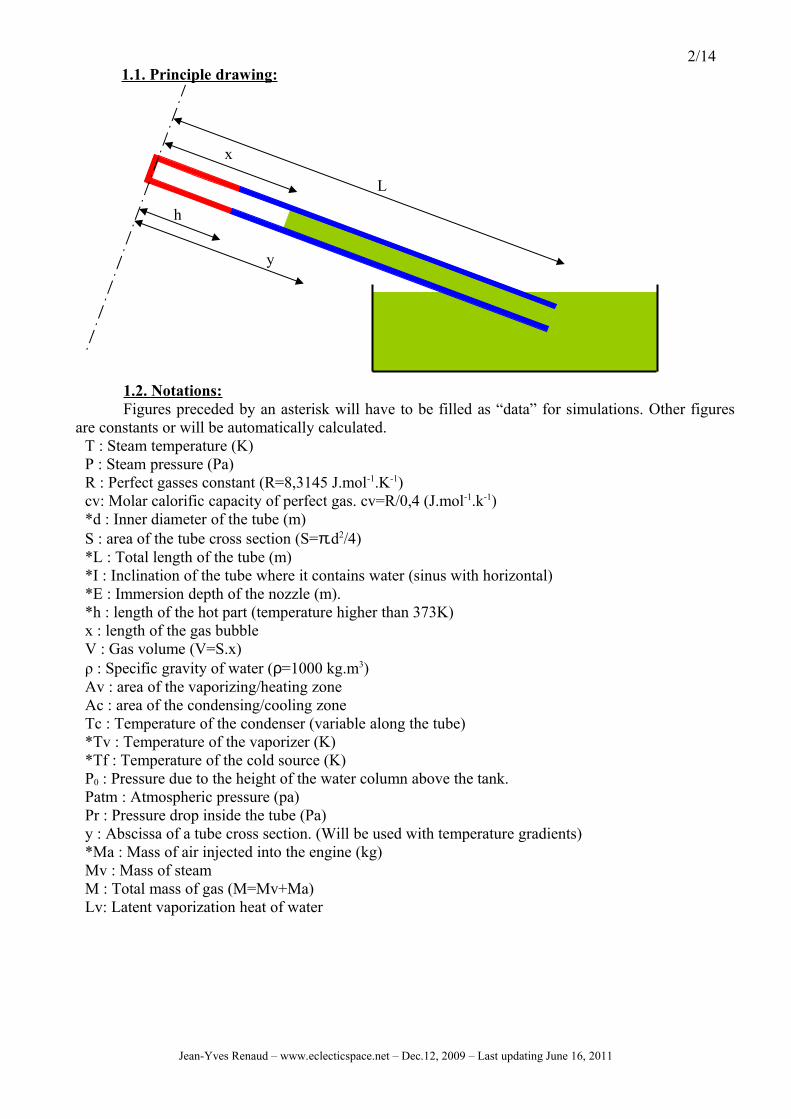
2/141.1. Principle drawing:
1.2. Notations:Figures preceded by an asterisk will have to be filled as “data” for simulations. Other figures
are constants or will be automatically calculated.T : Steam temperature (K)P : Steam pressure (Pa)R : Perfect gasses constant (R=8,3145 J.mol-1.K-1)cv: Molar calorific capacity of perfect gas. cv=R/0,4 (J.mol-1.k-1)*d : Inner diameter of the tube (m)S : area of the tube cross section (S=π.d2/4)*L : Total length of the tube (m)*I : Inclination of the tube where it contains water (sinus with horizontal)*E : Immersion depth of the nozzle (m).*h : length of the hot part (temperature higher than 373K)x : length of the gas bubbleV : Gas volume (V=S.x)ρ : Specific gravity of water (ρ=1000 kg.m3)Av : area of the vaporizing/heating zoneAc : area of the condensing/cooling zoneTc : Temperature of the condenser (variable along the tube)*Tv : Temperature of the vaporizer (K)*Tf : Temperature of the cold source (K)P0 : Pressure due to the height of the water column above the tank.Patm : Atmospheric pressure (pa)Pr : Pressure drop inside the tube (Pa)y : Abscissa of a tube cross section. (Will be used with temperature gradients)*Ma : Mass of air injected into the engine (kg)Mv : Mass of steamM : Total mass of gas (M=Mv+Ma)Lv: Latent vaporization heat of water
Jean-Yves Renaud – www.eclecticspace.net – Dec.12, 2009 – Last updating June 16, 2011
L
h
x
y
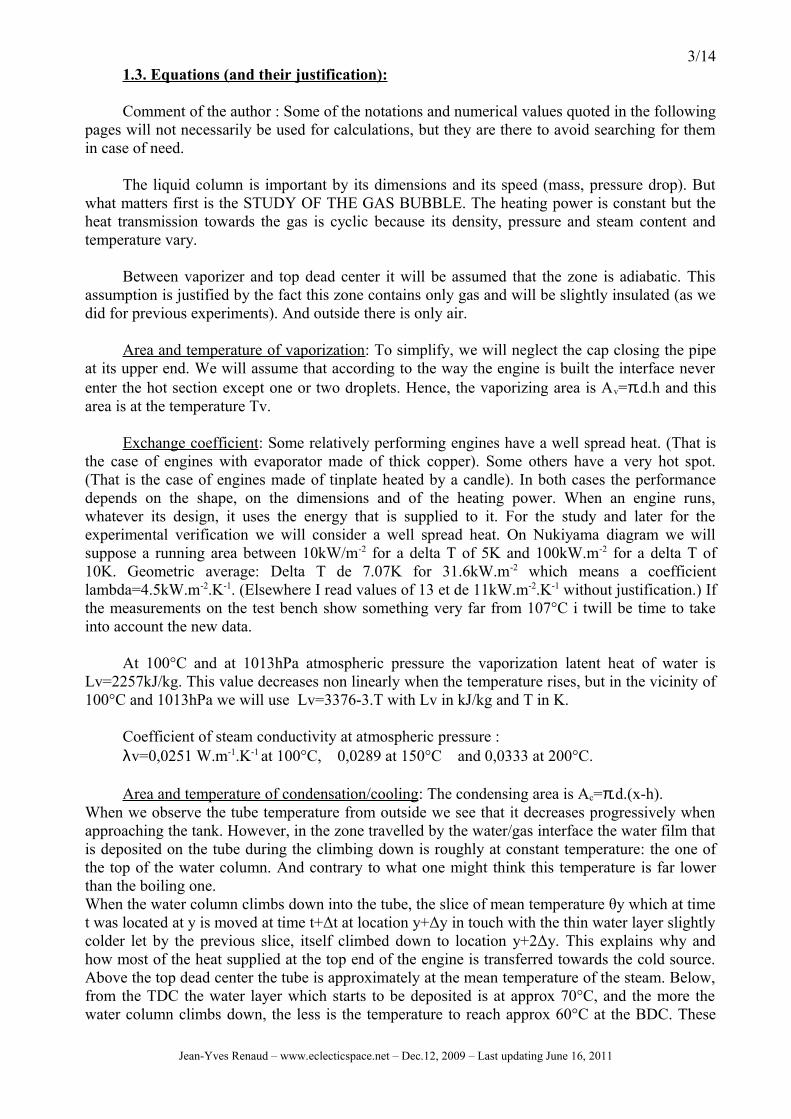
3/141.3. Equations (and their justification):
Comment of the author : Some of the notations and numerical values quoted in the following pages will not necessarily be used for calculations, but they are there to avoid searching for them in case of need.
The liquid column is important by its dimensions and its speed (mass, pressure drop). But what matters first is the STUDY OF THE GAS BUBBLE. The heating power is constant but the heat transmission towards the gas is cyclic because its density, pressure and steam content and temperature vary.
Between vaporizer and top dead center it will be assumed that the zone is adiabatic. This assumption is justified by the fact this zone contains only gas and will be slightly insulated (as we did for previous experiments). And outside there is only air.
Area and temperature of vaporization: To simplify, we will neglect the cap closing the pipe at its upper end. We will assume that according to the way the engine is built the interface never enter the hot section except one or two droplets. Hence, the vaporizing area is Av=π.d.h and this area is at the temperature Tv.
Exchange coefficient: Some relatively performing engines have a well spread heat. (That is the case of engines with evaporator made of thick copper). Some others have a very hot spot. (That is the case of engines made of tinplate heated by a candle). In both cases the performance depends on the shape, on the dimensions and of the heating power. When an engine runs, whatever its design, it uses the energy that is supplied to it. For the study and later for the experimental verification we will consider a well spread heat. On Nukiyama diagram we will suppose a running area between 10kW/m-2 for a delta T of 5K and 100kW.m-2 for a delta T of 10K. Geometric average: Delta T de 7.07K for 31.6kW.m-2 which means a coefficient lambda=4.5kW.m-2.K-1. (Elsewhere I read values of 13 et de 11kW.m-2.K-1 without justification.) If the measurements on the test bench show something very far from 107°C i twill be time to take into account the new data.
At 100°C and at 1013hPa atmospheric pressure the vaporization latent heat of water is Lv=2257kJ/kg. This value decreases non linearly when the temperature rises, but in the vicinity of 100°C and 1013hPa we will use Lv=3376-3.T with Lv in kJ/kg and T in K.
Coefficient of steam conductivity at atmospheric pressure :λv=0,0251 W.m-1.K-1 at 100°C, 0,0289 at 150°C and 0,0333 at 200°C.
Area and temperature of condensation/cooling: The condensing area is Ac=π.d.(x-h). When we observe the tube temperature from outside we see that it decreases progressively when approaching the tank. However, in the zone travelled by the water/gas interface the water film that is deposited on the tube during the climbing down is roughly at constant temperature: the one of the top of the water column. And contrary to what one might think this temperature is far lower than the boiling one.When the water column climbs down into the tube, the slice of mean temperature θy which at time t was located at y is moved at time t+Δt at location y+Δy in touch with the thin water layer slightly colder let by the previous slice, itself climbed down to location y+2Δy. This explains why and how most of the heat supplied at the top end of the engine is transferred towards the cold source. Above the top dead center the tube is approximately at the mean temperature of the steam. Below, from the TDC the water layer which starts to be deposited is at approx 70°C, and the more the water column climbs down, the less is the temperature to reach approx 60°C at the BDC. These
Jean-Yves Renaud – www.eclecticspace.net – Dec.12, 2009 – Last updating June 16, 2011
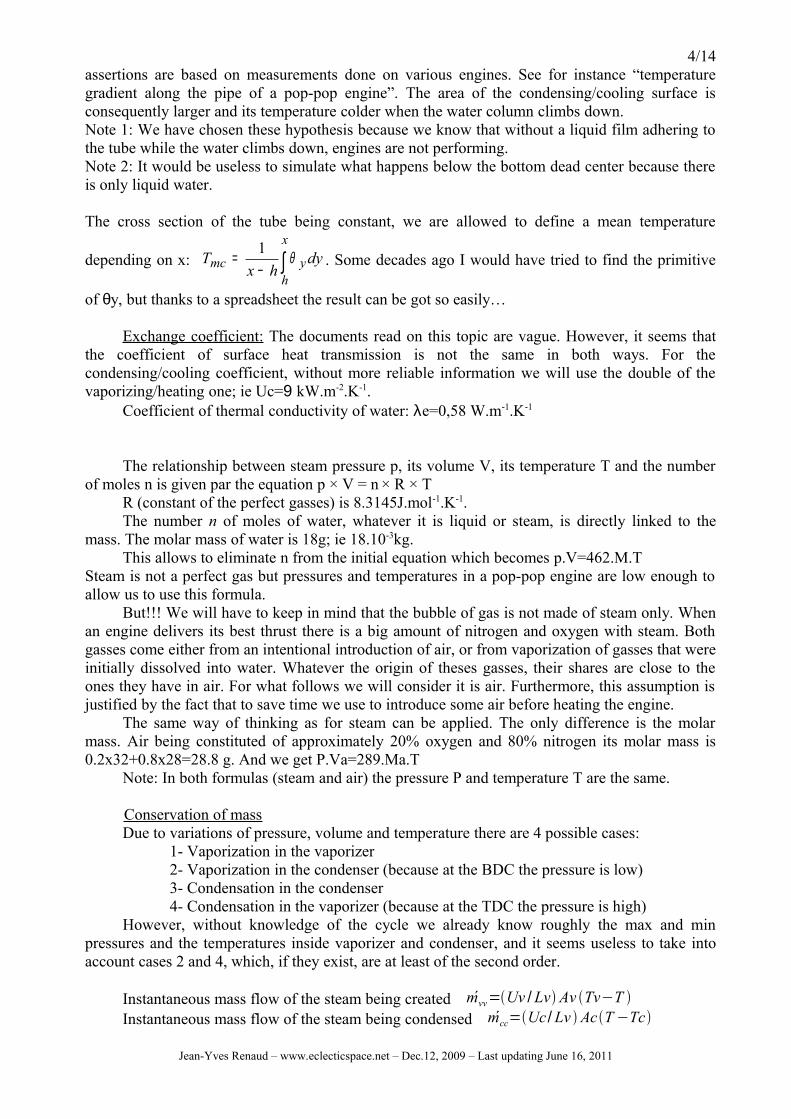
4/14assertions are based on measurements done on various engines. See for instance “temperature gradient along the pipe of a pop-pop engine”. The area of the condensing/cooling surface is consequently larger and its temperature colder when the water column climbs down. Note 1: We have chosen these hypothesis because we know that without a liquid film adhering to the tube while the water climbs down, engines are not performing.Note 2: It would be useless to simulate what happens below the bottom dead center because there is only liquid water.
The cross section of the tube being constant, we are allowed to define a mean temperature
depending on x: ∫−=
x
hymc dy
hxT θ1
. Some decades ago I would have tried to find the primitive
of θy, but thanks to a spreadsheet the result can be got so easily…
Exchange coefficient: The documents read on this topic are vague. However, it seems that the coefficient of surface heat transmission is not the same in both ways. For the condensing/cooling coefficient, without more reliable information we will use the double of the vaporizing/heating one; ie Uc=9 kW.m-2.K-1.
Coefficient of thermal conductivity of water: λe=0,58 W.m-1.K-1
The relationship between steam pressure p, its volume V, its temperature T and the number of moles n is given par the equation p × V = n × R × T
R (constant of the perfect gasses) is 8.3145J.mol-1.K-1.The number n of moles of water, whatever it is liquid or steam, is directly linked to the
mass. The molar mass of water is 18g; ie 18.10-3kg.This allows to eliminate n from the initial equation which becomes p.V=462.M.T
Steam is not a perfect gas but pressures and temperatures in a pop-pop engine are low enough to allow us to use this formula.
But!!! We will have to keep in mind that the bubble of gas is not made of steam only. When an engine delivers its best thrust there is a big amount of nitrogen and oxygen with steam. Both gasses come either from an intentional introduction of air, or from vaporization of gasses that were initially dissolved into water. Whatever the origin of theses gasses, their shares are close to the ones they have in air. For what follows we will consider it is air. Furthermore, this assumption is justified by the fact that to save time we use to introduce some air before heating the engine.
The same way of thinking as for steam can be applied. The only difference is the molar mass. Air being constituted of approximately 20% oxygen and 80% nitrogen its molar mass is 0.2x32+0.8x28=28.8 g. And we get P.Va=289.Ma.T
Note: In both formulas (steam and air) the pressure P and temperature T are the same.
Conservation of massDue to variations of pressure, volume and temperature there are 4 possible cases:
1- Vaporization in the vaporizer2- Vaporization in the condenser (because at the BDC the pressure is low)3- Condensation in the condenser4- Condensation in the vaporizer (because at the TDC the pressure is high)
However, without knowledge of the cycle we already know roughly the max and min pressures and the temperatures inside vaporizer and condenser, and it seems useless to take into account cases 2 and 4, which, if they exist, are at least of the second order.
Instantaneous mass flow of the steam being created mvv=Uv /Lv Av Tv−T Instantaneous mass flow of the steam being condensed mcc=Uc /Lv AcT −Tc
Jean-Yves Renaud – www.eclecticspace.net – Dec.12, 2009 – Last updating June 16, 2011

5/14Hence, the mass of gas at time (t+dt) is: M tdt =MaMv t mvv t − mcc t .dt
Conservation of momentum.The variation of internal energy in the gas bubble is the sum of thermal and mechanical
exchanges.Mechanical work (negative when x increases): dW=-P.S.dx
Thermal exchanges are of two kinds. On one hand vaporization/condensation and on the other hand the energy exchanges without state change.
Heat exchanged when state changes: mvv− mcc×LvHeat exchanges without state change: n.cv. [T tdt −T t ]
Knowing the gas temperature at time (t) this should allow to determine the gas temperature
at time t+dt. T tdt =T t dUn.cv mais ça se mord la queue
Movement of the water column:The water mass inside the tube is ).(. xLSme −= ρ . But an additional mass is to be
considered in the tank because the water column is prolonged. According to our measurements, in the expelling phase it is as if the water column was prolonged by 24 times its diameter. In the suction phase the flow is very different and the length to be considered (got by calculation) is only 2.3 times the diameter.
The water column is submitted to the differential pressure exerted on its ends. At the bottom it is the atmospheric pressure increased by the immersion depth of the nozzle (a few centimeters of water). At the top it is the absolute steam pressure. When the water is moving (dynamic conditions) one must take into account the mass of the water column and the pressure losses. These latter depends on the type of flow, which itself depends on Reynolds number (Re).
Because we have done many measurements and many calculations on various engines we know that the max speed of the flow is roughly 3m/s; which means (even for small engines) a turbulent flow. Reynolds number greater than 2500. Furthermore, the reciprocating movement eases this type of flow.
The pressure loss (∆P) depends on the instantaneous velocity (x’) of the water column, on its instantaneous length (L-x) and on the internal roughness of the tube. It is given by the approximate formula:
dxxLpr .2
.)..( 2' ρλ −= with 25,0316,0
eℜ=λ and
νdxe .'=ℜ
Note: We will use these only formulas because during laminar flow (low speed) the pressure drops are weak and the errors due to the simplification will be negligible.
Warning ! For the spreadsheet it twill be necessary to1°) check the sign of the ∆P. Indeed, the pressure loss must always slow the movement. Its
sign will have to be opposite to the one of the speed x’.2°) force Pr=0 when the speed is zero because to calculate λ the computer will not be able to
divide by zero.
Though the temperature varies all along the water column we will assume (error of 2%) that the specific gravity ρ is constant and equal to 1000kg/m3, and for the viscosity ν we will use a mean value (0.65.10-6 m2.s-1).With these assumptions the equation of the movement of the water column becomes:
Jean-Yves Renaud – www.eclecticspace.net – Dec.12, 2009 – Last updating June 16, 2011
6/14).(".. 0 ree PPatmPPSxmmF −−+=== γ where P0 which represents the static pressure due to
the geometric height of the water column could be neglected for a very small engine, but not for our big engine to be tested. [ ]EIxLgP −−= )(.0 ρ
Hence, the acceleration is )(" 0 re
pppmSx −−= . By integrating the first time we get the velocity
∫= dtxx "' and by integrating another time we get the displacement ∫= dtxx '
x being the location of the interface, the volume of gas is : VvVaxdV +==4
2π
and Vv
MvVa
MaTP 462289 += During one cycle, only the air mass doesn't vary.
: xdV4
2π=
VRm
TP d .
=
1.4. Solving:
Tube to be split in 100 sections of equal length. The content of each section exchange with– the tube– the above section– the under section
In spite of the hypotheses used to simplify the problem we have not tried to integrate these equations. It is so easy thanks to computer science and a spreadsheet. We just have to define the size of the calculation steps small enough (there 10ms). We don’t know a priori the cycle time, but due to the size of the engine which will be used for the tests we know that it will be roughly 1 second. Looking at the pressure and/or volume variations will allow defining this time.
In the spreadsheet, all the data will be declared as variable. Thus, later if we want to, it will be easy to analyze the cycle of another engine.
The numerical values used for this first application are those of the engine which will be used later (at chapter 2) to run tests; ie (with legal units):d=18.1x10⁻³m. L=1.350m. h=0.27m. I=42%. Tv=380 K (107°C). Ma=32.10-6 kg. Tf=293 K.For the test we will introduce 25 cm3 or air measured at 20°C ant at atmospheric pressure of 1013 hPa. Indeed, in these conditions one mole is 22.4 liters. And the molar mass of air is 28.8 g.28.8 g x 25 cm3 / 22.4 litres = 32 mg = 32. 10-6 kg.
1.4.1. Calculated pressure versus time.Etude à poursuivre dès que possible
1.4.2. Calculated volume versus time.Etude à poursuivre dès que possible
1.4.3. Calculated pop-pop cycle.Etude à poursuivre dès que possible
Jean-Yves Renaud – www.eclecticspace.net – Dec.12, 2009 – Last updating June 16, 2011

7/142. Pra ctice:
2.1. Measurement principle:
Recording by means of a data logger of pressure and volume of gas (mainly steam + nitrogen + oxygen) versus time.
Pressure measurement by means of an absolute pressure transducer.
Volume measurement. A direct measurement being impossible we have used the solution shown on the drawing. The pop-pop engine is connected at its bottom end to a tank of which the upper part has a constant cross section area. Thus, the movements of the water free surface are proportional to the gas volume inside the pop-pop engine. A float located on the free surface follows its movements. A proximity sensor located just above delivers a signal evolving with the vertical position of the float.
2.2. Some precautions:
- To avoid an unwanted filtering of the measures, the pressure and position transducers used have very fast response times (a few milliseconds) and the engine has been built to get a very low frequency (approx 1Hz).- To avoid damaging the pressure transducer by overheat, a thermal screen has been used and the transducer is slightly away and connected to the engine by a pipe provided with a small cooler.- To avoid a mechanical damage of the proximity sensor in case of accidental rise of the water level, this sensor has been set on a support hold at the right place by its own weight.- In order to have a good idea of the temperature of the hot section, this one has been made of copper. The rest of the engine is made of stainless steel.- The bottom part of the measuring tank is rather wide and high in order not to disturb the functioning of the engine. Diameter and height are approx 7 times the engine tube diameter. At its upper end this tank is prolonged by a reduced cylindrical section (diameter approx 4 times the one of the engine) in order that the level variations could be measured with acceptable accuracy.- Top and bottom parts are connected together by mean of cones in order not to trap some air which would disturb the measures.
Jean-Yves Renaud – www.eclecticspace.net – Dec.12, 2009 – Last updating June 16, 2011
Data logger TimeLevel Pressure
Cooler
8/14- The measuring tank was expected to be immersed in a refrigerating one. For a few hour test no cooling has been needed.- Static calibration. The electric signal delivered by the displacement transducer varies with the distance between this transmitter and the float. Alas! We got the unwanted surprise that the electric signal is not proportional to the distance. We had to determine the exact relationship between signal and distance. It is like D=D0+k.Arcsin(θ(U-U0)). To calibrate we changed the water level step by step by adding each time a well known quantity of water. The zero was determined just before the beginning of the test, while the pop-pop engine was full of water.- As time was going on, nitrogen and oxygen which were initially dissolved into water evaporated and the gas volume increased. As a consequence the mean water level raised into the measuring tank. To keep the measure relatively well centered we took off some measured water quantities by mean of a syringe.- In order to control the heating power, the candle drawn on the sketch has been replaced by an electric resistor. (To do it we have sacrificed an iron.)
2.3. Additional measurements:
Though it doesn’t concern the measurement of the cycle, during this test we used 8 temperature sensors, one for the boiler and the 7 others spread along the tube. The corresponding measurements will be used to improve the document entitled “Temperature gradient along the pipe of a pop-pop engine”. Indeed, this study was limited to a small engine (diameter 3.5mm) and a big one (diameter 23.5mm). This new one (diameter 18.1) is in between.
Jean-Yves Renaud – www.eclecticspace.net – Dec.12, 2009 – Last updating June 16, 2011
9/142. 4. Results:
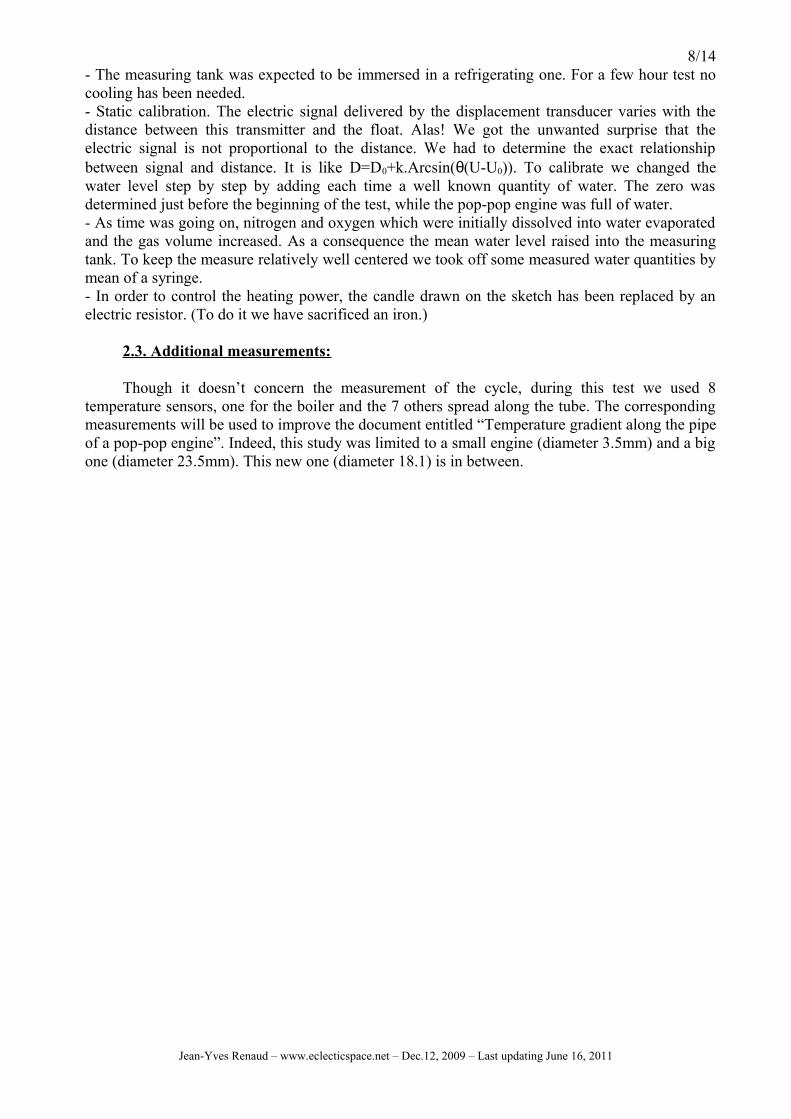
2.4.1. Measured pressure versus time:Pression de gaz en fonction du temps
94000
96000
98000
100000102000
104000
106000
108000
0 50 100 150 200Temps en centièmes de seconde
Pres
sion
en
Pasc
als
2.4.2. Measured volume versus time:
Volume de gaz en fonction du temps
0,0
10,0
20,0
30,0
40,0
50,0
60,0
70,0
80,0
0 20 40 60 80 100 120 140 160 180 200
Temps en centièmes de seconde
Volu
me
en c
m3
2.4.3. Measured pop-pop cycle:
20 cycle consécutifs (Test #F14)
92000940009600098000
100000102000104000106000108000110000
100 110 120 130 140 150 160 170
Volume (cm3)
Pres
sion
(Pa)
This record of 20 consecutive cycles (1518 dots) set as evident the quasi repeatability of the cycle.Next record concerns only one cycle in order to better see the behavior at the ends.
Jean-Yves Renaud – www.eclecticspace.net – Dec.12, 2009 – Last updating June 16, 2011
The purple line shows the pressure at rest. It is slightly lower than the atmospheric pressure (because of the height of the engine) itself low the day of the test.
10/14
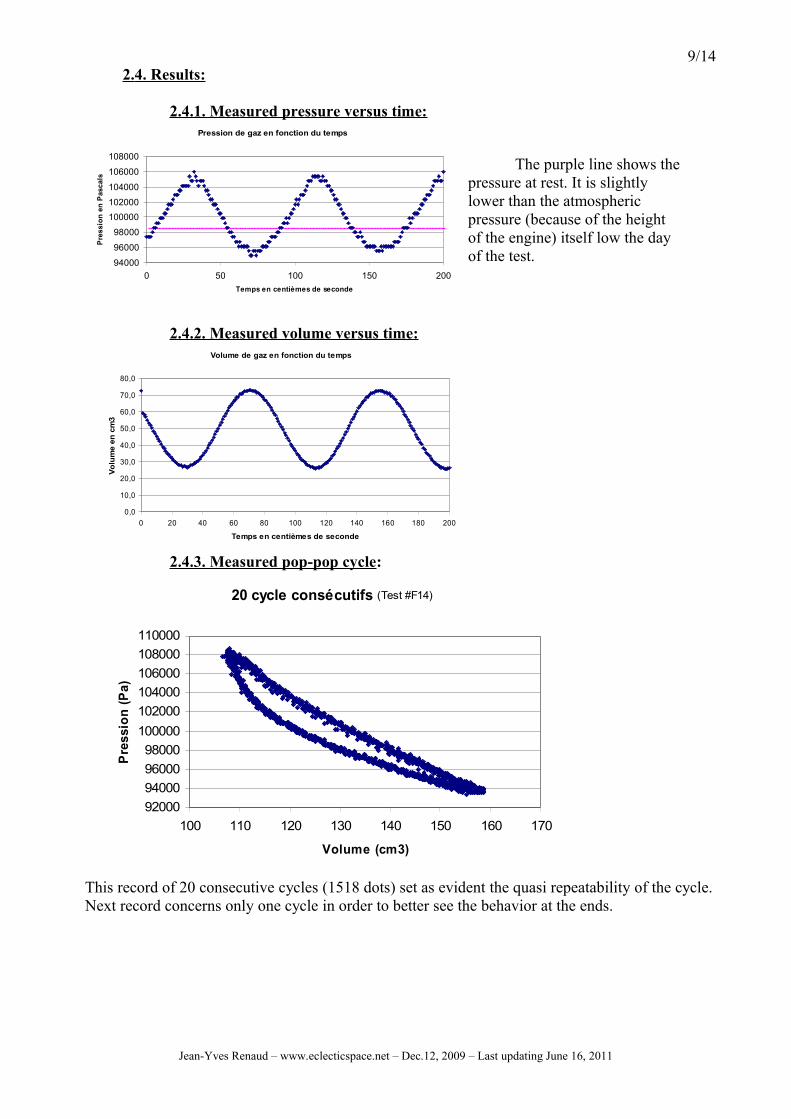
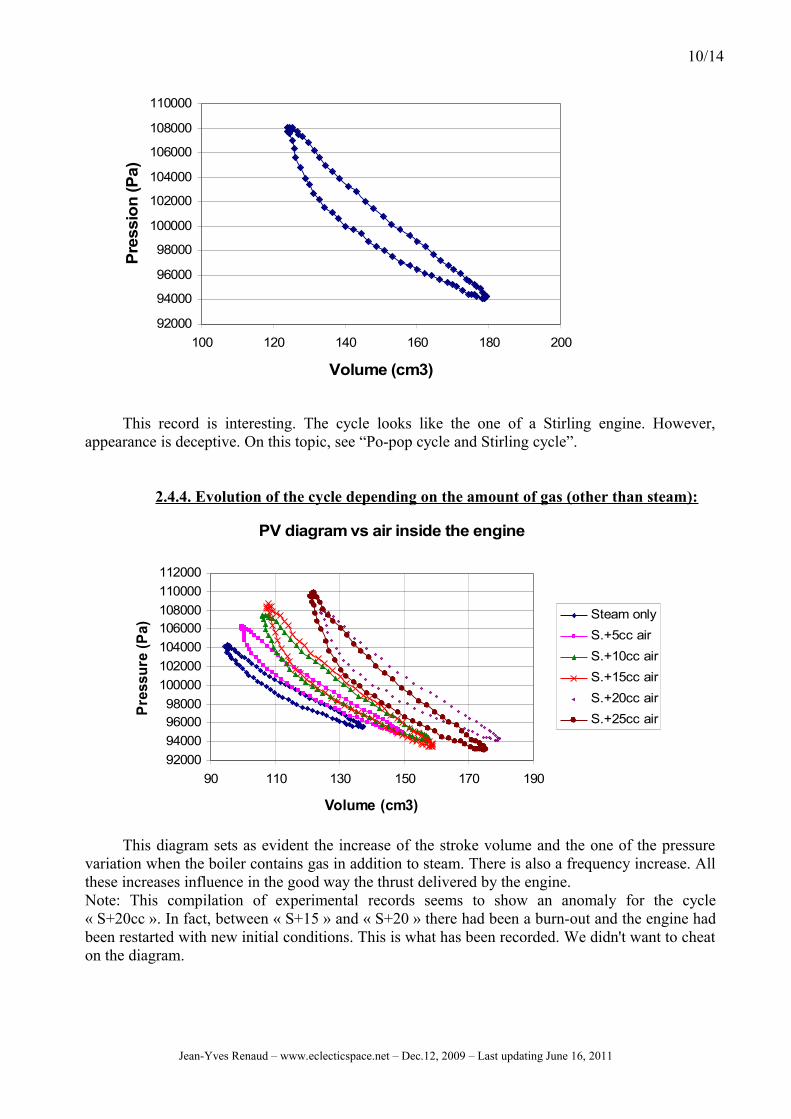
This record is interesting. The cycle looks like the one of a Stirling engine. However, appearance is deceptive. On this topic, see “Po-pop cycle and Stirling cycle”.
2.4.4. Evolution of the cycle depending on the amount of gas (other than steam):
PV diagram vs air inside the engine
92000940009600098000
100000102000104000106000108000110000112000
90 110 130 150 170 190
Volume (cm3)
Pres
sure
(Pa)
Steam onlyS.+5cc airS.+10cc airS.+15cc airS.+20cc airS.+25cc air
This diagram sets as evident the increase of the stroke volume and the one of the pressure variation when the boiler contains gas in addition to steam. There is also a frequency increase. All these increases influence in the good way the thrust delivered by the engine.Note: This compilation of experimental records seems to show an anomaly for the cycle « S+20cc ». In fact, between « S+15 » and « S+20 » there had been a burn-out and the engine had been restarted with new initial conditions. This is what has been recorded. We didn't want to cheat on the diagram.
Jean-Yves Renaud – www.eclecticspace.net – Dec.12, 2009 – Last updating June 16, 2011
92000
94000
96000
98000
100000
102000
104000
106000
108000
110000
100 120 140 160 180 200
Volume (cm3)
Pres
sion
(Pa)

11/143. Conclusions:
In theory (to be confirmed when the program run!) as well as practice:
• Running is periodic.• The water movement is very close to sinusoidal.• Pressure and volume are close to opposite phases.• The absolute value of the maxi effective pressure is twice higher than the one of the mini
low pressure. On the quite smaller PPVG engine, in October 2006, we measured a ratio of 2.1. Due to the accuracy of the measurements, these results confirm each other.
• The diagram looks like what we concluded in “Diagram of the water-steam cycle” (on Feb.5, 2008). In the dihedral P-V the cycle looks like a flattened bean with concavity towards the top right.
• Gas (other than steam) improves the performances of the engine.• ….
Jean-Yves Renaud – www.eclecticspace.net – Dec.12, 2009 – Last updating June 16, 2011
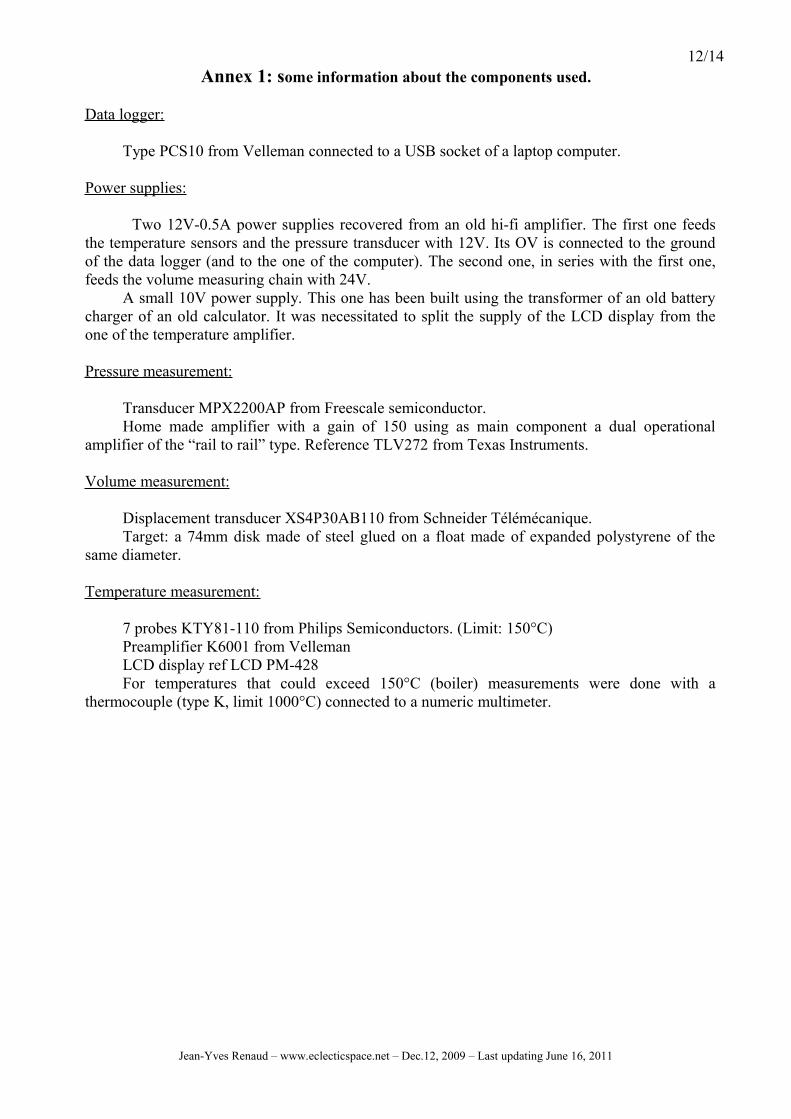
12/14Annex 1: some information about the components used.
Data logger:
Type PCS10 from Velleman connected to a USB socket of a laptop computer.
Power supplies:
Two 12V-0.5A power supplies recovered from an old hi-fi amplifier. The first one feeds the temperature sensors and the pressure transducer with 12V. Its OV is connected to the ground of the data logger (and to the one of the computer). The second one, in series with the first one, feeds the volume measuring chain with 24V.
A small 10V power supply. This one has been built using the transformer of an old battery charger of an old calculator. It was necessitated to split the supply of the LCD display from the one of the temperature amplifier.
Pressure measurement:
Transducer MPX2200AP from Freescale semiconductor.Home made amplifier with a gain of 150 using as main component a dual operational
amplifier of the “rail to rail” type. Reference TLV272 from Texas Instruments.
Volume measurement:
Displacement transducer XS4P30AB110 from Schneider Télémécanique.Target: a 74mm disk made of steel glued on a float made of expanded polystyrene of the
same diameter.
Temperature measurement:
7 probes KTY81-110 from Philips Semiconductors. (Limit: 150°C)Preamplifier K6001 from VellemanLCD display ref LCD PM-428For temperatures that could exceed 150°C (boiler) measurements were done with a
thermocouple (type K, limit 1000°C) connected to a numeric multimeter.
Jean-Yves Renaud – www.eclecticspace.net – Dec.12, 2009 – Last updating June 16, 2011
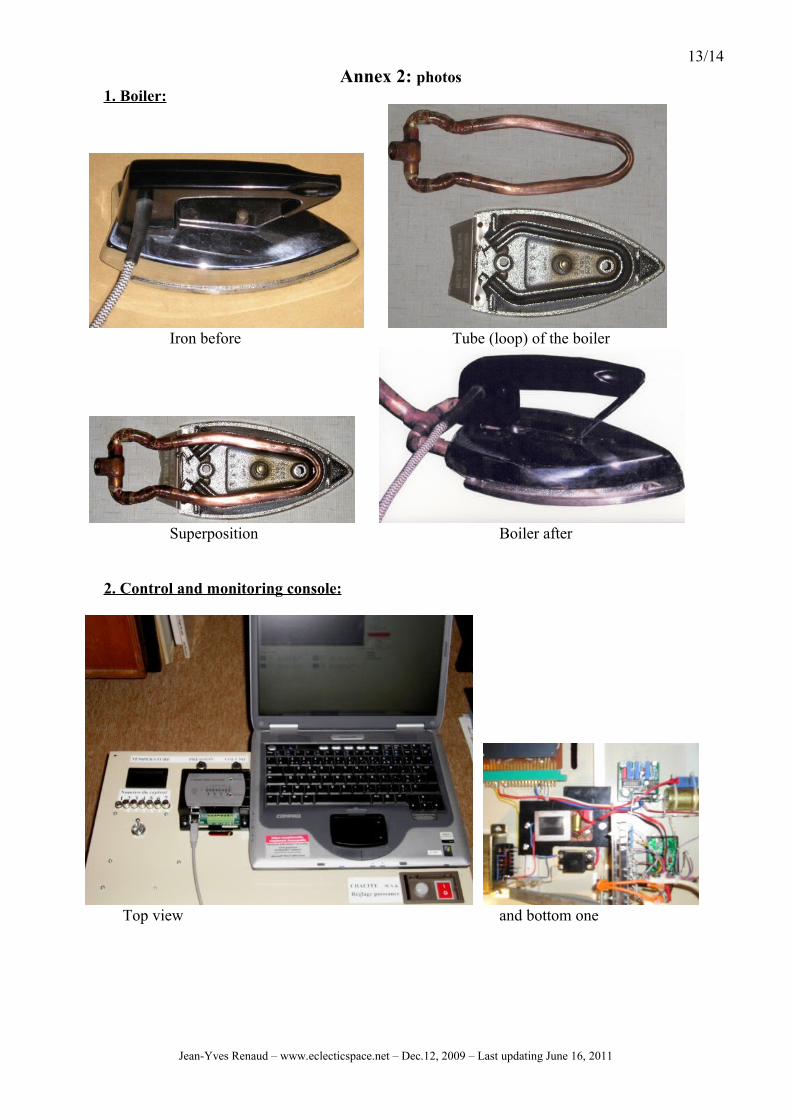
13/14Annex 2: photos
1. Boiler:
Iron before Tube (loop) of the boiler
Superposition Boiler after
2. Control and monitoring console:
Top view and bottom one
Jean-Yves Renaud – www.eclecticspace.net – Dec.12, 2009 – Last updating June 16, 2011
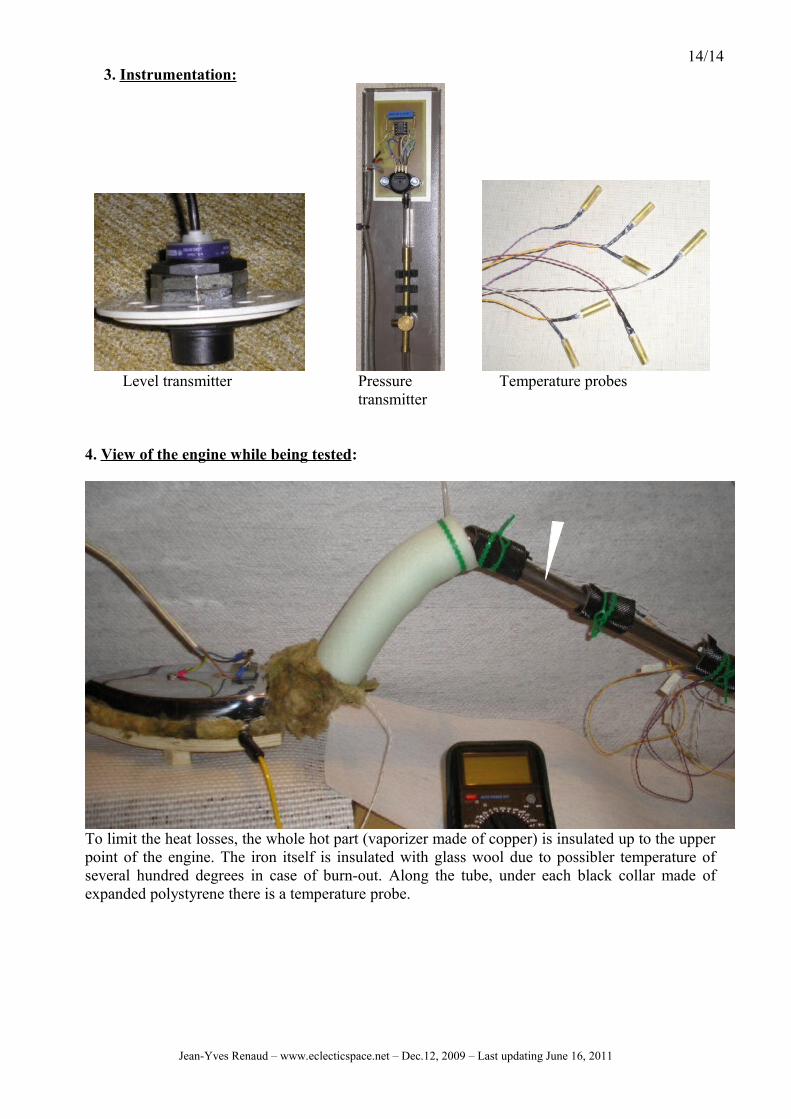
14/143. Instrumentation:
Level transmitter Pressure Temperature probes
transmitter
4. View of the engine while being tested:
To limit the heat losses, the whole hot part (vaporizer made of copper) is insulated up to the upper point of the engine. The iron itself is insulated with glass wool due to possibler temperature of several hundred degrees in case of burn-out. Along the tube, under each black collar made of expanded polystyrene there is a temperature probe.
Jean-Yves Renaud – www.eclecticspace.net – Dec.12, 2009 – Last updating June 16, 2011