popular ageing myths debunked - göteborgs universitet
TRANSCRIPT
Popular Ageing Myths Debunked:
A sustainable future cannot be reached through the pursuit of youthfulness
Jane O’Sullivan
Symposium - Population and Ageing: Disaster or Triumph?
Sustainable Population Australia – 7 March 2015

Sustainability• The ability to leave future generations an environment that is no
less wondrous, diverse, bountiful and benign than that we enjoy, and lives that are no less secure and fulfilling.
• I = P.A.T (Impact = Population x Affluence x Technology)
• Sustainability requires a population within the carrying capacity of its environment.
• Population growth is absolutely incompatible with a sustainable future.
• Population decline may be necessary or desirable to retreat from overshoot and restore ecological sustainability.
Stein’s Law: "If something cannot go on forever, it will stop."

2012 UN Population Projections
Constant Fertility 28.6 billion by 2100
High Fertility2050: 10.9 billion2100: 16.6 billion
Medium Fertility2050: 9.6 billion2100: 10.9 billion
Low Fertility2050: 8.3 billion2100: 6.8 billion
UN Population Projections 2010 and 2012
Year
1960 1980 2000 2020 2040 2060 2080 2100
Wo
rld
Po
pu
lati
on
(b
illi
on
s)
0
2
4
6
8
10
12
14
16
18

UN Population Projections 2010 and 2012
Year
1960 1980 2000 2020 2040 2060 2080 2100
Wo
rld
Po
pu
lati
on
(b
illi
on
s)
0
2
4
6
8
10
12
14
16
18
High Fertility
Medium Fertility
Low Fertility
Projections are blind to carrying capacity
Resource Constraints?
Joel Cohen “How Many People can the Earth Support”: 7-12 billion is “the zone”“If most people would prefer a decline in birth rates to a rise in death rates, then they
should take actions to support a decline in fertility while time remains to realize that choice.”

Demographic Transition
• The great triumph of the modern era: most people born will lead long and healthy lives.
• The fall in birth rates has lagged behind the fall in deaths. This results in population growth.
• Globally, we are in a protracted Stage 3.
• There is nothing inevitable about reaching Stage 4 – We have to make it happen.
• The risk is that resource limits will cause mortality to rise, before fertility has fallen sufficiently. We may return to Stage 1 – a brutal future.

Implications of Demographic Transition
2. Age structure changes:
1. Population
grows
Mill
ion
s
Mali 1950 Mali 2015 India 2015 Australia 2060?

Dependency ratios
“Working age population” 15-64 years
“Old age dependents” 65+ years
“Young dependents” 0-14 years
• Ageing is an inevitable feature of the demographic transition.
• It is self-limiting: once Stage 4 (stationary population) is established, proportion in each age cohort remains constant.
• The majority of people are working-age (stabilises around 55%).
• Lower fertility with compensating immigration means higher median age, but also higher % in prime working age:
• UK low-fertility projection: Below replacement fertility (1.64) with top-up immigration (0.2%) + pension age of 68 leads to stable ratios around Japan’s current level (22% pension age, 62% working age)
Stage 1 Stage 4Stage 3Stage 2

Even a shrinking population may be socially and economically successful.
• Even the feared “coffin” shaped demographic is stable and manageable, until population declines to preferred levels.
• Japan’s population is forecast to “crash” at a reckless 0.6% p.a. (one third of Australia’s growth rate).
• Over-65s stabilise around 36%, working age still >50%.
• A declining population can be readily stabilised through a small rise in fertility –there is no inexorable spiral into oblivion.

Myth 1: that we’ll all be stranded in our nursing
homes with no-one left to look after us.

Australia is not alone in ageing paranoia.
• Ageing is the main excuse for maintaining population growth.
• Population growth is a policy variable (a choice).
• A significant shift in policy in the past 20 years:• High fertility nations have reduced family planning.• Low fertility nations have resisted stabilisation.
• A consequent resurgence in global population growth.
Global population won’t peak unless individual nations embrace stabilisation or descent.

UN Population Projections 2010 and 2012
Year
1990 2000 2010 2020 2030
An
nu
al
Inc
rem
en
t o
f P
op
ula
tio
n (
mil
lio
ns)
0
20
40
60
80
100
120
Annual Increment of Population
Medium Projection
Constant Fertility Projection
Recent estimates of actual increasefrom Population Reference Bureau

Population growth only partly delays ageing
A. Population projections
Year
1960 1970 1980 1990 2000 2010 2020 2030 2040 2050
Au
str
alia
n p
op
ula
tio
n (
millio
ns)
0
10
20
30
40
Historical population
High projection: TFR=2, NOM=220,000
Low projection: TFR=2, NOM=0
B. Proportion over 65 and working age
Year
1960 1970 1980 1990 2000 2010 2020 2030 2040 2050
Ra
tio
pe
r ce
nt
0
10
20
30
40
50
60
70
80
90
100
% of population >65 years old
Old Age Dependency: % >65 / 15-64 years old
% of population in working age 15-64 years
% of population in working age 20-69 years
A. Population projections
Year
1960 1970 1980 1990 2000 2010 2020 2030 2040 2050
Austr
alian p
opu
lation (
million
s)
0
10
20
30
40
Historical population
High projection: TFR=2, NOM=220,000
Low projection: TFR=2, NOM=0
B. Proportion over 65 and working age
Year
1960 1970 1980 1990 2000 2010 2020 2030 2040 2050
Ratio p
er
cen
t
0
10
20
30
40
50
60
70
80
90
100
% of population >65 years old
Old Age Dependency: % >65 / 15-64 years old
% of population in working age 15-64 years
% of population in working age 20-69 years
• Our current low dependency ratio is a transitory artefact of the demographic transition.
• We will return to the sort of ratio we had in the 1960s (boom time).
• A very large, ever expanding population translates into a very small increase in proportion of working age.
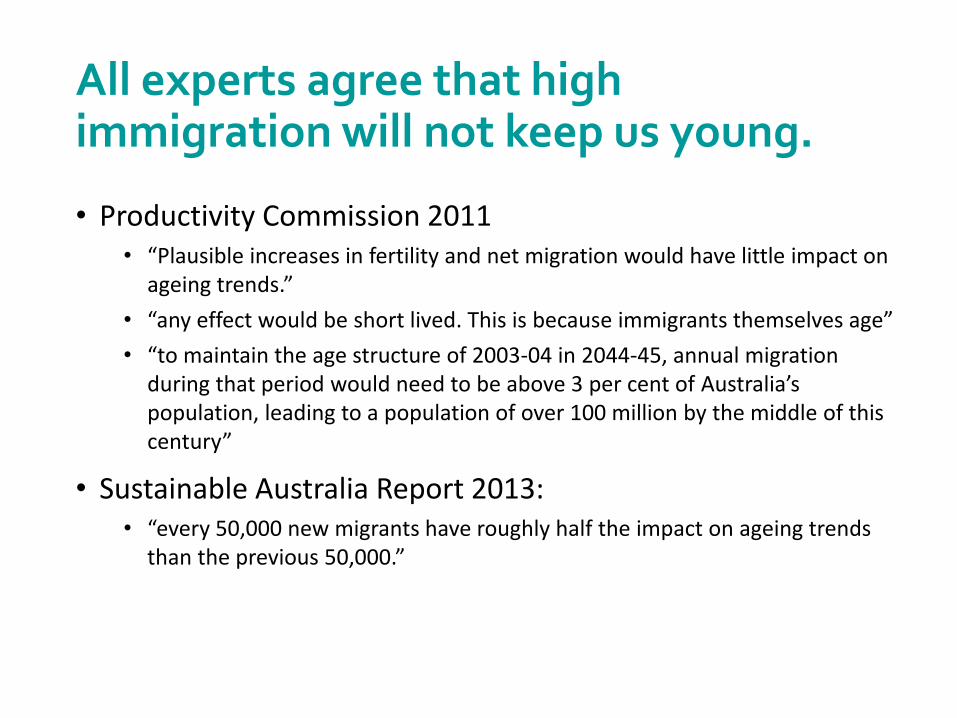
All experts agree that high immigration will not keep us young.
• Productivity Commission 2011• “Plausible increases in fertility and net migration would have little impact on
ageing trends.”
• “any effect would be short lived. This is because immigrants themselves age”
• “to maintain the age structure of 2003-04 in 2044-45, annual migration during that period would need to be above 3 per cent of Australia’s population, leading to a population of over 100 million by the middle of this century”
• Sustainable Australia Report 2013:• “every 50,000 new migrants have roughly half the impact on ageing trends
than the previous 50,000.”

Myth 1: that we’ll all be stranded in our nursing homes
with no-one left to look after us.
Myth 2: that increasing immigration will keep us young.

What about Bernard Salt’s “big tilt”?
• 2011 was merely the change between historical data and outdated projections.
• In neither projection is there negative growth in workforce.
• Not all working age people are actually employed.
Salt says: “2011 is a break point year. From this year onwards, more baby boomers exit the workforce than generation Ys enter.”
What is this chart saying?
From “The Big Tilt”By Bernard Salt (2011)

Salt says Japan is “busted”
• What happens when workforce starts to shrink?
From “The Big Tilt”By Bernard Salt (2011)
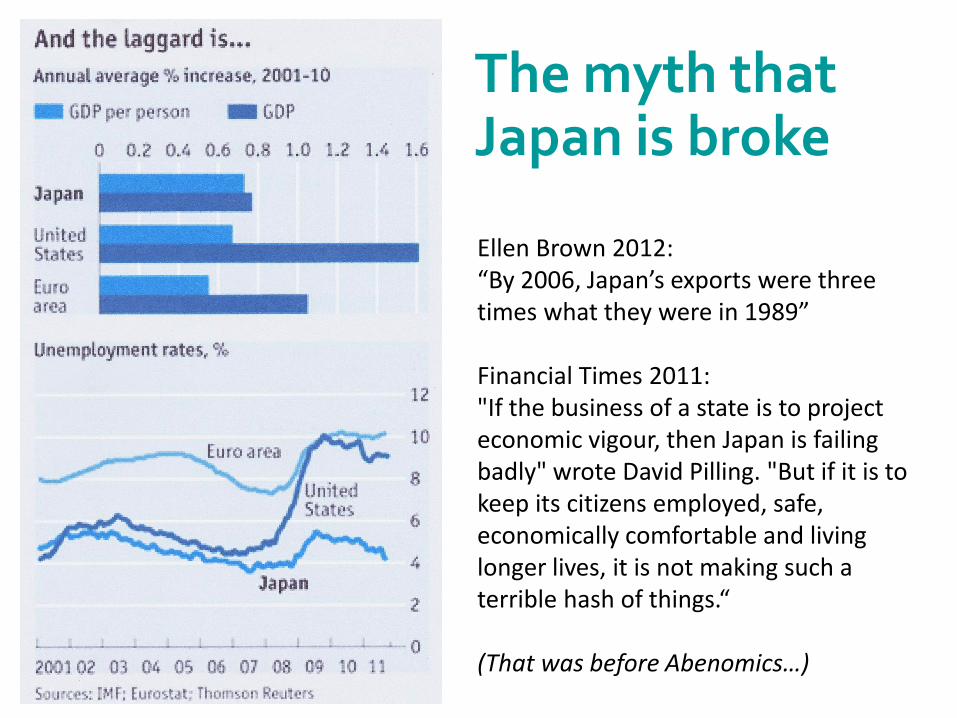
The myth that Japan is broke
Ellen Brown 2012: “By 2006, Japan’s exports were three times what they were in 1989”
Financial Times 2011: "If the business of a state is to project economic vigour, then Japan is failing badly" wrote David Pilling. "But if it is to keep its citizens employed, safe, economically comfortable and living longer lives, it is not making such a terrible hash of things.“
(That was before Abenomics…)

What is Australia’s “business of state”?
• To keep its citizens employed, safe, economically comfortable and living longer lives?
• – in a stable, bountiful and beautiful environment, for many generations to come?
• The largest possible GDP growth?
• The most spending per person (regardless of debt)?
• The biggest profits for big investors?
• The greatest speculative gain for property traders?

What is Australia’s “business of state”?
• To keep its citizens employed, safe, economically comfortable and living longer lives?
• – in a stable, bountiful and beautiful environment, for many generations to come?
• The largest possible GDP growth?
• The most spending per person (regardless of debt)?
• The biggest profits for big investors?
• The greatest speculative gain for property traders

Intergenerational Reports
• Introduced in 2002 to build public support for accelerated population growth.
• Constructed two myths:• Ageing as an economic disaster, • Immigration as a means to “rebalance” our demography.
• Greatly exaggerate the costs of ageing,
• Completely omit the costs of population growth.
• Deficits are projected by assuming tax and welfare policies will not adapt.
Hockey’s IGR meaningless forecasts based on magical thinking - Richard Denniss, Crikey 5/3/2015

From Dr. Alison Taylor, Principal Demographer, Queensland Treasury

The “3 Ps”: IGR’s central narrativeGDP = Population x Participation x Productivity
Four very problematic assumptions:
• Natural resources don’t matter.• Diluting, degrading and depleting them will not affect per capita
wealth, because they are not in the model.
• Job seekers create jobs.• The size of the economy will be proportional to the number of
working age people.
• The 3 factors are independent.• Population growth will not reduce participation (competition for
jobs) or productivity (competition for resources and markets).
• Growth rate costs nothing.• The infrastructure, equipment and professional personnel that
added people need will be created without penalty.

The first “P”: Population- but wealth is a per capita thing!• Did population growth help Australia avoid the GFC?
• Negative per capita growth for >4 quarters – made deeper by population growth.
• Population growth delinks GDP from wealth.
GDP versus Per Capita GDP
Date
2004 2006 2008 2010 2012
pe
r ce
nt
ch
an
ge
-0.5
0.0
0.5
1.0
1.5
2.0
% change in GDP in each Quarter
% change in GDP per capita in Quarter
Population growth rate (annualised percentage)
Population growth rate % annualised
% change in GDP per Quarter
% change in GDP per capitaper Quarter

The second “P”: Participation
• Assumes “Job seekers create jobs”!• Theory that a larger proportion of working age
people means a larger workforce.• (Bernard Salt uses the words interchangeably.)
• “Workforce participation measures labour supply”(or is it a product of supply, demand, cultural expectations, cost-of-living pressures, welfare options, terms of trade…)
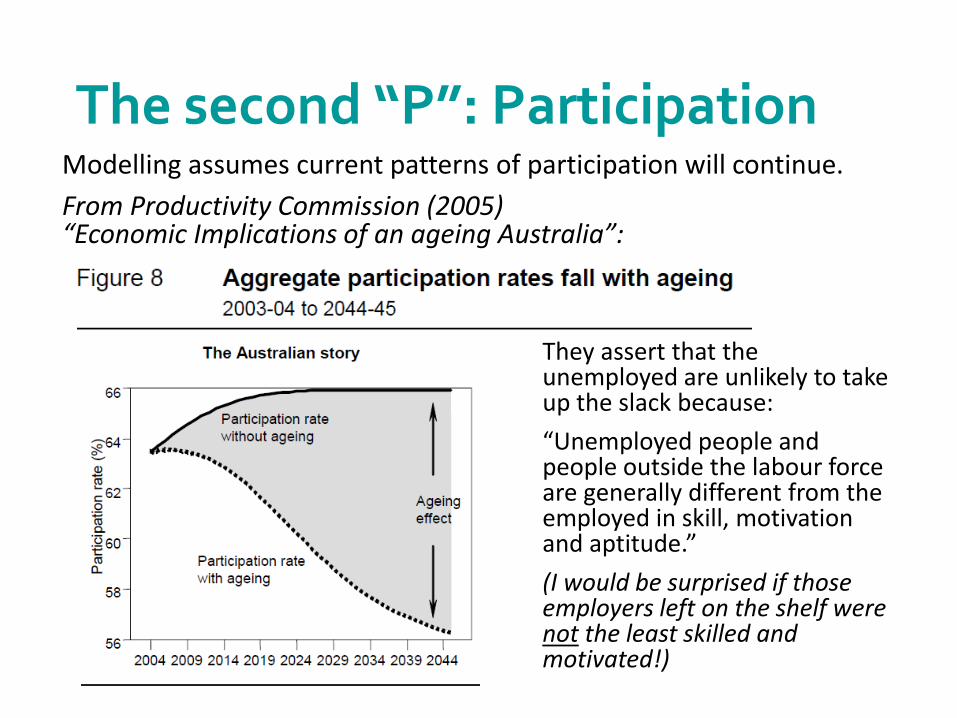
The second “P”: Participation
They assert that the unemployed are unlikely to take up the slack because:
“Unemployed people and people outside the labour force are generally different from the employed in skill, motivation and aptitude.”
(I would be surprised if those employers left on the shelf were not the least skilled and motivated!)
Modelling assumes current patterns of participation will continue.
From Productivity Commission (2005) “Economic Implications of an ageing Australia”:

The real world experiment• Is the proportion of people employed governed by the supply of people of
working age, or by the supply of work?
• There is no correlation between ageing and proportion of people employed.
2D Graph 2
Old age dependency ratio (%65+/15to64yrs)
18 20 22 24 26 28 30 32 34 36 38
% e
mp
loyed o
f to
tal popula
tion
40
42
44
46
48
50
52
54
56
USA
AUSTRALIACANADA
NORWAY
DENMARK
UK
FRANCE
FINLAND
SWEDEN
GERMANY
JAPAN
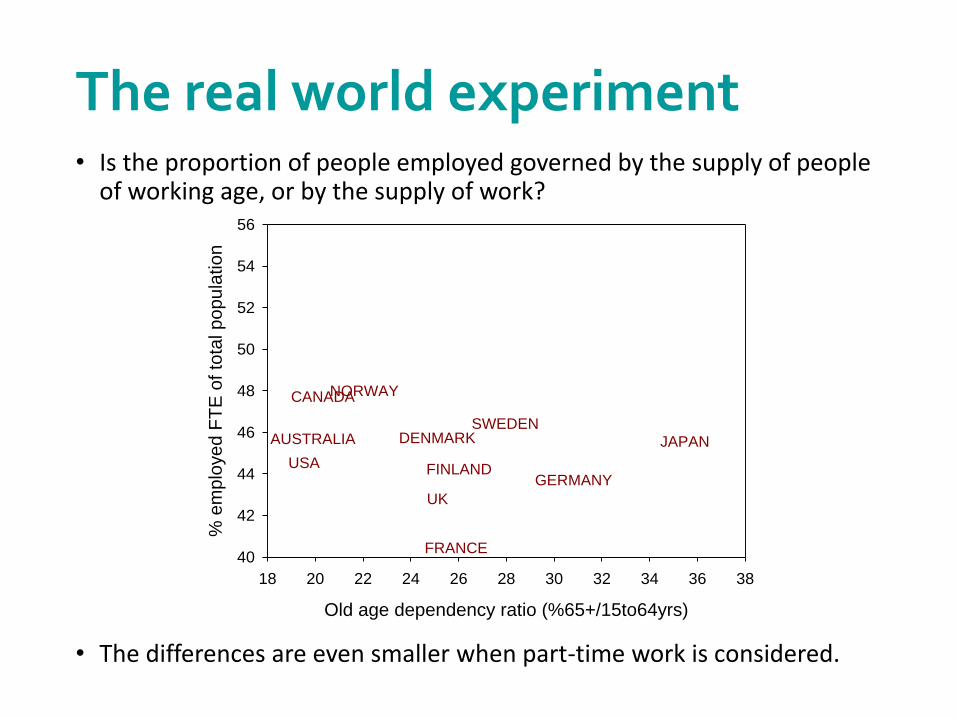
The real world experiment• Is the proportion of people employed governed by the supply of people
of working age, or by the supply of work?
• The differences are even smaller when part-time work is considered.
2D Graph 2
Old age dependency ratio (%65+/15to64yrs)
18 20 22 24 26 28 30 32 34 36 38
% e
mp
loye
d F
TE
of
tota
l p
op
ula
tio
n
40
42
44
46
48
50
52
54
56
USA
AUSTRALIA
CANADANORWAY
DENMARK
UK
FRANCE
FINLAND
SWEDEN
GERMANY
JAPAN

Myth 1: that we’ll all be stranded in our nursing homes
with no-one left to look after us.
Myth 2: that increasing immigration will keep us young.
Myth 3: that a smaller proportion of working-age
people means fewer people actually working.

The third “P”: Productivity• Does population growth increase productivity?
• There is no trend among nations, nor among municipalities (USA).
2D Graph 2
Population growth rate, % p.a. 2000-2010
-0.2 0.0 0.2 0.4 0.6 0.8 1.0 1.2 1.4 1.6 1.8
GN
I per
capita g
row
th, %
p.a
. 2000-2
010
0.4
0.6
0.8
1.0
1.2
1.4
1.6
1.8
2.0
USA
AUSTRALIA
CANADANORWAY
DENMARK
UK
FRANCE
FINLAND
SWEDEN
GERMANY
JAPAN
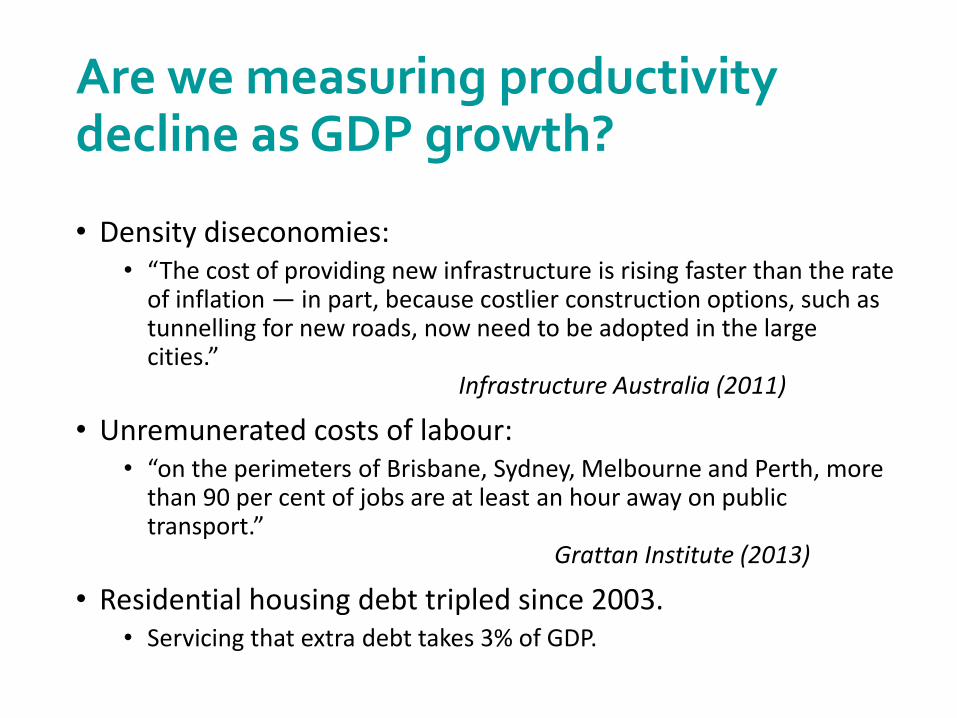
Are we measuring productivity decline as GDP growth?
• Density diseconomies:• “The cost of providing new infrastructure is rising faster than the rate
of inflation — in part, because costlier construction options, such as tunnelling for new roads, now need to be adopted in the large cities.”
Infrastructure Australia (2011)
• Unremunerated costs of labour:• “on the perimeters of Brisbane, Sydney, Melbourne and Perth, more
than 90 per cent of jobs are at least an hour away on public transport.”
Grattan Institute (2013)
• Residential housing debt tripled since 2003.• Servicing that extra debt takes 3% of GDP.

What about wealth distribution?• The GINI coefficient measures inequality of income:
• The most youthful nations have the poorest poor.
• “Because immigration makes labour more abundant relative to the existing stock of capital and land, it tends to increase the returns to the latter at the expense of labour.”
– Productivity Commission 2011
• Greater inequality is associated with worse physical health, mental health, drug abuse, education, imprisonment, obesity, social mobility, trust and community life, violence, teenage pregnancies, and child well-being (Wilkinson & Pickett, “The Spirit Level” 2009)
2D Graph 2
Old Age Dependency Ratio (%65+/15to64yrs)
18 20 22 24 26 28 30 32 34 36 38
GIN
I co
eff
icie
nt
0.22
0.24
0.26
0.28
0.30
0.32
0.34
0.36
0.38
0.40
0.42
USA
AUSTRALIA
CANADA
NORWAY
DENMARK
UK
FRANCE
FINLAND
SWEDEN
GERMANY
JAPAN

Remeasuring Ageing
Data from Sanderson & Sherbov (2010) “Remeasuring Ageing” Science 329:1287-1288.
Remeasuring Ageing
USA Japan
2005-10 2025-30 2045-50 2005-10. 2025-30. 2045-50.
Ratio
0.0
0.2
0.4
0.6
0.8
1.0
Old Age Dependency: 65+ / 15-to-64
Adults with <15 years Life Expectancy / > 15 years
Adults with disability / able adults
Health and disability needs are more related to proximity to death than to age.
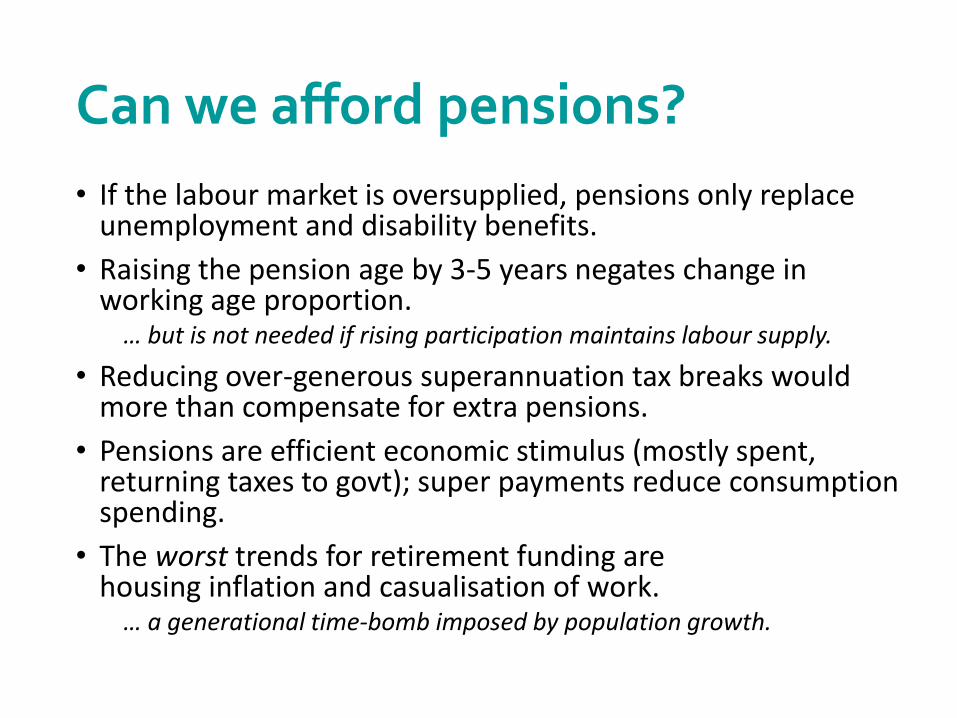
Can we afford pensions?
• If the labour market is oversupplied, pensions only replace unemployment and disability benefits.
• Raising the pension age by 3-5 years negates change in working age proportion.
… but is not needed if rising participation maintains labour supply.
• Reducing over-generous superannuation tax breaks would more than compensate for extra pensions.
• Pensions are efficient economic stimulus (mostly spent, returning taxes to govt); super payments reduce consumption spending.
• The worst trends for retirement funding are housing inflation and casualisation of work.
… a generational time-bomb imposed by population growth.

Myth 1: that we’ll all be stranded in our nursing homes
with no-one left to look after us.
Myth 2: that increasing immigration will keep us young.
Myth 3: that a smaller proportion of working-age people
means fewer people actually working.
Myth 4: that pension and health care costs will blow the
budget.
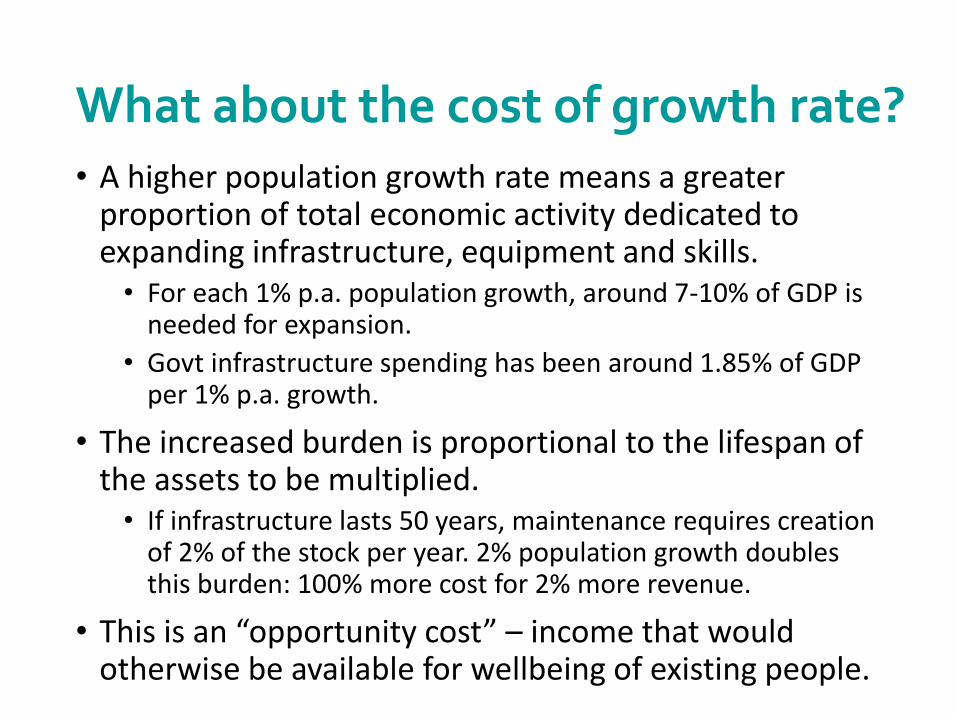
What about the cost of growth rate?• A higher population growth rate means a greater
proportion of total economic activity dedicated to expanding infrastructure, equipment and skills.
• For each 1% p.a. population growth, around 7-10% of GDP is needed for expansion.
• Govt infrastructure spending has been around 1.85% of GDP per 1% p.a. growth.
• The increased burden is proportional to the lifespan of the assets to be multiplied.
• If infrastructure lasts 50 years, maintenance requires creation of 2% of the stock per year. 2% population growth doubles this burden: 100% more cost for 2% more revenue.
• This is an “opportunity cost” – income that would otherwise be available for wellbeing of existing people.

Cost of ageing vs. growth• Difference in all age-related costs between stabilising
around 25 million (IGR1) and “Big Australia” projection (IGR3) is 1% of GDP by 2050.
• Public infrastructure cost of growth has historically been around 2.6% of GDP (1.85% per 1% population growth) but is currently over 3.3% an rising. (Not included in the IGRs.)
• Expect energy and materials costs to outpace inflation –better to have a labour-intensive burden (health) than resource-intensive (construction).
• More than doubles the cost of decarbonising the economy.
• Non-monetary costs: loss of biodiversity, food and water security, public amenity and quality of life.
Myth 1: that we’ll all be stranded in our nursing homes
with no-one left to look after us.
Myth 2: that increasing immigration will keep us young.
Myth 3: that a smaller proportion of working-age people
means fewer people actually working.
Myth 4: that pension and health care costs will blow the
budget.
Myth 5: High population growth will ease fiscal
pressures.

Misconception of ‘Investment’The two big ‘Nation-Building’ activities: Infrastructure
Skills Training
Both require expenditure up front, before their working life begins.
• “Investment” or “recurrent costs”?

Misconception of ‘Investment’The two big ‘Nation-Building’ activities: Infrastructure
Skills Training
Both require expenditure up front, before their working life begins.
• “Investment” or “recurrent costs”?
Val
ue
/ C
ost
of
All
Du
rab
le A
sset
s $
Year 1
Current inventory

Misconception of ‘Investment’The two big ‘Nation-Building’ activities: Infrastructure
Skills Training
Both require expenditure up front, before their working life begins.
• “Investment” or “recurrent costs”?
Year 2
Val
ue
/ C
ost
of
All
Du
rab
le A
sset
s $
Year 1

Misconception of ‘Investment’The two big ‘Nation-Building’ activities: Infrastructure
Skills Training
Both require expenditure up front, before their working life begins.
• “Investment” or “recurrent costs”?
Year 2
maintenance
expansion
improvement
Year 1
Val
ue
/ C
ost
of
All
Du
rab
le A
sset
s $

Misconception of ‘Investment’The two big ‘Nation-Building’ activities: Infrastructure
Skills Training
Both require expenditure up front, before their working life begins.
• “Investment” or “recurrent costs”?
Year 2
= investment(getting ahead)
maintenance
expansion
improvement
Year 1
recurrent cost(treading water)
}
Val
ue
/ C
ost
of
All
Du
rab
le A
sset
s $

If we fail to increase inventory at the same rate as population, the shortfall or ‘backlog’ rapidly reduces access to and quality of services for the whole population.
recurrent cost
investment
{actually builtwithin budget
infrastructure deficit or budget deficit
Year 1 Year 2
Val
ue
/ C
ost
of
All
Du
rab
le A
sset
s $
Treading water, or drowning?

Treading water, or drowning?
Year 1 Year 2 Year 3
actually builtwithin budget
infrastructure deficit or budget deficit
recurrent cost {
Val
ue
/ C
ost
of
All
Du
rab
le A
sset
s $
If we fail to increase inventory at the same rate as population, the shortfall or ‘backlog’ rapidly reduces access to and quality of services for the whole population.
If funded by debt, the repayments add to next year’s deficit.

Myth 1: that we’ll all be stranded in our nursing homes
with no-one left to look after us.
Myth 2: that increasing immigration will keep us young.
Myth 3: that a smaller proportion of working-age people
means fewer people actually working.
Myth 4: that pension and health care costs will blow the
budget.
Myth 5: High population growth will ease fiscal
pressures.
Myth 6: Expanding infrastructure is an investment that
will pay for itself in the future.

The “not yet added” are fully dependent on current workers
Australia
Uganda Japan
Young
Old
Young Young
Working age Working age Working age
Old Old
European Union
Young
Working age
Old
Uganda3.3% p.a.
Australia1.5% p.a.
European Union0.3% p.a.
Japan-0.1% p.a.
Young
Working age
Old
Young
Working age
Old
Young
Working age
Old
Young
Working age
OldNot yetadded
Not yetadded
Not yetadded
A: Gross National Income (GNI) distributed per capita to age categories
B: Inclusion of capacity expansion (on behalf of the not-yet-added) to distribution of GNI

How would you spend $30 Billion?• Each added person costs around $125,000 for public
infrastructure.
• Net immigration, not counting refugees, is around 240,000 per year.
• A balanced migration program would free up enough money for
• Restoring welfare and community services• Restoring university funding• Environmental rehabilitation programs• Renewable energy investment• Gonski reforms of education• Universal dental health• High speed rail etc• And much more…
What’s your preference?

The population policy balance?

The population policy balance?

The population policy balance?

Depopulation Dividends
Could a shrinking, ageing population be :
• Smarter? - greater proportion with higher ed.
• Cleaner? - fewer greenhouse gases.
• Richer? - concentration of inheritance.
• Healthier? - greater proportion of life in wellness.
• Happier? - more leisure in the life cycle.
Kluge et al. 2014. The Advantages of Demographic Change after the Wave: Fewer and Older, but Healthier, Greener, and More Productive? PLOS one 9(9): e108501.

Thank [email protected]