population and housing unit counts - census · south dakota: 2010 issued september 2012 population...
TRANSCRIPT

South Dakota: 2010
Issued September 2012
Population and Housing Unit Counts
U.S. Department of CommerceEconomics and Statistics Administration
U.S. CENSUS BUREAU
census.gov
CPH-2-43
2010 Census of Population and Housing


U.S. Department of Commerce Rebecca M. Blank,
Acting Secretary
Rebecca M. Blank, Deputy Secretary
Economics and Statistics Administration Vacant,
Under Secretary for Economic Affairs
U.S. CENSUS BUREAU Thomas L. Mesenbourg,
Acting Director
South Dakota: 2010 Issued September 2012
CPH-2-43Population and Housing Unit Counts

ECONOMICS
AND STATISTICS
ADMINISTRATION
Economics and Statistics Administration
Vacant, Under Secretary for Economic Affairs
U.S. CENSUS BUREAU
Thomas L. Mesenbourg, Acting Director
Nancy A. Potok, Deputy Director and Chief Operating Officer
Vacant, Associate Director for Demographic Programs
Enrique J. Lamas, Chief, Population Division
SUGGESTED CITATION
U.S. Census Bureau, 2010 Census of
Population and Housing, Population and
Housing Unit Counts,CPH-2-43, South Dakota
U.S. Government Printing Office, Washington, DC,
2012

Contents iii
CONTENTS
List of Statistical Tables . . . . . . . . . . . . . . . . . . . . . . . . . . . . . . . . . . . . . v How to Use This Census Report . . . . . . . . . . . . . . . . . . . . . . . . . . . . . . I-1 Table Finding Guide . . . . . . . . . . . . . . . . . . . . . . . . . . . . . . . . . . . . . . . II-1 User Notes . . . . . . . . . . . . . . . . . . . . . . . . . . . . . . . . . . . . . . . . . . . . . . III-1 Crosswalk of Urban Areas and Places: 2010 . . . . . . . . . . . . . . . . . . . . . IV-1 Statistical Tables . . . . . . . . . . . . . . . . . . . . . . . . . . . . . . . . . . . . . . . . . . 1
Appendixes
A Geographic Terms and Concepts . . . . . . . . . . . . . . . . . . . . . . . . . *B Definitions of Subject Characteristics . . . . . . . . . . . . . . . . . . . . . . *C Data Collection and Processing Procedures . . . . . . . . . . . . . . . . . . *D Questionnaire . . . . . . . . . . . . . . . . . . . . . . . . . . . . . . . . . . . . . . . . *E Maps . . . . . . . . . . . . . . . . . . . . . . . . . . . . . . . . . . . . . . . . . . . . . . E-1F Operational Overview and Accuracy of the Data . . . . . . . . . . . . . . *G Residence Rule and Residence Situations for the 2010 Census of the United States . . . . . . . . . . . . . . . . . . . . . . . . . . . . . . . . . . *H Acknowledgments . . . . . . . . . . . . . . . . . . . . . . . . . . . . . . . . . . . . *
*Appendix may be found in the separate volume, CPH-2-A, Population and Housing Unit Counts, Selected Appendixes, in print and on the Internet at <www.census.gov /prod/cen2010/cph-2-a.pdf>.


List of Statistical Tables v
LIST OF STATISTICAL
TABLES
Table no. Title Page
1. Population: Earliest Census to 2010; and Housing Units: 1950 to 2010 . . . . . . . . . . . . . . . . . . . . . . . . . . . . . . . . . . . . . 1 State, Urban and Rural
2. Population, Housing Units, and Land Area by Urban and Rural and Size of Urban Area: 2010 . . . . . . . . . . . . . . . . . . . 2 State, Urban and Rural, Size of Urban Area [Population]
3. Population by Urban and Rural and Size of Place: 2010 . . . 4 State, Size of Place [Population]
4. Population and Housing Units: 1970 to 2010 . . . . . . . . . . . . 6 State, County/County Equivalent
5. Population, Housing Units, Land Area, and Density: 2010; and Percent Change: 1980 to 2010 . . . . . . . . . . . . . . . . . . . . 7 State, County/County Equivalent
6. Rank of Counties by Percent Change in Population: 2000 to 2010 . . . . . . . . . . . . . . . . . . . . . . . . . . . . . . . . . . . . . . 8 County/County Equivalent
7. Population by Urban and Rural: 2010 . . . . . . . . . . . . . . . . . . 9 State, County/County Equivalent
8. Population and Housing Units: 1990 to 2010; and Area Measurements and Density: 2010 . . . . . . . . . . . . . . . . . . . . 10 State, County/County Equivalent, County Subdivision, Place
9. Population and Housing Units: 1990 to 2010; and Area Measurements and Density: 2010 . . . . . . . . . . . . . . . . . . . . 32 State, Place and [in Selected States] County Subdivision
10. Rank by 2010 Population and Housing Units: 2000 and 2010 . . . . . . . . . . . . . . . . . . . . . . . . . . . . . . . . . . . . 44 Place [2,500 or More Population]
11. Rank of Places by Percent Change in Population: 2000 to 2010 . . . . . . . . . . . . . . . . . . . . . . . . . . . . . . . . . . . . . . 45 Place [2,500 or More Population]
12. Population and Housing Units for Urban Areas: 2010 . . . . . 46 State, Urbanized Area, Urban Cluster


How to Use This Census Report I-1U.S. Census Bureau, 2010 Census
How to Use This Census Report
CONTENTS
Page
Introduction . . . . . . . . . . . . . . . . . . . . . . . . . . . . . . . . . . . . . . . . . . . . . . . . . . . . . . . . . . . . . . . . . . I-1
How to Find Geographic Areas and Subject Matter Data . . . . . . . . . . . . . . . . . . . . . . . . . . . . . . . . . I-2
How to Use the Statistical Tables . . . . . . . . . . . . . . . . . . . . . . . . . . . . . . . . . . . . . . . . . . . . . . . . . . . I-2
Graphics . . . . . . . . . . . . . . . . . . . . . . . . . . . . . . . . . . . . . . . . . . . . . . . . . . . . . . . . . . . . . . . . . . . . . I-5
User Notes . . . . . . . . . . . . . . . . . . . . . . . . . . . . . . . . . . . . . . . . . . . . . . . . . . . . . . . . . . . . . . . . . . . I-5
Appendixes . . . . . . . . . . . . . . . . . . . . . . . . . . . . . . . . . . . . . . . . . . . . . . . . . . . . . . . . . . . . . . . . . . I-5
INTRODUCTION
Data from the 2010 Census for the United States and Puerto Rico are presented in two printed report series and a single report for American Indians and Alaska Natives by tribe:
1. CPH-1, Summary Population and Housing Characteristics
2. CPH-2, Population and Housing Unit Counts
3. CPH-3, Characteristics of American Indians and Alaska Natives by Tribe
The data from the 2010 Census were derived from a limited number of basic questions asked of the entire population and about every housing unit. Appendix D (see Selected Appendixes report at <www.census .gov/prod/cen2010/cph-2-a.pdf>) presents a facsimile of the questionnaire pages used to collect the data included in this report. Note that the “long form” data included in previous censuses are not included in the 2010 Census.
The CPH-1, Summary Population and Housing Characteristics, report series provides data based on age, Hispanic or Latino origin, household relationship, race, sex, tenure (owner- or renter-occupied), and vacancy characteristics. Land area measurements and population density also are provided. This series is similar to the Census 2000 PHC-1 series.
The CPH-2, Population and Housing Unit Counts, report series provides 2010 Census and historical com-parisons of the population and housing unit counts. It also provides area measurements and density. The user notes section documents geographic changes over the past decade. This series is similar to the Census 2000 PHC-3 series.
In each series, there is one report for each state, the District of Columbia, and Puerto Rico, plus a United States summary report. Many tables in the United States summary reports include data for Puerto Rico.
The CPH-3, Characteristics of American Indians and Alaska Natives by Tribe, report provides population and housing information for selected American Indian and Alaska Native tribes. This report is similar to the Census 2000 PHC-5 report. This is a single report covering the entire United States.

I-2 How to Use This Census ReportU.S. Census Bureau, 2010 Census
HOW TO FIND GEOGRAPHIC AREAS AND SUBJECT MATTER DATA
This report includes a table finding guide to assist the user in locating those statistical tables that contain the desired data. The table finding guide lists alphabetically, by geographic area, the subjects shown in this report. To determine which tables in this report show data for a particular topic, find the subject in the left-hand column of the table finding guide and then look across the columns using the headings at the top for the desired type of geographic area. Figure I-1 is an example of a table finding guide.
The table finding guide does not include cross-classification of subject-matter items. Additional informa-tion to locate data within specific reports is provided in the headnote at the top of the table finding guide and in the footnotes at the bottom of the guide.
HOW TO USE THE STATISTICAL TABLES
Parts of a Statistical Table
The census data included in printed reports are arranged in tables. Each table includes four major parts: (1) heading, (2) boxhead, (3) stub, and (4) data field. A typical census report table is illustrated in Figure I-2.
The heading consists of the table number, title, and headnote. The table number indicates the position of the table within the report, while the title is a brief statement indicating the subjects and time reference of the data presented in the table. The headnote is enclosed in brackets and is located under the title. It contains statements that qualify, explain, or provide information pertaining to the entire table.
Figure I-1.
Table Fin
din
g G
uid
e II-1
U.S. C
ensu
s Bureau
, 20
10
Cen
sus
Geographic area
Population Housing units Area measurement
Average per square mile of land (density)
Number of places 2010 Census
Previous censuses
Change from
previous census 2010 Census
Previous censuses
Change from
previous census Total area Land area Population
Housing units
THE STATE1
Total . . . . . . . . . . . . . . . . . . . . . . . . . . . . . 1,2,3,4,5,7,8,9,12 1,4,8,9 1,5,9 1,2,4,5,8,9,12 1,4,8,9 1,5,9 8,9 2,5,8,9 5,8,9 5,8,9 1,3Urban and rural . . . . . . . . . . . . . . . . . . . . 1,2,3,7,12 1 1 1,2,12 1 1 – 2 – – 3Current urban definition . . . . . . . . . . . . . . 1,2,7,12 1 1 1,2,12 1 1 – 2 – – –1950–90 urban definition . . . . . . . . . . . . . 1 1 1 1 1 1 – – – – –Urban and rural by size of place . . . . . . . 3 – – – – – – – – – 3In urbanized area and in urban cluster . . 2,7,12 – – 2,12 – – – 2 – – –Size of urban area . . . . . . . . . . . . . . . . . . 2 – – 2 – – – 2 – – –In place and not in place . . . . . . . . . . . . . 3,7 – – – – – – – – – 3
COUNTY2
Total . . . . . . . . . . . . . . . . . . . . . . . . . . . . . 4,5,6,8 4,6,8 5,6 4,8 4,8 5 8 5,8 5,8 5,8 –Urban and rural . . . . . . . . . . . . . . . . . . . . 7 – – – – – – – – – –By percent change rank . . . . . . . . . . . . . . 6 6 6 – – – – – – – –
COUNTY SUBDIVISION3
By county . . . . . . . . . . . . . . . . . . . . . . . . . 8 8 – 8 8 – 8 8 8 8 –Alphabetically . . . . . . . . . . . . . . . . . . . . . 9 9 9 9 9 9 9 9 9 9 –By 2010 rank . . . . . . . . . . . . . . . . . . . . . . 10a 10a – 10a 10a – – – – – –By percent change rank . . . . . . . . . . . . . . 11a 11a 11a – – – – – – – –
PLACE
By county and county subdivision . . . . . . 8 8 – 8 8 – 8 8 8 8 –Alphabetically . . . . . . . . . . . . . . . . . . . . . 9 9 9 9 9 9 9 9 9 9 –By 2010 rank . . . . . . . . . . . . . . . . . . . . . . 10 10 – 10 10 – – – – – –By percent change rank . . . . . . . . . . . . . . 11 11 11 – – – – – – – –
URBAN AREA
Urbanized area and urban cluster . . . . . . 12 – 12 – – – – – – – –1 State, District of Columbia, or Puerto Rico .2 Parish in Louisiana; city and borough, municipality, borough, or census area in Alaska; and municipio in Puerto Rico; in Maryland, Missouri, Nevada, and Virginia, one or more cities
are independent of counties and are treated as statistical equivalents of counties; the entire District of Columbia, which has no counties, is treated as a county equivalent .3 County subdivisions within the state are shown alphabetically with places for the following 12 states: Connecticut, Maine, Massachusetts, Michigan, Minnesota, New Hampshire,
New Jersey, New York, Pennsylvania, Rhode Island, Vermont, and Wisconsin .
Table Finding Guide
SUBJECTS BY TYPE OF GEOGRAPHIC AREA AND TABLE NUMBER
The types of geographic areas covered in this report are shown on the side, and subjects are shown at the top. See CPH-2-A, Population and Housing Unit Counts, Selected Appendixes (<www.census.gov/prod/cen2010/cph-2-a.pdf>), for a description of area classifications (Appendix A) and for definitions and explanations of subject characteristics (Appendix B).

How to Use This Census Report I-3U.S. Census Bureau, 2010 Census
The boxhead is under the heading. This portion of the table, which contains the individual column heads or captions, describes the data in each vertical column. In the boxhead of many tables, a spanner appears across and above two or more column heads or across two or more lower spanners. The purpose of a spanner is to classify or qualify items below it or separate the table into identifiable blocks in terms of major aspects of the data.
The stub is located at the left edge of the table. It includes a listing of line or row captions or descriptions. At the top of the stub is the stubhead. The stubhead is considered to be an extension of the table title and usually shows generic geographic area designations and restrictions.
Race in combination with one or more other races Race alone or in combination with one or more other races
Asian
NativeHawaiian
and OtherPaci�c
Islander
AmericanIndian
andAlaskaNative
SomeOther Race
Black orAfrican
AmericanWhite White
Black orAfrican
American
AmericanIndian
andAlaskaNative Asian
NativeHawaiian
and OtherPaci�c
IslanderSome
Other Race
Table 6.
[For information on con�dentiality protection, nonsampling error, and de�nitions, see Selected Appendixes at <www.census.gov/prod/cen2010/cph-1-a.pdf>]
Population for Selected Categories of Race: 2010
StateCountyPlace
18,775 14,109 5,718 5,152 816 5,026 637,392 205,923 33,7019,899 1,216 35,545 Delaware.........................................................
COUNTY
4,523 3,595 1,558 1,215 215 838 114,522 42,508 4,5212,601 306 4,073 Kent County.........................................................10,502 7,949 2,895 3,333 409 3,171 363,457 135,735 26,6334,469 568 22,286 New Castle County............................................
3,750 2,565 1,265 604 192 1,017 159,413 27,680 2,5472,829 342 9,186 Sussex County.....................................................
PLACE
3 1 1 2 0 1 428 6 33 0 3 Arden village, New Castle County.................1 0 0 1 0 0 199 21 120 0 0 Ardencroft village, New Castle County..........8 2 0 5 0 2 256 4 110 0 2 Ardentown village, New Castle County.........
522 447 149 132 11 201 10,298 7,129 944211 16 1,527 Bear CDP, New Castle County........................13 5 2 5 2 7 1,096 80 194 3 9 Bellefonte town, New Castle County.............
5 3 1 1 0 0 1,054 5 51 0 0 Bethany Beach town, Sussex County...........2 2 0 0 0 0 164 8 10 0 0 Bethel town, Sussex County...........................
45 46 6 0 3 7 802 391 1015 3 74 Blades town, Sussex County............................3 1 1 1 0 1 318 7 54 0 5 Bowers town, Kent County.............................
62 51 16 8 5 12 1,391 545 1419 7 152 Bridgeville town, Sussex County...................
445 325 118 80 35 125 10,218 3,070 529172 37 912 Brookside CDP, New Castle County.............124 104 49 52 0 13 2,413 920 18060 1 63 Camden town, Kent County............................
50 32 32 12 10 13 793 497 4668 10 47 Cheswold town, Kent County........................149 112 34 32 5 25 5,435 2,344 34762 14 240 Claymont CDP, New Castle County..............
73 73 21 16 1 13 2,105 791 3327 1 63 Clayton town........................................................73 73 21 16 1 13 2,105 791 3327 1 63 Kent County (part)............................................
0 0 0 0 0 0 0 0 00 0 0 New Castle County (part)..............................
17 16 4 3 0 2 706 69 312 0 36 Dagsboro town, Sussex County....................64 46 16 5 0 5 1,473 231 2217 0 20 Delaware City city, New Castle County..........75 67 21 7 1 4 1,281 344 1827 1 19 Delmar town, Sussex County..........................
4 3 0 0 1 0 318 12 11 3 10 Dewey Beach town, Sussex County.............1,053 1,097 375 328 52 195 18,446 16,312 1,310571 75 960 Dover city, Kent County...................................
216 122 47 85 23 37 2,699 580 16355 32 200 Dover Base Housing CDP, Kent County........99 115 39 9 1 16 3,499 2,089 7258 1 99 Edgemoor CDP, New Castle County............
8 13 6 3 2 0 242 125 56 4 15 Ellendale town, Sussex County.....................165 123 44 33 0 116 4,435 925 13992 0 786 Elsmere town, New Castle County................
0 0 0 0 0 0 110 0 00 0 0 Farmington town, Kent County........................48 38 12 3 0 12 998 290 2520 1 23 Felton town, Kent County.................................
1 0 1 0 0 0 371 2 31 0 3 Fenwick Island town, Sussex County............10 11 4 0 2 5 407 249 114 2 190 Frankford town, Sussex County....................32 33 14 2 0 7 558 183 914 1 57 Frederica town, Kent County.........................
200 85 51 8 2 133 3,191 1,018 78328 11 2,038 Georgetown town, Sussex County................312 276 71 121 6 67 9,505 3,862 937119 10 309 Glasgow CDP, New Castle County................
24 10 3 22 0 6 2,018 121 1903 0 28 Greenville CDP, New Castle County.............28 12 17 5 0 0 718 211 1117 0 48 Greenwood town, Sussex County.................
120 102 55 15 10 15 2,568 931 4376 14 94 Harrington city, Kent County.........................0 0 0 0 0 0 72 0 01 1 0 Hartly town, Kent County..................................0 0 0 0 0 0 118 3 10 0 0 Henlopen Acres town, Sussex County..........
96 71 24 44 7 14 2,725 579 18945 10 45 Highland Acres CDP, Kent County................
188 38 38 132 8 31 11,712 434 1,42959 17 102 Hockessin CDP, New Castle County............2 2 0 1 0 1 346 22 42 0 3 Houston town, Kent County..........................
51 38 17 17 1 8 1,302 505 6529 1 55 Kent Acres CDP, Kent County.........................8 6 2 0 0 0 242 12 02 0 13 Kenton town, Kent County..............................
135 155 33 38 15 37 1,889 1,668 7275 33 188 Laurel town, Sussex County............................6 6 0 0 0 0 170 9 04 0 6 Leipsic town, Kent County...............................
34 26 17 4 1 1 2,502 237 1427 3 10 Lewes city, Sussex County................................5 1 4 0 0 0 214 6 17 0 1 Little Creek town, Kent County........................6 3 5 0 0 1 1,896 44 710 0 31 Long Neck CDP, Sussex County....................7 2 4 2 0 1 182 28 314 0 6 Magnolia town, Kent County.........................
457 405 107 132 19 131 12,145 5,772 841143 27 597 Middletown town, New Castle County...........
189 176 65 27 23 60 6,404 2,304 137115 45 838 Milford city............................................................93 91 24 8 8 41 1,906 1,526 4653 13 374 Kent County (part)............................................96 85 41 19 15 19 4,498 778 9162 32 464 Sussex County (part).......................................
90 97 29 20 7 23 2,863 792 14949 7 154 Millsboro town, Sussex County.....................9 1 1 7 0 0 515 14 111 0 12 Millville town, Sussex County........................
75 76 20 3 0 12 2,027 497 1838 1 92 Milton town, Sussex County............................626 318 141 325 31 112 26,532 2,412 2,570194 41 519 Newark city, New Castle County...................101 95 39 19 2 31 3,660 1,530 8057 2 105 New Castle city, New Castle County.............
29 26 6 5 2 9 744 220 219 2 100 Newport town, New Castle County................83 20 8 61 0 27 7,066 270 68711 0 48 North Star CDP, New Castle County.............17 8 6 5 1 3 1,835 24 297 1 8 Ocean View town, Sussex County................12 10 4 5 0 2 334 35 94 0 2 Odessa town, New Castle County..................
20 Delaware Summary Population and Housing CharacteristicsU.S. Census Bureau, 2010 Census
Figure I-2.
PARTS OF A STATISTICAL TABLETable number and title Headnote
Heading
Stubhead
Stub
Sidehead
State name andpage number Report title
Spanner
Column head
Boxhead
Data field

I-4 How to Use This Census ReportU.S. Census Bureau, 2010 Census
In the stub, several features are used to help the user better understand the contents of the table. Usually, a block of data lines is preceded by a sidehead. The sidehead, similar to a spanner, describes and classifies the stub entries following it. The use of indentation in a stub indicates the relationship of one data line to another. Indented data lines represent subcategories that, in most instances, sum to a total. Occasionally in tables, it is desirable to show one or more single-line subcategories that do not sum to the total.
The data field is that part of the statistical table that contains the data. It extends from the bottom of the boxhead to the bottom of the table and from the right of the stub to the right edge of the page.
Both geographic and subject-matter terms appear in tables. It is important to read the definitions of the terms used in the tables because census terms often are defined in special ways that reflect the manner in which the questions were asked and the data were tabulated. Definitions of geographic terms are provided in Appendix A of CPH-2-A, Population and Housing Unit Counts, Selected Appendixes (<www.census.gov /prod/cen2010/cph-2-a.pdf>). Census tables often include derived measures such as medians, means, per-centages, and ratios. These and other subject-matter terms are defined in Appendix B of the same report.
Symbols and Geographic Abbreviations
The following symbols are used in the tables and explanations of subjects covered in 2010 Census reports:
• A dash ‘‘–’’ represents zero or a derived measure that rounds to less than 0.1.
• (X) means not applicable. In the 1990 and earlier decennial census reports, three dots ‘‘. . . ’’ meant not applicable.
• (NA) means not available.
• The superscript prefix ‘‘r’’ indicates that a Census 2000 count has been revised since the publication of the Census 2000 reports as a result of certified Count Question Resolution (CQR) changes (see also <www.census.gov/prod/cen2000/notes/errata.pdf>). This symbol appears only in the 2010 Census CPH-2, Population and Housing Unit Counts, report series.
• A minus sign ‘‘–’’ preceding a figure denotes decrease. The minus sign appears only in the 2010 Census CPH-2, Population and Housing Unit Counts, report series.
The following are examples of geographic abbreviations and terms that may be used in the tables in this report:
• A ‘‘(part)’’ next to the name of a geographic area in a hierarchical presentation indicates that the geo-graphic entity is located only partially in the superior geographic entity. For example, a ‘‘(part)’’ next to a place name in a county subdivision-place hierarchy indicates that the place is located in more than one county subdivision. (Places also may be ‘‘split’’ by county, congressional district, urban/rural, metropoli-tan area, voting district, and other geographic boundaries, depending on the presentation.) Other geo-graphic entities also can be ‘‘split’’ by a higher-level entity. The exception is a tabulation block, which is unique within all geographic entities in census products.
• ANVSA is Alaska Native village statistical area.
• ANRC is Alaska Native Regional Corporation.
• CCD is census county division.
• CDP is census designated place.
• CSA is combined statistical area.
• NECTA is New England city and town area.
• Metro Area is metropolitan statistical area.

How to Use This Census Report I-5U.S. Census Bureau, 2010 Census
• Micro Area is micropolitan statistical area.
• OTSA is Oklahoma tribal statistical area.
• SDTSA is state designated tribal statistical area.
• TDSA is tribal designated statistical area.
• UT is unorganized territory.
GRAPHICS
Charts, statistical maps, and other graphic summaries are included in some 2010 Census reports.
USER NOTES
User notes include general explanatory information, historical notes, and geographic notes. They also pro-vide information about unique characteristics of the report and sometimes changes or corrections made too late to be reflected in the text or tables themselves. However, sometimes this information becomes available too late to be reflected even in the user notes. Therefore, updates are available in the Notes and Errata document at <www.census.gov/prod/cen2010/notes/errata.pdf>.
APPENDIXES
Appendixes A through D, and F through H, described below, are in the separate printed volume, CPH-2-A, Population and Housing Unit Counts, Selected Appendixes, or on the Internet at <www.census.gov/prod /cen2010/cph-2-a.pdf>. Appendix E is included in this report.
Appendix A, Geographic Terms and Concepts. Provides definitions of the types of geographic areas and related information used in census products.
Appendix B, Definitions of Subject Characteristics. Contains definitions for the subject-matter terms used in census products, including explanations of derived measures, limitations of the data, and com-parability with previous censuses. The subjects are listed alphabetically. Population characteristics are defined first, followed by the definitions of the housing subjects.
Appendix C, Data Collection and Processing Procedures. Explains the 2010 Census mission and scope and provides thumbnail descriptions of 2010 Census operations.
Appendix D, Questionnaire. Presents a facsimile of the 2010 Census questionnaire used to collect the data in this report.
Appendix E, Maps. Contains maps depicting the geographic areas shown in this report.
Appendix F, Operational Overview and Accuracy of the Data. Provides information on 2010 Census operations, including group quarters enumeration, confidentiality of the data, imputation of housing unit status and population counts, sources of errors in the data, and data editing.
Appendix G, Residence Rule and Residence Situations for the 2010 Census of the United States. Contains a description of the residence rule and residence situations used by Census Bureau staff to guide decisions on where people should be counted in the 2010 Census. This document is the basis for residence-related sections of questionnaires, collection instruments, field materials, and training materials.
Appendix H, Acknowledgments. Lists many of the U.S. Census Bureau staff who participated in report preparation.


Table Finding Guide
SUBJECTS BY TYPE OF GEOGRAPHIC AREA AND TABLE NUMBER
The types of geographic areas covered in this report are shown on the side, and subjects are shown at the top. See CPH-2-A, Population and Housing Unit Counts, Selected Appendixes (<www.census.gov/prod/cen2010/cph-2-a.pdf>), for a description of area classifications (Appendix A) and for definitions and explanations of subject characteristics (Appendix B).
Table Fin
din
g G
uid
e II-1
U.S. C
ensu
s Bureau
, 20
10
Cen
sus
Geographic area
Population Housing units Area measurement
Average per square mile of land (density)
Number of places 2010 Census
Previous censuses
Change from
previous census 2010 Census
Previous censuses
Change from
previous census Total area Land area Population
Housing units
THE STATE1
Total . . . . . . . . . . . . . . . . . . . . . . . . . . . . . 1,2,3,4,5,7,8,9,12 1,4,8,9 1,5,9 1,2,4,5,8,9,12 1,4,8,9 1,5,9 8,9 2,5,8,9 5,8,9 5,8,9 1,3Urban and rural . . . . . . . . . . . . . . . . . . . . 1,2,3,7,12 1 1 1,2,12 1 1 – 2 – – 3Current urban definition . . . . . . . . . . . . . . 1,2,7,12 1 1 1,2,12 1 1 – 2 – – –1950–90 urban definition . . . . . . . . . . . . . 1 1 1 1 1 1 – – – – –Urban and rural by size of place . . . . . . . 3 – – – – – – – – – 3In urbanized area and in urban cluster . . 2,7,12 – – 2,12 – – – 2 – – –Size of urban area . . . . . . . . . . . . . . . . . . 2 – – 2 – – – 2 – – –In place and not in place . . . . . . . . . . . . .
COUNTY2
3,7 – – – – – – – – – 3
Total . . . . . . . . . . . . . . . . . . . . . . . . . . . . . 4,5,6,8 4,6,8 5,6 4,8 4,8 5 8 5,8 5,8 5,8 –Urban and rural . . . . . . . . . . . . . . . . . . . . 7 – – – – – – – – – –By percent change rank . . . . . . . . . . . . . .
COUNTY SUBDIVISION3
6 6 6 – – – – – – – –
By county . . . . . . . . . . . . . . . . . . . . . . . . . 8 8 – 8 8 – 8 8 8 8 –Alphabetically . . . . . . . . . . . . . . . . . . . . . 9 9 9 9 9 9 9 9 9 9 –By 2010 rank . . . . . . . . . . . . . . . . . . . . . . 10a 10a – 10a 10a – – – – – –By percent change rank . . . . . . . . . . . . . .
PLACE
11a 11a 11a – – – – – – – –
By county and county subdivision . . . . . . 8 8 – 8 8 – 8 8 8 8 –Alphabetically . . . . . . . . . . . . . . . . . . . . . 9 9 9 9 9 9 9 9 9 9 –By 2010 rank . . . . . . . . . . . . . . . . . . . . . . 10 10 – 10 10 – – – – – –By percent change rank . . . . . . . . . . . . . .
URBAN AREA
11 11 11 – – – – – – – –
Urbanized area and urban cluster . . . . . . 12 – 12 – – – – – – – –1 State, District of Columbia, or Puerto Rico .2 Parish in Louisiana; city and borough, municipality, borough, or census area in Alaska; and municipio in Puerto Rico; in Maryland, Missouri, Nevada, and Virginia, one or more cities
are independent of counties and are treated as statistical equivalents of counties; the entire District of Columbia, which has no counties, is treated as a county equivalent .3 County subdivisions within the state are shown alphabetically with places for the following 12 states: Connecticut, Maine, Massachusetts, Michigan, Minnesota, New Hampshire,
New Jersey, New York, Pennsylvania, Rhode Island, Vermont, and Wisconsin .


User Notes III-1U.S. Census Bureau, 2010 Census
User Notes
Additional information concerning this 2010 Census product may become available after this report is published. This information, called Notes and Errata, is available in portable document format (PDF) on the U.S. Census Bureau’s Internet site at <www.census.gov/prod/cen2010/notes/errata.pdf>.
GENERAL NOTES
User Note 1
The user should be aware that there are limitations to many of these data. Please refer to the text provided with this report for further explanation of the limitations of the data. The population and other data shown for the 2010 Census in this report are as of April 1, 2010; the boundaries used for all geographic entities are as of January 1, 2010. All boundaries are intended for Census Bureau statistical data collection and pre-sentation only; their depiction and designation for statistical purposes do not constitute a determination of jurisdictional authority or entitlement. Corrections to the 2010 Census data as a result of certified Count Question Resolution (CQR) changes are available from the Census Bureau’s Internet site at <www.census .gov/prod/cen2010/notes/errata.pdf>.
User Note 2
Data comparability for county subdivisions is shown only when the county subdivision contains sub-stantially the same territory as reported for Census 2000 (generally defined as at least 60 percent of the previous territory). There is no comparability provided for county subdivisions that have been extensively revised. Revised entities are noted by and within county. Changes to a geographic entity can be the result of legal change actions, statistical redefinition, correction of previous boundary or drafting errors, or new erroneous information.
Incorporated place and census designated place (CDP) comparability is provided for all places that retained their name or general area without regard to the amount of territorial change between censuses. Place comparability is not shown if the entity is new for the 2010 Census or is the result of a merger that cre-ated an entirely new entity, or if a 2010 Census geographic area shares no area with a Census 2000 area of the same name. American Indian area (including tribal subdivisions), Alaska Native area, and Hawaiian home land comparability follows the same rules as for place comparability.
User Note 3
When applicable, tables show the revised Census 2000 population and/or housing unit counts that resulted from the Count Question Resolution (CQR) program. These revised counts are accompanied by a prefix “r” symbol in the data tables.
Derived values (e.g., percent distribution, density, or change) that are calculated from Census 2000 popu-lation or housing unit counts only account for the aforementioned CQR revisions in certain cases.
• Calculations include the corrected Census 2000 counts when a table:
º Shows population or housing unit change (or percent change) from 2000 to 2010.
º Shows population or housing unit change (or percent change) from 1990 to 2000, and also shows the 2000 population or housing unit count that it is derived from.
º Shows population or housing unit density or percent distribution in 2000, and also shows the 2000 population or housing unit count that it is derived from.

III-2 User NotesU.S. Census Bureau, 2010 Census
• Calculations do not include the corrected Census 2000 counts when a table:
º Shows population or housing unit change (or percent change) from 1990 to 2000, but does not show the 2000 population or housing unit count that it is derived from.
º Shows population or housing unit density or percent distribution in 2000, but does not show the 2000 population or housing unit count that it is derived from.
• When a table shows component parts of a revised 2000 population or housing unit count (e.g., clas-sified by urban/rural or by size of place), the component parts may not sum to the total population or housing unit count, because the component parts were not revised during the 2000 CQR program. Therefore, any derived values (e.g., percent distribution or number of places by population size) for the component parts cannot account for the revised Census 2000 counts either.
CORRECTION NOTES
Anderson township, Perkins CountyAnderson township disorganized before January 1, 2010, and should not be shown separately. It should be part of Northeast Perkins UT.
Grandview UT, Jones CountyGrandview UT should include Morgan township, which disorganized before January 1, 2010. The cor-rected counts for Grandview UT are 51 population, 26 housing units, a land area of 165,243,256 square meters (63.801 square miles), and a water area of 437,083 square meters (0.169 square miles).
Lower Brule UT, Lyman CountyLower Brule UT should include Block 1011 in Census Tract 972600; the block is incorrectly coded to West Lyman UT. The affected area contains 0 population, 0 housing units, a land area of 1,089 square meters (rounds to 0.000 square miles), and a water area of 0 square meters. The corrected land area for Lower Brule UT is 774,417,579 square meters (299.004 square miles).
Morgan township, Jones CountyMorgan township disorganized before January 1, 2010, and should not be shown separately. It should be part of Grandview UT.
Northeast Perkins UT township, Perkins CountyNortheast Perkins UT should include Anderson township, which disorganized before January 1, 2010. The corrected counts for Northeast Perkins UT are 119 population, 119 housing units, a land area of 789,578,961 square meters (304.858 square miles), and a water area of 26,551,339 square meters (10.252 square miles).
Rosebud Reservation and Off-Reservation Trust Land, Gregory, Lyman, Mellette, Todd, and Tripp CountiesThe tribal subdivisions defined within the Rosebud Reservation and Off-Reservation Trust Land all have boundary errors and should not be used as official 2010 geographies. New corrected versions of the tribal subdivisions will be released in the future. The following is the list of affected tribal subdivisions: Antelope, Black Pipe, Bull Creek, Butte Creek, Corn Creek, Grass Mountain, He Dog, Horse Creek, Ideal, Milk’s Camp, Okreek, Parmelee, Ring Thunder, Rosebud, St. Francis, Soldier Creek, Spring Creek, Swift Bear, Two Strike, and Upper Cut Meat Segments.
West Lyman UT, Lyman CountyWest Lyman UT should not include Block 1011 in Census Tract 972600; this block should be coded to Lower Brule UT. This change removes all area in Lower Brule Reservation and Off-Reservation Trust Land (2030) from West Lyman UT. The affected area contains 0 population, 0 housing units, a land area of 1,089 square meters (rounds to 0.000 square miles), and a water area of 0 square meters. The corrected land area for West Lyman UT is 1,402,119,639 square meters (541.361 square miles).

User Notes III-3U.S. Census Bureau, 2010 Census
HISTORICAL NOTES
The United States acquired almost all of the area of South Dakota from France in 1803 as part of the Louisiana Purchase. A small portion in the northeast part of the present-day state was added by a conven-tion signed with Great Britain in 1818. Dakota Territory was organized on March 2, 1861, from unorga-nized area formerly within Minnesota Territory and part of Nebraska Territory. Dakota Territory included all of the present-day states of North Dakota and South Dakota, most of Montana, the northern half of Wyoming, and a small part of Nebraska. The territory was reduced in 1863 with the organization of Idaho Territory, enlarged in 1864 with the addition of most of the remainder of present-day Wyoming, and again reduced with the organization of Wyoming Territory in 1868. In 1882, the state of Nebraska acquired an area north of the Keya Paha River and Niobrara River. South Dakota was admitted to the Union simulta-neously with North Dakota on November 2, 1889, as the 39th and 40th states, with generally the same boundary as the present state.
Census data for the combined area in present-day North Dakota and South Dakota are available in the 1860 census (and listed in national tables with South Dakota). The 1860 census population is for territory reported as unorganized Dakota and territory now in Montana. Although the state had not yet been legally established, the 1870 and 1880 populations are for the area of the present state. The population of Dakota Territory as legally established was 135,177 in 1880 and 14,181 in 1870.
GEOGRAPHIC NOTES
South Dakota is divided into 66 counties. The 1,339 county subdivisions in the state include 914 govern-mentally functioning townships. In 39 counties, some or all of the territory is not organized into town-ships, and the Census Bureau recognizes 105 unorganized territories in those areas. All 311 incorporated places are independent of any county subdivision, creating 320 entities that the Census Bureau treats as equivalent to county subdivisions. There are 79 CDPs in South Dakota. Incorporated places in the state are legally described as cities, towns, and one village. The Census Bureau treats all CDPs as dependent within county subdivisions.
GEOGRAPHIC CHANGE NOTES
The Geographic Change Notes listed below document high-level geographic entities—American Indian areas, Alaska Native areas, and Hawaiian home lands; counties and their equivalents; county subdivi-sions; and places—that are different from the information reported in Census 2000. The notes identify geographic entities whose name, legal description, and/or boundary have changed, entities that no longer exist, newly established entities (both legal and statistical), and changes in geographic relationships, such as places that exist in one county and have expanded into or withdrawn from another county (the notes do not identify the other county(ies) in which the entity exists; this can be determined from Table 9 of this publication), places that have been removed from comparable 2000 county subdivisions, and places that have become independent of or dependent within one or more county subdivisions. The changes are reported by and within county; counties without changes are not shown in the listing. Changes to American Indian areas, Alaska Native areas, and Hawaiian home lands appear after the list of counties; areas with no changes are not shown. A few of the reported changes in name, legal status, or legal rela-tionship may be incorrect; if so, the correct version is shown in any Correction Notes section above. Some changes are the result of legal actions that took place prior to Census 2000 but were not reported in that census.
For the 2010 Census, the notes reflect any boundary change that affects a geographic entity, regardless of whether it is the result of legal action, redefinition of a statistical entity, correction of a previous draft-ing error, or new erroneous information. Between Census 2000 and the 2010 Census, the Census Bureau invested in improving the coordinate accuracy of its geographic database. As a result, the geographic positions of boundaries may be different between the two censuses even though little or no change actu-ally occurred to the boundaries. In compiling the Geographic Change Notes, the Census Bureau inspected the many corrections to determine if a change actually affected significant land area or population. For

III-4 User NotesU.S. Census Bureau, 2010 Census
example, the county-level text ‘‘all MCDs [minor civil divisions] revised’’ may reflect a legal redistricting of all county subdivisions in the county, a major or minor relocation of county subdivision boundaries due to more accurate mapping or more accurate boundary information, or a combination of these that, in one way or another, affect every county subdivision in a county. Boundary corrections that resulted in incorpo-rated places gaining or losing territory are shown as annexations or detachments even if no legal action occurred between 2000 and 2010. Most places shown with a detachment resulted from such corrections. In states whose legal entities rarely undergo a legal boundary change, such as the New England states, most of the entities reported to have annexed, detached, exchanged, gained, or lost territory did so as the result of mapping changes, not legal actions. The extent and location of the boundary changes affecting any particular entity can be determined by comparing the TIGER/Line® Shapefiles, Cartographic Boundary Files, or a comparable set of maps for the 2000 and 2010 censuses.
Counties, County Subdivisions, and Places
Aurora County—Annexations from MCDs: Plankinton city from Plankinton township; White Lake city from White Lake township; CDP Changes: Aurora Center and Storla CDPs were transposed in 2000; the area in Aurora Center CDP in 2010 was shown in Storla CDP in 2000 and vice versa.
Beadle County—Annexations from MCDs: Huron city from Clyde, Custer, Theresa, and Valley townships; New CDPs: Morningside.
Bennett County—Detachments to MCDs: Martin city to East Bennett UT; CDP Changes: Allen CDP lost area.
Bon Homme County—Annexations from MCDs: Scotland city from Northeast Bon Homme UT; Springfield city from Southwest Bon Homme UT; Tabor town from Southeast Bon Homme UT; New CDPs: Running Water.
Brookings County—Annexations from MCDs: Brookings city from Aurora, Brookings, Medary, and Trenton townships; Bruce city from Sterling township; Volga city from Volga township; White city from Afton town-ship; New CDPs: Lake Poinsett (part).
Brown County—Annexations from MCDs: Aberdeen city from Aberdeen and Bath townships; Frederick town from Frederick township; Detachments to MCDs: Claremont town to Claremont township; Columbia city to Columbia township; Warner town to Warner township; Westport town to Westport township; New CDPs: Bath, Bath Corner, Ferney, and Mansfield (part).
Brule County—Annexations from MCDs: Chamberlain city from Chamberlain township; New CDPs: Bijou Hills and Ola.
Buffalo County—New CDPs: Gann Valley.
Butte County—Annexations from MCDs: Belle Fourche city from West Butte UT; Newell city from East Butte UT; Nisland town from West Butte UT; New CDPs: Vale.
Campbell County—Annexations from MCDs: Herreid city from North Campbell UT.
Charles Mix County—Annexations from MCDs: Platte city from Platte township; Wagner city from Bryan and Lawrence townships; Detachments to MCDs: Wagner city to Bryan and Lawrence townships.
Clark County—Detachments to MCDs: Clark city to Day and Lincoln townships; New CDPs: Crocker.
Clay County—Annexations from MCDs: Irene city from Star township; Vermillion city from Fairview and Vermillion townships.
Codington County—Annexations from MCDs: Florence town from Fuller township; Kranzburg town from Kranzburg township; Watertown city from Elmira, Lake, Pelican, and Sheridan townships; Detachments to MCDs: Watertown city to Pelican township; New CDPs: Waverly.

User Notes III-5U.S. Census Bureau, 2010 Census
Corson County—Name Changes: Lemmon UT name changed from Lemmon No. 2; Disorganizations: Delaney township in 2003 (added to West Corson UT); Lake township in 2007 (taken to form part of East Corson and part added to West Corson UT); Mission township in 2008 (taken to form part of East Corson UT and part added to Wakpala township); MCD Changes: East Corson UT formed from all of deleted Northeast Corson UT, parts of disorganized Lake and Mission townships, and part of deleted Central Corson UT; Wakpala township gained area from disorganized Mission township; West Corson UT added all of disorganized Delaney township and part of disorganized Lake township and gained area from deleted Central Corson UT; Detachments to MCDs: McIntosh city to West Corson UT; McLaughlin city to East Corson UT; Changed Relationships: Bullhead and Little Eagle CDPs transferred to East Corson UT from deleted Central Corson UT.
Custer County—Annexations from MCDs: Buffalo Gap town from East Custer UT; Custer city from West Custer UT; Hermosa town from East Custer UT; Detachments to MCDs: Custer city to West Custer UT; Hermosa town to East Custer UT.
Davison County—Disorganizations: Mitchell township in 2002 (taken to form Mitchell UT); Annexations from MCDs: Ethan town from Rome township; Mitchell city from Perry township and Mitchell UT; Mount Vernon city from Mount Vernon township; Detachments to MCDs: Ethan town to Rome township; Mitchell city to Mitchell UT; Mount Vernon city to Mount Vernon township.
Day County—Detachments to MCDs: Butler town to Butler township.
Deuel County—Annexations from MCDs: Clear Lake city from Clear Lake township; Detachments to MCDs: Toronto town to Scandinavia township.
Dewey County—Annexations from MCDs: Eagle Butte city from North Dewey UT; CDP Changes: La Plant CDP gained area; North Eagle Butte CDP gained area, part annexed to Eagle Butte city, and lost additional area.
Douglas County—Annexations from MCDs: Corsica city from Grandview township.
Fall River County—Annexations from MCDs: Edgemont city from Southwest Fall River UT; Hot Springs city from Northeast Fall River UT.
Faulk County—Annexations from MCDs: Faulkton city from Tamworth township; Detachments to MCDs: Faulkton city to Tamworth township.
Grant County—Annexations from MCDs: Milbank city from Alban and Grant Center townships; Detachments to MCDs: Millbank city to Alban township.
Gregory County—Disorganizations: Burke township in 2009 (taken to form part of West Gregory UT and parts added to East Gregory and North Gregory UTs); Carlock township in 2007 (taken to form part of West Gregory UT); Dickens township in 2009 (taken to form part of West Gregory UT); Ellston township in 2002 (added to East Gregory UT); Whetstone township in 2001 (added to East Gregory UT); MCD Changes: East Gregory UT gained area from all of disorganized Ellston and Whetstone townships, part of disorganized Burke township and deleted Spring Valley UT, and from North Gregory UT; North Gregory UT gained area from part of disorganized Burke township, part taken to form part of West Gregory UT, and lost area to East Gregory UT; West Gregory UT formed from all of disorganized Carlock and Dickens townships, part of disorganized Burke township, part of deleted Spring Valley UT, and part of North Gregory UT; Annexations from MCDs: Gregory city from North Gregory UT; Detachments to MCDs: Gregory city to North Gregory UT; Changed Relationships: St. Charles CDP transferred to East Gregory UT from North Gregory UT due to MCD boundary change.
Haakon County—Annexations from MCDs: Philip city from West Haakon UT.

III-6 User NotesU.S. Census Bureau, 2010 Census
Hamlin County—Annexations from MCDs: Castlewood city from Castlewood township; Hayti town from Hayti township; Lake Norden city from Norden township; Detachments to MCDs: Hayti town to Hayti town-ship; Lake Norden city to Norden township; New CDPs: Lake Poinsett (part).
Hand County—Disorganizations: Ree Heights township in 2004 (taken to form Ree Heights UT); Annexations from MCDs: Miller city from Miller township; St. Lawrence town from St. Lawrence township; Detachments to MCDs: St. Lawrence town to Miller and St. Lawrence townships.
Hanson County—Annexations from MCDs: Alexandria city from Wayne township; Emery city from Pleasant township; Detachments to MCDs: Alexandria city to Wayne township.
Hughes County—Disorganizations: Valley township in 2002 (added to North Hughes UT); Annexations from MCDs: Pierre city from West Hughes UT.
Hutchinson County—Annexations from MCDs: Freeman city from Grandview and Valley townships; Menno city from Sweet township; Parkston city from Liberty township; Detachments to MCDs: Menno city to Sweet township.
Jackson County—Name Changes: Northeast Jackson UT name changed from East Jackson; Disorganizations: Little Buffalo township in 2005 (added to Northeast Jackson and Northwest Jackson UTs); Annexations from MCDs: Belvidere town from Northeast Jackson UT.
Jerauld County—Disorganizations: Media township in 2003 (taken to form Media UT).
Jones County—Disorganizations: Grandview township in 2004 (taken to form Grandview UT).
Kingsbury County—Annexations from MCDs: Arlington city from Denver township; De Smet city from De Smet township; Iroquois city from Iroquois township; Lake Preston city from Baker township.
Lake County—Annexations from MCDs: Madison city from Lake View township; New CDPs: Brant Lake, Chester, Lake Madison, and Winfred.
Lawrence County—Annexations from MCDs: Deadwood city from North Lawrence and South Lawrence UTs; Spearfish city from North Lawrence UT; Whitewood city from North Lawrence UT; Detachments to MCDs: Whitewood city to North Lawrence UT; New CDPs: St. Onge; CDP Changes: North Spearfish CDP part annexed to Spearfish city and lost additional area.
Lincoln County—Description Changes: Worthing city changed from a town; Annexations from MCDs: Canton city from Canton township; Harrisburg city from La Valley and Springdale townships; Hudson town from Eden township; Lennox city from Grant and Perry townships; Sioux Falls city from Delapre and Springdale townships; Tea city from Delapre township; Worthing city from Lynn township; Detachments to MCDs: Harrisburg city to La Valley township; Lennox city to Perry township; New CDPs: Shindler.
Lyman County—Disorganizations: Butte township in 2006 (taken to form part of East Lyman UT); Dorman township in 2008 (taken to form part of Central Lyman UT); Fairland township in 2005 (taken to form part of East Lyman UT); Morningside township in 1997 (not reported until 2001) (added to Black Dog UT); Reliance township in 2005 (taken to form part of East Lyman UT); Rowe township in 2006 (taken to form part of West Lyman UT); Sioux township in 2005 (taken to form part of West Lyman UT); Stony Butte township in 2001 (taken to form part of West Lyman UT); MCD Changes: Black Dog UT added disorga-nized Morningside township; Central Lyman UT formed from disorganized Dorman township and parts of deleted Northwest Lyman and South Lyman UTs; East Lyman UT formed from disorganized Butte, Fairland, and Reliance townships and all of Lafayette UT; West Lyman UT formed from disorganized Rowe, Sioux, and Stony Butte townships, all of McClure UT, and parts of deleted Northwest Lyman and South Lyman UTs; Annexations from MCDs: Oacoma town from Oacoma township.
McCook County—Annexations from MCDs: Salem city from Salem township; Detachments to MCDs: Bridgewater city to Bridgewater township.

User Notes III-7U.S. Census Bureau, 2010 Census
McPherson County—Annexations from MCDs: Eureka city from West McPherson UT.
Marshall County—Annexations from MCDs: Britton city from Miller township; Langford town from Hickman township; Detachments to MCDs: Britton city to Miller township; New CDPs: Kidder.
Meade County—Incorporations: Piedmont city in 2007 from Southwest Meade UT; Summerset city in 2005 from Southwest Meade UT; Organizations: Elm Springs township organized in 2000 from part of Smithville township and Belle Fourche-Cheyenne Valleys UT; MCD Changes: Belle Fourche-Cheyenne Valleys UT part taken to form part of Elm Springs township, exchanged area with Smithville township, and lost area to Lakeside township; Lakeside township gained area from Belle Fourche-Cheyenne Valleys UT; Smithville township exchanged area with Belle Fourche-Cheyenne Valleys UT and part taken to form part of Elm Springs township; Annexations from MCDs: Box Elder city from Belle Fourche-Cheyenne Valleys UT; Sturgis city from Southwest Meade UT; Summerset city from Southwest Meade UT; New CDPs: Blucksberg Mountain; Deleted CDPs: Ellsworth AFB (part) (predominantly annexed to Box Elder city); CDP Changes: Blackhawk CDP gained area.
Mellette County—New CDPs: Corn Creek and Norris.
Miner County—Annexations from MCDs: Howard city from Howard township; New CDPs: Fedora.
Minnehaha County—Annexations from MCDs: Baltic city from Sverdrup township; Brandon city from Brandon and Split Rock townships; Crooks city from Benton township; Dell Rapids city from Dell Rapids township; Garretson city from Palisade township; Hartford city from Hartford township; Humboldt town from Humboldt township; Sioux Falls city from Benton, Mapleton, Split Rock, and Wayne townships; Valley Springs city from Valley Springs township; Detachments to MCDs: Sioux Falls city to Mapleton township; New CDPs: Anderson, Meadow View Addition, Pine Lakes Addition, and Renner Corner.
Moody County—Annexations from MCDs: Colman city from Colman township; Egan city from Egan and Grovena townships; Flandreau city from Flandreau township; Trent town from Blinsmon township; Detachments to MCDs: Flandreau city to Flandreau township.
Pennington County—Annexations from MCDs: Box Elder city from Rapid City city and Central Pennington and Rapid City East UTs; Hill City city from West Pennington UT; New Underwood city from East Central Pennington UT; Quinn town from Quinn township; Rapid City city from Central Pennington and Rapid City East UTs; Wall town from Fairview township; Detachments to MCDs: Box Elder city to Central Pennington and Rapid City East UTs; New Underwood city to East Central Pennington UT; Quinn town to Fairview town-ship; Rapid City city to Box Elder city and Central Pennington (including parts to Green Valley and Rapid Valley CDPs) and Rapid City East UTs; New CDPs: Johnson Siding; Deleted CDPs: Ellsworth AFB (part) (pre-dominantly annexed to Box Elder city); CDP Changes: Colonial Pine Hills CDP part annexed to Rapid City city and lost additional area; Green Valley CDP gained area detached from Rapid City city; Rapid Valley CDP gained area detached from Rapid City city, gained additional area, parts annexed to Box Elder and Rapid City cities, and lost additional area.
Perkins County—Corrections: Anderson township disorganized and should not be shown separately. It should be part of Northeast Perkins UT; Name Changes: Jones UT name changed from West Perkins; Richland UT name changed from West Central Perkins; Mergers: Beck and Highland townships merged to form Beck-Highland township in 2007; East Perkins and Independence UTs merged to form Northeast Perkins UT; Disorganizations: Brushy township (added to South Perkins UT); White Hill township (taken to form White Hill UT); Wyandotte township (added to South Perkins UT); MCD Changes: South Perkins UT added all of disorganized Brushy and Wyandotte township and Southwest Perkins UT; Annexations from MCDs: Lemmon city from Lincoln township; New CDPs: Prairie City.
Potter County—Annexations from MCDs: Gettysburg city from Central Potter UT.
Roberts County—Annexations from MCDs: Sisseton city from Sisseton township; Summit town from Summit township; New CDPs: Agency Village, Goodwill, and Long Hollow.

III-8 User NotesU.S. Census Bureau, 2010 Census
Sanborn County—New CDPs: Forestburg.
Shannon County—CDP Changes: Kyle and Pine Ridge CDPs gained and lost area.
Spink County—Annexations from MCDs: Redfield city from Redfield township; New CDPs: Mansfield (part).
Stanley County—Annexations from MCDs: Fort Pierre city from North Stanley and South Stanley UTs.
Sully County—New CDPs: Cow Creek.
Todd County—New CDPs: Okreek and Soldier Creek; CDP Changes: Spring Creek and Two Strike CDPs gained area.
Tripp County—Disorganizations: Pahapesto township in 2007 (taken to form Pahapesto UT); Progressive township in 2006 (taken to form Progressive UT); Annexations from MCDs: Winner city from Lamro town-ship; Detachments to MCDs: Winner city to Lamro township.
Turner County—Annexations from MCDs: Chancellor town from Germantown township; Parker city from Parker township; Viborg city from Daneville and Swan Lake townships; Detachments to MCDs: Chancellor town to Germantown township; Parker city to Parker township.
Union County—Annexations from MCDs: Elk Point city from Elk Point township; Jefferson city from Jefferson township; New CDPs: Dakota Dunes and Richland.
Walworth County—Annexations from MCDs: Mobridge city from West Walworth UT; Selby city from West Walworth UT; Detachments to MCDs: Selby city to East Walworth and West Walworth UTs.
Yankton County—Annexations from MCDs: Gayville town from Gayville township; Yankton city from Southeast Yankton and West Yankton UTs.
Ziebach County—Annexations from MCDs: Eagle Butte city from South Ziebach UT.
American Indian Areas
Cheyenne River Reservation and Off-Reservation Trust Land—Off-reservation trust land portion added to Sully County and gained area in Stanley County.
Flandreau Reservation—Lost area in Moody County.
Lake Traverse Reservation and Off-Reservation Trust Land (part)—Off-reservation trust land (converted from reservation area) gained area in Codington County.
Lower Brule Reservation and Off-Reservation Trust Land—Off-reservation trust land portion gained area in Lyman County.
Northern Cheyenne Indian Reservation and Off-Reservation Trust Land (part)—Name corrected from Northern Cheyenne Reservation and Off-Reservation Trust Land
Pine Ridge Reservation (part)—All 2000 off-reservation trust land converted to reservation area and gained additional reservation area in Bennett County; Tribal Subdivision Changes: LaCreek District name corrected from La Creek; LaCreek and Pass Creek Districts gained area not in a 2000 tribal subdivision in Bennett County.
Rosebud Indian Reservation and Off-Reservation Trust Land—Off-reservation trust land portion gained area in Gregory County; Tribal Subdivision Changes: All tribal subdivisions changed description to Segment from Community; Antelope Segment gained area from Butte Creek Segment and added to Mellette County; Black Pipe Segment lost area to Corn Creek Segment in Mellette County; Bull Creek Segment lost area to Ideal Segment in Lyman County; Butte Creek Segment gained area from Ideal Segment and added to Tripp County, gained area from Okreek Segment in Mellette County, and lost area to Antelope Segment in Mellette County; Corn Creek Segment gained area from Black Pipe Segment in Mellette County; Grass
User Notes III-9U.S. Census Bureau, 2010 Census
Mountain Segment gained area from Two Strike Segment in Todd County; Ideal Segment gained area from Bull Creek Segment in Lyman County and lost area to Butte Creek and Okreek Communities in Tripp County; Milk’s Camp Segment gained area not in a 2000 tribal subdivision in Gregory County; Okreek Segment gained area from Ideal Segment and added to Tripp County and lost area to Butte Creek Segment in Mellette County; Two Strike Segment lost area to Grass Mountain Segment in Todd County; Note: The tribal subdivisions defined within the Rosebud Reservation and Off-Reservation Trust Land all have bound-ary errors and should not be used as official 2010 geographies.


Crosswalk of Urban Areas and Places IV-1U.S. Census Bureau, 2010 Census
Crosswalk of Urban Areas and Places: 2010Urban Area Place Within Urban Area
URBANIZED AREA
Rapid City, SD Urbanized Area Blackhawk CDP (part)Colonial Pine Hills CDP (part)Green Valley CDP (part)Piedmont city (part)Rapid City city (part)Rapid Valley CDP (part)Summerset city (part)
Sioux City, IA--NE--SD Urbanized Area (part) Dakota Dunes CDP (part)Jefferson city (part)North Sioux City city (part)
Sioux Falls, SD Urbanized Area Brandon city (part)Harrisburg city (part)Meadow View Addition CDP (part)Pine Lakes Addition CDPSioux Falls city (part)
URBAN CLUSTER
Aberdeen, SD Urban Cluster Aberdeen city (part)
Belle Fourche, SD Urban Cluster Belle Fourche city (part)
Box Elder, SD Urban Cluster Ashland Heights CDP (part)Box Elder city (part)
Brandon, SD Urban Cluster Brandon city (part)
Brookings, SD Urban Cluster Brookings city (part)
Canton, SD Urban Cluster Canton city (part)
Dell Rapids, SD Urban Cluster Dell Rapids city (part)
Harrisburg, SD Urban Cluster Harrisburg city (part)
Hot Springs, SD Urban Cluster Hot Springs city (part)
Huron, SD Urban Cluster Huron city (part)Morningside CDP (part)
Lead, SD Urban Cluster Central City city (part)Deadwood city (part)Lead city (part)
Madison, SD Urban Cluster Madison city (part)
Milbank, SD Urban Cluster Milbank city (part)
Mitchell, SD Urban Cluster Mitchell city (part)
Mobridge, SD Urban Cluster Mobridge city (part)
North Eagle Butte, SD Urban Cluster Eagle Butte city (part)North Eagle Butte CDP (part)
Pierre, SD Urban Cluster Fort Pierre city (part)Pierre city (part)
Pine Ridge, SD Urban Cluster Pine Ridge CDP (part)
Spearfish, SD Urban Cluster North Spearfish CDP (part)Spearfish city (part)
Sturgis, SD Urban Cluster Sturgis city (part)
Tea, SD Urban Cluster Tea city (part)
Vermillion, SD Urban Cluster Vermillion city (part)
Watertown, SD Urban Cluster Watertown city (part)
Winner, SD Urban Cluster Winner city (part)
Yankton, SD Urban Cluster Yankton city (part)


Population and Housing Unit Counts South Dakota 1U.S. Census Bureau, 2010 Census
Table 1. Population: Earliest Census to 2010; and Housing Units: 1950 to 2010[For information concerning historical counts and geographic change, see “User Notes .” For information on confidentiality, nonsampling error, and definitions, see Appendixes]
StateUrban and Rural
State total Urban Rural Percent of total
Number
Change from preceding census
Number of places of 2,500 or
more Number
Change from preceding census
Number
Change from preceding census
Urban RuralNumber Percent Number Percent Number Percent
POPULATION
Current urban definition: 2010 (Apr . 1) . . . . . . . . . . . . . 814,180 59,336 7 .9 31 461,247 69,820 17 .8 352,933 –10,484 –2 .9 56 .7 43 .3 2000 (Apr . 1) . . . . . . . . . . . . . 754,844 58,840 8 .5 29 391,427 41,057 11 .7 363,417 17,783 5 .1 51 .9 48 .1 1990 (Apr . 1) . . . . . . . . . . . . . 696,004 (X) (X) 26 350,370 (X) (X) 345,634 (X) (X) 50 .3 49 .7
1950–90 urban definition: 1990 (Apr . 1) . . . . . . . . . . . . . 696,004 5,236 0 .8 26 347,903 27,126 8 .5 348,101 –21,890 –5 .9 50 .0 50 .0 1980 (Apr . 1) . . . . . . . . . . . . . 690,768 24,511 3 .7 27 320,777 24,149 8 .1 369,991 1,112 0 .3 46 .4 53 .6 1970 (Apr . 1) . . . . . . . . . . . . . 666,257 –14,257 –2 .1 26 296,628 29,448 11 .0 368,879 –44,455 –10 .8 44 .6 55 .4 1960 (Apr . 1) . . . . . . . . . . . . . 680,514 27,774 4 .3 25 267,180 50,470 23 .3 413,334 –22,696 –5 .2 39 .3 60 .7 1950 (Apr . 1) . . . . . . . . . . . . . 652,740 (X) (X) 25 216,710 (X) (X) 436,030 (X) (X) 33 .2 66 .8
Pre-1950 urban definition: 1960 (Apr . 1) . . . . . . . . . . . . . 680,514 27,774 4 .3 25 265,328 49,171 22 .7 415,186 –21,397 –4 .9 39 .0 61 .0 1950 (Apr . 1) . . . . . . . . . . . . . 652,740 9,779 1 .5 25 216,157 58,070 36 .7 436,583 –48,291 –10 .0 33 .1 66 .9 1940 (Apr . 1) . . . . . . . . . . . . . 642,961 –49,888 –7 .2 19 158,087 27,180 20 .8 484,874 –77,068 –13 .7 24 .6 75 .4 1930 (Apr . 1) . . . . . . . . . . . . . 692,849 56,302 8 .8 16 130,907 29,035 28 .5 561,942 27,267 5 .1 18 .9 81 .1 1920 (Jan . 1) . . . . . . . . . . . . . 636,547 52,659 9 .0 14 101,872 25,403 33 .2 534,675 27,256 5 .4 16 .0 84 .0 1910 (Apr . 15) . . . . . . . . . . . . 583,888 182,318 45 .4 13 76,469 35,533 86 .8 507,419 146,785 40 .7 13 .1 86 .9 1900 (June 1) . . . . . . . . . . . . . 401,570 52,970 15 .2 9 40,936 12,381 43 .4 360,634 40,589 12 .7 10 .2 89 .8 1890 (June 1) . . . . . . . . . . . . . 348,600 250,332 254 .7 7 28,555 21,347 296 .2 320,045 228,985 251 .5 8 .2 91 .8 1880 (June 1) . . . . . . . . . . . . . 98,268 86,492 734 .5 2 7,208 7,208 (X) 91,060 79,284 673 .3 7 .3 92 .7 1870 (June 1) . . . . . . . . . . . . . 11,776 (X) (X) – – (X) (X) 11,776 (X) (X) – 100 .0
HOUSING UNITS
Current urban definition: 2010 (Apr . 1) . . . . . . . . . . . . . 363,438 40,230 12 .4 (X) 200,981 34,195 20 .5 162,457 6,035 3 .9 55 .3 44 .7 2000 (Apr . 1) . . . . . . . . . . . . . 323,208 30,772 10 .5 (X) 166,786 23,078 16 .1 156,422 7,694 5 .2 51 .6 48 .4 1990 (Apr . 1) . . . . . . . . . . . . . 292,436 (X) (X) (X) 143,708 (X) (X) 148,728 (X) (X) 49 .1 50 .9
1950–90 urban definition: 1990 (Apr . 1) . . . . . . . . . . . . . 292,436 15,439 5 .6 (X) 142,947 15,746 12 .4 149,489 –307 –0 .2 48 .9 51 .1 1980 (Apr . 1) . . . . . . . . . . . . . 276,997 51,580 22 .9 (X) 127,201 31,013 32 .2 149,796 20,731 16 .1 45 .9 54 .1 1970 (Apr . 1) . . . . . . . . . . . . . 225,417 8,968 4 .1 (X) 96,188 12,219 14 .6 129,065 –3,415 –2 .6 42 .7 57 .3 1960 (Apr . 1) . . . . . . . . . . . . . 216,449 21,876 11 .2 (X) 83,969 18,263 27 .8 132,480 3,613 2 .8 38 .8 61 .2 1950 (Apr . 1) . . . . . . . . . . . . . 194,573 (X) (X) (X) 65,706 (X) (X) 128,867 (X) (X) 33 .8 66 .2

2 South Dakota Population and Housing Unit CountsU.S. Census Bureau, 2010 Census
Table 2. Population, Housing Units, and Land Area by Urban and Rural and Size of Urban Area: 2010[Areas classified by population size . For information on confidentiality, nonsampling error, and definitions, see Appendixes]
StateUrban and RuralSize of Urban Area [Population]
Population Housing units Land area Number of urban areas
TotalPercent
distribution TotalPercent
distributionIn square
milesPercent
distribution TotalEntirely in
statePartly in
state
South Dakota . . . . . . . . . . . . . 814,180 100 .0 363,438 100 .0 75,811 100 .0 28 27 1
Urban . . . . . . . . . . . . . . . . . . . . . 461,247 56 .7 200,981 55 .3 226 0 .3 28 27 1
In urbanized area . . . . . . . . . . . . . . . . 243,587 29 .9 105,088 28 .9 112 0 .2 3 2 1 1,000,000 or more . . . . . . . . . . . . . – – – – – – – – – 500,000 to 999,999 . . . . . . . . . . . . – – – – – – – – – 250,000 to 499,999 . . . . . . . . . . . . – – – – – – – – – 100,000 to 249,999 . . . . . . . . . . . . 162,336 19 .9 69,779 19 .2 70 0 .1 2 1 1 50,000 to 99,999 . . . . . . . . . . . . . . 81,251 10 .0 35,309 9 .7 42 0 .1 1 1 –
In urban cluster . . . . . . . . . . . . . . . . . 217,660 26 .7 95,893 26 .4 114 0 .2 25 25 – 25,000 to 49,999 . . . . . . . . . . . . . . 25,977 3 .2 12,114 3 .3 13 – 1 1 – 10,000 to 24,999 . . . . . . . . . . . . . . 122,198 15 .0 54,128 14 .9 63 0 .1 8 8 – 5,000 to 9,999 . . . . . . . . . . . . . . . . 34,055 4 .2 14,121 3 .9 21 – 5 5 – 2,500 to 4,999 . . . . . . . . . . . . . . . . 35,430 4 .4 15,530 4 .3 18 – 11 11 –
Cumulative summary:Urban area of— 1,000,000 or more . . . . . . . . . . . . . – – – – – – – – – 500,000 or more . . . . . . . . . . . . . . . – – – – – – – – – 250,000 or more . . . . . . . . . . . . . . . – – – – – – – – – 100,000 or more . . . . . . . . . . . . . . . 162,336 19 .9 69,779 19 .2 70 0 .1 2 1 1 50,000 or more . . . . . . . . . . . . . . . . 243,587 29 .9 105,088 28 .9 112 0 .2 3 2 1 25,000 or more . . . . . . . . . . . . . . . . 269,564 33 .1 117,202 32 .3 125 0 .2 4 3 1 10,000 or more . . . . . . . . . . . . . . . . 391,762 48 .1 171,330 47 .1 188 0 .3 12 11 1 5,000 or more . . . . . . . . . . . . . . . . . 425,817 52 .3 185,451 51 .0 209 0 .3 17 16 1 2,500 or more . . . . . . . . . . . . . . . . . 461,247 56 .7 200,981 55 .3 226 0 .3 28 27 1
Rural . . . . . . . . . . . . . . . . . . . . . 352,933 43 .4 162,457 44 .7 75,585 99 .7 (X) (X) (X)

Population and Housing Unit Counts South Dakota 3U.S. Census Bureau, 2010 Census
This page is intentionally blank.

4 South Dakota Population and Housing Unit CountsU.S. Census Bureau, 2010 Census
Table 3.Population by Urban and Rural and Size of Place: 2010[Places classified by population size . For information on confidentiality, nonsampling error, and definitions, see Appendixes]
Table 3.Population by Urban and Rural and Size of Place: 2010—Con.[Places classified by population size . For information on confidentiality, nonsampling error, and definitions, see Appendixes]
State Size of Place [Population]
Total Urban Rural
State Size of Place [Population]
PopulationNumber of
places
Percent of total
population Total
In place
Not in place Total
In place
Not in place
All urban places (entirely or partly urban) Entirely urban places Partly urban places All rural places
(entirely or partly rural) Entirely rural places Partly rural places
PopulationNumber of
places PopulationNumber of
places PopulationNumber of
places PopulationNumber of
places PopulationNumber of
places PopulationNumber of
places
South Dakota . . . . . . . . . . 814,180 390 100 .0 461,247 454,712 45 314 1 454,398 44 6,535 352,933 157,890 389 141,483 345 16,407 44 195,043 South Dakota
In place . . . . . . . . . . . . . . . . . 612,602 390 75 .2 454,712 454,712 45 314 1 454,398 44 (X) 157,890 157,890 389 141,483 345 16,407 44 (X) In place Not in place . . . . . . . . . . . . . 201,578 (X) 24 .8 6,535 (X) (X) (X) (X) (X) (X) 6,535 195,043 (X) (X) (X) (X) (X) (X) 195,043 Not in place
In place of— In place of–– 1,000,000 or more . . . . . . . . . . . – – – – – – – – – – (X) – – – – – – – (X) 1,000,000 or more 500,000 to 999,999 . . . . . . . . . . – – – – – – – – – – (X) – – – – – – – (X) 500,000 to 999,999 250,000 to 499,999 . . . . . . . . . . – – – – – – – – – – (X) – – – – – – – (X) 250,000 to 499,999 100,000 to 249,999 . . . . . . . . . . 153,888 1 18 .9 152,980 152,980 1 – – 152,980 1 (X) 908 908 1 – – 908 1 (X) 100,000 to 249,999 50,000 to 99,999 . . . . . . . . . . . . 67,956 1 8 .4 65,658 65,658 1 – – 65,658 1 (X) 2,298 2,298 1 – – 2,298 1 (X) 50,000 to 99,999 25,000 to 49,999 . . . . . . . . . . . . 26,091 1 3 .2 25,866 25,866 1 – – 25,866 1 (X) 225 225 1 – – 225 1 (X) 25,000 to 49,999 10,000 to 24,999 . . . . . . . . . . . . 120,549 8 14 .8 117,369 117,369 8 – – 117,369 8 (X) 3,180 3,180 8 – – 3,180 8 (X) 10,000 to 24,999
5,000 to 9,999 . . . . . . . . . . . . . . 43,540 6 5 .4 41,129 41,129 6 – – 41,129 6 (X) 2,411 2,411 6 – – 2,411 6 (X) 5,000 to 9,999 2,500 to 4,999 . . . . . . . . . . . . . . 44,939 14 5 .5 39,924 39,924 13 – – 39,924 13 (X) 5,015 5,015 14 2,534 1 2,481 13 (X) 2,500 to 4,999 2,000 to 2,499 . . . . . . . . . . . . . . 22,506 10 2 .8 4,334 4,334 3 – – 4,334 3 (X) 18,172 18,172 10 15,714 7 2,458 3 (X) 2,000 to 2,499 1,500 to 1,999 . . . . . . . . . . . . . . 16,035 9 2 .0 3,130 3,130 2 – – 3,130 2 (X) 12,905 12,905 9 12,267 7 638 2 (X) 1,500 to 1,999 1,000 to 1,499 . . . . . . . . . . . . . . 29,344 24 3 .6 2,011 2,011 2 – – 2,011 2 (X) 27,333 27,333 24 26,756 22 577 2 (X) 1,000 to 1,499 500 to 999 . . . . . . . . . . . . . . . . . 45,803 65 5 .6 1,610 1,610 4 – – 1,610 4 (X) 44,193 44,193 65 43,036 61 1,157 4 (X) 500 to 999 200 to 499 . . . . . . . . . . . . . . . . . 27,736 82 3 .4 500 500 2 314 1 186 1 (X) 27,236 27,236 81 27,200 80 36 1 (X) 200 to 499 Less than 200 . . . . . . . . . . . . . . 14,215 169 1 .8 201 201 2 – – 201 2 (X) 14,014 14,014 169 13,976 167 38 2 (X) Less than 200
Cumulative summary: Cumulative summary:In place of— In place of–– 1,000,000 or more . . . . . . . . . . . – – – – – – – – – – (X) – – – – – – – (X) 1,000,000 or more 500,000 or more . . . . . . . . . . . . – – – – – – – – – – (X) – – – – – – – (X) 500,000 or more 250,000 or more . . . . . . . . . . . . – – – – – – – – – – (X) – – – – – – – (X) 250,000 or more 100,000 or more . . . . . . . . . . . . 153,888 1 18 .9 152,980 152,980 1 – – 152,980 1 (X) 908 908 1 – – 908 1 (X) 100,000 or more 50,000 or more . . . . . . . . . . . . . 221,844 2 27 .3 218,638 218,638 2 – – 218,638 2 (X) 3,206 3,206 2 – – 3,206 2 (X) 50,000 or more 25,000 or more . . . . . . . . . . . . . 247,935 3 30 .5 244,504 244,504 3 – – 244,504 3 (X) 3,431 3,431 3 – – 3,431 3 (X) 25,000 or more 10,000 or more . . . . . . . . . . . . . 368,484 11 45 .3 361,873 361,873 11 – – 361,873 11 (X) 6,611 6,611 11 – – 6,611 11 (X) 10,000 or more
5,000 or more . . . . . . . . . . . . . . 412,024 17 50 .6 403,002 403,002 17 – – 403,002 17 (X) 9,022 9,022 17 – – 9,022 17 (X) 5,000 or more 2,500 or more . . . . . . . . . . . . . . 456,963 31 56 .1 442,926 442,926 30 – – 442,926 30 (X) 14,037 14,037 31 2,534 1 11,503 30 (X) 2,500 or more 2,000 or more . . . . . . . . . . . . . . 479,469 41 58 .9 447,260 447,260 33 – – 447,260 33 (X) 32,209 32,209 41 18,248 8 13,961 33 (X) 2,000 or more 1,500 or more . . . . . . . . . . . . . . 495,504 50 60 .9 450,390 450,390 35 – – 450,390 35 (X) 45,114 45,114 50 30,515 15 14,599 35 (X) 1,500 or more 1,000 or more . . . . . . . . . . . . . . 524,848 74 64 .5 452,401 452,401 37 – – 452,401 37 (X) 72,447 72,447 74 57,271 37 15,176 37 (X) 1,000 or more 500 or more . . . . . . . . . . . . . . . . 570,651 139 70 .1 454,011 454,011 41 – – 454,011 41 (X) 116,640 116,640 139 100,307 98 16,333 41 (X) 500 or more 200 or more . . . . . . . . . . . . . . . . 598,387 221 73 .5 454,511 454,511 43 314 1 454,197 42 (X) 143,876 143,876 220 127,507 178 16,369 42 (X) 200 or more

Population and Housing Unit Counts South Dakota 5U.S. Census Bureau, 2010 Census
Table 3.Population by Urban and Rural and Size of Place: 2010[Places classified by population size . For information on confidentiality, nonsampling error, and definitions, see Appendixes]
Table 3.Population by Urban and Rural and Size of Place: 2010—Con.[Places classified by population size . For information on confidentiality, nonsampling error, and definitions, see Appendixes]
State Size of Place [Population]
Total Urban Rural
State Size of Place [Population]
Total
In place
Not in place
All rural places (entirely or partly rural) Entirely rural places Partly rural places
PopulationNumber of
places PopulationNumber of
places PopulationNumber of
places
352,933 157,890 389 141,483 345 16,407 44 195,043 South Dakota
157,890 157,890 389 141,483 345 16,407 44 (X) In place195,043 (X) (X) (X) (X) (X) (X) 195,043 Not in place
In place of––– – – – – – – (X) 1,000,000 or more– – – – – – – (X) 500,000 to 999,999– – – – – – – (X) 250,000 to 499,999
908 908 1 – – 908 1 (X) 100,000 to 249,9992,298 2,298 1 – – 2,298 1 (X) 50,000 to 99,999
225 225 1 – – 225 1 (X) 25,000 to 49,9993,180 3,180 8 – – 3,180 8 (X) 10,000 to 24,999
2,411 2,411 6 – – 2,411 6 (X) 5,000 to 9,9995,015 5,015 14 2,534 1 2,481 13 (X) 2,500 to 4,999
18,172 18,172 10 15,714 7 2,458 3 (X) 2,000 to 2,49912,905 12,905 9 12,267 7 638 2 (X) 1,500 to 1,99927,333 27,333 24 26,756 22 577 2 (X) 1,000 to 1,49944,193 44,193 65 43,036 61 1,157 4 (X) 500 to 99927,236 27,236 81 27,200 80 36 1 (X) 200 to 49914,014 14,014 169 13,976 167 38 2 (X) Less than 200
Cumulative summary:In place of––
– – – – – – – (X) 1,000,000 or more– – – – – – – (X) 500,000 or more– – – – – – – (X) 250,000 or more
908 908 1 – – 908 1 (X) 100,000 or more3,206 3,206 2 – – 3,206 2 (X) 50,000 or more3,431 3,431 3 – – 3,431 3 (X) 25,000 or more6,611 6,611 11 – – 6,611 11 (X) 10,000 or more
9,022 9,022 17 – – 9,022 17 (X) 5,000 or more14,037 14,037 31 2,534 1 11,503 30 (X) 2,500 or more32,209 32,209 41 18,248 8 13,961 33 (X) 2,000 or more45,114 45,114 50 30,515 15 14,599 35 (X) 1,500 or more72,447 72,447 74 57,271 37 15,176 37 (X) 1,000 or more
116,640 116,640 139 100,307 98 16,333 41 (X) 500 or more143,876 143,876 220 127,507 178 16,369 42 (X) 200 or more
PopulationNumber of
places
Percent of total
population Total
In place
Not in place
All urban places (entirely or partly urban) Entirely urban places Partly urban places
PopulationNumber of
places PopulationNumber of
places PopulationNumber of
places
South Dakota . . . . . . . . . . 814,180 390 100 .0 461,247 454,712 45 314 1 454,398 44 6,535
In place . . . . . . . . . . . . . . . . . 612,602 390 75 .2 454,712 454,712 45 314 1 454,398 44 (X) Not in place . . . . . . . . . . . . . 201,578 (X) 24 .8 6,535 (X) (X) (X) (X) (X) (X) 6,535
In place of— 1,000,000 or more . . . . . . . . . . . – – – – – – – – – – (X) 500,000 to 999,999 . . . . . . . . . . – – – – – – – – – – (X) 250,000 to 499,999 . . . . . . . . . . – – – – – – – – – – (X) 100,000 to 249,999 . . . . . . . . . . 153,888 1 18 .9 152,980 152,980 1 – – 152,980 1 (X) 50,000 to 99,999 . . . . . . . . . . . . 67,956 1 8 .4 65,658 65,658 1 – – 65,658 1 (X) 25,000 to 49,999 . . . . . . . . . . . . 26,091 1 3 .2 25,866 25,866 1 – – 25,866 1 (X) 10,000 to 24,999 . . . . . . . . . . . . 120,549 8 14 .8 117,369 117,369 8 – – 117,369 8 (X)
5,000 to 9,999 . . . . . . . . . . . . . . 43,540 6 5 .4 41,129 41,129 6 – – 41,129 6 (X) 2,500 to 4,999 . . . . . . . . . . . . . . 44,939 14 5 .5 39,924 39,924 13 – – 39,924 13 (X) 2,000 to 2,499 . . . . . . . . . . . . . . 22,506 10 2 .8 4,334 4,334 3 – – 4,334 3 (X) 1,500 to 1,999 . . . . . . . . . . . . . . 16,035 9 2 .0 3,130 3,130 2 – – 3,130 2 (X) 1,000 to 1,499 . . . . . . . . . . . . . . 29,344 24 3 .6 2,011 2,011 2 – – 2,011 2 (X) 500 to 999 . . . . . . . . . . . . . . . . . 45,803 65 5 .6 1,610 1,610 4 – – 1,610 4 (X) 200 to 499 . . . . . . . . . . . . . . . . . 27,736 82 3 .4 500 500 2 314 1 186 1 (X) Less than 200 . . . . . . . . . . . . . . 14,215 169 1 .8 201 201 2 – – 201 2 (X)
Cumulative summary:In place of— 1,000,000 or more . . . . . . . . . . . – – – – – – – – – – (X) 500,000 or more . . . . . . . . . . . . – – – – – – – – – – (X) 250,000 or more . . . . . . . . . . . . – – – – – – – – – – (X) 100,000 or more . . . . . . . . . . . . 153,888 1 18 .9 152,980 152,980 1 – – 152,980 1 (X) 50,000 or more . . . . . . . . . . . . . 221,844 2 27 .3 218,638 218,638 2 – – 218,638 2 (X) 25,000 or more . . . . . . . . . . . . . 247,935 3 30 .5 244,504 244,504 3 – – 244,504 3 (X) 10,000 or more . . . . . . . . . . . . . 368,484 11 45 .3 361,873 361,873 11 – – 361,873 11 (X)
5,000 or more . . . . . . . . . . . . . . 412,024 17 50 .6 403,002 403,002 17 – – 403,002 17 (X) 2,500 or more . . . . . . . . . . . . . . 456,963 31 56 .1 442,926 442,926 30 – – 442,926 30 (X) 2,000 or more . . . . . . . . . . . . . . 479,469 41 58 .9 447,260 447,260 33 – – 447,260 33 (X) 1,500 or more . . . . . . . . . . . . . . 495,504 50 60 .9 450,390 450,390 35 – – 450,390 35 (X) 1,000 or more . . . . . . . . . . . . . . 524,848 74 64 .5 452,401 452,401 37 – – 452,401 37 (X) 500 or more . . . . . . . . . . . . . . . . 570,651 139 70 .1 454,011 454,011 41 – – 454,011 41 (X) 200 or more . . . . . . . . . . . . . . . . 598,387 221 73 .5 454,511 454,511 43 314 1 454,197 42 (X)

6 South Dakota Population and Housing Unit CountsU.S. Census Bureau, 2010 Census
Table 4. Population and Housing Units: 1970 to 2010[For information concerning historical counts and geographic change, see “User Notes .” For information on confidentiality, nonsampling error, and definitions, see Appendixes]
StateCounty/County Equivalent
Population Housing units
2010 2000 1990 1980 1970 2010 2000 1990 1980 1970
South Dakota . . . . . . . . . . 814,180 754,844 696,004 690,768 666,257 363,438 323,208 292,436 276,997 225,417
Aurora County . . . . . . . . . . . . . . . 2,710 3,058 3,135 3,628 4,183 1,324 1,298 1,342 1,450 1,496Beadle County . . . . . . . . . . . . . . . 17,398 17,023 18,253 19,195 20,877 8,304 8,206 8,093 8,229 7,347Bennett County . . . . . . . . . . . . . . 3,431 3,574 3,206 3,044 3,088 1,263 1,278 1,292 1,146 1,017Bon Homme County . . . . . . . . . . 7,070 7,260 7,089 8,059 8,577 2,931 3,007 3,087 3,238 2,959Brookings County . . . . . . . . . . . . 31,965 28,220 25,207 24,332 22,158 13,137 11,576 9,824 9,074 6,889Brown County . . . . . . . . . . . . . . . 36,531 35,460 35,580 36,962 36,920 16,706 15,861 15,101 14,674 12,068Brule County . . . . . . . . . . . . . . . . 5,255 5,364 5,485 5,245 5,870 2,433 2,272 2,275 2,170 2,070Buffalo County . . . . . . . . . . . . . . . 1,912 2,032 1,759 1,795 1,739 609 602 535 499 489Butte County . . . . . . . . . . . . . . . . 10,110 9,094 7,914 8,372 7,825 4,621 4,059 3,502 3,403 2,836Campbell County . . . . . . . . . . . . . 1,466 1,782 1,965 2,243 2,866 980 962 944 960 965
Charles Mix County . . . . . . . . . . . 9,129 9,350 9,131 9,680 9,994 3,849 3,853 3,751 3,802 3,408Clark County . . . . . . . . . . . . . . . . 3,691 4,143 4,403 4,894 5,515 1,710 1,880 2,026 2,176 2,050Clay County . . . . . . . . . . . . . . . . . 13,864 13,537 13,186 13,689 12,923 5,639 5,438 4,892 4,924 3,920Codington County . . . . . . . . . . . . 27,227 25,897 22,698 20,885 19,140 12,397 11,324 9,539 8,512 6,763Corson County . . . . . . . . . . . . . . . 4,050 4,181 4,195 5,196 4,994 1,540 1,536 1,557 1,683 1,452Custer County . . . . . . . . . . . . . . . 8,216 7,275 6,179 6,000 4,698 4,628 3,624 3,003 2,785 1,901Davison County . . . . . . . . . . . . . . 19,504 18,741 17,503 17,820 17,319 8,852 8,093 7,490 7,229 5,847Day County . . . . . . . . . . . . . . . . . 5,710 6,267 6,978 8,133 8,713 3,630 3,618 3,914 4,033 3,684Deuel County . . . . . . . . . . . . . . . . 4,364 4,498 4,522 5,289 5,686 2,204 2,172 2,208 2,330 2,188Dewey County . . . . . . . . . . . . . . . 5,301 5,972 5,523 5,366 5,170 2,002 2,133 2,123 1,871 1,554
Douglas County . . . . . . . . . . . . . . 3,002 3,458 3,746 4,181 4,569 1,439 1,453 1,517 1,595 1,527Edmunds County . . . . . . . . . . . . . 4,071 4,367 4,356 5,159 5,548 1,966 2,022 2,004 2,111 1,939Fall River County . . . . . . . . . . . . . 7,094 7,453 7,353 8,439 7,505 4,191 3,812 3,692 3,995 3,203Faulk County . . . . . . . . . . . . . . . . 2,364 2,640 2,744 3,327 3,893 1,136 1,235 1,286 1,426 1,387Grant County . . . . . . . . . . . . . . . . 7,356 7,847 8,372 9,013 9,005 3,526 3,456 3,549 3,567 2,999Gregory County . . . . . . . . . . . . . . 4,271 4,792 5,359 6,015 6,710 2,503 2,405 2,595 2,610 2,507Haakon County . . . . . . . . . . . . . . 1,937 2,196 2,624 2,794 2,802 1,013 1,002 1,071 1,128 1,025Hamlin County . . . . . . . . . . . . . . . 5,903 5,540 4,974 5,261 5,520 2,760 2,626 2,500 2,554 2,265Hand County . . . . . . . . . . . . . . . . 3,431 3,741 4,272 4,948 5,883 1,815 1,840 2,053 2,018 2,054Hanson County . . . . . . . . . . . . . . 3,331 3,139 2,994 3,415 3,781 1,177 1,218 1,232 1,253 1,278
Harding County . . . . . . . . . . . . . . 1,255 1,353 1,669 1,700 1,855 731 804 776 803 629Hughes County . . . . . . . . . . . . . . 17,022 16,481 14,817 14,220 11,632 7,623 7,055 6,255 5,607 3,773Hutchinson County . . . . . . . . . . . 7,343 8,075 8,262 9,350 10,379 3,351 3,517 3,657 3,867 3,604Hyde County . . . . . . . . . . . . . . . . 1,420 1,671 1,696 2,069 2,515 708 769 816 863 879Jackson County . . . . . . . . . . . . . . 3,031 2,930 2,811 3,437 1,531 1,193 1,173 1,147 1,296 589Jerauld County . . . . . . . . . . . . . . 2,071 2,295 2,425 2,929 3,310 1,070 1,167 1,182 1,210 1,246Jones County . . . . . . . . . . . . . . . . 1,006 1,193 1,324 1,463 1,882 589 614 699 725 741Kingsbury County . . . . . . . . . . . . 5,148 5,815 5,925 6,679 7,657 2,720 2,724 2,765 3,042 2,759Lake County . . . . . . . . . . . . . . . . 11,200 11,276 10,550 10,724 11,456 5,559 5,282 5,148 5,082 4,221Lawrence County . . . . . . . . . . . . . 24,097 21,802 20,655 18,339 17,453 12,756 10,427 9,092 7,955 6,156
Lincoln County . . . . . . . . . . . . . . . 44,828 r 24,147 15,427 13,942 11,761 17,875 9,131 5,823 5,348 4,077Lyman County . . . . . . . . . . . . . . . 3,755 3,895 3,638 3,864 4,060 1,704 1,636 1,523 1,579 1,343McCook County . . . . . . . . . . . . . . 5,618 5,832 5,688 6,444 7,246 2,491 2,383 2,371 2,585 2,439McPherson County . . . . . . . . . . . 2,459 2,904 3,228 4,027 5,022 1,418 1,465 1,566 1,699 1,747Marshall County . . . . . . . . . . . . . . 4,656 4,576 4,844 5,404 5,965 2,534 2,562 2,640 2,765 2,374Meade County . . . . . . . . . . . . . . . 25,434 24,253 21,878 20,717 17,020 11,000 10,149 7,592 7,098 4,556Mellette County . . . . . . . . . . . . . . 2,048 2,083 2,137 2,249 2,420 838 824 910 868 850Miner County . . . . . . . . . . . . . . . . 2,389 2,884 3,272 3,739 4,454 1,308 1,408 1,474 1,657 1,614Minnehaha County . . . . . . . . . . . 169,468 r 148,265 123,809 109,435 95,209 71,557 60,237 49,780 42,680 30,386Moody County . . . . . . . . . . . . . . . 6,486 6,595 6,507 6,692 7,622 2,824 2,745 2,666 2,729 2,484
Pennington County . . . . . . . . . . . 100,948 88,565 81,343 70,361 59,349 44,949 37,249 33,741 28,217 20,021Perkins County . . . . . . . . . . . . . . 2,982 3,363 3,932 4,700 4,769 1,739 1,854 2,007 2,082 1,720Potter County . . . . . . . . . . . . . . . . 2,329 2,693 3,190 3,674 4,449 1,500 1,760 1,664 1,534 1,496Roberts County . . . . . . . . . . . . . . 10,149 10,016 9,914 10,911 11,678 4,905 4,734 4,728 4,768 4,296Sanborn County . . . . . . . . . . . . . 2,355 2,675 2,833 3,213 3,697 1,172 1,220 1,326 1,438 1,426Shannon County . . . . . . . . . . . . . 13,586 12,466 9,902 11,323 8,198 3,593 3,123 2,699 2,666 2,174Spink County . . . . . . . . . . . . . . . . 6,415 7,454 7,981 9,201 10,595 3,139 3,352 3,545 3,799 3,562Stanley County . . . . . . . . . . . . . . 2,966 2,772 2,453 2,533 2,457 1,387 1,277 1,056 968 815Sully County . . . . . . . . . . . . . . . . 1,373 1,556 1,589 1,990 2,362 845 844 811 831 783Todd County . . . . . . . . . . . . . . . . 9,612 9,050 8,352 7,328 6,606 3,142 2,766 2,572 2,366 1,805
Tripp County . . . . . . . . . . . . . . . . 5,644 6,430 6,924 7,268 8,171 3,072 3,036 3,023 3,036 2,920Turner County . . . . . . . . . . . . . . . 8,347 8,849 8,576 9,255 9,872 3,939 3,852 3,800 4,023 3,748Union County . . . . . . . . . . . . . . . . 14,399 12,584 10,189 10,938 9,643 6,280 5,345 4,286 4,452 3,533Walworth County . . . . . . . . . . . . . 5,438 5,974 6,087 7,011 7,842 3,003 3,144 2,928 2,965 2,657Yankton County . . . . . . . . . . . . . . 22,438 21,652 19,252 18,952 19,039 9,652 8,840 7,571 7,168 5,837Ziebach County . . . . . . . . . . . . . . 2,801 2,519 2,220 2,308 2,221 987 879 800 781 636

Population and Housing Unit Counts South Dakota 7U.S. Census Bureau, 2010 Census
Table 5. Population, Housing Units, Land Area, and Density: 2010; and Percent Change: 1980 to 2010[For information concerning historical counts and geographic change, see “User Notes .” For information on confidentiality, nonsampling error, and definitions, see Appendixes]
StateCounty/County Equivalent
PopulationHousing
units
Land area in square
miles
Average per square mile of land Percent change
Population density
Housing unit
density
Population Housing units
2000 to 2010
1990 to 2000
1980 to 1990
2000 to 2010
1990 to 2000
1980 to 1990
South Dakota . . . . . . . . . . . . . . . 814,180 363,438 75,811 .00 10 .7 4 .8 7 .9 8 .5 0 .8 12 .4 10 .5 5 .6
Aurora County . . . . . . . . . . . . . . . . . . . . 2,710 1,324 708 .42 3 .8 1 .9 –11 .4 –2 .5 –13 .6 2 .0 –3 .3 –7 .4Beadle County . . . . . . . . . . . . . . . . . . . . 17,398 8,304 1,258 .71 13 .8 6 .6 2 .2 –6 .7 –4 .9 1 .2 1 .4 –1 .7Bennett County . . . . . . . . . . . . . . . . . . . 3,431 1,263 1,184 .71 2 .9 1 .1 –4 .0 11 .5 5 .3 –1 .2 –1 .1 12 .7Bon Homme County . . . . . . . . . . . . . . . 7,070 2,931 563 .70 12 .5 5 .2 –2 .6 2 .4 –12 .0 –2 .5 –2 .6 –4 .7Brookings County . . . . . . . . . . . . . . . . . 31,965 13,137 792 .21 40 .3 16 .6 13 .3 12 .0 3 .6 13 .5 17 .8 8 .3Brown County . . . . . . . . . . . . . . . . . . . . 36,531 16,706 1,712 .98 21 .3 9 .8 3 .0 –0 .3 –3 .7 5 .3 5 .0 2 .9Brule County . . . . . . . . . . . . . . . . . . . . . 5,255 2,433 817 .24 6 .4 3 .0 –2 .0 –2 .2 4 .6 7 .1 –0 .1 4 .8Buffalo County . . . . . . . . . . . . . . . . . . . . 1,912 609 471 .38 4 .1 1 .3 –5 .9 15 .5 –2 .0 1 .2 12 .5 7 .2Butte County . . . . . . . . . . . . . . . . . . . . . 10,110 4,621 2,249 .90 4 .5 2 .1 11 .2 14 .9 –5 .5 13 .8 15 .9 2 .9Campbell County . . . . . . . . . . . . . . . . . . 1,466 980 733 .68 2 .0 1 .3 –17 .7 –9 .3 –12 .4 1 .9 1 .9 –1 .7
Charles Mix County . . . . . . . . . . . . . . . . 9,129 3,849 1,097 .49 8 .3 3 .5 –2 .4 2 .4 –5 .7 –0 .1 2 .7 –1 .3Clark County . . . . . . . . . . . . . . . . . . . . . 3,691 1,710 957 .60 3 .9 1 .8 –10 .9 –5 .9 –10 .0 –9 .0 –7 .2 –6 .9Clay County . . . . . . . . . . . . . . . . . . . . . . 13,864 5,639 412 .19 33 .6 13 .7 2 .4 2 .7 –3 .7 3 .7 11 .2 –0 .6Codington County . . . . . . . . . . . . . . . . . 27,227 12,397 688 .50 39 .5 18 .0 5 .1 14 .1 8 .7 9 .5 18 .7 12 .1Corson County . . . . . . . . . . . . . . . . . . . . 4,050 1,540 2,469 .69 1 .6 0 .6 –3 .1 –0 .3 –19 .3 0 .3 –1 .3 –7 .5Custer County . . . . . . . . . . . . . . . . . . . . 8,216 4,628 1,557 .00 5 .3 3 .0 12 .9 17 .7 3 .0 27 .7 20 .7 7 .8Davison County . . . . . . . . . . . . . . . . . . . 19,504 8,852 435 .56 44 .8 20 .3 4 .1 7 .1 –1 .8 9 .4 8 .1 3 .6Day County . . . . . . . . . . . . . . . . . . . . . . 5,710 3,630 1,027 .87 5 .6 3 .5 –8 .9 –10 .2 –14 .2 0 .3 –7 .6 –3 .0Deuel County . . . . . . . . . . . . . . . . . . . . . 4,364 2,204 622 .69 7 .0 3 .5 –3 .0 –0 .5 –14 .5 1 .5 –1 .6 –5 .2Dewey County . . . . . . . . . . . . . . . . . . . . 5,301 2,002 2,302 .49 2 .3 0 .9 –11 .2 8 .1 2 .9 –6 .1 0 .5 13 .5
Douglas County . . . . . . . . . . . . . . . . . . . 3,002 1,439 431 .80 7 .0 3 .3 –13 .2 –7 .7 –10 .4 –1 .0 –4 .2 –4 .9Edmunds County . . . . . . . . . . . . . . . . . . 4,071 1,966 1,125 .96 3 .6 1 .7 –6 .8 0 .3 –15 .6 –2 .8 0 .9 –5 .1Fall River County . . . . . . . . . . . . . . . . . . 7,094 4,191 1,739 .92 4 .1 2 .4 –4 .8 1 .4 –12 .9 9 .9 3 .3 –7 .6Faulk County . . . . . . . . . . . . . . . . . . . . . 2,364 1,136 981 .75 2 .4 1 .2 –10 .5 –3 .8 –17 .5 –8 .0 –4 .0 –9 .8Grant County . . . . . . . . . . . . . . . . . . . . . 7,356 3,526 681 .46 10 .8 5 .2 –6 .3 –6 .3 –7 .1 2 .0 –2 .6 –0 .5Gregory County . . . . . . . . . . . . . . . . . . . 4,271 2,503 1,014 .96 4 .2 2 .5 –10 .9 –10 .6 –10 .9 4 .1 –7 .3 –0 .6Haakon County . . . . . . . . . . . . . . . . . . . 1,937 1,013 1,810 .53 1 .1 0 .6 –11 .8 –16 .3 –6 .1 1 .1 –6 .4 –5 .1Hamlin County . . . . . . . . . . . . . . . . . . . . 5,903 2,760 507 .23 11 .6 5 .4 6 .6 11 .4 –5 .5 5 .1 5 .0 –2 .1Hand County . . . . . . . . . . . . . . . . . . . . . 3,431 1,815 1,436 .61 2 .4 1 .3 –8 .3 –12 .4 –13 .7 –1 .4 –10 .4 1 .7Hanson County . . . . . . . . . . . . . . . . . . . 3,331 1,177 434 .51 7 .7 2 .7 6 .1 4 .8 –12 .3 –3 .4 –1 .1 –1 .7
Harding County . . . . . . . . . . . . . . . . . . . 1,255 731 2,671 .37 0 .5 0 .3 –7 .2 –18 .9 –1 .8 –9 .1 3 .6 –3 .4Hughes County . . . . . . . . . . . . . . . . . . . 17,022 7,623 741 .56 23 .0 10 .3 3 .3 11 .2 4 .2 8 .1 12 .8 11 .6Hutchinson County . . . . . . . . . . . . . . . . 7,343 3,351 812 .90 9 .0 4 .1 –9 .1 –2 .3 –11 .6 –4 .7 –3 .8 –5 .4Hyde County . . . . . . . . . . . . . . . . . . . . . 1,420 708 860 .52 1 .7 0 .8 –15 .0 –1 .5 –18 .0 –7 .9 –5 .8 –5 .4Jackson County . . . . . . . . . . . . . . . . . . . 3,031 1,193 1,863 .91 1 .6 0 .6 3 .4 4 .2 –18 .2 1 .7 2 .3 –11 .5Jerauld County . . . . . . . . . . . . . . . . . . . 2,071 1,070 526 .23 3 .9 2 .0 –9 .8 –5 .4 –17 .2 –8 .3 –1 .3 –2 .3Jones County . . . . . . . . . . . . . . . . . . . . . 1,006 589 969 .68 1 .0 0 .6 –15 .7 –9 .9 –9 .5 –4 .1 –12 .2 –3 .6Kingsbury County . . . . . . . . . . . . . . . . . 5,148 2,720 832 .24 6 .2 3 .3 –11 .5 –1 .9 –11 .3 –0 .1 –1 .5 –9 .1Lake County . . . . . . . . . . . . . . . . . . . . . 11,200 5,559 563 .28 19 .9 9 .9 –0 .7 6 .9 –1 .6 5 .2 2 .6 1 .3Lawrence County . . . . . . . . . . . . . . . . . . 24,097 12,756 800 .04 30 .1 15 .9 10 .5 5 .6 12 .6 22 .3 14 .7 14 .3
Lincoln County . . . . . . . . . . . . . . . . . . . . 44,828 17,875 577 .28 77 .7 31 .0 85 .6 56 .4 10 .7 95 .8 56 .8 8 .9Lyman County . . . . . . . . . . . . . . . . . . . . 3,755 1,704 1,641 .94 2 .3 1 .0 –3 .6 7 .1 –5 .8 4 .2 7 .4 –3 .5McCook County . . . . . . . . . . . . . . . . . . . 5,618 2,491 574 .20 9 .8 4 .3 –3 .7 2 .5 –11 .7 4 .5 0 .5 –8 .3McPherson County . . . . . . . . . . . . . . . . 2,459 1,418 1,136 .64 2 .2 1 .2 –15 .3 –10 .0 –19 .8 –3 .2 –6 .4 –7 .8Marshall County . . . . . . . . . . . . . . . . . . . 4,656 2,534 838 .07 5 .6 3 .0 1 .7 –5 .5 –10 .4 –1 .1 –3 .0 –4 .5Meade County . . . . . . . . . . . . . . . . . . . . 25,434 11,000 3,470 .98 7 .3 3 .2 4 .9 10 .9 5 .6 8 .4 33 .7 7 .0Mellette County . . . . . . . . . . . . . . . . . . . 2,048 838 1,307 .31 1 .6 0 .6 –1 .7 –2 .5 –5 .0 1 .7 –9 .5 4 .8Miner County . . . . . . . . . . . . . . . . . . . . . 2,389 1,308 570 .31 4 .2 2 .3 –17 .2 –11 .9 –12 .5 –7 .1 –4 .5 –11 .0Minnehaha County . . . . . . . . . . . . . . . . 169,468 71,557 807 .15 210 .0 88 .7 14 .3 19 .8 13 .1 18 .8 21 .0 16 .6Moody County . . . . . . . . . . . . . . . . . . . . 6,486 2,824 519 .39 12 .5 5 .4 –1 .7 1 .4 –2 .8 2 .9 3 .0 –2 .3
Pennington County . . . . . . . . . . . . . . . . 100,948 44,949 2,776 .55 36 .4 16 .2 14 .0 8 .9 15 .6 20 .7 10 .4 19 .6Perkins County . . . . . . . . . . . . . . . . . . . 2,982 1,739 2,870 .48 1 .0 0 .6 –11 .3 –14 .5 –16 .3 –6 .2 –7 .6 –3 .6Potter County . . . . . . . . . . . . . . . . . . . . . 2,329 1,500 861 .14 2 .7 1 .7 –13 .5 –15 .6 –13 .2 –14 .8 5 .8 8 .5Roberts County . . . . . . . . . . . . . . . . . . . 10,149 4,905 1,101 .04 9 .2 4 .5 1 .3 1 .0 –9 .1 3 .6 0 .1 –0 .8Sanborn County . . . . . . . . . . . . . . . . . . 2,355 1,172 569 .32 4 .1 2 .1 –12 .0 –5 .6 –11 .8 –3 .9 –8 .0 –7 .8Shannon County . . . . . . . . . . . . . . . . . . 13,586 3,593 2,093 .90 6 .5 1 .7 9 .0 25 .9 –12 .5 15 .0 15 .7 1 .2Spink County . . . . . . . . . . . . . . . . . . . . . 6,415 3,139 1,503 .93 4 .3 2 .1 –13 .9 –6 .6 –13 .3 –6 .4 –5 .4 –6 .7Stanley County . . . . . . . . . . . . . . . . . . . 2,966 1,387 1,444 .43 2 .1 1 .0 7 .0 13 .0 –3 .2 8 .6 20 .9 9 .1Sully County . . . . . . . . . . . . . . . . . . . . . 1,373 845 1,006 .82 1 .4 0 .8 –11 .8 –2 .1 –20 .2 0 .1 4 .1 –2 .4Todd County . . . . . . . . . . . . . . . . . . . . . 9,612 3,142 1,388 .56 6 .9 2 .3 6 .2 8 .4 14 .0 13 .6 7 .5 8 .7
Tripp County . . . . . . . . . . . . . . . . . . . . . 5,644 3,072 1,612 .45 3 .5 1 .9 –12 .2 –7 .1 –4 .7 1 .2 0 .4 –0 .4Turner County . . . . . . . . . . . . . . . . . . . . 8,347 3,939 617 .06 13 .5 6 .4 –5 .7 3 .2 –7 .3 2 .3 1 .4 –5 .5Union County . . . . . . . . . . . . . . . . . . . . . 14,399 6,280 460 .54 31 .3 13 .6 14 .4 23 .5 –6 .8 17 .5 24 .7 –3 .7Walworth County . . . . . . . . . . . . . . . . . . 5,438 3,003 708 .63 7 .7 4 .2 –9 .0 –1 .9 –13 .2 –4 .5 7 .4 –1 .2Yankton County . . . . . . . . . . . . . . . . . . . 22,438 9,652 521 .16 43 .1 18 .5 3 .6 12 .5 1 .6 9 .2 16 .8 5 .6Ziebach County . . . . . . . . . . . . . . . . . . . 2,801 987 1,961 .27 1 .4 0 .5 11 .2 13 .5 –3 .8 12 .3 9 .9 2 .4
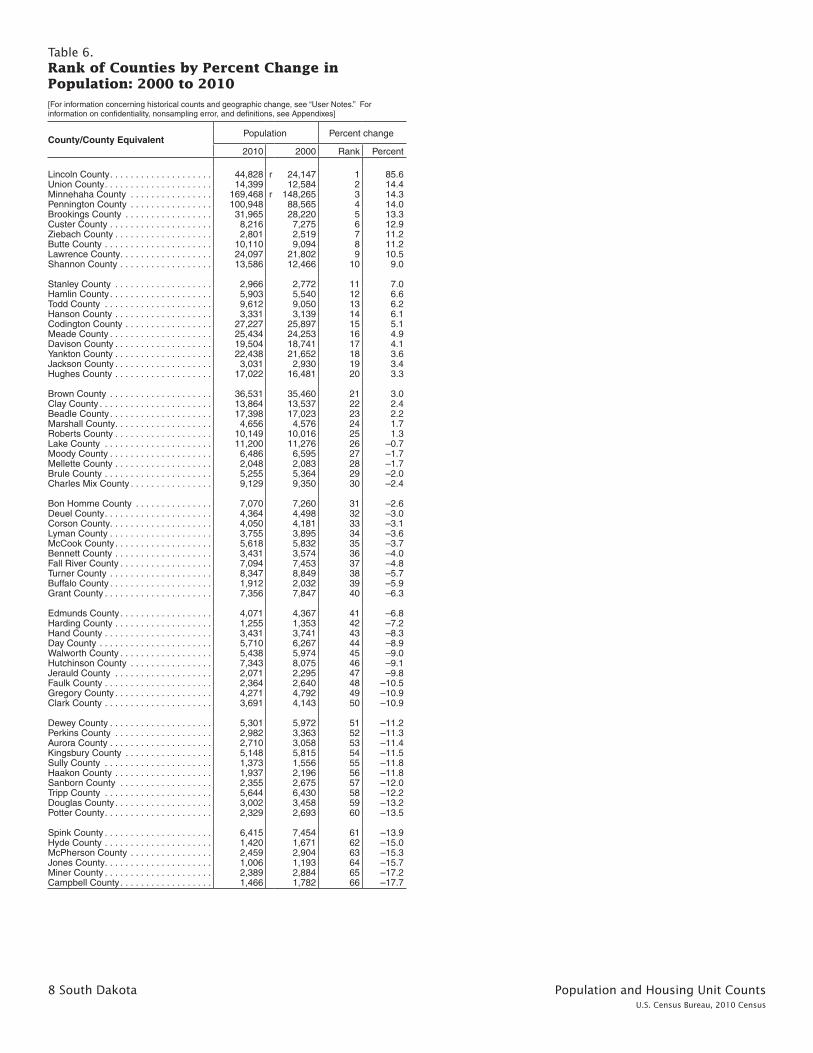
8 South Dakota Population and Housing Unit CountsU.S. Census Bureau, 2010 Census
Table 6. Rank of Counties by Percent Change in Population: 2000 to 2010 [For information concerning historical counts and geographic change, see “User Notes .” For information on confidentiality, nonsampling error, and definitions, see Appendixes]
County/County EquivalentPopulation Percent change
2010 2000 Rank Percent
Lincoln County . . . . . . . . . . . . . . . . . . . . 44,828 r 24,147 1 85 .6Union County . . . . . . . . . . . . . . . . . . . . . 14,399 12,584 2 14 .4Minnehaha County . . . . . . . . . . . . . . . . 169,468 r 148,265 3 14 .3Pennington County . . . . . . . . . . . . . . . . 100,948 88,565 4 14 .0Brookings County . . . . . . . . . . . . . . . . . 31,965 28,220 5 13 .3Custer County . . . . . . . . . . . . . . . . . . . . 8,216 7,275 6 12 .9Ziebach County . . . . . . . . . . . . . . . . . . . 2,801 2,519 7 11 .2Butte County . . . . . . . . . . . . . . . . . . . . . 10,110 9,094 8 11 .2Lawrence County . . . . . . . . . . . . . . . . . . 24,097 21,802 9 10 .5Shannon County . . . . . . . . . . . . . . . . . . 13,586 12,466 10 9 .0
Stanley County . . . . . . . . . . . . . . . . . . . 2,966 2,772 11 7 .0Hamlin County . . . . . . . . . . . . . . . . . . . . 5,903 5,540 12 6 .6Todd County . . . . . . . . . . . . . . . . . . . . . 9,612 9,050 13 6 .2Hanson County . . . . . . . . . . . . . . . . . . . 3,331 3,139 14 6 .1Codington County . . . . . . . . . . . . . . . . . 27,227 25,897 15 5 .1Meade County . . . . . . . . . . . . . . . . . . . . 25,434 24,253 16 4 .9Davison County . . . . . . . . . . . . . . . . . . . 19,504 18,741 17 4 .1Yankton County . . . . . . . . . . . . . . . . . . . 22,438 21,652 18 3 .6Jackson County . . . . . . . . . . . . . . . . . . . 3,031 2,930 19 3 .4Hughes County . . . . . . . . . . . . . . . . . . . 17,022 16,481 20 3 .3
Brown County . . . . . . . . . . . . . . . . . . . . 36,531 35,460 21 3 .0Clay County . . . . . . . . . . . . . . . . . . . . . . 13,864 13,537 22 2 .4Beadle County . . . . . . . . . . . . . . . . . . . . 17,398 17,023 23 2 .2Marshall County . . . . . . . . . . . . . . . . . . . 4,656 4,576 24 1 .7Roberts County . . . . . . . . . . . . . . . . . . . 10,149 10,016 25 1 .3Lake County . . . . . . . . . . . . . . . . . . . . . 11,200 11,276 26 –0 .7Moody County . . . . . . . . . . . . . . . . . . . . 6,486 6,595 27 –1 .7Mellette County . . . . . . . . . . . . . . . . . . . 2,048 2,083 28 –1 .7Brule County . . . . . . . . . . . . . . . . . . . . . 5,255 5,364 29 –2 .0Charles Mix County . . . . . . . . . . . . . . . . 9,129 9,350 30 –2 .4
Bon Homme County . . . . . . . . . . . . . . . 7,070 7,260 31 –2 .6Deuel County . . . . . . . . . . . . . . . . . . . . . 4,364 4,498 32 –3 .0Corson County . . . . . . . . . . . . . . . . . . . . 4,050 4,181 33 –3 .1Lyman County . . . . . . . . . . . . . . . . . . . . 3,755 3,895 34 –3 .6McCook County . . . . . . . . . . . . . . . . . . . 5,618 5,832 35 –3 .7Bennett County . . . . . . . . . . . . . . . . . . . 3,431 3,574 36 –4 .0Fall River County . . . . . . . . . . . . . . . . . . 7,094 7,453 37 –4 .8Turner County . . . . . . . . . . . . . . . . . . . . 8,347 8,849 38 –5 .7Buffalo County . . . . . . . . . . . . . . . . . . . . 1,912 2,032 39 –5 .9Grant County . . . . . . . . . . . . . . . . . . . . . 7,356 7,847 40 –6 .3
Edmunds County . . . . . . . . . . . . . . . . . . 4,071 4,367 41 –6 .8Harding County . . . . . . . . . . . . . . . . . . . 1,255 1,353 42 –7 .2Hand County . . . . . . . . . . . . . . . . . . . . . 3,431 3,741 43 –8 .3Day County . . . . . . . . . . . . . . . . . . . . . . 5,710 6,267 44 –8 .9Walworth County . . . . . . . . . . . . . . . . . . 5,438 5,974 45 –9 .0Hutchinson County . . . . . . . . . . . . . . . . 7,343 8,075 46 –9 .1Jerauld County . . . . . . . . . . . . . . . . . . . 2,071 2,295 47 –9 .8Faulk County . . . . . . . . . . . . . . . . . . . . . 2,364 2,640 48 –10 .5Gregory County . . . . . . . . . . . . . . . . . . . 4,271 4,792 49 –10 .9Clark County . . . . . . . . . . . . . . . . . . . . . 3,691 4,143 50 –10 .9
Dewey County . . . . . . . . . . . . . . . . . . . . 5,301 5,972 51 –11 .2Perkins County . . . . . . . . . . . . . . . . . . . 2,982 3,363 52 –11 .3Aurora County . . . . . . . . . . . . . . . . . . . . 2,710 3,058 53 –11 .4Kingsbury County . . . . . . . . . . . . . . . . . 5,148 5,815 54 –11 .5Sully County . . . . . . . . . . . . . . . . . . . . . 1,373 1,556 55 –11 .8Haakon County . . . . . . . . . . . . . . . . . . . 1,937 2,196 56 –11 .8Sanborn County . . . . . . . . . . . . . . . . . . 2,355 2,675 57 –12 .0Tripp County . . . . . . . . . . . . . . . . . . . . . 5,644 6,430 58 –12 .2Douglas County . . . . . . . . . . . . . . . . . . . 3,002 3,458 59 –13 .2Potter County . . . . . . . . . . . . . . . . . . . . . 2,329 2,693 60 –13 .5
Spink County . . . . . . . . . . . . . . . . . . . . . 6,415 7,454 61 –13 .9Hyde County . . . . . . . . . . . . . . . . . . . . . 1,420 1,671 62 –15 .0McPherson County . . . . . . . . . . . . . . . . 2,459 2,904 63 –15 .3Jones County . . . . . . . . . . . . . . . . . . . . . 1,006 1,193 64 –15 .7Miner County . . . . . . . . . . . . . . . . . . . . . 2,389 2,884 65 –17 .2Campbell County . . . . . . . . . . . . . . . . . . 1,466 1,782 66 –17 .7
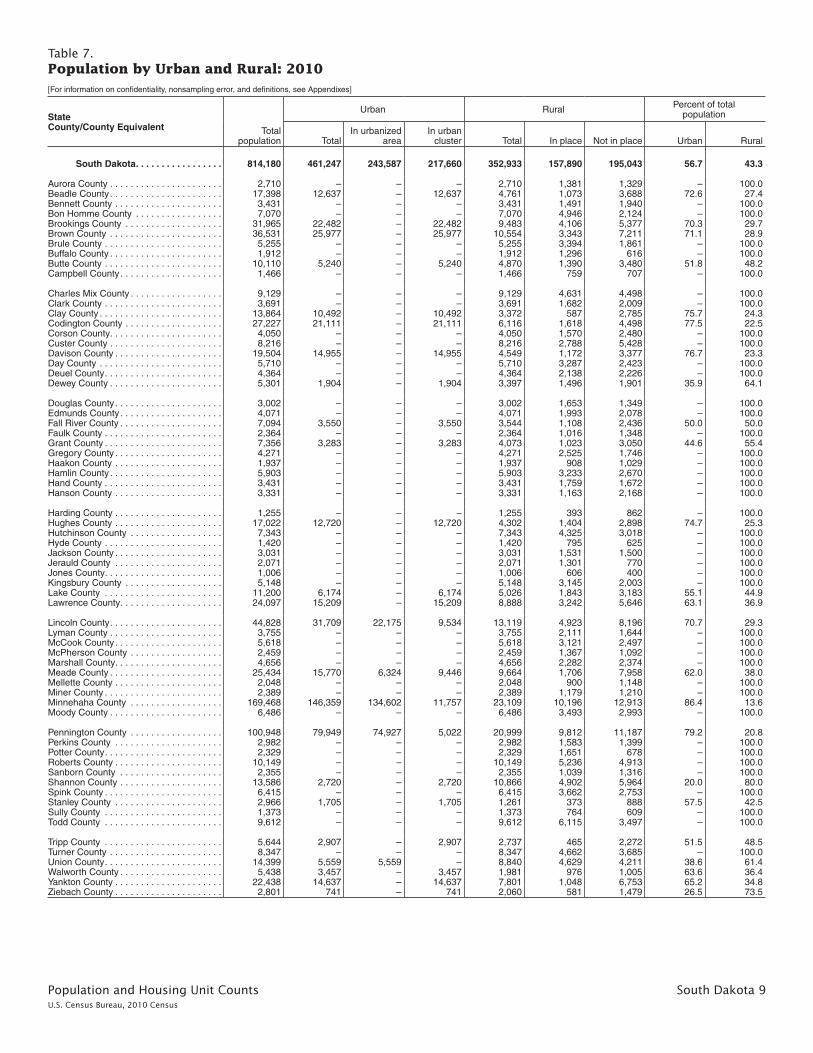
Population and Housing Unit Counts South Dakota 9U.S. Census Bureau, 2010 Census
Table 7. Population by Urban and Rural: 2010[For information on confidentiality, nonsampling error, and definitions, see Appendixes]
StateCounty/County Equivalent Total
population
Urban Rural Percent of total population
TotalIn urbanized
areaIn urban
cluster Total In place Not in place Urban Rural
South Dakota . . . . . . . . . . . . . . . . . 814,180 461,247 243,587 217,660 352,933 157,890 195,043 56 .7 43 .3
Aurora County . . . . . . . . . . . . . . . . . . . . . . 2,710 – – – 2,710 1,381 1,329 – 100 .0Beadle County . . . . . . . . . . . . . . . . . . . . . . 17,398 12,637 – 12,637 4,761 1,073 3,688 72 .6 27 .4Bennett County . . . . . . . . . . . . . . . . . . . . . 3,431 – – – 3,431 1,491 1,940 – 100 .0Bon Homme County . . . . . . . . . . . . . . . . . 7,070 – – – 7,070 4,946 2,124 – 100 .0Brookings County . . . . . . . . . . . . . . . . . . . 31,965 22,482 – 22,482 9,483 4,106 5,377 70 .3 29 .7Brown County . . . . . . . . . . . . . . . . . . . . . . 36,531 25,977 – 25,977 10,554 3,343 7,211 71 .1 28 .9Brule County . . . . . . . . . . . . . . . . . . . . . . . 5,255 – – – 5,255 3,394 1,861 – 100 .0Buffalo County . . . . . . . . . . . . . . . . . . . . . . 1,912 – – – 1,912 1,296 616 – 100 .0Butte County . . . . . . . . . . . . . . . . . . . . . . . 10,110 5,240 – 5,240 4,870 1,390 3,480 51 .8 48 .2Campbell County . . . . . . . . . . . . . . . . . . . . 1,466 – – – 1,466 759 707 – 100 .0
Charles Mix County . . . . . . . . . . . . . . . . . . 9,129 – – – 9,129 4,631 4,498 – 100 .0Clark County . . . . . . . . . . . . . . . . . . . . . . . 3,691 – – – 3,691 1,682 2,009 – 100 .0Clay County . . . . . . . . . . . . . . . . . . . . . . . . 13,864 10,492 – 10,492 3,372 587 2,785 75 .7 24 .3Codington County . . . . . . . . . . . . . . . . . . . 27,227 21,111 – 21,111 6,116 1,618 4,498 77 .5 22 .5Corson County . . . . . . . . . . . . . . . . . . . . . . 4,050 – – – 4,050 1,570 2,480 – 100 .0Custer County . . . . . . . . . . . . . . . . . . . . . . 8,216 – – – 8,216 2,788 5,428 – 100 .0Davison County . . . . . . . . . . . . . . . . . . . . . 19,504 14,955 – 14,955 4,549 1,172 3,377 76 .7 23 .3Day County . . . . . . . . . . . . . . . . . . . . . . . . 5,710 – – – 5,710 3,287 2,423 – 100 .0Deuel County . . . . . . . . . . . . . . . . . . . . . . . 4,364 – – – 4,364 2,138 2,226 – 100 .0Dewey County . . . . . . . . . . . . . . . . . . . . . . 5,301 1,904 – 1,904 3,397 1,496 1,901 35 .9 64 .1
Douglas County . . . . . . . . . . . . . . . . . . . . . 3,002 – – – 3,002 1,653 1,349 – 100 .0Edmunds County . . . . . . . . . . . . . . . . . . . . 4,071 – – – 4,071 1,993 2,078 – 100 .0Fall River County . . . . . . . . . . . . . . . . . . . . 7,094 3,550 – 3,550 3,544 1,108 2,436 50 .0 50 .0Faulk County . . . . . . . . . . . . . . . . . . . . . . . 2,364 – – – 2,364 1,016 1,348 – 100 .0Grant County . . . . . . . . . . . . . . . . . . . . . . . 7,356 3,283 – 3,283 4,073 1,023 3,050 44 .6 55 .4Gregory County . . . . . . . . . . . . . . . . . . . . . 4,271 – – – 4,271 2,525 1,746 – 100 .0Haakon County . . . . . . . . . . . . . . . . . . . . . 1,937 – – – 1,937 908 1,029 – 100 .0Hamlin County . . . . . . . . . . . . . . . . . . . . . . 5,903 – – – 5,903 3,233 2,670 – 100 .0Hand County . . . . . . . . . . . . . . . . . . . . . . . 3,431 – – – 3,431 1,759 1,672 – 100 .0Hanson County . . . . . . . . . . . . . . . . . . . . . 3,331 – – – 3,331 1,163 2,168 – 100 .0
Harding County . . . . . . . . . . . . . . . . . . . . . 1,255 – – – 1,255 393 862 – 100 .0Hughes County . . . . . . . . . . . . . . . . . . . . . 17,022 12,720 – 12,720 4,302 1,404 2,898 74 .7 25 .3Hutchinson County . . . . . . . . . . . . . . . . . . 7,343 – – – 7,343 4,325 3,018 – 100 .0Hyde County . . . . . . . . . . . . . . . . . . . . . . . 1,420 – – – 1,420 795 625 – 100 .0Jackson County . . . . . . . . . . . . . . . . . . . . . 3,031 – – – 3,031 1,531 1,500 – 100 .0Jerauld County . . . . . . . . . . . . . . . . . . . . . 2,071 – – – 2,071 1,301 770 – 100 .0Jones County . . . . . . . . . . . . . . . . . . . . . . . 1,006 – – – 1,006 606 400 – 100 .0Kingsbury County . . . . . . . . . . . . . . . . . . . 5,148 – – – 5,148 3,145 2,003 – 100 .0Lake County . . . . . . . . . . . . . . . . . . . . . . . 11,200 6,174 – 6,174 5,026 1,843 3,183 55 .1 44 .9Lawrence County . . . . . . . . . . . . . . . . . . . . 24,097 15,209 – 15,209 8,888 3,242 5,646 63 .1 36 .9
Lincoln County . . . . . . . . . . . . . . . . . . . . . . 44,828 31,709 22,175 9,534 13,119 4,923 8,196 70 .7 29 .3Lyman County . . . . . . . . . . . . . . . . . . . . . . 3,755 – – – 3,755 2,111 1,644 – 100 .0McCook County . . . . . . . . . . . . . . . . . . . . . 5,618 – – – 5,618 3,121 2,497 – 100 .0McPherson County . . . . . . . . . . . . . . . . . . 2,459 – – – 2,459 1,367 1,092 – 100 .0Marshall County . . . . . . . . . . . . . . . . . . . . . 4,656 – – – 4,656 2,282 2,374 – 100 .0Meade County . . . . . . . . . . . . . . . . . . . . . . 25,434 15,770 6,324 9,446 9,664 1,706 7,958 62 .0 38 .0Mellette County . . . . . . . . . . . . . . . . . . . . . 2,048 – – – 2,048 900 1,148 – 100 .0Miner County . . . . . . . . . . . . . . . . . . . . . . . 2,389 – – – 2,389 1,179 1,210 – 100 .0Minnehaha County . . . . . . . . . . . . . . . . . . 169,468 146,359 134,602 11,757 23,109 10,196 12,913 86 .4 13 .6Moody County . . . . . . . . . . . . . . . . . . . . . . 6,486 – – – 6,486 3,493 2,993 – 100 .0
Pennington County . . . . . . . . . . . . . . . . . . 100,948 79,949 74,927 5,022 20,999 9,812 11,187 79 .2 20 .8Perkins County . . . . . . . . . . . . . . . . . . . . . 2,982 – – – 2,982 1,583 1,399 – 100 .0Potter County . . . . . . . . . . . . . . . . . . . . . . . 2,329 – – – 2,329 1,651 678 – 100 .0Roberts County . . . . . . . . . . . . . . . . . . . . . 10,149 – – – 10,149 5,236 4,913 – 100 .0Sanborn County . . . . . . . . . . . . . . . . . . . . 2,355 – – – 2,355 1,039 1,316 – 100 .0Shannon County . . . . . . . . . . . . . . . . . . . . 13,586 2,720 – 2,720 10,866 4,902 5,964 20 .0 80 .0Spink County . . . . . . . . . . . . . . . . . . . . . . . 6,415 – – – 6,415 3,662 2,753 – 100 .0Stanley County . . . . . . . . . . . . . . . . . . . . . 2,966 1,705 – 1,705 1,261 373 888 57 .5 42 .5Sully County . . . . . . . . . . . . . . . . . . . . . . . 1,373 – – – 1,373 764 609 – 100 .0Todd County . . . . . . . . . . . . . . . . . . . . . . . 9,612 – – – 9,612 6,115 3,497 – 100 .0
Tripp County . . . . . . . . . . . . . . . . . . . . . . . 5,644 2,907 – 2,907 2,737 465 2,272 51 .5 48 .5Turner County . . . . . . . . . . . . . . . . . . . . . . 8,347 – – – 8,347 4,662 3,685 – 100 .0Union County . . . . . . . . . . . . . . . . . . . . . . . 14,399 5,559 5,559 – 8,840 4,629 4,211 38 .6 61 .4Walworth County . . . . . . . . . . . . . . . . . . . . 5,438 3,457 – 3,457 1,981 976 1,005 63 .6 36 .4Yankton County . . . . . . . . . . . . . . . . . . . . . 22,438 14,637 – 14,637 7,801 1,048 6,753 65 .2 34 .8Ziebach County . . . . . . . . . . . . . . . . . . . . . 2,801 741 – 741 2,060 581 1,479 26 .5 73 .5
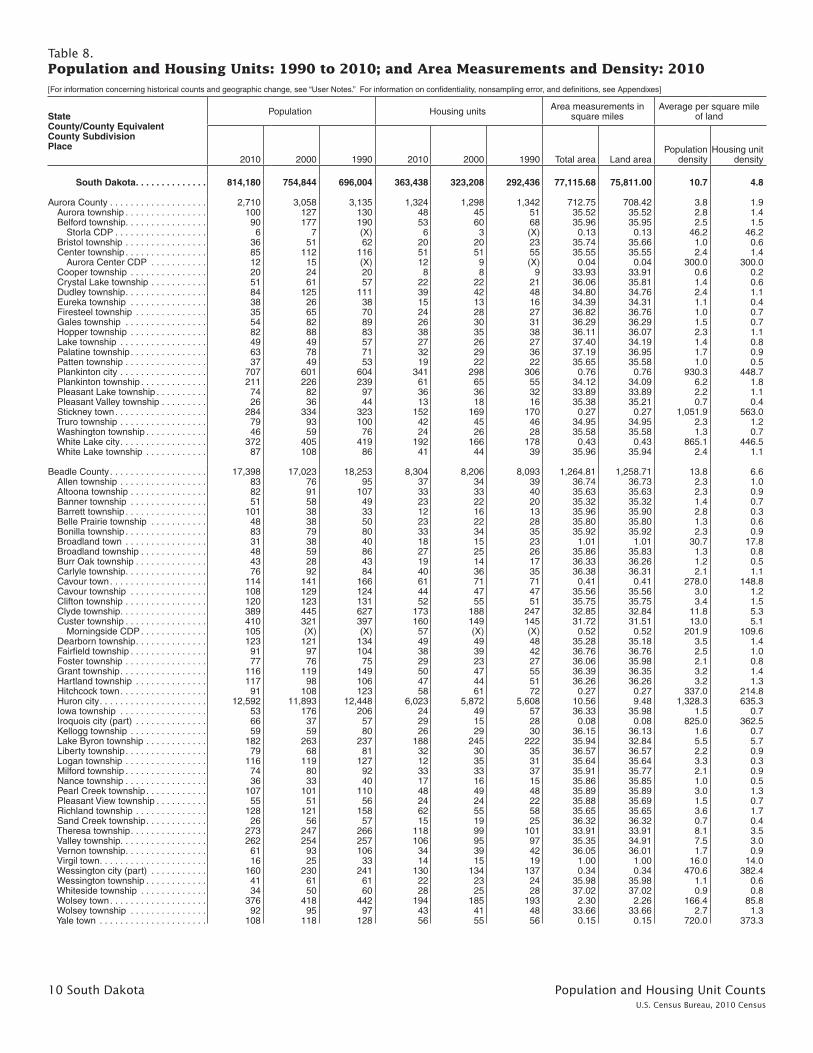
10 South Dakota Population and Housing Unit CountsU.S. Census Bureau, 2010 Census
Table 8. Population and Housing Units: 1990 to 2010; and Area Measurements and Density: 2010—Con.[For information concerning historical counts and geographic change, see “User Notes .” For information on confidentiality, nonsampling error, and definitions, see Appendixes]
StateCounty/County EquivalentCounty SubdivisionPlace
Population Housing units Area measurements in square miles
Average per square mile of land
2010 2000 1990 2010 2000 1990 Total area Land areaPopulation
densityHousing unit
density
South Dakota . . . . . . . . . . . . . . 814,180 754,844 696,004 363,438 323,208 292,436 77,115 .68 75,811 .00 10 .7 4 .8
Aurora County . . . . . . . . . . . . . . . . . . . 2,710 3,058 3,135 1,324 1,298 1,342 712 .75 708 .42 3 .8 1 .9 Aurora township . . . . . . . . . . . . . . . . 100 127 130 48 45 51 35 .52 35 .52 2 .8 1 .4 Belford township . . . . . . . . . . . . . . . . 90 177 190 53 60 68 35 .96 35 .95 2 .5 1 .5 Storla CDP . . . . . . . . . . . . . . . . . . 6 7 (X) 6 3 (X) 0 .13 0 .13 46 .2 46 .2 Bristol township . . . . . . . . . . . . . . . . 36 51 62 20 20 23 35 .74 35 .66 1 .0 0 .6 Center township . . . . . . . . . . . . . . . . 85 112 116 51 51 55 35 .55 35 .55 2 .4 1 .4 Aurora Center CDP . . . . . . . . . . . 12 15 (X) 12 9 (X) 0 .04 0 .04 300 .0 300 .0 Cooper township . . . . . . . . . . . . . . . 20 24 20 8 8 9 33 .93 33 .91 0 .6 0 .2 Crystal Lake township . . . . . . . . . . . 51 61 57 22 22 21 36 .06 35 .81 1 .4 0 .6 Dudley township . . . . . . . . . . . . . . . . 84 125 111 39 42 48 34 .80 34 .76 2 .4 1 .1 Eureka township . . . . . . . . . . . . . . . 38 26 38 15 13 16 34 .39 34 .31 1 .1 0 .4 Firesteel township . . . . . . . . . . . . . . 35 65 70 24 28 27 36 .82 36 .76 1 .0 0 .7 Gales township . . . . . . . . . . . . . . . . 54 82 89 26 30 31 36 .29 36 .29 1 .5 0 .7 Hopper township . . . . . . . . . . . . . . . 82 88 83 38 35 38 36 .11 36 .07 2 .3 1 .1 Lake township . . . . . . . . . . . . . . . . . 49 49 57 27 26 27 37 .40 34 .19 1 .4 0 .8 Palatine township . . . . . . . . . . . . . . . 63 78 71 32 29 36 37 .19 36 .95 1 .7 0 .9 Patten township . . . . . . . . . . . . . . . . 37 49 53 19 22 22 35 .65 35 .58 1 .0 0 .5 Plankinton city . . . . . . . . . . . . . . . . . 707 601 604 341 298 306 0 .76 0 .76 930 .3 448 .7 Plankinton township . . . . . . . . . . . . . 211 226 239 61 65 55 34 .12 34 .09 6 .2 1 .8 Pleasant Lake township . . . . . . . . . . 74 82 97 36 36 32 33 .89 33 .89 2 .2 1 .1 Pleasant Valley township . . . . . . . . . 26 36 44 13 18 16 35 .38 35 .21 0 .7 0 .4 Stickney town . . . . . . . . . . . . . . . . . . 284 334 323 152 169 170 0 .27 0 .27 1,051 .9 563 .0 Truro township . . . . . . . . . . . . . . . . . 79 93 100 42 45 46 34 .95 34 .95 2 .3 1 .2 Washington township . . . . . . . . . . . . 46 59 76 24 26 28 35 .58 35 .58 1 .3 0 .7 White Lake city . . . . . . . . . . . . . . . . . 372 405 419 192 166 178 0 .43 0 .43 865 .1 446 .5 White Lake township . . . . . . . . . . . . 87 108 86 41 44 39 35 .96 35 .94 2 .4 1 .1
Beadle County . . . . . . . . . . . . . . . . . . . 17,398 17,023 18,253 8,304 8,206 8,093 1,264 .81 1,258 .71 13 .8 6 .6 Allen township . . . . . . . . . . . . . . . . . 83 76 95 37 34 39 36 .74 36 .73 2 .3 1 .0 Altoona township . . . . . . . . . . . . . . . 82 91 107 33 33 40 35 .63 35 .63 2 .3 0 .9 Banner township . . . . . . . . . . . . . . . 51 58 49 23 22 20 35 .32 35 .32 1 .4 0 .7 Barrett township . . . . . . . . . . . . . . . . 101 38 33 12 16 13 35 .96 35 .90 2 .8 0 .3 Belle Prairie township . . . . . . . . . . . 48 38 50 23 22 28 35 .80 35 .80 1 .3 0 .6 Bonilla township . . . . . . . . . . . . . . . . 83 79 80 33 34 35 35 .92 35 .92 2 .3 0 .9 Broadland town . . . . . . . . . . . . . . . . 31 38 40 18 15 23 1 .01 1 .01 30 .7 17 .8 Broadland township . . . . . . . . . . . . . 48 59 86 27 25 26 35 .86 35 .83 1 .3 0 .8 Burr Oak township . . . . . . . . . . . . . . 43 28 43 19 14 17 36 .33 36 .26 1 .2 0 .5 Carlyle township . . . . . . . . . . . . . . . . 76 92 84 40 36 35 36 .38 36 .31 2 .1 1 .1 Cavour town . . . . . . . . . . . . . . . . . . . 114 141 166 61 71 71 0 .41 0 .41 278 .0 148 .8 Cavour township . . . . . . . . . . . . . . . 108 129 124 44 47 47 35 .56 35 .56 3 .0 1 .2 Clifton township . . . . . . . . . . . . . . . . 120 123 131 52 55 51 35 .75 35 .75 3 .4 1 .5 Clyde township . . . . . . . . . . . . . . . . . 389 445 627 173 188 247 32 .85 32 .84 11 .8 5 .3 Custer township . . . . . . . . . . . . . . . . 410 321 397 160 149 145 31 .72 31 .51 13 .0 5 .1 Morningside CDP . . . . . . . . . . . . . 105 (X) (X) 57 (X) (X) 0 .52 0 .52 201 .9 109 .6 Dearborn township . . . . . . . . . . . . . . 123 121 134 49 49 48 35 .28 35 .18 3 .5 1 .4 Fairfield township . . . . . . . . . . . . . . . 91 97 104 38 39 42 36 .76 36 .76 2 .5 1 .0 Foster township . . . . . . . . . . . . . . . . 77 76 75 29 23 27 36 .06 35 .98 2 .1 0 .8 Grant township . . . . . . . . . . . . . . . . . 116 119 149 50 47 55 36 .39 36 .35 3 .2 1 .4 Hartland township . . . . . . . . . . . . . . 117 98 106 47 44 51 36 .26 36 .26 3 .2 1 .3 Hitchcock town . . . . . . . . . . . . . . . . . 91 108 123 58 61 72 0 .27 0 .27 337 .0 214 .8 Huron city . . . . . . . . . . . . . . . . . . . . . 12,592 11,893 12,448 6,023 5,872 5,608 10 .56 9 .48 1,328 .3 635 .3 Iowa township . . . . . . . . . . . . . . . . . 53 176 206 24 49 57 36 .33 35 .98 1 .5 0 .7 Iroquois city (part) . . . . . . . . . . . . . . 66 37 57 29 15 28 0 .08 0 .08 825 .0 362 .5 Kellogg township . . . . . . . . . . . . . . . 59 59 80 26 29 30 36 .15 36 .13 1 .6 0 .7 Lake Byron township . . . . . . . . . . . . 182 263 237 188 245 222 35 .94 32 .84 5 .5 5 .7 Liberty township . . . . . . . . . . . . . . . . 79 68 81 32 30 35 36 .57 36 .57 2 .2 0 .9 Logan township . . . . . . . . . . . . . . . . 116 119 127 12 35 31 35 .64 35 .64 3 .3 0 .3 Milford township . . . . . . . . . . . . . . . . 74 80 92 33 33 37 35 .91 35 .77 2 .1 0 .9 Nance township . . . . . . . . . . . . . . . . 36 33 40 17 16 15 35 .86 35 .85 1 .0 0 .5 Pearl Creek township . . . . . . . . . . . . 107 101 110 48 49 48 35 .89 35 .89 3 .0 1 .3 Pleasant View township . . . . . . . . . . 55 51 56 24 24 22 35 .88 35 .69 1 .5 0 .7 Richland township . . . . . . . . . . . . . . 128 121 158 62 55 58 35 .65 35 .65 3 .6 1 .7 Sand Creek township . . . . . . . . . . . . 26 56 57 15 19 25 36 .32 36 .32 0 .7 0 .4 Theresa township . . . . . . . . . . . . . . . 273 247 266 118 99 101 33 .91 33 .91 8 .1 3 .5 Valley township . . . . . . . . . . . . . . . . . 262 254 257 106 95 97 35 .35 34 .91 7 .5 3 .0 Vernon township . . . . . . . . . . . . . . . . 61 93 106 34 39 42 36 .05 36 .01 1 .7 0 .9 Virgil town . . . . . . . . . . . . . . . . . . . . . 16 25 33 14 15 19 1 .00 1 .00 16 .0 14 .0 Wessington city (part) . . . . . . . . . . . 160 230 241 130 134 137 0 .34 0 .34 470 .6 382 .4 Wessington township . . . . . . . . . . . . 41 61 61 22 23 24 35 .98 35 .98 1 .1 0 .6 Whiteside township . . . . . . . . . . . . . 34 50 60 28 25 28 37 .02 37 .02 0 .9 0 .8 Wolsey town . . . . . . . . . . . . . . . . . . . 376 418 442 194 185 193 2 .30 2 .26 166 .4 85 .8 Wolsey township . . . . . . . . . . . . . . . 92 95 97 43 41 48 33 .66 33 .66 2 .7 1 .3 Yale town . . . . . . . . . . . . . . . . . . . . . 108 118 128 56 55 56 0 .15 0 .15 720 .0 373 .3

Population and Housing Unit Counts South Dakota 11U.S. Census Bureau, 2010 Census
Table 8. Population and Housing Units: 1990 to 2010; and Area Measurements and Density: 2010—Con.[For information concerning historical counts and geographic change, see “User Notes .” For information on confidentiality, nonsampling error, and definitions, see Appendixes]
StateCounty/County EquivalentCounty SubdivisionPlace
Population Housing units Area measurements in square miles
Average per square mile of land
2010 2000 1990 2010 2000 1990 Total area Land areaPopulation
densityHousing unit
density
South Dakota—Con .
Bennett County . . . . . . . . . . . . . . . . . . 3,431 3,574 3,206 1,263 1,278 1,292 1,190 .50 1,184 .71 2 .9 1 .1 East Bennett UT . . . . . . . . . . . . . . . . 992 1,104 926 382 392 370 662 .79 657 .88 1 .5 0 .6 Martin city . . . . . . . . . . . . . . . . . . . . 1,071 1,106 1,151 467 480 544 0 .53 0 .53 2,020 .8 881 .1 West Bennett UT . . . . . . . . . . . . . . . 1,368 1,364 1,129 414 406 378 527 .19 526 .31 2 .6 0 .8 Allen CDP . . . . . . . . . . . . . . . . . . . 420 419 (X) 84 87 (X) 3 .24 3 .24 129 .6 25 .9
Bon Homme County . . . . . . . . . . . . . . 7,070 7,260 7,089 2,931 3,007 3,087 581 .66 563 .70 12 .5 5 .2 Avon city . . . . . . . . . . . . . . . . . . . . . . 590 561 576 313 318 308 0 .64 0 .64 921 .9 489 .1 Northeast Bon Homme UT . . . . . . . 468 687 695 231 232 269 141 .17 140 .86 3 .3 1 .6 Northwest Bon Homme UT . . . . . . . 403 490 592 198 209 245 138 .40 138 .21 2 .9 1 .4 Scotland city . . . . . . . . . . . . . . . . . . . 841 891 968 455 469 496 0 .85 0 .85 989 .4 535 .3 Southeast Bon Homme UT . . . . . . . 576 561 547 186 200 218 107 .55 96 .74 6 .0 1 .9 Southwest Bon Homme UT . . . . . . . 713 1,622 1,273 385 399 411 190 .09 183 .45 3 .9 2 .1 Running Water CDP . . . . . . . . . . . 36 (X) (X) 37 (X) (X) 2 .09 2 .09 17 .2 17 .7 Springfield city . . . . . . . . . . . . . . . . . 1,989 792 834 433 400 382 1 .01 1 .01 1,969 .3 428 .7 Tabor town . . . . . . . . . . . . . . . . . . . . 423 417 403 199 201 194 0 .37 0 .37 1,143 .2 537 .8 Tyndall city . . . . . . . . . . . . . . . . . . . . 1,067 1,239 1,201 531 579 564 1 .58 1 .58 675 .3 336 .1
Brookings County . . . . . . . . . . . . . . . . 31,965 28,220 25,207 13,137 11,576 9,824 804 .94 792 .21 40 .3 16 .6 Afton township . . . . . . . . . . . . . . . . . 212 224 185 87 84 79 35 .39 35 .39 6 .0 2 .5 Alton township . . . . . . . . . . . . . . . . . 228 233 284 77 84 88 35 .17 35 .17 6 .5 2 .2 Argo township . . . . . . . . . . . . . . . . . 131 163 153 57 56 58 36 .19 36 .16 3 .6 1 .6 Arlington city (part) . . . . . . . . . . . . . . 8 5 6 2 2 2 0 .45 0 .45 17 .8 4 .4 Aurora town . . . . . . . . . . . . . . . . . . . 532 500 619 256 221 210 0 .46 0 .46 1,156 .5 556 .5 Aurora township . . . . . . . . . . . . . . . . 294 276 300 106 114 122 33 .00 32 .96 8 .9 3 .2 Bangor township . . . . . . . . . . . . . . . 145 176 176 60 65 75 35 .69 34 .96 4 .1 1 .7 Brookings city . . . . . . . . . . . . . . . . . . 22,056 18,504 16,270 8,715 7,359 6,012 13 .04 12 .94 1,704 .5 673 .5 Brookings township . . . . . . . . . . . . . 431 453 430 179 176 154 27 .60 27 .60 15 .6 6 .5 Bruce city . . . . . . . . . . . . . . . . . . . . . 204 272 235 111 117 104 0 .38 0 .37 551 .4 300 .0 Bushnell town . . . . . . . . . . . . . . . . . . 65 75 81 32 34 30 0 .71 0 .71 91 .5 45 .1 Elkton city . . . . . . . . . . . . . . . . . . . . . 736 677 602 324 289 269 1 .55 1 .55 474 .8 209 .0 Elkton township . . . . . . . . . . . . . . . . 94 115 104 38 38 38 20 .26 20 .26 4 .6 1 .9 Eureka township . . . . . . . . . . . . . . . 158 169 154 67 65 66 36 .21 36 .21 4 .4 1 .9 Lake Hendricks township . . . . . . . . . 189 172 141 146 118 116 32 .76 30 .77 6 .1 4 .7 Lake Sinai township . . . . . . . . . . . . . 175 187 176 71 73 72 35 .47 33 .27 5 .3 2 .1 Laketon township . . . . . . . . . . . . . . . 169 152 120 146 158 146 35 .81 33 .99 5 .0 4 .3 Lake Poinsett CDP (part) . . . . . . . 50 (X) (X) 93 (X) (X) 1 .19 0 .20 250 .0 465 .0 Medary township . . . . . . . . . . . . . . . 1,427 1,173 950 615 539 435 34 .50 33 .34 42 .8 18 .4 Oak Lake township . . . . . . . . . . . . . 100 98 108 42 45 48 36 .21 35 .79 2 .8 1 .2 Oakwood township . . . . . . . . . . . . . . 189 189 190 164 176 170 35 .21 32 .43 5 .8 5 .1 Oslo township . . . . . . . . . . . . . . . . . 202 216 229 85 83 83 35 .77 35 .61 5 .7 2 .4 Parnell township . . . . . . . . . . . . . . . . 144 163 147 60 59 55 35 .74 35 .74 4 .0 1 .7 Preston township . . . . . . . . . . . . . . . 183 196 189 72 73 66 35 .81 35 .50 5 .2 2 .0 Richland township . . . . . . . . . . . . . . 199 195 160 56 62 59 33 .09 33 .09 6 .0 1 .7 Sherman township . . . . . . . . . . . . . . 227 175 145 59 60 55 35 .26 35 .26 6 .4 1 .7 Sinai town . . . . . . . . . . . . . . . . . . . . 120 133 120 61 62 63 0 .37 0 .37 324 .3 164 .9 Sterling township . . . . . . . . . . . . . . . 378 377 326 155 145 118 35 .38 35 .38 10 .7 4 .4 Trenton township . . . . . . . . . . . . . . . 174 453 333 80 197 140 35 .23 35 .18 4 .9 2 .3 Volga city . . . . . . . . . . . . . . . . . . . . . 1,768 1,435 1,263 783 596 503 0 .91 0 .91 1,942 .9 860 .4 Volga township . . . . . . . . . . . . . . . . . 383 356 299 150 144 118 34 .35 33 .85 11 .3 4 .4 White city . . . . . . . . . . . . . . . . . . . . . 485 530 536 212 212 201 0 .99 0 .99 489 .9 214 .1 Winsor township . . . . . . . . . . . . . . . . 159 178 176 69 70 69 36 .00 35 .57 4 .5 1 .9
Brown County . . . . . . . . . . . . . . . . . . . 36,531 35,460 35,580 16,706 15,861 15,101 1,730 .95 1,712 .98 21 .3 9 .8 Aberdeen city . . . . . . . . . . . . . . . . . . 26,091 24,658 24,995 12,158 11,259 10,709 15 .61 15 .50 1,683 .3 784 .4 Aberdeen township . . . . . . . . . . . . . 934 1,472 1,601 378 571 589 39 .03 38 .90 24 .0 9 .7 Allison township . . . . . . . . . . . . . . . . 20 18 26 13 15 15 35 .89 35 .89 0 .6 0 .4 Bates township . . . . . . . . . . . . . . . . . 42 53 44 17 18 21 35 .76 35 .74 1 .2 0 .5 Bath township . . . . . . . . . . . . . . . . . 735 628 593 284 244 219 41 .81 41 .80 17 .6 6 .8 Bath CDP . . . . . . . . . . . . . . . . . . . 172 (X) (X) 69 (X) (X) 0 .29 0 .29 593 .1 237 .9 Bath Corner CDP . . . . . . . . . . . . . 49 (X) (X) 21 (X) (X) 0 .17 0 .17 288 .2 123 .5 Brainard township . . . . . . . . . . . . . . 99 111 119 50 52 51 56 .21 52 .53 1 .9 1 .0 Cambria township . . . . . . . . . . . . . . 125 122 124 75 68 62 36 .25 36 .25 3 .4 2 .1 Carlisle township . . . . . . . . . . . . . . . 35 47 58 18 16 21 36 .23 36 .06 1 .0 0 .5 Claremont town . . . . . . . . . . . . . . . . 127 130 135 61 75 73 0 .26 0 .25 508 .0 244 .0 Claremont township . . . . . . . . . . . . . 121 149 165 58 62 64 54 .00 53 .98 2 .2 1 .1 Columbia city . . . . . . . . . . . . . . . . . . 136 140 133 80 76 72 1 .52 1 .52 89 .5 52 .6 Columbia township . . . . . . . . . . . . . . 107 113 127 52 58 61 48 .24 47 .74 2 .2 1 .1 East Hanson township . . . . . . . . . . . 116 115 139 55 54 56 35 .99 35 .90 3 .2 1 .5 Ferney CDP . . . . . . . . . . . . . . . . . 43 (X) (X) 24 (X) (X) 1 .00 1 .00 43 .0 24 .0 East Rondell township . . . . . . . . . . . 91 102 91 37 36 32 35 .90 35 .90 2 .5 1 .0 Franklyn township . . . . . . . . . . . . . . 37 47 45 16 17 18 35 .98 35 .81 1 .0 0 .4

12 South Dakota Population and Housing Unit CountsU.S. Census Bureau, 2010 Census
Table 8. Population and Housing Units: 1990 to 2010; and Area Measurements and Density: 2010—Con.[For information concerning historical counts and geographic change, see “User Notes .” For information on confidentiality, nonsampling error, and definitions, see Appendixes]
StateCounty/County EquivalentCounty SubdivisionPlace
Population Housing units Area measurements in square miles
Average per square mile of land
2010 2000 1990 2010 2000 1990 Total area Land areaPopulation
densityHousing unit
density
South Dakota—Con .
Brown County—Con . Frederick town . . . . . . . . . . . . . . . . . 199 255 241 119 140 140 0 .39 0 .39 510 .3 305 .1 Frederick township . . . . . . . . . . . . . . 61 77 86 31 31 33 35 .77 35 .77 1 .7 0 .9 Garden Prairie township . . . . . . . . . 188 186 155 27 52 46 36 .02 36 .02 5 .2 0 .7 Garland township . . . . . . . . . . . . . . . 64 53 69 31 29 28 29 .64 29 .64 2 .2 1 .0 Gem township . . . . . . . . . . . . . . . . . 217 226 225 86 82 85 66 .24 66 .24 3 .3 1 .3 Greenfield township . . . . . . . . . . . . . 40 64 72 25 31 27 36 .02 32 .60 1 .2 0 .8 Groton city . . . . . . . . . . . . . . . . . . . . 1,458 1,356 1,196 630 581 537 1 .75 1 .75 833 .1 360 .0 Groton township . . . . . . . . . . . . . . . . 118 116 111 54 45 43 46 .25 46 .25 2 .6 1 .2 Hecla city . . . . . . . . . . . . . . . . . . . . . 227 314 398 155 170 189 0 .34 0 .34 667 .6 455 .9 Hecla township . . . . . . . . . . . . . . . . . 45 56 49 23 28 23 24 .27 23 .95 1 .9 1 .0 Henry township . . . . . . . . . . . . . . . . 129 126 123 50 53 45 36 .08 36 .08 3 .6 1 .4 Highland township . . . . . . . . . . . . . . 86 78 92 36 34 35 36 .18 36 .13 2 .4 1 .0 Lansing township . . . . . . . . . . . . . . . 58 52 63 30 31 36 36 .13 34 .33 1 .7 0 .9 Liberty township . . . . . . . . . . . . . . . . 68 64 91 39 42 49 47 .03 46 .83 1 .5 0 .8 Lincoln township . . . . . . . . . . . . . . . 1,274 1,235 1,042 487 463 372 48 .20 48 .10 26 .5 10 .1 Mercier township . . . . . . . . . . . . . . . 174 145 140 78 56 52 36 .14 35 .97 4 .8 2 .2 New Hope township . . . . . . . . . . . . . 96 99 126 42 38 40 36 .20 36 .05 2 .7 1 .2 North Detroit township . . . . . . . . . . . 44 69 84 24 30 32 36 .13 35 .63 1 .2 0 .7 Oneota township . . . . . . . . . . . . . . . 124 137 127 50 52 52 36 .18 35 .95 3 .4 1 .4 Ordway township . . . . . . . . . . . . . . . 300 265 233 112 100 89 41 .36 41 .36 7 .3 2 .7 Osceola township . . . . . . . . . . . . . . . 47 45 68 18 22 25 35 .69 35 .69 1 .3 0 .5 Palmyra township . . . . . . . . . . . . . . . 34 31 35 43 47 53 35 .73 34 .17 1 .0 1 .3 Portage township . . . . . . . . . . . . . . . 58 64 82 26 25 33 35 .77 35 .67 1 .6 0 .7 Prairiewood township . . . . . . . . . . . . 266 237 186 118 97 63 0 .59 0 .59 450 .8 200 .0 Putney township . . . . . . . . . . . . . . . . 104 106 102 39 45 45 36 .24 36 .24 2 .9 1 .1 Ravinia township . . . . . . . . . . . . . . . 373 283 247 205 170 180 36 .10 35 .06 10 .6 5 .8 Richland township . . . . . . . . . . . . . . 77 57 62 28 30 26 35 .95 35 .93 2 .1 0 .8 Riverside township . . . . . . . . . . . . . . 58 67 70 33 30 31 36 .00 36 .00 1 .6 0 .9 Savo township . . . . . . . . . . . . . . . . . 71 65 68 29 31 32 35 .57 35 .57 2 .0 0 .8 Shelby township . . . . . . . . . . . . . . . . 96 133 137 55 62 61 52 .09 48 .84 2 .0 1 .1 South Detroit township . . . . . . . . . . . 65 86 100 33 43 48 36 .22 36 .21 1 .8 0 .9 Stratford town . . . . . . . . . . . . . . . . . . 72 96 85 41 42 43 0 .25 0 .25 288 .0 164 .0 Verdon town . . . . . . . . . . . . . . . . . . . 5 6 7 4 4 6 0 .25 0 .25 20 .0 16 .0 Warner town . . . . . . . . . . . . . . . . . . . 457 419 336 171 153 119 0 .28 0 .28 1,632 .1 610 .7 Warner township . . . . . . . . . . . . . . . 580 497 499 224 195 178 80 .10 79 .94 7 .3 2 .8 Mansfield CDP (part) . . . . . . . . . . 40 (X) (X) 18 (X) (X) 1 .77 1 .77 22 .6 10 .2 West Hanson township . . . . . . . . . . 61 55 73 28 29 31 35 .95 35 .95 1 .7 0 .8 Westport town . . . . . . . . . . . . . . . . . 133 125 112 51 52 42 0 .23 0 .23 578 .3 221 .7 Westport township . . . . . . . . . . . . . . 107 115 106 45 42 40 28 .86 28 .86 3 .7 1 .6 West Rondell township . . . . . . . . . . . 81 95 87 34 33 29 34 .09 34 .09 2 .4 1 .0
Brule County . . . . . . . . . . . . . . . . . . . . 5,255 5,364 5,485 2,433 2,272 2,275 846 .48 817 .24 6 .4 3 .0 America township . . . . . . . . . . . . . . . 67 59 62 33 35 39 46 .07 42 .27 1 .6 0 .8 Bijou Hills CDP (part) . . . . . . . . . . 3 (X) (X) 1 (X) (X) 1 .88 1 .88 1 .6 0 .5 Brule township . . . . . . . . . . . . . . . . . 130 93 100 54 43 40 44 .22 40 .76 3 .2 1 .3 Chamberlain city . . . . . . . . . . . . . . . 2,387 2,338 2,347 1,142 1,044 1,024 7 .84 6 .64 359 .5 172 .0 Chamberlain township . . . . . . . . . . . 191 353 392 86 64 74 20 .15 18 .58 10 .3 4 .6 Cleveland township . . . . . . . . . . . . . 91 83 104 34 32 34 36 .92 36 .88 2 .5 0 .9 Eagle township . . . . . . . . . . . . . . . . . 54 68 82 24 33 45 35 .54 35 .47 1 .5 0 .7 Bijou Hills CDP (part) . . . . . . . . . . 3 (X) (X) 2 (X) (X) 3 .37 3 .37 0 .9 0 .6 Grandview UT . . . . . . . . . . . . . . . . . 24 30 31 13 13 13 30 .48 22 .78 1 .1 0 .6 Highland township . . . . . . . . . . . . . . 184 41 59 47 22 26 35 .88 35 .80 5 .1 1 .3 Kimball city . . . . . . . . . . . . . . . . . . . . 703 745 743 369 351 352 3 .09 3 .09 227 .5 119 .4 Kimball township . . . . . . . . . . . . . . . 52 56 49 24 26 26 32 .53 32 .42 1 .6 0 .7 Lyon township . . . . . . . . . . . . . . . . . 48 37 58 23 27 25 35 .80 35 .48 1 .4 0 .6 Ola township . . . . . . . . . . . . . . . . . . 107 106 132 45 43 55 35 .94 35 .92 3 .0 1 .3 Ola CDP . . . . . . . . . . . . . . . . . . . . 13 (X) (X) 6 (X) (X) 4 .02 4 .02 3 .2 1 .5 Plainfield township . . . . . . . . . . . . . . 34 48 45 19 24 21 35 .53 35 .47 1 .0 0 .5 Pleasant Grove township . . . . . . . . . 41 40 41 18 20 24 35 .63 35 .39 1 .2 0 .5 Plummer township . . . . . . . . . . . . . . 22 22 39 17 14 18 35 .82 35 .54 0 .6 0 .5 Pukwana town . . . . . . . . . . . . . . . . . 285 287 263 133 131 122 0 .76 0 .76 375 .0 175 .0 Pukwana township . . . . . . . . . . . . . . 145 146 128 58 61 46 35 .90 35 .78 4 .1 1 .6 Red Lake township . . . . . . . . . . . . . 68 64 82 32 33 33 35 .79 30 .19 2 .3 1 .1 Richland township . . . . . . . . . . . . . . 64 72 69 34 35 28 35 .68 35 .59 1 .8 1 .0 Smith township . . . . . . . . . . . . . . . . . 57 59 61 29 24 25 35 .89 35 .85 1 .6 0 .8 Torrey Lake township . . . . . . . . . . . . 180 203 191 53 50 50 35 .67 35 .65 5 .0 1 .5 Union township . . . . . . . . . . . . . . . . 53 62 61 30 27 32 35 .56 35 .52 1 .5 0 .8 Waldro township . . . . . . . . . . . . . . . . 49 69 74 23 23 24 36 .95 36 .77 1 .3 0 .6 West Point township . . . . . . . . . . . . . 124 88 86 52 40 47 50 .97 47 .33 2 .6 1 .1 Wilbur township . . . . . . . . . . . . . . . . 53 150 132 19 36 33 35 .83 35 .81 1 .5 0 .5 Willow Lake township . . . . . . . . . . . . 42 45 54 22 21 19 36 .03 35 .49 1 .2 0 .6
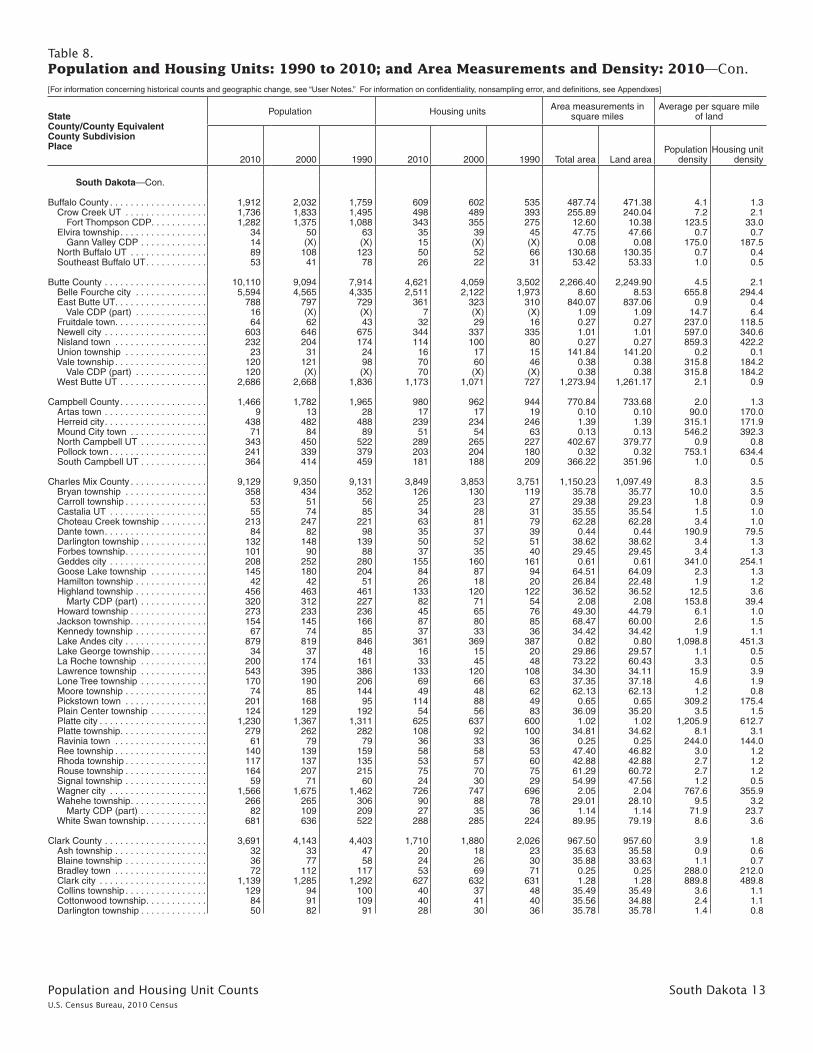
Population and Housing Unit Counts South Dakota 13U.S. Census Bureau, 2010 Census
Table 8. Population and Housing Units: 1990 to 2010; and Area Measurements and Density: 2010—Con.[For information concerning historical counts and geographic change, see “User Notes .” For information on confidentiality, nonsampling error, and definitions, see Appendixes]
StateCounty/County EquivalentCounty SubdivisionPlace
Population Housing units Area measurements in square miles
Average per square mile of land
2010 2000 1990 2010 2000 1990 Total area Land areaPopulation
densityHousing unit
density
South Dakota—Con .
Buffalo County . . . . . . . . . . . . . . . . . . . 1,912 2,032 1,759 609 602 535 487 .74 471 .38 4 .1 1 .3 Crow Creek UT . . . . . . . . . . . . . . . . 1,736 1,833 1,495 498 489 393 255 .89 240 .04 7 .2 2 .1 Fort Thompson CDP . . . . . . . . . . . 1,282 1,375 1,088 343 355 275 12 .60 10 .38 123 .5 33 .0 Elvira township . . . . . . . . . . . . . . . . . 34 50 63 35 39 45 47 .75 47 .66 0 .7 0 .7 Gann Valley CDP . . . . . . . . . . . . . 14 (X) (X) 15 (X) (X) 0 .08 0 .08 175 .0 187 .5 North Buffalo UT . . . . . . . . . . . . . . . 89 108 123 50 52 66 130 .68 130 .35 0 .7 0 .4 Southeast Buffalo UT . . . . . . . . . . . . 53 41 78 26 22 31 53 .42 53 .33 1 .0 0 .5
Butte County . . . . . . . . . . . . . . . . . . . . 10,110 9,094 7,914 4,621 4,059 3,502 2,266 .40 2,249 .90 4 .5 2 .1 Belle Fourche city . . . . . . . . . . . . . . 5,594 4,565 4,335 2,511 2,122 1,973 8 .60 8 .53 655 .8 294 .4 East Butte UT . . . . . . . . . . . . . . . . . . 788 797 729 361 323 310 840 .07 837 .06 0 .9 0 .4 Vale CDP (part) . . . . . . . . . . . . . . 16 (X) (X) 7 (X) (X) 1 .09 1 .09 14 .7 6 .4 Fruitdale town . . . . . . . . . . . . . . . . . . 64 62 43 32 29 16 0 .27 0 .27 237 .0 118 .5 Newell city . . . . . . . . . . . . . . . . . . . . 603 646 675 344 337 335 1 .01 1 .01 597 .0 340 .6 Nisland town . . . . . . . . . . . . . . . . . . 232 204 174 114 100 80 0 .27 0 .27 859 .3 422 .2 Union township . . . . . . . . . . . . . . . . 23 31 24 16 17 15 141 .84 141 .20 0 .2 0 .1 Vale township . . . . . . . . . . . . . . . . . . 120 121 98 70 60 46 0 .38 0 .38 315 .8 184 .2 Vale CDP (part) . . . . . . . . . . . . . . 120 (X) (X) 70 (X) (X) 0 .38 0 .38 315 .8 184 .2 West Butte UT . . . . . . . . . . . . . . . . . 2,686 2,668 1,836 1,173 1,071 727 1,273 .94 1,261 .17 2 .1 0 .9
Campbell County . . . . . . . . . . . . . . . . . 1,466 1,782 1,965 980 962 944 770 .84 733 .68 2 .0 1 .3 Artas town . . . . . . . . . . . . . . . . . . . . 9 13 28 17 17 19 0 .10 0 .10 90 .0 170 .0 Herreid city . . . . . . . . . . . . . . . . . . . . 438 482 488 239 234 246 1 .39 1 .39 315 .1 171 .9 Mound City town . . . . . . . . . . . . . . . 71 84 89 51 54 63 0 .13 0 .13 546 .2 392 .3 North Campbell UT . . . . . . . . . . . . . 343 450 522 289 265 227 402 .67 379 .77 0 .9 0 .8 Pollock town . . . . . . . . . . . . . . . . . . . 241 339 379 203 204 180 0 .32 0 .32 753 .1 634 .4 South Campbell UT . . . . . . . . . . . . . 364 414 459 181 188 209 366 .22 351 .96 1 .0 0 .5
Charles Mix County . . . . . . . . . . . . . . . 9,129 9,350 9,131 3,849 3,853 3,751 1,150 .23 1,097 .49 8 .3 3 .5 Bryan township . . . . . . . . . . . . . . . . 358 434 352 126 130 119 35 .78 35 .77 10 .0 3 .5 Carroll township . . . . . . . . . . . . . . . . 53 51 56 25 23 27 29 .38 29 .23 1 .8 0 .9 Castalia UT . . . . . . . . . . . . . . . . . . . 55 74 85 34 28 31 35 .55 35 .54 1 .5 1 .0 Choteau Creek township . . . . . . . . . 213 247 221 63 81 79 62 .28 62 .28 3 .4 1 .0 Dante town . . . . . . . . . . . . . . . . . . . . 84 82 98 35 37 39 0 .44 0 .44 190 .9 79 .5 Darlington township . . . . . . . . . . . . . 132 148 139 50 52 51 38 .62 38 .62 3 .4 1 .3 Forbes township . . . . . . . . . . . . . . . . 101 90 88 37 35 40 29 .45 29 .45 3 .4 1 .3 Geddes city . . . . . . . . . . . . . . . . . . . 208 252 280 155 160 161 0 .61 0 .61 341 .0 254 .1 Goose Lake township . . . . . . . . . . . 145 180 204 84 87 94 64 .51 64 .09 2 .3 1 .3 Hamilton township . . . . . . . . . . . . . . 42 42 51 26 18 20 26 .84 22 .48 1 .9 1 .2 Highland township . . . . . . . . . . . . . . 456 463 461 133 120 122 36 .52 36 .52 12 .5 3 .6 Marty CDP (part) . . . . . . . . . . . . . 320 312 227 82 71 54 2 .08 2 .08 153 .8 39 .4 Howard township . . . . . . . . . . . . . . . 273 233 236 45 65 76 49 .30 44 .79 6 .1 1 .0 Jackson township . . . . . . . . . . . . . . . 154 145 166 87 80 85 68 .47 60 .00 2 .6 1 .5 Kennedy township . . . . . . . . . . . . . . 67 74 85 37 33 36 34 .42 34 .42 1 .9 1 .1 Lake Andes city . . . . . . . . . . . . . . . . 879 819 846 361 369 387 0 .82 0 .80 1,098 .8 451 .3 Lake George township . . . . . . . . . . . 34 37 48 16 15 20 29 .86 29 .57 1 .1 0 .5 La Roche township . . . . . . . . . . . . . 200 174 161 33 45 48 73 .22 60 .43 3 .3 0 .5 Lawrence township . . . . . . . . . . . . . 543 395 386 133 120 108 34 .30 34 .11 15 .9 3 .9 Lone Tree township . . . . . . . . . . . . . 170 190 206 69 66 63 37 .35 37 .18 4 .6 1 .9 Moore township . . . . . . . . . . . . . . . . 74 85 144 49 48 62 62 .13 62 .13 1 .2 0 .8 Pickstown town . . . . . . . . . . . . . . . . 201 168 95 114 88 49 0 .65 0 .65 309 .2 175 .4 Plain Center township . . . . . . . . . . . 124 129 192 54 56 83 36 .09 35 .20 3 .5 1 .5 Platte city . . . . . . . . . . . . . . . . . . . . . 1,230 1,367 1,311 625 637 600 1 .02 1 .02 1,205 .9 612 .7 Platte township . . . . . . . . . . . . . . . . . 279 262 282 108 92 100 34 .81 34 .62 8 .1 3 .1 Ravinia town . . . . . . . . . . . . . . . . . . 61 79 79 36 33 36 0 .25 0 .25 244 .0 144 .0 Ree township . . . . . . . . . . . . . . . . . . 140 139 159 58 58 53 47 .40 46 .82 3 .0 1 .2 Rhoda township . . . . . . . . . . . . . . . . 117 137 135 53 57 60 42 .88 42 .88 2 .7 1 .2 Rouse township . . . . . . . . . . . . . . . . 164 207 215 75 70 75 61 .29 60 .72 2 .7 1 .2 Signal township . . . . . . . . . . . . . . . . 59 71 60 24 30 29 54 .99 47 .56 1 .2 0 .5 Wagner city . . . . . . . . . . . . . . . . . . . 1,566 1,675 1,462 726 747 696 2 .05 2 .04 767 .6 355 .9 Wahehe township . . . . . . . . . . . . . . . 266 265 306 90 88 78 29 .01 28 .10 9 .5 3 .2 Marty CDP (part) . . . . . . . . . . . . . 82 109 209 27 35 36 1 .14 1 .14 71 .9 23 .7 White Swan township . . . . . . . . . . . . 681 636 522 288 285 224 89 .95 79 .19 8 .6 3 .6
Clark County . . . . . . . . . . . . . . . . . . . . 3,691 4,143 4,403 1,710 1,880 2,026 967 .50 957 .60 3 .9 1 .8 Ash township . . . . . . . . . . . . . . . . . . 32 33 47 20 18 23 35 .63 35 .58 0 .9 0 .6 Blaine township . . . . . . . . . . . . . . . . 36 77 58 24 26 30 35 .88 33 .63 1 .1 0 .7 Bradley town . . . . . . . . . . . . . . . . . . 72 112 117 53 69 71 0 .25 0 .25 288 .0 212 .0 Clark city . . . . . . . . . . . . . . . . . . . . . 1,139 1,285 1,292 627 632 631 1 .28 1 .28 889 .8 489 .8 Collins township . . . . . . . . . . . . . . . . 129 94 100 40 37 48 35 .49 35 .49 3 .6 1 .1 Cottonwood township . . . . . . . . . . . . 84 91 109 40 41 40 35 .56 34 .88 2 .4 1 .1 Darlington township . . . . . . . . . . . . . 50 82 91 28 30 36 35 .78 35 .78 1 .4 0 .8

14 South Dakota Population and Housing Unit CountsU.S. Census Bureau, 2010 Census
Table 8. Population and Housing Units: 1990 to 2010; and Area Measurements and Density: 2010—Con.[For information concerning historical counts and geographic change, see “User Notes .” For information on confidentiality, nonsampling error, and definitions, see Appendixes]
StateCounty/County EquivalentCounty SubdivisionPlace
Population Housing units Area measurements in square miles
Average per square mile of land
2010 2000 1990 2010 2000 1990 Total area Land areaPopulation
densityHousing unit
density
South Dakota—Con .
Clark County—Con . Day township . . . . . . . . . . . . . . . . . . 85 87 87 41 34 41 35 .17 34 .55 2 .5 1 .2 Eden township . . . . . . . . . . . . . . . . . 59 84 82 31 39 39 35 .50 35 .08 1 .7 0 .9 Elrod township . . . . . . . . . . . . . . . . . 90 92 96 40 40 44 36 .24 36 .22 2 .5 1 .1 Fordham township . . . . . . . . . . . . . . 111 131 151 11 32 36 35 .66 35 .51 3 .1 0 .3 Foxton township . . . . . . . . . . . . . . . . 51 48 70 22 26 32 35 .91 35 .91 1 .4 0 .6 Garden City town . . . . . . . . . . . . . . . 53 72 93 35 46 57 0 .39 0 .39 135 .9 89 .7 Garfield township . . . . . . . . . . . . . . . 60 74 91 33 32 37 35 .94 35 .93 1 .7 0 .9 Hague township . . . . . . . . . . . . . . . . 38 45 51 24 24 31 35 .83 35 .83 1 .1 0 .7 Lake township . . . . . . . . . . . . . . . . . 79 95 110 38 40 44 35 .69 34 .47 2 .3 1 .1 Lincoln township . . . . . . . . . . . . . . . 94 97 95 37 36 35 35 .15 35 .06 2 .7 1 .1 Logan township . . . . . . . . . . . . . . . . 43 40 50 22 24 30 35 .63 35 .56 1 .2 0 .6 Maydell township . . . . . . . . . . . . . . . 51 53 49 24 24 28 35 .82 34 .71 1 .5 0 .7 Merton township . . . . . . . . . . . . . . . 51 68 73 26 27 32 35 .64 35 .62 1 .4 0 .7 Mount Pleasant township . . . . . . . . . 270 213 177 29 50 44 35 .88 35 .88 7 .5 0 .8 Naples town . . . . . . . . . . . . . . . . . . . 41 25 35 12 14 17 0 .14 0 .14 292 .9 85 .7 Pleasant township . . . . . . . . . . . . . . 166 167 167 27 54 54 35 .23 35 .23 4 .7 0 .8 Raymond town . . . . . . . . . . . . . . . . . 50 86 96 38 39 51 0 .26 0 .26 192 .3 146 .2 Raymond township . . . . . . . . . . . . . . 63 72 71 27 29 32 35 .61 35 .60 1 .8 0 .8 Richland township . . . . . . . . . . . . . . 61 68 101 31 43 45 35 .87 35 .87 1 .7 0 .9 Rosedale township . . . . . . . . . . . . . . 71 97 83 35 37 39 35 .82 35 .78 2 .0 1 .0 Spring Valley township . . . . . . . . . . . 40 47 73 36 33 39 35 .99 35 .10 1 .1 1 .0 Crocker CDP . . . . . . . . . . . . . . . . 19 (X) (X) 19 (X) (X) 3 .94 3 .63 5 .2 5 .2 Thorp township . . . . . . . . . . . . . . . . 46 61 66 25 26 28 35 .92 35 .17 1 .3 0 .7 Vienna town . . . . . . . . . . . . . . . . . . . 45 78 93 22 41 47 0 .84 0 .84 53 .6 26 .2 Warren township . . . . . . . . . . . . . . . 38 42 63 21 22 28 35 .30 35 .04 1 .1 0 .6 Washington township . . . . . . . . . . . . 67 71 89 29 34 42 35 .91 35 .54 1 .9 0 .8 Willow Lake city . . . . . . . . . . . . . . . . 263 294 317 129 148 164 0 .38 0 .37 710 .8 348 .6 Woodland township . . . . . . . . . . . . . 63 62 60 33 33 31 35 .91 35 .05 1 .8 0 .9
Clay County . . . . . . . . . . . . . . . . . . . . . 13,864 13,537 13,186 5,639 5,438 4,892 417 .24 412 .19 33 .6 13 .7 Bethel township . . . . . . . . . . . . . . . . 176 198 213 81 82 82 35 .86 35 .86 4 .9 2 .3 Fairview township . . . . . . . . . . . . . . . 522 470 393 297 236 209 36 .02 34 .60 15 .1 8 .6 Garfield township . . . . . . . . . . . . . . . 208 204 255 88 92 101 35 .97 35 .97 5 .8 2 .4 Glenwood township . . . . . . . . . . . . . 208 208 187 89 88 87 36 .00 35 .99 5 .8 2 .5 Irene city (part) . . . . . . . . . . . . . . . . . 187 198 209 81 76 81 0 .09 0 .09 2,077 .8 900 .0 Meckling township . . . . . . . . . . . . . . 234 223 228 110 106 107 36 .12 36 .12 6 .5 3 .0 Norway township . . . . . . . . . . . . . . . 156 177 168 146 133 126 27 .93 26 .04 6 .0 5 .6 Pleasant Valley township . . . . . . . . . 166 173 182 74 84 94 35 .92 35 .92 4 .6 2 .1 Prairie Center township . . . . . . . . . . 190 228 210 91 87 91 36 .20 36 .14 5 .3 2 .5 Riverside township . . . . . . . . . . . . . . 141 167 162 59 67 74 35 .95 35 .95 3 .9 1 .6 Spirit Mound township . . . . . . . . . . . 218 196 192 90 83 81 36 .08 36 .08 6 .0 2 .5 Star township . . . . . . . . . . . . . . . . . . 133 169 188 66 68 89 35 .46 35 .44 3 .8 1 .9 Vermillion city . . . . . . . . . . . . . . . . . . 10,571 r 10,276 10,034 4,043 3,967 3,428 4 .03 4 .03 2,623 .1 1,003 .2 Vermillion township . . . . . . . . . . . . . 433 r 276 236 161 113 92 25 .23 23 .59 18 .4 6 .8 Wakonda town . . . . . . . . . . . . . . . . . 321 374 329 163 156 150 0 .39 0 .39 823 .1 417 .9
Codington County . . . . . . . . . . . . . . . . 27,227 25,897 22,698 12,397 11,324 9,539 717 .16 688 .50 39 .5 18 .0 Dexter township . . . . . . . . . . . . . . . . 194 188 188 74 72 79 60 .71 59 .68 3 .3 1 .2 Eden township . . . . . . . . . . . . . . . . . 98 102 116 43 50 56 35 .80 33 .38 2 .9 1 .3 Elmira township . . . . . . . . . . . . . . . . 442 343 302 160 113 103 30 .19 30 .18 14 .6 5 .3 Florence town . . . . . . . . . . . . . . . . . 374 299 192 159 112 79 0 .69 0 .69 542 .0 230 .4 Fuller township . . . . . . . . . . . . . . . . . 281 273 284 105 93 95 57 .16 54 .14 5 .2 1 .9 Germantown township . . . . . . . . . . . 165 180 164 66 63 66 46 .99 46 .99 3 .5 1 .4 Graceland township . . . . . . . . . . . . . 105 93 108 40 38 40 36 .13 33 .08 3 .2 1 .2 Henry town . . . . . . . . . . . . . . . . . . . . 267 268 215 123 116 96 1 .45 1 .45 184 .1 84 .8 Henry township . . . . . . . . . . . . . . . . 94 97 112 47 41 36 34 .32 34 .30 2 .7 1 .4 Kampeska township . . . . . . . . . . . . . 321 275 226 121 99 79 35 .81 35 .02 9 .2 3 .5 Kranzburg town . . . . . . . . . . . . . . . . 172 185 132 70 65 57 0 .76 0 .76 226 .3 92 .1 Kranzburg township . . . . . . . . . . . . . 351 354 340 133 124 122 60 .55 60 .54 5 .8 2 .2 Lake township . . . . . . . . . . . . . . . . . 646 676 665 263 248 209 21 .39 20 .77 31 .1 12 .7 Leola township . . . . . . . . . . . . . . . . . 74 107 63 28 29 27 34 .21 33 .18 2 .2 0 .8 Pelican township . . . . . . . . . . . . . . . 718 662 547 288 253 206 34 .44 30 .47 23 .6 9 .5 Phipps township . . . . . . . . . . . . . . . . 75 79 77 34 34 28 36 .16 33 .33 2 .3 1 .0 Rauville township . . . . . . . . . . . . . . . 282 307 272 116 117 102 50 .35 50 .31 5 .6 2 .3 Richland township . . . . . . . . . . . . . . 154 162 156 70 64 59 35 .84 33 .65 4 .6 2 .1 Sheridan township . . . . . . . . . . . . . . 433 446 410 163 146 126 32 .24 32 .20 13 .4 5 .1 South Shore town . . . . . . . . . . . . . . 225 270 260 122 131 115 1 .40 1 .40 160 .7 87 .1 Wallace town . . . . . . . . . . . . . . . . . . 85 86 83 42 45 52 0 .13 0 .13 653 .8 323 .1 Watertown city . . . . . . . . . . . . . . . . . 21,482 20,237 17,623 10,050 9,193 7,641 25 .04 17 .45 1,231 .1 575 .9 Waverly township . . . . . . . . . . . . . . . 189 208 163 80 78 66 45 .40 45 .39 4 .2 1 .8 Waverly CDP . . . . . . . . . . . . . . . . 37 (X) (X) 19 (X) (X) 1 .02 1 .02 36 .3 18 .6
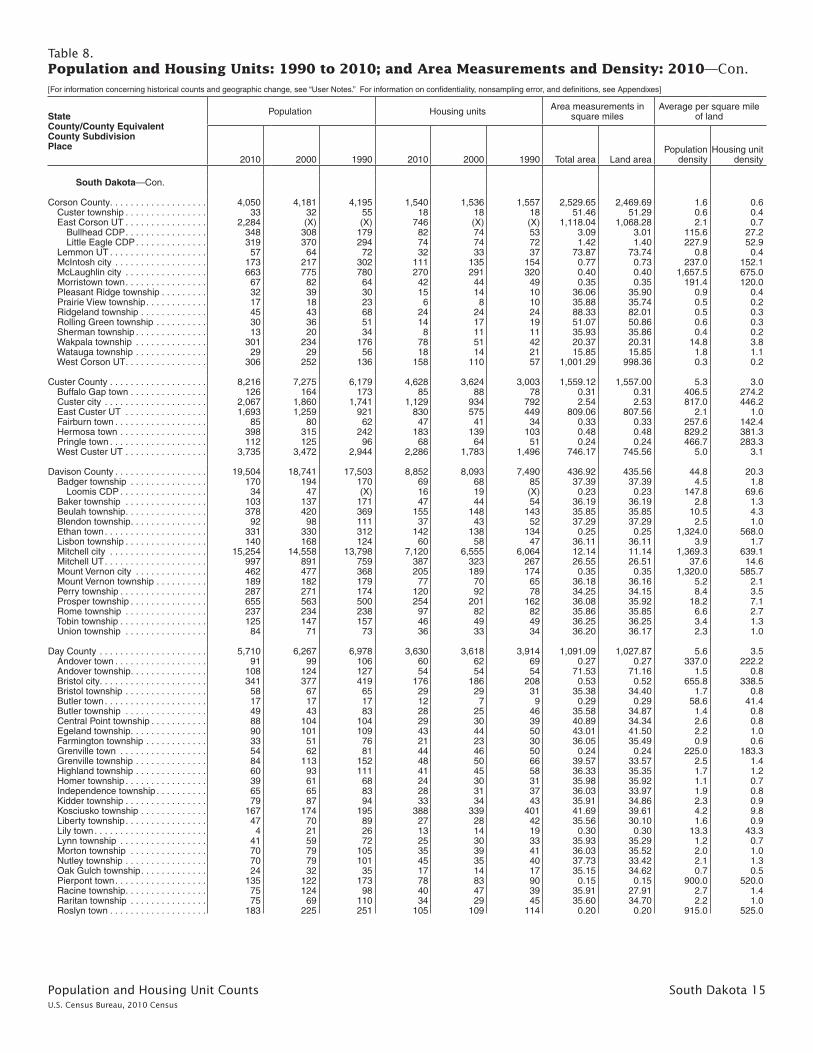
Population and Housing Unit Counts South Dakota 15U.S. Census Bureau, 2010 Census
Table 8. Population and Housing Units: 1990 to 2010; and Area Measurements and Density: 2010—Con.[For information concerning historical counts and geographic change, see “User Notes .” For information on confidentiality, nonsampling error, and definitions, see Appendixes]
StateCounty/County EquivalentCounty SubdivisionPlace
Population Housing units Area measurements in square miles
Average per square mile of land
2010 2000 1990 2010 2000 1990 Total area Land areaPopulation
densityHousing unit
density
South Dakota—Con .
Corson County . . . . . . . . . . . . . . . . . . . 4,050 4,181 4,195 1,540 1,536 1,557 2,529 .65 2,469 .69 1 .6 0 .6 Custer township . . . . . . . . . . . . . . . . 33 32 55 18 18 18 51 .46 51 .29 0 .6 0 .4 East Corson UT . . . . . . . . . . . . . . . . 2,284 (X) (X) 746 (X) (X) 1,118 .04 1,068 .28 2 .1 0 .7 Bullhead CDP . . . . . . . . . . . . . . . . 348 308 179 82 74 53 3 .09 3 .01 115 .6 27 .2 Little Eagle CDP . . . . . . . . . . . . . . 319 370 294 74 74 72 1 .42 1 .40 227 .9 52 .9 Lemmon UT . . . . . . . . . . . . . . . . . . . 57 64 72 32 33 37 73 .87 73 .74 0 .8 0 .4 McIntosh city . . . . . . . . . . . . . . . . . . 173 217 302 111 135 154 0 .77 0 .73 237 .0 152 .1 McLaughlin city . . . . . . . . . . . . . . . . 663 775 780 270 291 320 0 .40 0 .40 1,657 .5 675 .0 Morristown town . . . . . . . . . . . . . . . . 67 82 64 42 44 49 0 .35 0 .35 191 .4 120 .0 Pleasant Ridge township . . . . . . . . . 32 39 30 15 14 10 36 .06 35 .90 0 .9 0 .4 Prairie View township . . . . . . . . . . . . 17 18 23 6 8 10 35 .88 35 .74 0 .5 0 .2 Ridgeland township . . . . . . . . . . . . . 45 43 68 24 24 24 88 .33 82 .01 0 .5 0 .3 Rolling Green township . . . . . . . . . . 30 36 51 14 17 19 51 .07 50 .86 0 .6 0 .3 Sherman township . . . . . . . . . . . . . . 13 20 34 8 11 11 35 .93 35 .86 0 .4 0 .2 Wakpala township . . . . . . . . . . . . . . 301 234 176 78 51 42 20 .37 20 .31 14 .8 3 .8 Watauga township . . . . . . . . . . . . . . 29 29 56 18 14 21 15 .85 15 .85 1 .8 1 .1 West Corson UT . . . . . . . . . . . . . . . . 306 252 136 158 110 57 1,001 .29 998 .36 0 .3 0 .2
Custer County . . . . . . . . . . . . . . . . . . . 8,216 7,275 6,179 4,628 3,624 3,003 1,559 .12 1,557 .00 5 .3 3 .0 Buffalo Gap town . . . . . . . . . . . . . . . 126 164 173 85 88 78 0 .31 0 .31 406 .5 274 .2 Custer city . . . . . . . . . . . . . . . . . . . . 2,067 1,860 1,741 1,129 934 792 2 .54 2 .53 817 .0 446 .2 East Custer UT . . . . . . . . . . . . . . . . 1,693 1,259 921 830 575 449 809 .06 807 .56 2 .1 1 .0 Fairburn town . . . . . . . . . . . . . . . . . . 85 80 62 47 41 34 0 .33 0 .33 257 .6 142 .4 Hermosa town . . . . . . . . . . . . . . . . . 398 315 242 183 139 103 0 .48 0 .48 829 .2 381 .3 Pringle town . . . . . . . . . . . . . . . . . . . 112 125 96 68 64 51 0 .24 0 .24 466 .7 283 .3 West Custer UT . . . . . . . . . . . . . . . . 3,735 3,472 2,944 2,286 1,783 1,496 746 .17 745 .56 5 .0 3 .1
Davison County . . . . . . . . . . . . . . . . . . 19,504 18,741 17,503 8,852 8,093 7,490 436 .92 435 .56 44 .8 20 .3 Badger township . . . . . . . . . . . . . . . 170 194 170 69 68 85 37 .39 37 .39 4 .5 1 .8 Loomis CDP . . . . . . . . . . . . . . . . . 34 47 (X) 16 19 (X) 0 .23 0 .23 147 .8 69 .6 Baker township . . . . . . . . . . . . . . . . 103 137 171 47 44 54 36 .19 36 .19 2 .8 1 .3 Beulah township . . . . . . . . . . . . . . . . 378 420 369 155 148 143 35 .85 35 .85 10 .5 4 .3 Blendon township . . . . . . . . . . . . . . . 92 98 111 37 43 52 37 .29 37 .29 2 .5 1 .0 Ethan town . . . . . . . . . . . . . . . . . . . . 331 330 312 142 138 134 0 .25 0 .25 1,324 .0 568 .0 Lisbon township . . . . . . . . . . . . . . . . 140 168 124 60 58 47 36 .11 36 .11 3 .9 1 .7 Mitchell city . . . . . . . . . . . . . . . . . . . 15,254 14,558 13,798 7,120 6,555 6,064 12 .14 11 .14 1,369 .3 639 .1 Mitchell UT . . . . . . . . . . . . . . . . . . . . 997 891 759 387 323 267 26 .55 26 .51 37 .6 14 .6 Mount Vernon city . . . . . . . . . . . . . . 462 477 368 205 189 174 0 .35 0 .35 1,320 .0 585 .7 Mount Vernon township . . . . . . . . . . 189 182 179 77 70 65 36 .18 36 .16 5 .2 2 .1 Perry township . . . . . . . . . . . . . . . . . 287 271 174 120 92 78 34 .25 34 .15 8 .4 3 .5 Prosper township . . . . . . . . . . . . . . . 655 563 500 254 201 162 36 .08 35 .92 18 .2 7 .1 Rome township . . . . . . . . . . . . . . . . 237 234 238 97 82 82 35 .86 35 .85 6 .6 2 .7 Tobin township . . . . . . . . . . . . . . . . . 125 147 157 46 49 49 36 .25 36 .25 3 .4 1 .3 Union township . . . . . . . . . . . . . . . . 84 71 73 36 33 34 36 .20 36 .17 2 .3 1 .0
Day County . . . . . . . . . . . . . . . . . . . . . 5,710 6,267 6,978 3,630 3,618 3,914 1,091 .09 1,027 .87 5 .6 3 .5 Andover town . . . . . . . . . . . . . . . . . . 91 99 106 60 62 69 0 .27 0 .27 337 .0 222 .2 Andover township . . . . . . . . . . . . . . . 108 124 127 54 54 54 71 .53 71 .16 1 .5 0 .8 Bristol city . . . . . . . . . . . . . . . . . . . . . 341 377 419 176 186 208 0 .53 0 .52 655 .8 338 .5 Bristol township . . . . . . . . . . . . . . . . 58 67 65 29 29 31 35 .38 34 .40 1 .7 0 .8 Butler town . . . . . . . . . . . . . . . . . . . . 17 17 17 12 7 9 0 .29 0 .29 58 .6 41 .4 Butler township . . . . . . . . . . . . . . . . 49 43 83 28 25 46 35 .58 34 .87 1 .4 0 .8 Central Point township . . . . . . . . . . . 88 104 104 29 30 39 40 .89 34 .34 2 .6 0 .8 Egeland township . . . . . . . . . . . . . . . 90 101 109 43 44 50 43 .01 41 .50 2 .2 1 .0 Farmington township . . . . . . . . . . . . 33 51 76 21 23 30 36 .05 35 .49 0 .9 0 .6 Grenville town . . . . . . . . . . . . . . . . . 54 62 81 44 46 50 0 .24 0 .24 225 .0 183 .3 Grenville township . . . . . . . . . . . . . . 84 113 152 48 50 66 39 .57 33 .57 2 .5 1 .4 Highland township . . . . . . . . . . . . . . 60 93 111 41 45 58 36 .33 35 .35 1 .7 1 .2 Homer township . . . . . . . . . . . . . . . . 39 61 68 24 30 31 35 .98 35 .92 1 .1 0 .7 Independence township . . . . . . . . . . 65 65 83 28 31 37 36 .03 33 .97 1 .9 0 .8 Kidder township . . . . . . . . . . . . . . . . 79 87 94 33 34 43 35 .91 34 .86 2 .3 0 .9 Kosciusko township . . . . . . . . . . . . . 167 174 195 388 339 401 41 .69 39 .61 4 .2 9 .8 Liberty township . . . . . . . . . . . . . . . . 47 70 89 27 28 42 35 .56 30 .10 1 .6 0 .9 Lily town . . . . . . . . . . . . . . . . . . . . . . 4 21 26 13 14 19 0 .30 0 .30 13 .3 43 .3 Lynn township . . . . . . . . . . . . . . . . . 41 59 72 25 30 33 35 .93 35 .29 1 .2 0 .7 Morton township . . . . . . . . . . . . . . . 70 79 105 35 39 41 36 .03 35 .52 2 .0 1 .0 Nutley township . . . . . . . . . . . . . . . . 70 79 101 45 35 40 37 .73 33 .42 2 .1 1 .3 Oak Gulch township . . . . . . . . . . . . . 24 32 35 17 14 17 35 .15 34 .62 0 .7 0 .5 Pierpont town . . . . . . . . . . . . . . . . . . 135 122 173 78 83 90 0 .15 0 .15 900 .0 520 .0 Racine township . . . . . . . . . . . . . . . . 75 124 98 40 47 39 35 .91 27 .91 2 .7 1 .4 Raritan township . . . . . . . . . . . . . . . 75 69 110 34 29 45 35 .60 34 .70 2 .2 1 .0 Roslyn town . . . . . . . . . . . . . . . . . . . 183 225 251 105 109 114 0 .20 0 .20 915 .0 525 .0

16 South Dakota Population and Housing Unit CountsU.S. Census Bureau, 2010 Census
Table 8. Population and Housing Units: 1990 to 2010; and Area Measurements and Density: 2010—Con.[For information concerning historical counts and geographic change, see “User Notes .” For information on confidentiality, nonsampling error, and definitions, see Appendixes]
StateCounty/County EquivalentCounty SubdivisionPlace
Population Housing units Area measurements in square miles
Average per square mile of land
2010 2000 1990 2010 2000 1990 Total area Land areaPopulation
densityHousing unit
density
South Dakota—Con .
Day County—Con . Rusk township . . . . . . . . . . . . . . . . . 118 128 153 56 65 73 35 .93 35 .24 3 .3 1 .6 Scotland township . . . . . . . . . . . . . . 34 31 39 15 13 15 35 .98 35 .93 0 .9 0 .4 Troy township . . . . . . . . . . . . . . . . . . 39 42 65 16 23 28 36 .41 33 .86 1 .2 0 .5 Union township . . . . . . . . . . . . . . . . 48 88 87 26 37 37 35 .71 35 .59 1 .3 0 .7 Valley township . . . . . . . . . . . . . . . . . 40 48 51 22 23 25 35 .89 35 .66 1 .1 0 .6 Waubay city . . . . . . . . . . . . . . . . . . . 576 662 647 374 389 341 1 .45 1 .45 397 .2 257 .9 Waubay township . . . . . . . . . . . . . . . 462 415 491 451 403 483 59 .71 46 .09 10 .0 9 .8 Webster township . . . . . . . . . . . . . . . 264 250 324 121 110 117 34 .47 33 .47 7 .9 3 .6 Webster city . . . . . . . . . . . . . . . . . . . 1,886 1,952 2,017 1,007 1,023 1,018 1 .49 1 .49 1,265 .8 675 .8 Wheatland township . . . . . . . . . . . . . 62 88 111 44 45 50 36 .43 36 .23 1 .7 1 .2 York township . . . . . . . . . . . . . . . . . . 34 45 43 21 24 25 35 .76 34 .27 1 .0 0 .6
Deuel County . . . . . . . . . . . . . . . . . . . . 4,364 4,498 4,522 2,204 2,172 2,208 636 .61 622 .69 7 .0 3 .5 Altamont town . . . . . . . . . . . . . . . . . 34 34 48 17 18 24 1 .25 1 .25 27 .2 13 .6 Altamont township . . . . . . . . . . . . . . 84 87 109 47 44 46 39 .82 36 .57 2 .3 1 .3 Antelope Valley township . . . . . . . . . 25 33 45 14 20 28 19 .21 19 .18 1 .3 0 .7 Astoria town . . . . . . . . . . . . . . . . . . . 139 150 155 74 75 79 0 .16 0 .16 868 .8 462 .5 Blom township . . . . . . . . . . . . . . . . . 103 129 140 44 52 64 35 .77 35 .77 2 .9 1 .2 Brandt town . . . . . . . . . . . . . . . . . . . 107 113 123 50 61 62 1 .26 1 .26 84 .9 39 .7 Brandt township . . . . . . . . . . . . . . . . 128 144 159 50 48 56 35 .87 35 .87 3 .6 1 .4 Clear Lake city . . . . . . . . . . . . . . . . . 1,273 1,335 1,247 617 607 589 3 .25 3 .07 414 .7 201 .0 Clear Lake township . . . . . . . . . . . . 242 215 188 97 89 77 38 .57 37 .16 6 .5 2 .6 Gary city . . . . . . . . . . . . . . . . . . . . . . 227 231 274 153 148 163 0 .69 0 .69 329 .0 221 .7 Glenwood township . . . . . . . . . . . . . 105 95 102 41 39 43 43 .52 42 .77 2 .5 1 .0 Goodwin town . . . . . . . . . . . . . . . . . 146 160 126 62 63 48 0 .47 0 .47 310 .6 131 .9 Goodwin township . . . . . . . . . . . . . . 159 177 188 74 76 84 40 .37 40 .21 4 .0 1 .8 Grange township . . . . . . . . . . . . . . . 127 136 128 52 52 54 35 .94 35 .94 3 .5 1 .4 Havana township . . . . . . . . . . . . . . . 193 202 194 77 75 73 41 .61 41 .47 4 .7 1 .9 Herrick township . . . . . . . . . . . . . . . 147 129 171 64 54 64 43 .74 42 .95 3 .4 1 .5 Hidewood township . . . . . . . . . . . . . 93 119 110 43 46 44 35 .84 35 .84 2 .6 1 .2 Lowe township . . . . . . . . . . . . . . . . . 97 120 141 49 50 52 35 .80 35 .73 2 .7 1 .4 Norden township . . . . . . . . . . . . . . . 356 303 263 290 270 279 55 .35 54 .02 6 .6 5 .4 Portland township . . . . . . . . . . . . . . 74 68 93 30 31 35 35 .71 35 .27 2 .1 0 .9 Rome township . . . . . . . . . . . . . . . . 85 99 102 47 46 38 35 .92 32 .14 2 .6 1 .5 Scandinavia township . . . . . . . . . . . 208 217 215 97 95 101 56 .18 54 .59 3 .8 1 .8 Toronto town . . . . . . . . . . . . . . . . . . . 212 202 201 115 113 105 0 .31 0 .31 683 .9 371 .0
Dewey County . . . . . . . . . . . . . . . . . . . 5,301 5,972 5,523 2,002 2,133 2,123 2,445 .28 2,302 .49 2 .3 0 .9 Eagle Butte city (part) . . . . . . . . . . . 521 420 475 227 195 181 0 .33 0 .33 1,578 .8 687 .9 Isabel town . . . . . . . . . . . . . . . . . . . . 135 239 319 69 125 169 0 .91 0 .91 148 .4 75 .8 North Dewey UT . . . . . . . . . . . . . . . 3,228 3,775 3,393 1,111 1,212 1,170 906 .64 904 .55 3 .6 1 .2 Green Grass CDP . . . . . . . . . . . . 35 58 (X) 12 18 (X) 8 .13 8 .13 4 .3 1 .5 North Eagle Butte CDP . . . . . . . . 1,954 2,163 1,423 626 697 517 9 .11 9 .10 214 .7 68 .8 Whitehorse CDP (part) . . . . . . . . . 120 122 (X) 33 38 (X) 1 .56 1 .56 76 .9 21 .2 South Dewey UT . . . . . . . . . . . . . . . 974 1,095 819 387 394 351 1,536 .99 1,396 .30 0 .7 0 .3 La Plant CDP . . . . . . . . . . . . . . . . 171 150 (X) 49 42 (X) 9 .49 9 .45 18 .1 5 .2 Whitehorse CDP (part) . . . . . . . . . 21 19 (X) 7 5 (X) 1 .17 1 .17 17 .9 6 .0 Timber Lake city . . . . . . . . . . . . . . . . 443 443 517 208 207 252 0 .41 0 .41 1,080 .5 507 .3
Douglas County . . . . . . . . . . . . . . . . . . 3,002 3,458 3,746 1,439 1,453 1,517 433 .67 431 .80 7 .0 3 .3 Armour city . . . . . . . . . . . . . . . . . . . . 699 782 854 378 377 389 0 .95 0 .94 743 .6 402 .1 Belmont township . . . . . . . . . . . . . . . 67 75 82 30 31 31 34 .25 34 .22 2 .0 0 .9 Chester township . . . . . . . . . . . . . . . 62 83 89 39 37 36 28 .22 28 .17 2 .2 1 .4 Clark township . . . . . . . . . . . . . . . . . 116 143 177 60 68 68 27 .98 27 .74 4 .2 2 .2 New Holland CDP (part) . . . . . . . . 33 44 (X) 23 25 (X) 0 .03 0 .03 1,100 .0 766 .7 Corsica city . . . . . . . . . . . . . . . . . . . 592 644 619 286 271 259 0 .84 0 .84 704 .8 340 .5 Delmont city . . . . . . . . . . . . . . . . . . . 234 263 235 141 133 148 0 .76 0 .76 307 .9 185 .5 East Choteau township . . . . . . . . . . 119 141 151 16 37 39 15 .89 15 .89 7 .5 1 .0 Garfield township . . . . . . . . . . . . . . . 68 69 97 29 27 29 29 .36 29 .31 2 .3 1 .0 Grandview township . . . . . . . . . . . . . 77 105 116 37 40 40 34 .90 34 .64 2 .2 1 .1 Holland township . . . . . . . . . . . . . . . 156 209 233 79 79 83 29 .31 29 .26 5 .3 2 .7 Harrison CDP . . . . . . . . . . . . . . . . 52 51 (X) 34 33 (X) 0 .11 0 .11 472 .7 309 .1 Independence township . . . . . . . . . . 119 143 175 56 59 62 36 .02 35 .99 3 .3 1 .6 Iowa township . . . . . . . . . . . . . . . . . 109 132 144 39 44 43 35 .95 35 .51 3 .1 1 .1 Joubert township . . . . . . . . . . . . . . . 127 158 181 61 63 70 29 .20 28 .86 4 .4 2 .1 New Holland CDP (part) . . . . . . . . 43 34 (X) 22 19 (X) 0 .08 0 .08 537 .5 275 .0 Lincoln township . . . . . . . . . . . . . . . 84 108 144 40 42 47 35 .50 35 .48 2 .4 1 .1 Valley township . . . . . . . . . . . . . . . . . 126 144 148 47 45 53 36 .39 36 .05 3 .5 1 .3 Walnut Grove township . . . . . . . . . . 116 118 152 47 44 63 29 .02 29 .01 4 .0 1 .6 Washington township . . . . . . . . . . . . 131 141 149 54 56 57 29 .14 29 .13 4 .5 1 .9

Population and Housing Unit Counts South Dakota 17U.S. Census Bureau, 2010 Census
Table 8. Population and Housing Units: 1990 to 2010; and Area Measurements and Density: 2010—Con.[For information concerning historical counts and geographic change, see “User Notes .” For information on confidentiality, nonsampling error, and definitions, see Appendixes]
StateCounty/County EquivalentCounty SubdivisionPlace
Population Housing units Area measurements in square miles
Average per square mile of land
2010 2000 1990 2010 2000 1990 Total area Land areaPopulation
densityHousing unit
density
South Dakota—Con .
Edmunds County . . . . . . . . . . . . . . . . . 4,071 4,367 4,356 1,966 2,022 2,004 1,151 .07 1,125 .96 3 .6 1 .7 Adrian township . . . . . . . . . . . . . . . . 14 14 20 5 4 8 35 .63 35 .10 0 .4 0 .1 Belle township . . . . . . . . . . . . . . . . . 145 153 105 9 36 24 36 .08 36 .06 4 .0 0 .2 Bowdle city . . . . . . . . . . . . . . . . . . . . 502 571 589 267 283 289 0 .64 0 .64 784 .4 417 .2 Bowdle township . . . . . . . . . . . . . . . 90 78 76 30 32 33 35 .08 34 .58 2 .6 0 .9 Bryant township . . . . . . . . . . . . . . . . 19 23 36 15 17 18 35 .52 34 .76 0 .5 0 .4 Clear Lake township . . . . . . . . . . . . 32 52 52 26 30 34 36 .10 34 .34 0 .9 0 .8 Cleveland township . . . . . . . . . . . . . 17 24 31 10 12 15 36 .06 35 .75 0 .5 0 .3 Cloyd Valley township . . . . . . . . . . . 11 35 33 9 10 14 36 .17 34 .72 0 .3 0 .3 Cortlandt township . . . . . . . . . . . . . . 628 602 424 378 336 299 35 .44 34 .34 18 .3 11 .0 Cottonwood Lake township . . . . . . . 42 43 72 22 19 23 36 .15 34 .95 1 .2 0 .6 Fountain township . . . . . . . . . . . . . . 71 69 80 33 28 24 36 .12 36 .08 2 .0 0 .9 Glen township . . . . . . . . . . . . . . . . . 48 49 35 21 28 21 35 .76 33 .97 1 .4 0 .6 Glover township . . . . . . . . . . . . . . . . 48 44 53 18 19 23 36 .04 34 .21 1 .4 0 .5 Harmony township . . . . . . . . . . . . . . 159 162 169 17 39 37 36 .36 36 .23 4 .4 0 .5 Hillside township . . . . . . . . . . . . . . . 32 40 41 17 18 18 36 .14 34 .13 0 .9 0 .5 Hosmer city . . . . . . . . . . . . . . . . . . . 208 287 310 151 162 167 0 .99 0 .99 210 .1 152 .5 Hosmer township . . . . . . . . . . . . . . . 19 28 32 13 16 16 34 .99 34 .23 0 .6 0 .4 Hudson township . . . . . . . . . . . . . . . 43 45 53 23 20 18 35 .95 34 .29 1 .3 0 .7 Huntley township . . . . . . . . . . . . . . . 45 46 48 20 17 17 35 .96 35 .65 1 .3 0 .6 Ipswich city . . . . . . . . . . . . . . . . . . . . 954 943 965 441 440 434 1 .34 1 .34 711 .9 329 .1 Ipswich township . . . . . . . . . . . . . . . 58 120 71 32 30 24 35 .07 35 .04 1 .7 0 .9 Kent township . . . . . . . . . . . . . . . . . . 29 44 33 11 12 14 36 .05 35 .76 0 .8 0 .3 Liberty township . . . . . . . . . . . . . . . . 26 19 32 14 10 14 36 .32 35 .10 0 .7 0 .4 Madison township . . . . . . . . . . . . . . 19 19 23 9 9 11 36 .12 35 .14 0 .5 0 .3 Modena township . . . . . . . . . . . . . . . 19 36 48 14 15 17 35 .74 34 .93 0 .5 0 .4 Montpelier township . . . . . . . . . . . . . 43 46 50 17 21 16 36 .08 34 .81 1 .2 0 .5 North Bryant township . . . . . . . . . . . 48 53 48 23 24 23 35 .76 34 .83 1 .4 0 .7 Odessa township . . . . . . . . . . . . . . . 23 37 36 14 16 18 35 .98 34 .98 0 .7 0 .4 Pembrook township . . . . . . . . . . . . . 34 46 61 21 21 19 34 .88 34 .84 1 .0 0 .6 Powell township . . . . . . . . . . . . . . . . 42 36 37 16 14 20 35 .91 35 .53 1 .2 0 .5 Richland township . . . . . . . . . . . . . . 46 59 39 24 25 20 35 .79 35 .74 1 .3 0 .7 Roscoe city . . . . . . . . . . . . . . . . . . . 329 324 362 177 167 183 0 .47 0 .47 700 .0 376 .6 Rosette township . . . . . . . . . . . . . . . 104 85 140 8 20 32 36 .37 36 .22 2 .9 0 .2 Sangamon township . . . . . . . . . . . . 60 64 64 28 36 27 35 .60 35 .18 1 .7 0 .8 Union township . . . . . . . . . . . . . . . . 29 27 40 16 16 15 36 .14 36 .11 0 .8 0 .4 Vermont township . . . . . . . . . . . . . . . 35 44 48 17 20 19 36 .28 34 .93 1 .0 0 .5
Fall River County . . . . . . . . . . . . . . . . . 7,094 7,453 7,353 4,191 3,812 3,692 1,749 .15 1,739 .92 4 .1 2 .4 Argentine township . . . . . . . . . . . . . 25 21 22 15 14 11 35 .83 35 .80 0 .7 0 .4 Edgemont city . . . . . . . . . . . . . . . . . 774 867 906 509 516 564 0 .97 0 .97 797 .9 524 .7 Hot Springs city . . . . . . . . . . . . . . . . 3,711 4,129 4,325 1,958 1,900 1,872 3 .61 3 .61 1,028 .0 542 .4 Northeast Fall River UT . . . . . . . . . . 2,095 1,884 1,492 1,396 1,100 857 824 .77 816 .24 2 .6 1 .7 Oelrichs town . . . . . . . . . . . . . . . . . . 126 145 138 74 76 67 0 .38 0 .38 331 .6 194 .7 Provo township . . . . . . . . . . . . . . . . . 33 42 32 30 27 47 35 .58 35 .53 0 .9 0 .8 Robins township . . . . . . . . . . . . . . . . 29 20 15 17 8 11 35 .87 35 .86 0 .8 0 .5 Southwest Fall River UT . . . . . . . . . 301 345 305 192 171 198 812 .15 811 .53 0 .4 0 .2
Faulk County . . . . . . . . . . . . . . . . . . . . 2,364 2,640 2,744 1,136 1,235 1,286 1,005 .96 981 .75 2 .4 1 .2 Arcade township . . . . . . . . . . . . . . . 38 55 32 29 33 13 36 .07 35 .95 1 .1 0 .8 Bryant township . . . . . . . . . . . . . . . . 18 41 52 15 16 19 35 .95 35 .26 0 .5 0 .4 Centerville township . . . . . . . . . . . . . 35 40 39 15 15 16 36 .03 34 .95 1 .0 0 .4 Chelsea town . . . . . . . . . . . . . . . . . . 27 33 33 15 15 14 0 .32 0 .32 84 .4 46 .9 Clark township . . . . . . . . . . . . . . . . . 27 41 44 15 17 15 35 .90 33 .85 0 .8 0 .4 Cresbard town . . . . . . . . . . . . . . . . . 104 143 185 85 89 95 0 .42 0 .41 253 .7 207 .3 Devoe township . . . . . . . . . . . . . . . . 23 40 47 15 15 20 36 .12 35 .55 0 .6 0 .4 Ellisville township . . . . . . . . . . . . . . . 36 34 45 17 17 17 36 .00 35 .55 1 .0 0 .5 Emerson township . . . . . . . . . . . . . . 35 35 36 15 15 16 36 .05 35 .80 1 .0 0 .4 Enterprise township . . . . . . . . . . . . . 139 119 104 9 31 27 35 .50 33 .48 4 .2 0 .3 Fairview township . . . . . . . . . . . . . . . 49 43 44 20 18 19 35 .65 35 .10 1 .4 0 .6 Faulkton city . . . . . . . . . . . . . . . . . . . 736 785 809 418 413 427 1 .01 1 .01 728 .7 413 .9 Freedom township . . . . . . . . . . . . . . 145 120 159 27 38 42 36 .02 34 .37 4 .2 0 .8 Hillsdale township . . . . . . . . . . . . . . 38 48 59 22 24 25 36 .06 35 .52 1 .1 0 .6 Irving township . . . . . . . . . . . . . . . . . 11 21 18 5 5 7 36 .02 34 .81 0 .3 0 .1 Lafoon township . . . . . . . . . . . . . . . . 44 52 63 23 22 32 36 .00 35 .86 1 .2 0 .6 Myron township . . . . . . . . . . . . . . . . 124 125 71 13 28 24 36 .07 36 .04 3 .4 0 .4 Onaka town . . . . . . . . . . . . . . . . . . . 15 30 52 22 25 31 0 .27 0 .26 57 .7 84 .6 O’Neil township . . . . . . . . . . . . . . . . 12 13 15 4 6 6 36 .22 34 .69 0 .3 0 .1 Orient town . . . . . . . . . . . . . . . . . . . . 63 57 59 38 38 45 0 .30 0 .29 217 .2 131 .0 Orient township . . . . . . . . . . . . . . . . 49 52 48 20 19 20 35 .88 35 .55 1 .4 0 .6 Pioneer township . . . . . . . . . . . . . . . 25 27 37 11 12 12 35 .64 34 .69 0 .7 0 .3 Pulaski UT . . . . . . . . . . . . . . . . . . . . 13 30 19 8 10 11 36 .17 35 .43 0 .4 0 .2

18 South Dakota Population and Housing Unit CountsU.S. Census Bureau, 2010 Census
Table 8. Population and Housing Units: 1990 to 2010; and Area Measurements and Density: 2010—Con.[For information concerning historical counts and geographic change, see “User Notes .” For information on confidentiality, nonsampling error, and definitions, see Appendixes]
StateCounty/County EquivalentCounty SubdivisionPlace
Population Housing units Area measurements in square miles
Average per square mile of land
2010 2000 1990 2010 2000 1990 Total area Land areaPopulation
densityHousing unit
density
South Dakota—Con .
Faulk County—Con . Rockham town . . . . . . . . . . . . . . . . . 33 53 48 28 27 22 0 .50 0 .50 66 .0 56 .0 Saratoga township . . . . . . . . . . . . . . 150 138 94 9 33 31 35 .59 34 .24 4 .4 0 .3 Seneca town . . . . . . . . . . . . . . . . . . 38 58 81 29 36 45 0 .42 0 .42 90 .5 69 .0 Sherman township . . . . . . . . . . . . . . 36 48 47 18 20 20 35 .83 34 .80 1 .0 0 .5 Southwest Faulk UT . . . . . . . . . . . . . 56 86 87 39 41 54 143 .85 140 .51 0 .4 0 .3 Tamworth township . . . . . . . . . . . . . 84 86 92 67 70 65 35 .05 34 .68 2 .4 1 .9 Union township . . . . . . . . . . . . . . . . 58 58 75 28 25 32 34 .38 32 .68 1 .8 0 .9 Wesley township . . . . . . . . . . . . . . . 39 41 46 20 20 24 35 .27 34 .56 1 .1 0 .6 Zell township . . . . . . . . . . . . . . . . . . 64 88 104 37 42 40 35 .38 34 .62 1 .8 1 .1
Grant County . . . . . . . . . . . . . . . . . . . . 7,356 7,847 8,372 3,526 3,456 3,549 687 .54 681 .46 10 .8 5 .2 Adams township . . . . . . . . . . . . . . . . 150 169 190 63 71 82 54 .49 54 .49 2 .8 1 .2 Alban township . . . . . . . . . . . . . . . . . 580 592 622 243 220 221 54 .57 54 .10 10 .7 4 .5 Albee town . . . . . . . . . . . . . . . . . . . . 16 10 15 7 6 11 0 .13 0 .13 123 .1 53 .8 Big Stone township . . . . . . . . . . . . . 314 314 318 138 130 120 33 .85 31 .65 9 .9 4 .4 Big Stone City city . . . . . . . . . . . . . . 467 605 669 314 309 323 1 .20 1 .20 389 .2 261 .7 Blooming Valley township . . . . . . . . . 126 125 118 49 45 44 36 .23 36 .12 3 .5 1 .4 Farmington township . . . . . . . . . . . . 75 57 53 31 22 19 21 .89 21 .83 3 .4 1 .4 Georgia township . . . . . . . . . . . . . . . 85 118 97 40 44 47 35 .37 35 .16 2 .4 1 .1 Grant Center township . . . . . . . . . . . 378 331 298 142 116 109 35 .86 35 .80 10 .6 4 .0 Kilborn township . . . . . . . . . . . . . . . . 144 157 172 64 61 66 35 .79 35 .79 4 .0 1 .8 La Bolt town . . . . . . . . . . . . . . . . . . . 68 86 91 37 36 41 0 .24 0 .24 283 .3 154 .2 Lura township . . . . . . . . . . . . . . . . . . 44 74 89 22 28 36 31 .93 31 .77 1 .4 0 .7 Madison township . . . . . . . . . . . . . . 123 123 147 62 55 66 35 .78 35 .77 3 .4 1 .7 Marvin town . . . . . . . . . . . . . . . . . . . 34 66 38 21 28 27 0 .55 0 .55 61 .8 38 .2 Mazeppa township . . . . . . . . . . . . . . 112 79 96 42 37 40 52 .18 51 .76 2 .2 0 .8 Melrose township . . . . . . . . . . . . . . . 383 350 409 151 126 127 47 .90 47 .73 8 .0 3 .2 Milbank city . . . . . . . . . . . . . . . . . . . 3,353 3,640 3,879 1,683 1,698 1,711 2 .84 2 .76 1,214 .9 609 .8 Osceola township . . . . . . . . . . . . . . . 90 81 108 37 37 33 43 .60 42 .79 2 .1 0 .9 Revillo town . . . . . . . . . . . . . . . . . . . 119 147 152 67 79 95 0 .17 0 .17 700 .0 394 .1 Stockholm town . . . . . . . . . . . . . . . . 108 105 89 55 57 43 0 .44 0 .43 251 .2 127 .9 Stockholm township . . . . . . . . . . . . . 88 73 124 35 34 44 35 .17 34 .96 2 .5 1 .0 Strandburg town . . . . . . . . . . . . . . . . 72 69 74 36 33 39 0 .07 0 .07 1,028 .6 514 .3 Troy township . . . . . . . . . . . . . . . . . . 60 71 59 29 30 38 35 .64 34 .72 1 .7 0 .8 Twin Brooks town . . . . . . . . . . . . . . . 69 55 54 31 28 26 0 .41 0 .41 168 .3 75 .6 Twin Brooks township . . . . . . . . . . . . 80 100 122 38 38 43 36 .37 36 .36 2 .2 1 .0 Vernon township . . . . . . . . . . . . . . . . 218 250 289 89 88 98 54 .88 54 .69 4 .0 1 .6
Gregory County . . . . . . . . . . . . . . . . . . 4,271 4,792 5,359 2,503 2,405 2,595 1,053 .53 1,014 .96 4 .2 2 .5 Bonesteel city . . . . . . . . . . . . . . . . . . 275 297 297 170 164 176 0 .35 0 .35 785 .7 485 .7 Burke city . . . . . . . . . . . . . . . . . . . . . 604 676 756 398 385 392 0 .56 0 .56 1,078 .6 710 .7 Dallas town . . . . . . . . . . . . . . . . . . . 120 144 142 74 68 74 0 .50 0 .50 240 .0 148 .0 Dixon township . . . . . . . . . . . . . . . . . 86 119 159 51 49 53 64 .83 64 .64 1 .3 0 .8 East Gregory UT . . . . . . . . . . . . . . . 190 19 22 136 9 10 227 .25 212 .89 0 .9 0 .6 St . Charles CDP . . . . . . . . . . . . . . 11 (X) (X) 11 (X) (X) 0 .20 0 .20 55 .0 55 .0 Edens township . . . . . . . . . . . . . . . . 79 75 64 43 37 29 35 .74 35 .70 2 .2 1 .2 Fairfax town . . . . . . . . . . . . . . . . . . . 115 123 144 81 76 93 0 .30 0 .30 383 .3 270 .0 Fairfax township . . . . . . . . . . . . . . . . 62 75 118 39 39 57 32 .47 32 .43 1 .9 1 .2 Gregory city . . . . . . . . . . . . . . . . . . . 1,295 1,342 1,486 730 718 744 1 .71 1 .71 757 .3 426 .9 Herrick town . . . . . . . . . . . . . . . . . . . 105 105 139 58 52 67 0 .52 0 .52 201 .9 111 .5 Jones township . . . . . . . . . . . . . . . . 65 79 69 40 30 35 35 .94 35 .92 1 .8 1 .1 Landing Creek township . . . . . . . . . 17 31 24 14 14 11 63 .33 61 .78 0 .3 0 .2 North Gregory UT . . . . . . . . . . . . . . 470 780 829 240 347 320 211 .25 202 .18 2 .3 1 .2 Pleasant Valley township . . . . . . . . . 145 225 235 71 71 86 36 .37 36 .36 4 .0 2 .0 Schriever township . . . . . . . . . . . . . . 42 49 58 24 22 25 23 .77 23 .77 1 .8 1 .0 Southeast Gregory UT . . . . . . . . . . . 34 49 55 26 19 25 45 .79 39 .45 0 .9 0 .7 Star Valley township . . . . . . . . . . . . . 68 76 84 33 34 44 55 .01 48 .27 1 .4 0 .7 West Gregory UT . . . . . . . . . . . . . . . 499 (X) (X) 275 (X) (X) 217 .84 217 .65 2 .3 1 .3
Haakon County . . . . . . . . . . . . . . . . . . 1,937 2,196 2,624 1,013 1,002 1,071 1,826 .92 1,810 .53 1 .1 0 .6 East Haakon UT . . . . . . . . . . . . . . . . 446 509 556 220 214 224 1,107 .70 1,097 .27 0 .4 0 .2 Midland town . . . . . . . . . . . . . . . . . . 129 179 233 92 91 103 0 .34 0 .34 379 .4 270 .6 Philip city . . . . . . . . . . . . . . . . . . . . . 779 885 1,077 423 424 450 0 .60 0 .60 1,298 .3 705 .0 West Haakon UT . . . . . . . . . . . . . . . 583 623 758 278 273 294 718 .28 712 .32 0 .8 0 .4
Hamlin County . . . . . . . . . . . . . . . . . . . 5,903 5,540 4,974 2,760 2,626 2,500 538 .07 507 .23 11 .6 5 .4 Brantford township . . . . . . . . . . . . . . 123 151 158 60 62 63 53 .47 53 .37 2 .3 1 .1 Bryant city . . . . . . . . . . . . . . . . . . . . 456 396 374 196 204 212 0 .52 0 .52 876 .9 376 .9 Castlewood city . . . . . . . . . . . . . . . . 627 666 549 292 265 233 1 .15 1 .15 545 .2 253 .9 Castlewood township . . . . . . . . . . . . 226 222 171 84 72 57 34 .73 34 .58 6 .5 2 .4 Cleveland township . . . . . . . . . . . . . 251 226 159 67 57 51 35 .84 34 .68 7 .2 1 .9
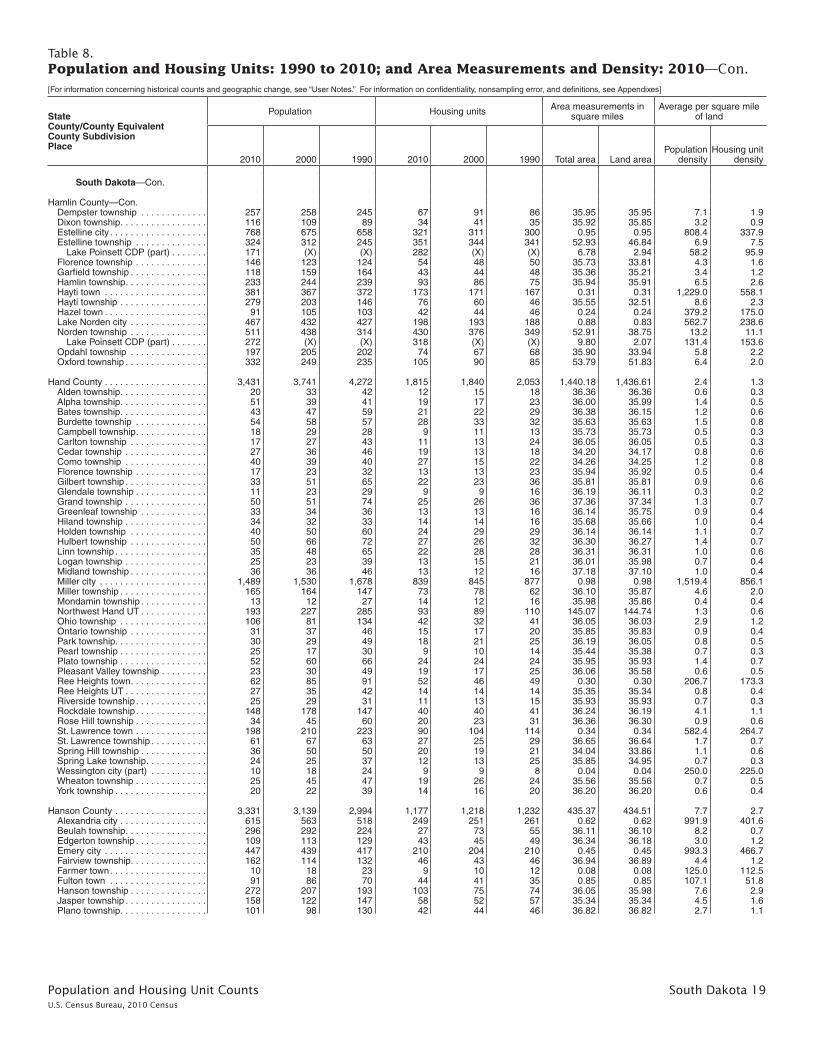
Population and Housing Unit Counts South Dakota 19U.S. Census Bureau, 2010 Census
Table 8. Population and Housing Units: 1990 to 2010; and Area Measurements and Density: 2010—Con.[For information concerning historical counts and geographic change, see “User Notes .” For information on confidentiality, nonsampling error, and definitions, see Appendixes]
StateCounty/County EquivalentCounty SubdivisionPlace
Population Housing units Area measurements in square miles
Average per square mile of land
2010 2000 1990 2010 2000 1990 Total area Land areaPopulation
densityHousing unit
density
South Dakota—Con .
Hamlin County—Con . Dempster township . . . . . . . . . . . . . 257 258 245 67 91 86 35 .95 35 .95 7 .1 1 .9 Dixon township . . . . . . . . . . . . . . . . . 116 109 89 34 41 35 35 .92 35 .85 3 .2 0 .9 Estelline city . . . . . . . . . . . . . . . . . . . 768 675 658 321 311 300 0 .95 0 .95 808 .4 337 .9 Estelline township . . . . . . . . . . . . . . 324 312 245 351 344 341 52 .93 46 .84 6 .9 7 .5 Lake Poinsett CDP (part) . . . . . . . 171 (X) (X) 282 (X) (X) 6 .78 2 .94 58 .2 95 .9 Florence township . . . . . . . . . . . . . . 146 123 124 54 48 50 35 .73 33 .81 4 .3 1 .6 Garfield township . . . . . . . . . . . . . . . 118 159 164 43 44 48 35 .36 35 .21 3 .4 1 .2 Hamlin township . . . . . . . . . . . . . . . . 233 244 239 93 86 75 35 .94 35 .91 6 .5 2 .6 Hayti town . . . . . . . . . . . . . . . . . . . . 381 367 372 173 171 167 0 .31 0 .31 1,229 .0 558 .1 Hayti township . . . . . . . . . . . . . . . . . 279 203 146 76 60 46 35 .55 32 .51 8 .6 2 .3 Hazel town . . . . . . . . . . . . . . . . . . . . 91 105 103 42 44 46 0 .24 0 .24 379 .2 175 .0 Lake Norden city . . . . . . . . . . . . . . . 467 432 427 198 193 188 0 .88 0 .83 562 .7 238 .6 Norden township . . . . . . . . . . . . . . . 511 438 314 430 376 349 52 .91 38 .75 13 .2 11 .1 Lake Poinsett CDP (part) . . . . . . . 272 (X) (X) 318 (X) (X) 9 .80 2 .07 131 .4 153 .6 Opdahl township . . . . . . . . . . . . . . . 197 205 202 74 67 68 35 .90 33 .94 5 .8 2 .2 Oxford township . . . . . . . . . . . . . . . . 332 249 235 105 90 85 53 .79 51 .83 6 .4 2 .0
Hand County . . . . . . . . . . . . . . . . . . . . 3,431 3,741 4,272 1,815 1,840 2,053 1,440 .18 1,436 .61 2 .4 1 .3 Alden township . . . . . . . . . . . . . . . . . 20 33 42 12 15 18 36 .36 36 .36 0 .6 0 .3 Alpha township . . . . . . . . . . . . . . . . . 51 39 41 19 17 23 36 .00 35 .99 1 .4 0 .5 Bates township . . . . . . . . . . . . . . . . . 43 47 59 21 22 29 36 .38 36 .15 1 .2 0 .6 Burdette township . . . . . . . . . . . . . . 54 58 57 28 33 32 35 .63 35 .63 1 .5 0 .8 Campbell township . . . . . . . . . . . . . . 18 29 28 9 11 13 35 .73 35 .73 0 .5 0 .3 Carlton township . . . . . . . . . . . . . . . 17 27 43 11 13 24 36 .05 36 .05 0 .5 0 .3 Cedar township . . . . . . . . . . . . . . . . 27 36 46 19 13 18 34 .20 34 .17 0 .8 0 .6 Como township . . . . . . . . . . . . . . . . 40 39 40 27 15 22 34 .26 34 .25 1 .2 0 .8 Florence township . . . . . . . . . . . . . . 17 23 32 13 13 23 35 .94 35 .92 0 .5 0 .4 Gilbert township . . . . . . . . . . . . . . . . 33 51 65 22 23 36 35 .81 35 .81 0 .9 0 .6 Glendale township . . . . . . . . . . . . . . 11 23 29 9 9 16 36 .19 36 .11 0 .3 0 .2 Grand township . . . . . . . . . . . . . . . . 50 51 74 25 26 36 37 .36 37 .34 1 .3 0 .7 Greenleaf township . . . . . . . . . . . . . 33 34 36 13 13 16 36 .14 35 .75 0 .9 0 .4 Hiland township . . . . . . . . . . . . . . . . 34 32 33 14 14 16 35 .68 35 .66 1 .0 0 .4 Holden township . . . . . . . . . . . . . . . 40 50 60 24 29 29 36 .14 36 .14 1 .1 0 .7 Hulbert township . . . . . . . . . . . . . . . 50 66 72 27 26 32 36 .30 36 .27 1 .4 0 .7 Linn township . . . . . . . . . . . . . . . . . . 35 48 65 22 28 28 36 .31 36 .31 1 .0 0 .6 Logan township . . . . . . . . . . . . . . . . 25 23 39 13 15 21 36 .01 35 .98 0 .7 0 .4 Midland township . . . . . . . . . . . . . . . 36 36 46 13 12 16 37 .18 37 .10 1 .0 0 .4 Miller city . . . . . . . . . . . . . . . . . . . . . 1,489 1,530 1,678 839 845 877 0 .98 0 .98 1,519 .4 856 .1 Miller township . . . . . . . . . . . . . . . . . 165 164 147 73 78 62 36 .10 35 .87 4 .6 2 .0 Mondamin township . . . . . . . . . . . . . 13 12 27 14 12 16 35 .98 35 .86 0 .4 0 .4 Northwest Hand UT . . . . . . . . . . . . . 193 227 285 93 89 110 145 .07 144 .74 1 .3 0 .6 Ohio township . . . . . . . . . . . . . . . . . 106 81 134 42 32 41 36 .05 36 .03 2 .9 1 .2 Ontario township . . . . . . . . . . . . . . . 31 37 46 15 17 20 35 .85 35 .83 0 .9 0 .4 Park township . . . . . . . . . . . . . . . . . . 30 29 49 18 21 25 36 .19 36 .05 0 .8 0 .5 Pearl township . . . . . . . . . . . . . . . . . 25 17 30 9 10 14 35 .44 35 .38 0 .7 0 .3 Plato township . . . . . . . . . . . . . . . . . 52 60 66 24 24 24 35 .95 35 .93 1 .4 0 .7 Pleasant Valley township . . . . . . . . . 23 30 49 19 17 25 36 .06 35 .58 0 .6 0 .5 Ree Heights town . . . . . . . . . . . . . . . 62 85 91 52 46 49 0 .30 0 .30 206 .7 173 .3 Ree Heights UT . . . . . . . . . . . . . . . . 27 35 42 14 14 14 35 .35 35 .34 0 .8 0 .4 Riverside township . . . . . . . . . . . . . . 25 29 31 11 13 15 35 .93 35 .93 0 .7 0 .3 Rockdale township . . . . . . . . . . . . . . 148 178 147 40 40 41 36 .24 36 .19 4 .1 1 .1 Rose Hill township . . . . . . . . . . . . . . 34 45 60 20 23 31 36 .36 36 .30 0 .9 0 .6 St . Lawrence town . . . . . . . . . . . . . . 198 210 223 90 104 114 0 .34 0 .34 582 .4 264 .7 St . Lawrence township . . . . . . . . . . . 61 67 63 27 25 29 36 .65 36 .64 1 .7 0 .7 Spring Hill township . . . . . . . . . . . . . 36 50 50 20 19 21 34 .04 33 .86 1 .1 0 .6 Spring Lake township . . . . . . . . . . . . 24 25 37 12 13 25 35 .85 34 .95 0 .7 0 .3 Wessington city (part) . . . . . . . . . . . 10 18 24 9 9 8 0 .04 0 .04 250 .0 225 .0 Wheaton township . . . . . . . . . . . . . . 25 45 47 19 26 24 35 .56 35 .56 0 .7 0 .5 York township . . . . . . . . . . . . . . . . . . 20 22 39 14 16 20 36 .20 36 .20 0 .6 0 .4
Hanson County . . . . . . . . . . . . . . . . . . 3,331 3,139 2,994 1,177 1,218 1,232 435 .37 434 .51 7 .7 2 .7 Alexandria city . . . . . . . . . . . . . . . . . 615 563 518 249 251 261 0 .62 0 .62 991 .9 401 .6 Beulah township . . . . . . . . . . . . . . . . 296 292 224 27 73 55 36 .11 36 .10 8 .2 0 .7 Edgerton township . . . . . . . . . . . . . . 109 113 129 43 45 49 36 .34 36 .18 3 .0 1 .2 Emery city . . . . . . . . . . . . . . . . . . . . 447 439 417 210 204 210 0 .45 0 .45 993 .3 466 .7 Fairview township . . . . . . . . . . . . . . . 162 114 132 46 43 46 36 .94 36 .89 4 .4 1 .2 Farmer town . . . . . . . . . . . . . . . . . . . 10 18 23 9 10 12 0 .08 0 .08 125 .0 112 .5 Fulton town . . . . . . . . . . . . . . . . . . . 91 86 70 44 41 35 0 .85 0 .85 107 .1 51 .8 Hanson township . . . . . . . . . . . . . . . 272 207 193 103 75 74 36 .05 35 .98 7 .6 2 .9 Jasper township . . . . . . . . . . . . . . . . 158 122 147 58 52 57 35 .34 35 .34 4 .5 1 .6 Plano township . . . . . . . . . . . . . . . . . 101 98 130 42 44 46 36 .82 36 .82 2 .7 1 .1

20 South Dakota Population and Housing Unit CountsU.S. Census Bureau, 2010 Census
Table 8. Population and Housing Units: 1990 to 2010; and Area Measurements and Density: 2010—Con.[For information concerning historical counts and geographic change, see “User Notes .” For information on confidentiality, nonsampling error, and definitions, see Appendixes]
StateCounty/County EquivalentCounty SubdivisionPlace
Population Housing units Area measurements in square miles
Average per square mile of land
2010 2000 1990 2010 2000 1990 Total area Land areaPopulation
densityHousing unit
density
South Dakota—Con .
Hanson County—Con . Pleasant township . . . . . . . . . . . . . . 134 162 153 51 51 50 35 .58 35 .56 3 .8 1 .4 Rosedale township . . . . . . . . . . . . . . 394 316 293 53 86 86 36 .10 35 .99 10 .9 1 .5 Spring Lake township . . . . . . . . . . . . 121 140 130 53 53 57 36 .80 36 .60 3 .3 1 .4 Taylor township . . . . . . . . . . . . . . . . . 90 129 146 41 49 56 35 .97 35 .97 2 .5 1 .1 Wayne township . . . . . . . . . . . . . . . . 216 228 192 99 98 93 35 .38 35 .22 6 .1 2 .8 Worthen township . . . . . . . . . . . . . . 115 112 97 49 43 45 35 .95 35 .87 3 .2 1 .4
Harding County . . . . . . . . . . . . . . . . . . 1,255 1,353 1,669 731 804 776 2,677 .92 2,671 .37 0 .5 0 .3 Buffalo town . . . . . . . . . . . . . . . . . . . 330 380 488 220 243 240 0 .55 0 .55 600 .0 400 .0 Camp Crook town . . . . . . . . . . . . . . 63 56 146 46 51 55 0 .14 0 .14 450 .0 328 .6 North Harding UT . . . . . . . . . . . . . . . 548 578 697 307 343 320 1,508 .56 1,504 .97 0 .4 0 .2 South Harding UT . . . . . . . . . . . . . . 314 339 338 158 167 161 1,168 .67 1,165 .71 0 .3 0 .1
Hughes County . . . . . . . . . . . . . . . . . . 17,022 16,481 14,817 7,623 7,055 6,255 800 .73 741 .56 23 .0 10 .3 Blunt city . . . . . . . . . . . . . . . . . . . . . 354 370 342 167 178 172 0 .49 0 .49 722 .4 340 .8 Crow Creek UT . . . . . . . . . . . . . . . . 185 236 171 71 72 55 120 .61 99 .93 1 .9 0 .7 Harrold town . . . . . . . . . . . . . . . . . . . 124 209 167 74 90 91 0 .27 0 .27 459 .3 274 .1 North Hughes UT . . . . . . . . . . . . . . . 250 233 170 119 108 90 280 .25 279 .61 0 .9 0 .4 Pierre city . . . . . . . . . . . . . . . . . . . . . 13,646 13,876 12,906 6,159 5,949 5,390 13 .07 13 .06 1,044 .9 471 .6 Raber township . . . . . . . . . . . . . . . . 26 42 41 23 22 23 53 .11 51 .70 0 .5 0 .4 West Hughes UT . . . . . . . . . . . . . . . 2,437 1,494 963 1,010 630 403 332 .94 296 .51 8 .2 3 .4
Hutchinson County . . . . . . . . . . . . . . . 7,343 8,075 8,262 3,351 3,517 3,657 814 .42 812 .90 9 .0 4 .1 Capital township . . . . . . . . . . . . . . . . 80 95 103 45 46 50 35 .72 35 .72 2 .2 1 .3 Clayton township . . . . . . . . . . . . . . . 89 114 172 54 61 80 48 .25 48 .22 1 .8 1 .1 Cross Plains township . . . . . . . . . . . 125 119 118 41 44 53 29 .46 29 .35 4 .3 1 .4 Dimock town . . . . . . . . . . . . . . . . . . 125 151 157 61 63 65 0 .16 0 .16 781 .3 381 .3 Fair township . . . . . . . . . . . . . . . . . . 79 118 146 49 50 59 34 .79 34 .78 2 .3 1 .4 Foster township . . . . . . . . . . . . . . . . 252 221 144 24 59 41 29 .53 29 .21 8 .6 0 .8 Freeman city . . . . . . . . . . . . . . . . . . 1,306 1,317 1,293 672 648 625 1 .11 1 .11 1,176 .6 605 .4 German township . . . . . . . . . . . . . . . 95 105 142 40 42 62 35 .08 35 .08 2 .7 1 .1 Grandview township . . . . . . . . . . . . . 123 160 253 58 63 101 34 .95 34 .94 3 .5 1 .7 Kassel township . . . . . . . . . . . . . . . . 113 128 131 48 46 54 36 .08 35 .95 3 .1 1 .3 Kaylor township . . . . . . . . . . . . . . . . 170 197 223 84 86 92 35 .57 35 .54 4 .8 2 .4 Kaylor CDP . . . . . . . . . . . . . . . . . . 47 64 (X) 28 32 (X) 0 .67 0 .64 73 .4 43 .8 Kulm township . . . . . . . . . . . . . . . . . 78 91 108 42 39 43 35 .37 35 .37 2 .2 1 .2 Liberty township . . . . . . . . . . . . . . . . 156 168 162 61 57 62 34 .71 34 .71 4 .5 1 .8 Menno city . . . . . . . . . . . . . . . . . . . . 608 729 768 327 358 372 0 .52 0 .52 1,169 .2 628 .8 Milltown township . . . . . . . . . . . . . . . 115 132 146 55 58 72 35 .76 35 .76 3 .2 1 .5 Milltown CDP . . . . . . . . . . . . . . . . 10 8 (X) 7 9 (X) 0 .44 0 .44 22 .7 15 .9 Molan township . . . . . . . . . . . . . . . . 136 156 180 61 67 69 36 .04 36 .01 3 .8 1 .7 Oak Hollow township . . . . . . . . . . . . 41 62 68 27 29 36 32 .43 32 .40 1 .3 0 .8 Olivet town . . . . . . . . . . . . . . . . . . . . 74 70 74 47 43 53 0 .15 0 .15 493 .3 313 .3 Parkston city . . . . . . . . . . . . . . . . . . 1,508 1,674 1,572 737 752 716 0 .91 0 .91 1,657 .1 809 .9 Pleasant township . . . . . . . . . . . . . . 46 49 62 25 25 29 29 .02 28 .95 1 .6 0 .9 Sharon township . . . . . . . . . . . . . . . 79 117 111 40 41 54 35 .32 35 .32 2 .2 1 .1 Silver Lake township . . . . . . . . . . . . 115 155 114 49 46 49 29 .06 28 .37 4 .1 1 .7 Starr township . . . . . . . . . . . . . . . . . 127 127 151 48 49 51 28 .52 28 .52 4 .5 1 .7 Susquehanna township . . . . . . . . . . 181 212 207 70 72 75 35 .07 35 .07 5 .2 2 .0 Sweet township . . . . . . . . . . . . . . . . 285 249 258 47 77 81 35 .80 35 .80 8 .0 1 .3 Tripp city . . . . . . . . . . . . . . . . . . . . . . 647 711 664 360 373 369 0 .59 0 .59 1,096 .6 610 .2 Valley township . . . . . . . . . . . . . . . . . 175 189 220 77 75 82 35 .89 35 .89 4 .9 2 .1 Wittenberg township . . . . . . . . . . . . . 218 247 267 55 75 87 52 .98 52 .97 4 .1 1 .0 Wolf Creek township . . . . . . . . . . . . 197 212 248 47 73 75 35 .60 35 .52 5 .5 1 .3
Hyde County . . . . . . . . . . . . . . . . . . . . 1,420 1,671 1,696 708 769 816 866 .14 860 .52 1 .7 0 .8 Central Hyde UT . . . . . . . . . . . . . . . 402 443 459 183 187 183 460 .56 459 .19 0 .9 0 .4 Crow Creek UT . . . . . . . . . . . . . . . . 89 156 90 39 56 41 84 .90 82 .58 1 .1 0 .5 Highmore city . . . . . . . . . . . . . . . . . . 795 851 835 393 432 455 1 .88 1 .88 422 .9 209 .0 North Hyde UT . . . . . . . . . . . . . . . . . 115 186 249 80 78 108 246 .75 245 .14 0 .5 0 .3 Valley township . . . . . . . . . . . . . . . . . 13 25 39 10 11 13 36 .22 36 .04 0 .4 0 .3 William Hamilton township . . . . . . . . 6 10 10 3 5 7 35 .83 35 .69 0 .2 0 .1
Jackson County . . . . . . . . . . . . . . . . . . 3,031 2,930 2,811 1,193 1,173 1,147 1,871 .29 1,863 .91 1 .6 0 .6 Belvidere town . . . . . . . . . . . . . . . . . 49 57 63 40 37 47 0 .83 0 .76 64 .5 52 .6 Cottonwood town . . . . . . . . . . . . . . . 9 6 12 9 5 6 0 .92 0 .92 9 .8 9 .8 Grandview II township . . . . . . . . . . . 6 10 (X) 3 3 (X) 21 .04 20 .96 0 .3 0 .1 Interior town . . . . . . . . . . . . . . . . . . . 94 77 67 55 53 40 1 .34 1 .34 70 .1 41 .0 Interior township . . . . . . . . . . . . . . . . 47 75 60 30 84 46 101 .27 100 .85 0 .5 0 .3 Jewett township . . . . . . . . . . . . . . . . 14 22 21 9 10 9 35 .77 35 .60 0 .4 0 .3 Kadoka city . . . . . . . . . . . . . . . . . . . 654 706 736 350 356 365 2 .31 2 .28 286 .8 153 .5

Population and Housing Unit Counts South Dakota 21U.S. Census Bureau, 2010 Census
Table 8. Population and Housing Units: 1990 to 2010; and Area Measurements and Density: 2010—Con.[For information concerning historical counts and geographic change, see “User Notes .” For information on confidentiality, nonsampling error, and definitions, see Appendixes]
StateCounty/County EquivalentCounty SubdivisionPlace
Population Housing units Area measurements in square miles
Average per square mile of land
2010 2000 1990 2010 2000 1990 Total area Land areaPopulation
densityHousing unit
density
South Dakota—Con .
Jackson County—Con . Northeast Jackson UT . . . . . . . . . . . 206 228 236 105 106 106 395 .36 392 .28 0 .5 0 .3 Northwest Jackson UT . . . . . . . . . . . 95 99 64 43 44 35 162 .93 162 .11 0 .6 0 .3 Southeast Jackson UT . . . . . . . . . . . 187 219 214 94 78 110 381 .22 380 .30 0 .5 0 .2 Southwest Jackson UT . . . . . . . . . . 1,626 1,383 1,269 435 371 349 684 .46 683 .42 2 .4 0 .6 Wanblee CDP . . . . . . . . . . . . . . . . 725 641 654 153 144 149 2 .15 2 .14 338 .8 71 .5 Wall township . . . . . . . . . . . . . . . . . . 39 22 19 16 10 7 33 .60 33 .22 1 .2 0 .5 Weta township . . . . . . . . . . . . . . . . . 5 7 13 4 7 10 50 .22 49 .87 0 .1 0 .1
Jerauld County . . . . . . . . . . . . . . . . . . 2,071 2,295 2,425 1,070 1,167 1,182 532 .67 526 .23 3 .9 2 .0 Alpena town . . . . . . . . . . . . . . . . . . . 286 265 251 124 122 121 1 .64 1 .63 175 .5 76 .1 Alpena township . . . . . . . . . . . . . . . . 68 117 108 37 57 43 33 .41 33 .07 2 .1 1 .1 Anina township . . . . . . . . . . . . . . . . . 21 36 55 17 23 23 35 .25 34 .84 0 .6 0 .5 Blaine township . . . . . . . . . . . . . . . . 70 96 86 49 42 45 36 .01 35 .56 2 .0 1 .4 Chery township . . . . . . . . . . . . . . . . 47 54 67 26 26 33 35 .09 34 .85 1 .3 0 .7 Crow township . . . . . . . . . . . . . . . . . 151 176 119 13 43 38 35 .39 35 .32 4 .3 0 .4 Crow Lake township . . . . . . . . . . . . . 54 46 61 28 27 27 35 .52 34 .58 1 .6 0 .8 Dale UT . . . . . . . . . . . . . . . . . . . . . . 31 38 (X) 22 17 (X) 34 .96 34 .62 0 .9 0 .6 Franklin township . . . . . . . . . . . . . . . 52 75 81 34 34 39 35 .49 35 .11 1 .5 1 .0 Harmony township . . . . . . . . . . . . . . 22 47 50 16 22 29 35 .67 34 .52 0 .6 0 .5 Lane town . . . . . . . . . . . . . . . . . . . . 59 59 71 37 34 37 0 .46 0 .46 128 .3 80 .4 Logan township . . . . . . . . . . . . . . . . 21 21 21 9 12 12 35 .52 34 .81 0 .6 0 .3 Marlar township . . . . . . . . . . . . . . . . 14 20 46 11 13 23 36 .05 35 .53 0 .4 0 .3 Media UT . . . . . . . . . . . . . . . . . . . . . 55 58 63 29 29 27 34 .49 34 .07 1 .6 0 .9 Pleasant township . . . . . . . . . . . . . . 60 69 78 36 32 36 35 .40 35 .11 1 .7 1 .0 Viola township . . . . . . . . . . . . . . . . . 38 40 52 25 27 19 35 .65 35 .56 1 .1 0 .7 Wessington Springs city . . . . . . . . . . 956 1,011 1,083 526 580 569 1 .77 1 .77 540 .1 297 .2 Wessington Springs township . . . . . 66 67 83 31 27 33 34 .89 34 .81 1 .9 0 .9
Jones County . . . . . . . . . . . . . . . . . . . . 1,006 1,193 1,324 589 614 699 970 .89 969 .68 1 .0 0 .6 Buffalo township . . . . . . . . . . . . . . . . 39 45 42 21 20 24 35 .74 35 .74 1 .1 0 .6 Central Jones UT . . . . . . . . . . . . . . . 61 69 111 36 32 46 111 .45 111 .17 0 .5 0 .3 Draper town . . . . . . . . . . . . . . . . . . . 82 92 123 48 57 74 0 .65 0 .65 126 .2 73 .8 Draper township . . . . . . . . . . . . . . . . 33 44 42 25 23 27 35 .16 35 .09 0 .9 0 .7 Dunkel township . . . . . . . . . . . . . . . . 15 24 16 9 10 15 36 .00 36 .00 0 .4 0 .3 Grandview UT . . . . . . . . . . . . . . . . . 38 21 13 12 10 6 28 .32 28 .25 1 .3 0 .4 Okaton CDP (part) . . . . . . . . . . . . 13 10 (X) 4 5 (X) 5 .73 5 .70 2 .3 0 .7 Kolls township . . . . . . . . . . . . . . . . . 13 21 19 10 11 12 35 .58 35 .52 0 .4 0 .3 Morgan township . . . . . . . . . . . . . . . 13 36 29 14 16 18 35 .65 35 .55 0 .4 0 .4 Mullen township . . . . . . . . . . . . . . . . 13 8 6 5 5 7 36 .09 36 .09 0 .4 0 .1 Murdo city . . . . . . . . . . . . . . . . . . . . 488 612 679 291 315 331 0 .63 0 .63 774 .6 461 .9 Mussman township . . . . . . . . . . . . . 10 6 19 4 3 10 29 .92 29 .90 0 .3 0 .1 North Jones UT . . . . . . . . . . . . . . . . 39 48 40 23 23 27 243 .77 243 .57 0 .2 0 .1 Okaton township . . . . . . . . . . . . . . . 46 47 64 26 24 31 45 .85 45 .85 1 .0 0 .6 Okaton CDP (part) . . . . . . . . . . . . 23 19 (X) 13 13 (X) 24 .07 24 .07 1 .0 0 .5 Rich Valley UT . . . . . . . . . . . . . . . . . 11 6 4 6 6 2 48 .93 48 .73 0 .2 0 .1 Scovil township . . . . . . . . . . . . . . . . 21 19 21 11 10 9 35 .73 35 .68 0 .6 0 .3 South Creek township . . . . . . . . . . . 16 16 22 8 8 11 35 .75 35 .75 0 .4 0 .2 Virgil township . . . . . . . . . . . . . . . . . 6 13 16 7 7 10 35 .89 35 .78 0 .2 0 .2 Westover UT . . . . . . . . . . . . . . . . . . 6 11 (X) 6 5 (X) 33 .59 33 .59 0 .2 0 .2 Williams Creek township . . . . . . . . . 43 44 38 22 23 20 73 .62 73 .56 0 .6 0 .3 Zickrick township . . . . . . . . . . . . . . . 13 11 12 5 6 8 32 .57 32 .57 0 .4 0 .2
Kingsbury County . . . . . . . . . . . . . . . . 5,148 5,815 5,925 2,720 2,724 2,765 863 .76 832 .24 6 .2 3 .3 Arlington city (part) . . . . . . . . . . . . . . 907 987 902 487 471 440 1 .21 1 .21 749 .6 402 .5 Badger town . . . . . . . . . . . . . . . . . . . 107 144 114 57 66 53 1 .06 1 .06 100 .9 53 .8 Badger township . . . . . . . . . . . . . . . 199 227 240 89 94 99 58 .89 53 .26 3 .7 1 .7 Baker township . . . . . . . . . . . . . . . . 220 211 280 114 94 84 74 .56 69 .74 3 .2 1 .6 Bancroft town . . . . . . . . . . . . . . . . . . 19 37 30 13 15 19 0 .23 0 .23 82 .6 56 .5 Denver township . . . . . . . . . . . . . . . 196 250 245 97 105 110 66 .23 65 .18 3 .0 1 .5 De Smet city . . . . . . . . . . . . . . . . . . . 1,089 1,164 1,172 552 582 555 1 .16 1 .16 938 .8 475 .9 De Smet township . . . . . . . . . . . . . . 309 351 328 212 167 135 68 .46 62 .67 4 .9 3 .4 Erwin town . . . . . . . . . . . . . . . . . . . . 45 58 42 29 34 42 0 .48 0 .48 93 .8 60 .4 Esmond township . . . . . . . . . . . . . . . 61 63 57 26 29 32 78 .51 78 .51 0 .8 0 .3 Hartland township . . . . . . . . . . . . . . 132 145 183 67 65 78 63 .01 63 .01 2 .1 1 .1 Hetland town . . . . . . . . . . . . . . . . . . 46 43 53 24 21 33 0 .11 0 .11 418 .2 218 .2 Iroquois city (part) . . . . . . . . . . . . . . 200 241 271 106 106 126 0 .54 0 .54 370 .4 196 .3 Iroquois township . . . . . . . . . . . . . . . 71 64 64 26 25 23 41 .26 41 .18 1 .7 0 .6 Lake Preston city . . . . . . . . . . . . . . . 599 737 663 346 355 365 0 .76 0 .76 788 .2 455 .3 Le Sueur township . . . . . . . . . . . . . . 113 162 170 58 60 70 63 .30 63 .16 1 .8 0 .9 Manchester township . . . . . . . . . . . . 66 109 136 34 44 50 55 .67 55 .67 1 .2 0 .6 Mathews township . . . . . . . . . . . . . . 120 132 153 61 60 76 89 .91 84 .44 1 .4 0 .7

22 South Dakota Population and Housing Unit CountsU.S. Census Bureau, 2010 Census
Table 8. Population and Housing Units: 1990 to 2010; and Area Measurements and Density: 2010—Con.[For information concerning historical counts and geographic change, see “User Notes .” For information on confidentiality, nonsampling error, and definitions, see Appendixes]
StateCounty/County EquivalentCounty SubdivisionPlace
Population Housing units Area measurements in square miles
Average per square mile of land
2010 2000 1990 2010 2000 1990 Total area Land areaPopulation
densityHousing unit
density
South Dakota—Con .
Kingsbury County—Con . Oldham city . . . . . . . . . . . . . . . . . . . 133 206 189 98 106 119 0 .25 0 .25 532 .0 392 .0 Spirit Lake township . . . . . . . . . . . . . 130 157 167 70 68 74 63 .85 60 .47 2 .1 1 .2 Spring Lake township . . . . . . . . . . . . 290 208 327 92 98 111 81 .40 79 .63 3 .6 1 .2 Whitewood township . . . . . . . . . . . . 96 119 139 62 59 71 52 .91 49 .49 1 .9 1 .3
Lake County . . . . . . . . . . . . . . . . . . . . 11,200 11,276 10,550 5,559 5,282 5,148 575 .16 563 .28 19 .9 9 .9 Badus township . . . . . . . . . . . . . . . . 109 107 146 49 50 56 35 .51 35 .14 3 .1 1 .4 Chester township . . . . . . . . . . . . . . . 709 695 571 478 489 460 35 .94 33 .54 21 .1 14 .3 Brant Lake CDP . . . . . . . . . . . . . . 159 (X) (X) 251 (X) (X) 2 .73 1 .19 133 .6 210 .9 Chester CDP . . . . . . . . . . . . . . . . 261 (X) (X) 116 (X) (X) 0 .82 0 .82 318 .3 141 .5 Lake Madison CDP (part) . . . . . . . 2 (X) (X) 5 (X) (X) – – – – Clarno township . . . . . . . . . . . . . . . . 182 196 190 22 50 52 36 .14 36 .10 5 .0 0 .6 Concord township . . . . . . . . . . . . . . 112 128 125 50 50 54 36 .27 36 .27 3 .1 1 .4 Farmington township . . . . . . . . . . . . 171 205 188 86 81 78 35 .88 35 .88 4 .8 2 .4 Franklin township . . . . . . . . . . . . . . . 307 276 228 84 92 84 36 .05 35 .94 8 .5 2 .3 Herman township . . . . . . . . . . . . . . . 624 554 556 296 261 268 35 .54 32 .58 19 .2 9 .1 Lake View township . . . . . . . . . . . . . 732 666 468 593 516 510 31 .65 28 .63 25 .6 20 .7 Lake Madison CDP (part) . . . . . . . 471 (X) (X) 482 (X) (X) 5 .97 3 .24 145 .4 148 .8 Le Roy township . . . . . . . . . . . . . . . . 209 261 239 84 85 76 35 .97 35 .97 5 .8 2 .3 Madison city . . . . . . . . . . . . . . . . . . . 6,474 6,540 6,257 2,848 2,706 2,613 4 .61 4 .61 1,404 .3 617 .8 Nunda town . . . . . . . . . . . . . . . . . . . 43 47 45 24 27 28 1 .01 1 .01 42 .6 23 .8 Nunda township . . . . . . . . . . . . . . . . 113 113 103 41 43 46 34 .81 34 .53 3 .3 1 .2 Orland township . . . . . . . . . . . . . . . . 93 117 135 45 50 52 35 .97 35 .79 2 .6 1 .3 Ramona town . . . . . . . . . . . . . . . . . . 174 190 194 112 99 97 0 .27 0 .27 644 .4 414 .8 Rutland township . . . . . . . . . . . . . . . 182 205 213 74 77 80 35 .98 35 .86 5 .1 2 .1 Summit township . . . . . . . . . . . . . . . 166 208 186 79 74 78 35 .67 34 .96 4 .7 2 .3 Wayne township . . . . . . . . . . . . . . . . 89 98 124 43 43 48 35 .50 35 .50 2 .5 1 .2 Wentworth village . . . . . . . . . . . . . . . 171 188 181 86 90 87 0 .25 0 .25 684 .0 344 .0 Wentworth township . . . . . . . . . . . . . 396 306 213 393 321 291 35 .80 34 .14 11 .6 11 .5 Lake Madison CDP (part) . . . . . . . 210 (X) (X) 313 (X) (X) 3 .13 1 .51 139 .1 207 .3 Winfred township . . . . . . . . . . . . . . . 144 176 134 72 78 56 36 .36 36 .32 4 .0 2 .0 Winfred CDP . . . . . . . . . . . . . . . . . 52 (X) (X) 26 (X) (X) 1 .03 0 .99 52 .5 26 .3
Lawrence County . . . . . . . . . . . . . . . . . 24,097 21,802 20,655 12,756 10,427 9,092 800 .31 800 .04 30 .1 15 .9 Central City city . . . . . . . . . . . . . . . . 134 149 185 78 76 67 0 .15 0 .15 893 .3 520 .0 Deadwood city . . . . . . . . . . . . . . . . . 1,270 1,380 1,830 803 817 896 3 .83 3 .83 331 .6 209 .7 Lead city . . . . . . . . . . . . . . . . . . . . . . 3,124 3,027 3,632 1,694 1,617 1,654 2 .06 2 .06 1,516 .5 822 .3 North Lawrence UT . . . . . . . . . . . . . 5,792 5,303 4,741 2,926 2,283 1,922 319 .28 319 .13 18 .1 9 .2 North Spearfish CDP . . . . . . . . . . 2,221 2,306 2,274 948 914 853 3 .17 3 .17 700 .6 299 .1 St . Onge township . . . . . . . . . . . . . . 339 347 317 158 147 133 35 .82 35 .76 9 .5 4 .4 St . Onge CDP . . . . . . . . . . . . . . . . 191 (X) (X) 89 (X) (X) 1 .34 1 .34 142 .5 66 .4 South Lawrence UT . . . . . . . . . . . . . 2,017 2,146 2,093 1,660 1,227 1,177 422 .19 422 .13 4 .8 3 .9 Spearfish city . . . . . . . . . . . . . . . . . . 10,494 8,606 6,966 5,045 3,904 2,913 16 .34 16 .34 642 .2 308 .8 Whitewood city . . . . . . . . . . . . . . . . . 927 844 891 392 356 330 0 .64 0 .64 1,448 .4 612 .5
Lincoln County . . . . . . . . . . . . . . . . . . . 44,828 r 24,147 15,427 17,875 9,131 5,823 577 .75 577 .28 77 .7 31 .0 Beresford city (part) . . . . . . . . . . . . . 359 427 349 188 186 175 0 .48 0 .48 747 .9 391 .7 Brooklyn township . . . . . . . . . . . . . . 237 233 234 87 84 82 35 .93 35 .90 6 .6 2 .4 Canton city . . . . . . . . . . . . . . . . . . . . 3,057 3,110 2,787 1,351 1,286 1,180 3 .22 3 .19 958 .3 423 .5 Canton township . . . . . . . . . . . . . . . 526 456 423 196 159 149 38 .00 38 .00 13 .8 5 .2 Dayton township . . . . . . . . . . . . . . . . 707 591 460 262 212 168 44 .62 44 .60 15 .9 5 .9 Delapre township . . . . . . . . . . . . . . . 1,805 1,660 1,419 643 548 477 34 .42 34 .42 52 .4 18 .7 Delaware township . . . . . . . . . . . . . . 194 181 194 79 78 83 35 .88 35 .88 5 .4 2 .2 Eden township . . . . . . . . . . . . . . . . . 185 173 165 74 72 82 34 .85 34 .85 5 .3 2 .1 Fairview town . . . . . . . . . . . . . . . . . . 60 94 73 31 34 34 0 .09 0 .09 666 .7 344 .4 Fairview township . . . . . . . . . . . . . . . 192 166 145 62 54 49 18 .00 17 .84 10 .8 3 .5 Grant township . . . . . . . . . . . . . . . . . 354 376 337 146 141 121 35 .54 35 .54 10 .0 4 .1 Harrisburg city . . . . . . . . . . . . . . . . . 4,089 958 727 1,507 318 232 2 .48 2 .48 1,648 .8 607 .7 Highland township . . . . . . . . . . . . . . 320 287 254 125 107 107 36 .52 36 .50 8 .8 3 .4 Hudson town . . . . . . . . . . . . . . . . . . 296 402 332 150 162 156 0 .28 0 .28 1,057 .1 535 .7 La Valley township . . . . . . . . . . . . . . 550 484 410 214 178 145 34 .60 34 .60 15 .9 6 .2 Lennox city . . . . . . . . . . . . . . . . . . . . 2,111 2,037 1,767 914 836 718 1 .31 1 .31 1,611 .5 697 .7 Lincoln township . . . . . . . . . . . . . . . 184 205 221 85 84 97 35 .98 35 .97 5 .1 2 .4 Lynn township . . . . . . . . . . . . . . . . . 298 322 290 121 119 10 35 .40 35 .38 8 .4 3 .4 Norway township . . . . . . . . . . . . . . . 242 254 277 104 103 104 35 .89 35 .88 6 .7 2 .9 Perry township . . . . . . . . . . . . . . . . . 853 665 554 312 255 193 34 .71 34 .70 24 .6 9 .0 Pleasant township . . . . . . . . . . . . . . 323 280 382 112 113 122 35 .46 35 .45 9 .1 3 .2 Sioux Falls city (part) . . . . . . . . . . . . 21,095 r 6,636 1,409 8,700 2,514 473 11 .84 11 .84 1,781 .7 734 .8 Springdale township . . . . . . . . . . . . . 2,108 1,823 1,061 724 675 364 29 .98 29 .85 70 .6 24 .3 Shindler CDP . . . . . . . . . . . . . . . . 584 (X) (X) 184 (X) (X) 1 .50 1 .50 389 .3 122 .7 Tea city . . . . . . . . . . . . . . . . . . . . . . . 3,806 1,742 786 1,354 600 261 1 .69 1 .69 2,252 .1 801 .2 Worthing city . . . . . . . . . . . . . . . . . . 877 585 371 334 213 141 0 .56 0 .56 1,566 .1 596 .4

Population and Housing Unit Counts South Dakota 23U.S. Census Bureau, 2010 Census
Table 8. Population and Housing Units: 1990 to 2010; and Area Measurements and Density: 2010—Con.[For information concerning historical counts and geographic change, see “User Notes .” For information on confidentiality, nonsampling error, and definitions, see Appendixes]
StateCounty/County EquivalentCounty SubdivisionPlace
Population Housing units Area measurements in square miles
Average per square mile of land
2010 2000 1990 2010 2000 1990 Total area Land areaPopulation
densityHousing unit
density
South Dakota—Con .
Lyman County . . . . . . . . . . . . . . . . . . . 3,755 3,895 3,638 1,704 1,636 1,523 1,706 .67 1,641 .94 2 .3 1 .0 Bailey township . . . . . . . . . . . . . . . . 14 30 38 17 18 19 43 .44 43 .42 0 .3 0 .4 Black Dog UT . . . . . . . . . . . . . . . . . . 26 10 12 21 6 7 75 .20 75 .19 0 .3 0 .3 Central Lyman UT . . . . . . . . . . . . . . 105 (X) (X) 48 (X) (X) 189 .04 188 .05 0 .6 0 .3 East Lyman UT . . . . . . . . . . . . . . . . 148 (X) (X) 87 (X) (X) 136 .56 136 .17 1 .1 0 .6 Iona township . . . . . . . . . . . . . . . . . . 81 100 107 50 48 50 137 .79 127 .97 0 .6 0 .4 Kennebec town . . . . . . . . . . . . . . . . 240 286 284 146 152 147 0 .85 0 .85 282 .4 171 .8 Lower Brule UT . . . . . . . . . . . . . . . . 1,481 1,333 (X) 432 384 (X) 339 .99 299 .00 5 .0 1 .4 Lower Brule CDP . . . . . . . . . . . . . 613 599 655 188 182 182 0 .36 0 .36 1,702 .8 522 .2 Oacoma town . . . . . . . . . . . . . . . . . . 451 390 367 236 188 145 4 .18 2 .59 174 .1 91 .1 Oacoma township . . . . . . . . . . . . . . 71 124 59 38 52 27 68 .58 59 .87 1 .2 0 .6 Pleasant township . . . . . . . . . . . . . . 3 8 10 3 5 5 32 .87 32 .86 0 .1 0 .1 Pratt township . . . . . . . . . . . . . . . . . 16 17 14 9 6 7 25 .85 25 .54 0 .6 0 .4 Presho city . . . . . . . . . . . . . . . . . . . . 497 588 654 285 305 306 0 .67 0 .67 741 .8 425 .4 Reliance town . . . . . . . . . . . . . . . . . 191 206 169 85 92 84 1 .14 1 .09 175 .2 78 .0 Rex township . . . . . . . . . . . . . . . . . . 30 39 42 17 16 18 35 .89 35 .77 0 .8 0 .5 Rose township . . . . . . . . . . . . . . . . . 25 39 29 16 14 14 35 .73 35 .44 0 .7 0 .5 Vivian township . . . . . . . . . . . . . . . . 146 163 143 73 72 79 36 .09 36 .09 4 .0 2 .0 Vivian CDP . . . . . . . . . . . . . . . . . . 119 131 (X) 63 61 (X) 1 .73 1 .73 68 .8 36 .4 West Lyman UT . . . . . . . . . . . . . . . . 230 (X) (X) 141 (X) (X) 542 .79 541 .36 0 .4 0 .3
McCook County . . . . . . . . . . . . . . . . . . 5,618 5,832 5,668 2,491 2,383 2,371 576 .87 574 .20 9 .8 4 .3 Benton township . . . . . . . . . . . . . . . 106 123 111 44 44 46 35 .40 35 .16 3 .0 1 .3 Bridgewater city . . . . . . . . . . . . . . . . 492 607 533 254 266 265 1 .13 1 .13 435 .4 224 .8 Bridgewater township . . . . . . . . . . . . 127 152 173 58 55 57 34 .67 34 .56 3 .7 1 .7 Brookfield township . . . . . . . . . . . . . 133 164 141 58 57 57 36 .45 36 .45 3 .6 1 .6 Canistota city . . . . . . . . . . . . . . . . . . 656 700 608 281 275 268 0 .56 0 .56 1,171 .4 501 .8 Canistota township . . . . . . . . . . . . . . 161 142 132 63 57 52 35 .68 35 .65 4 .5 1 .8 Emery township . . . . . . . . . . . . . . . . 89 92 108 37 36 43 35 .97 35 .73 2 .5 1 .0 Grant township . . . . . . . . . . . . . . . . . 131 155 175 66 62 68 36 .11 36 .11 3 .6 1 .8 Greenland township . . . . . . . . . . . . . 251 202 183 110 79 63 35 .74 34 .74 7 .2 3 .2 Jefferson township . . . . . . . . . . . . . . 92 116 132 39 39 41 35 .76 35 .45 2 .6 1 .1 Montrose city . . . . . . . . . . . . . . . . . . 472 460 420 208 202 176 0 .41 0 .41 1,151 .2 507 .3 Montrose township . . . . . . . . . . . . . . 195 193 219 84 78 69 35 .44 35 .43 5 .5 2 .4 Pearl township . . . . . . . . . . . . . . . . . 39 72 100 33 37 46 36 .36 36 .35 1 .1 0 .9 Ramsey township . . . . . . . . . . . . . . . 229 190 136 43 49 51 36 .34 36 .07 6 .3 1 .2 Richland township . . . . . . . . . . . . . . 155 185 199 60 59 62 35 .93 35 .91 4 .3 1 .7 Salem city . . . . . . . . . . . . . . . . . . . . 1,347 1,371 1,289 667 640 581 1 .24 1 .24 1,086 .3 537 .9 Salem township . . . . . . . . . . . . . . . . 204 195 182 68 63 64 35 .05 34 .65 5 .9 2 .0 Spencer city . . . . . . . . . . . . . . . . . . . 154 157 317 77 73 162 0 .27 0 .27 570 .4 285 .2 Spring Valley township . . . . . . . . . . . 311 261 232 131 101 87 35 .79 35 .79 8 .7 3 .7 Sun Prairie township . . . . . . . . . . . . 148 152 152 56 57 57 36 .48 36 .48 4 .1 1 .5 Union township . . . . . . . . . . . . . . . . 126 143 146 54 54 56 36 .09 36 .07 3 .5 1 .5
McPherson County . . . . . . . . . . . . . . . 2,459 2,904 3,228 1,418 1,465 1,566 1,151 .54 1,136 .64 2 .2 1 .2 Carl township . . . . . . . . . . . . . . . . . . 34 41 43 14 14 18 35 .31 35 .28 1 .0 0 .4 Central McPherson UT . . . . . . . . . . 561 658 753 229 266 292 608 .46 598 .95 0 .9 0 .4 Eureka city . . . . . . . . . . . . . . . . . . . . 868 1,101 1,197 649 625 644 1 .00 0 .93 933 .3 697 .8 Hillsview town . . . . . . . . . . . . . . . . . 3 3 4 2 2 2 0 .64 0 .64 4 .7 3 .1 Hoffman township . . . . . . . . . . . . . . 25 18 23 10 10 9 35 .83 35 .31 0 .7 0 .3 Leola city . . . . . . . . . . . . . . . . . . . . . 457 462 521 258 268 300 0 .72 0 .71 643 .7 363 .4 Long Lake town . . . . . . . . . . . . . . . . 31 58 64 47 44 46 0 .28 0 .28 110 .7 167 .9 Wachter township . . . . . . . . . . . . . . . 30 37 39 17 18 17 34 .77 34 .47 0 .9 0 .5 Wacker township . . . . . . . . . . . . . . . 15 17 22 7 8 9 35 .79 34 .69 0 .4 0 .2 Weber township . . . . . . . . . . . . . . . . 156 130 93 6 26 21 36 .65 36 .51 4 .3 0 .2 West McPherson UT . . . . . . . . . . . . 271 367 457 176 177 199 361 .84 358 .63 0 .8 0 .5 Wetonka town . . . . . . . . . . . . . . . . . 8 12 12 3 7 9 0 .25 0 .25 32 .0 12 .0
Marshall County . . . . . . . . . . . . . . . . . . 4,656 4,576 4,844 2,534 2,562 2,640 886 .22 838 .07 5 .6 3 .0 Britton city . . . . . . . . . . . . . . . . . . . . 1,241 1,328 1,394 658 667 681 0 .73 0 .73 1,700 .0 901 .4 Buffalo township . . . . . . . . . . . . . . . . 114 108 111 167 129 136 36 .27 28 .54 4 .0 5 .9 Dayton township . . . . . . . . . . . . . . . . 19 30 36 12 14 17 35 .73 35 .32 0 .5 0 .3 Dumarce township . . . . . . . . . . . . . . 44 42 71 48 30 38 30 .46 27 .45 1 .6 1 .7 Eden town . . . . . . . . . . . . . . . . . . . . 89 97 97 63 61 68 0 .15 0 .15 593 .3 420 .0 Eden township . . . . . . . . . . . . . . . . . 85 91 110 44 39 43 35 .96 31 .34 2 .7 1 .4 Fort township . . . . . . . . . . . . . . . . . . 38 57 56 20 22 24 35 .85 29 .13 1 .3 0 .7 Hamilton township . . . . . . . . . . . . . . 27 28 43 25 17 19 35 .43 31 .18 0 .9 0 .8 Hickman township . . . . . . . . . . . . . . 45 86 83 27 39 37 35 .90 35 .83 1 .3 0 .8 La Belle township . . . . . . . . . . . . . . . 70 76 80 33 31 39 42 .44 41 .88 1 .7 0 .8 Lake township . . . . . . . . . . . . . . . . . 173 164 129 333 347 334 35 .96 27 .31 6 .3 12 .2 Lake City town . . . . . . . . . . . . . . . . . 51 47 43 29 26 28 0 .23 0 .22 231 .8 131 .8 Langford town . . . . . . . . . . . . . . . . . 313 290 298 164 163 162 0 .31 0 .31 1,009 .7 529 .0

24 South Dakota Population and Housing Unit CountsU.S. Census Bureau, 2010 Census
Table 8. Population and Housing Units: 1990 to 2010; and Area Measurements and Density: 2010—Con.[For information concerning historical counts and geographic change, see “User Notes .” For information on confidentiality, nonsampling error, and definitions, see Appendixes]
StateCounty/County EquivalentCounty SubdivisionPlace
Population Housing units Area measurements in square miles
Average per square mile of land
2010 2000 1990 2010 2000 1990 Total area Land areaPopulation
densityHousing unit
density
South Dakota—Con .
Marshall County—Con . Lowell township . . . . . . . . . . . . . . . . 50 77 81 27 29 31 36 .24 36 .14 1 .4 0 .7 McKinley township . . . . . . . . . . . . . . 46 52 57 23 24 33 35 .94 34 .39 1 .3 0 .7 Miller township . . . . . . . . . . . . . . . . . 219 242 209 100 97 82 35 .50 35 .02 6 .3 2 .9 Newark township . . . . . . . . . . . . . . . 109 55 85 23 21 29 35 .86 35 .74 3 .0 0 .6 Newport township . . . . . . . . . . . . . . 68 76 96 34 33 39 36 .14 35 .00 1 .9 1 .0 Nordland township . . . . . . . . . . . . . . 19 28 31 10 16 18 24 .21 23 .39 0 .8 0 .4 Pleasant Valley township . . . . . . . . . 168 177 143 78 72 62 35 .95 35 .77 4 .7 2 .2 Red Iron Lake township . . . . . . . . . . 201 179 229 126 151 166 35 .92 31 .13 6 .5 4 .0 Sisseton township . . . . . . . . . . . . . . 67 75 93 37 36 35 35 .98 34 .97 1 .9 1 .1 Stena township . . . . . . . . . . . . . . . . 192 179 142 24 47 42 36 .18 35 .96 5 .3 0 .7 Veblen city . . . . . . . . . . . . . . . . . . . . 531 281 321 174 167 172 0 .31 0 .31 1,712 .9 561 .3 Veblen township . . . . . . . . . . . . . . . . 196 181 236 75 71 77 47 .88 47 .73 4 .1 1 .6 Victor township . . . . . . . . . . . . . . . . . 37 38 49 16 18 25 38 .74 38 .46 1 .0 0 .4 Waverly township . . . . . . . . . . . . . . . 58 77 86 32 35 38 36 .07 35 .95 1 .6 0 .9 Weston township . . . . . . . . . . . . . . . 228 245 227 55 80 81 36 .14 35 .98 6 .3 1 .5 White township . . . . . . . . . . . . . . . . . 122 138 182 65 69 68 35 .93 35 .60 3 .4 1 .8 Kidder CDP . . . . . . . . . . . . . . . . . 57 (X) (X) 28 (X) (X) 0 .24 0 .24 237 .5 116 .7 Wismer township . . . . . . . . . . . . . . . 36 32 26 12 11 13 17 .83 17 .15 2 .1 0 .7
Meade County . . . . . . . . . . . . . . . . . . . 25,434 24,253 21,878 11,000 10,149 7,592 3,482 .85 3,470 .98 7 .3 3 .2 Belle Fourche-Cheyenne
Valleys UT . . . . . . . . . . . . . . . . . . . 1,839 5,860 5,804 850 2,503 1,331 1,585 .25 1,579 .39 1 .2 0 .5 Box Elder city (part) . . . . . . . . . . . . . 2,706 – (X) 958 – (X) 1 .34 1 .34 2,019 .4 714 .9 Dakota township . . . . . . . . . . . . . . . 29 30 (X) 21 21 (X) 115 .84 115 .13 0 .3 0 .2 Eagle township . . . . . . . . . . . . . . . . . 17 15 12 9 9 6 36 .43 36 .27 0 .5 0 .2 Elm Springs township . . . . . . . . . . . 27 (X) (X) 7 (X) (X) 21 .26 21 .26 1 .3 0 .3 Faith city . . . . . . . . . . . . . . . . . . . . . . 421 489 548 236 274 249 1 .20 1 .20 350 .8 196 .7 Howard township . . . . . . . . . . . . . . . 12 11 13 8 6 4 35 .17 34 .94 0 .3 0 .2 Lakeside township . . . . . . . . . . . . . . 53 59 50 33 26 17 80 .73 80 .73 0 .7 0 .4 North Meade UT . . . . . . . . . . . . . . . 418 396 447 209 192 188 993 .86 990 .29 0 .4 0 .2 Piedmont city . . . . . . . . . . . . . . . . . . 222 (X) (X) 110 (X) (X) 0 .29 0 .29 765 .5 379 .3 Smithville township . . . . . . . . . . . . . 12 35 3 6 9 1 41 .64 41 .57 0 .3 0 .1 Southwest Meade UT . . . . . . . . . . . 11,199 10,871 9,640 4,670 4,094 3,423 492 .41 491 .39 22 .8 9 .5 Blackhawk CDP . . . . . . . . . . . . . . 2,892 2,432 1,995 1,160 871 671 4 .88 4 .88 592 .6 237 .7 Blucksberg Mountain CDP . . . . . . 462 (X) (X) 205 (X) (X) 0 .67 0 .67 689 .6 306 .0 Sturgis city . . . . . . . . . . . . . . . . . . . . 6,627 6,442 5,330 3,154 2,989 2,358 3 .99 3 .99 1,660 .9 790 .5 Summerset city . . . . . . . . . . . . . . . . 1,814 (X) (X) 707 (X) (X) 2 .21 2 .21 820 .8 319 .9 Union township . . . . . . . . . . . . . . . . 16 16 15 9 7 5 35 .27 35 .06 0 .5 0 .3 Upper Red Owl township . . . . . . . . . 22 29 16 13 19 10 35 .96 35 .92 0 .6 0 .4
Mellette County . . . . . . . . . . . . . . . . . . 2,048 2,083 2,137 838 824 910 1,310 .87 1,307 .31 1 .6 0 .6 Bad Nation township . . . . . . . . . . . . 30 35 44 15 14 18 72 .29 72 .28 0 .4 0 .2 Blackpipe township . . . . . . . . . . . . . 60 61 52 25 25 27 36 .11 35 .99 1 .7 0 .7 Butte township . . . . . . . . . . . . . . . . . 2 4 2 2 3 1 36 .78 36 .65 0 .1 0 .1 Cedarbutte UT . . . . . . . . . . . . . . . . . 209 223 118 72 68 40 101 .17 101 .01 2 .1 0 .7 Corn Creek CDP . . . . . . . . . . . . . 105 (X) (X) 29 (X) (X) 2 .10 2 .04 51 .5 14 .2 Central Mellette UT . . . . . . . . . . . . . 687 662 694 246 222 237 445 .35 444 .60 1 .5 0 .6 Cody township . . . . . . . . . . . . . . . . . 33 25 43 16 15 24 73 .62 73 .59 0 .4 0 .2 Fairview township . . . . . . . . . . . . . . . 21 28 27 15 14 17 37 .32 37 .12 0 .6 0 .4 Mosher township . . . . . . . . . . . . . . . 24 44 27 15 15 23 36 .11 35 .93 0 .7 0 .4 New Surprise Valley township . . . . . 4 4 3 2 2 4 35 .67 35 .60 0 .1 0 .1 Norris township . . . . . . . . . . . . . . . . 189 193 171 64 74 68 21 .31 21 .26 8 .9 3 .0 Norris CDP . . . . . . . . . . . . . . . . . . 152 (X) (X) 47 (X) (X) 0 .87 0 .87 174 .7 54 .0 Prospect township . . . . . . . . . . . . . . 5 3 14 5 1 5 86 .14 85 .68 0 .1 0 .1 Red Fish township . . . . . . . . . . . . . . 16 18 32 10 11 12 43 .39 43 .31 0 .4 0 .2 Ring Thunder township . . . . . . . . . . 13 12 24 6 5 7 36 .33 36 .10 0 .4 0 .2 Riverside township . . . . . . . . . . . . . . 17 16 24 13 11 17 56 .06 55 .76 0 .3 0 .2 Rocky Ford township . . . . . . . . . . . . 6 9 16 3 4 6 50 .56 50 .22 0 .1 0 .1 Rosebud township . . . . . . . . . . . . . . 41 43 48 23 21 25 71 .84 71 .67 0 .6 0 .3 Running Bird township . . . . . . . . . . . 23 14 28 16 16 16 36 .08 36 .06 0 .6 0 .4 Surprise Valley township . . . . . . . . . 25 25 33 12 13 10 33 .95 33 .71 0 .7 0 .4 White River city . . . . . . . . . . . . . . . . 581 598 595 245 252 272 0 .52 0 .52 1,117 .3 471 .2 Wood town . . . . . . . . . . . . . . . . . . . . 62 66 73 33 38 48 0 .25 0 .25 248 .0 132 .0
Miner County . . . . . . . . . . . . . . . . . . . . 2,389 2,884 3,272 1,308 1,408 1,474 571 .93 570 .31 4 .2 2 .3 Adams township . . . . . . . . . . . . . . . . 120 125 143 52 47 55 35 .96 35 .96 3 .3 1 .4 Beaver township . . . . . . . . . . . . . . . . 40 50 78 17 25 31 36 .11 35 .46 1 .1 0 .5 Belleview township . . . . . . . . . . . . . . 70 84 100 35 37 40 35 .19 35 .19 2 .0 1 .0 Canova town . . . . . . . . . . . . . . . . . . 105 140 172 59 72 83 0 .31 0 .31 338 .7 190 .3 Canova township . . . . . . . . . . . . . . . 82 119 102 37 41 44 35 .74 35 .74 2 .3 1 .0 Carthage city . . . . . . . . . . . . . . . . . . 144 187 221 136 143 157 1 .49 1 .46 98 .6 93 .2
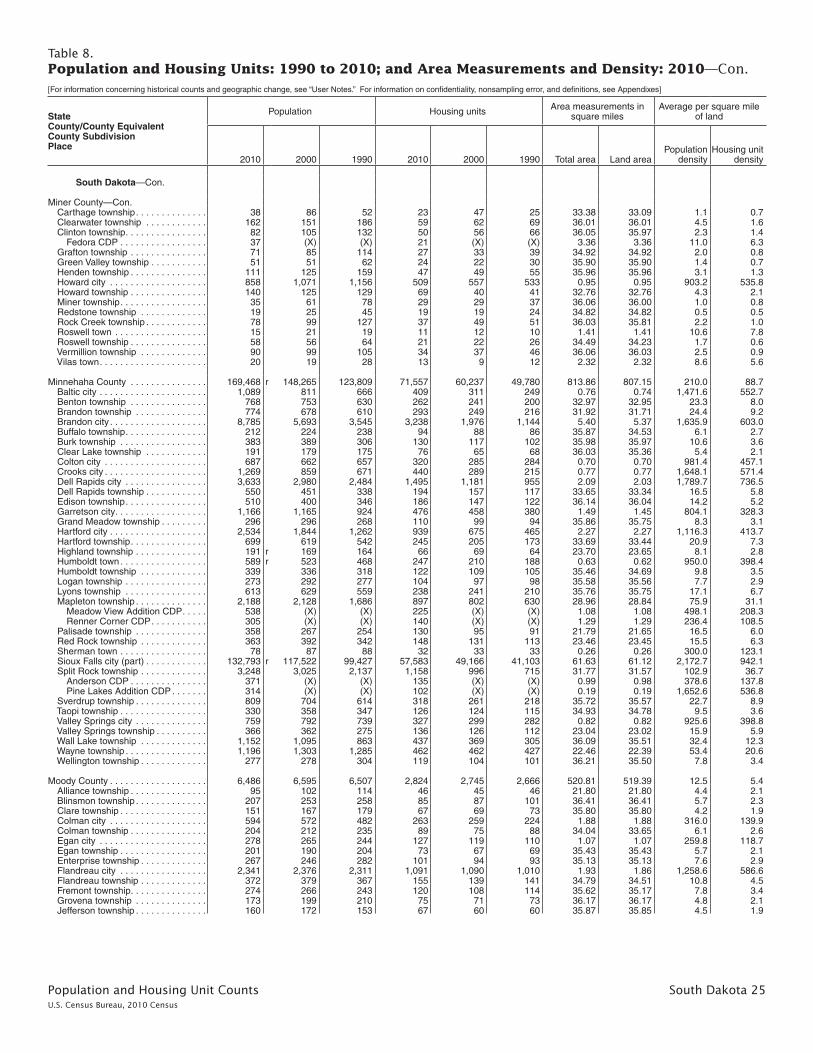
Population and Housing Unit Counts South Dakota 25U.S. Census Bureau, 2010 Census
Table 8. Population and Housing Units: 1990 to 2010; and Area Measurements and Density: 2010—Con.[For information concerning historical counts and geographic change, see “User Notes .” For information on confidentiality, nonsampling error, and definitions, see Appendixes]
StateCounty/County EquivalentCounty SubdivisionPlace
Population Housing units Area measurements in square miles
Average per square mile of land
2010 2000 1990 2010 2000 1990 Total area Land areaPopulation
densityHousing unit
density
South Dakota—Con .
Miner County—Con . Carthage township . . . . . . . . . . . . . . 38 86 52 23 47 25 33 .38 33 .09 1 .1 0 .7 Clearwater township . . . . . . . . . . . . 162 151 186 59 62 69 36 .01 36 .01 4 .5 1 .6 Clinton township . . . . . . . . . . . . . . . . 82 105 132 50 56 66 36 .05 35 .97 2 .3 1 .4 Fedora CDP . . . . . . . . . . . . . . . . . 37 (X) (X) 21 (X) (X) 3 .36 3 .36 11 .0 6 .3 Grafton township . . . . . . . . . . . . . . . 71 85 114 27 33 39 34 .92 34 .92 2 .0 0 .8 Green Valley township . . . . . . . . . . . 51 51 62 24 22 30 35 .90 35 .90 1 .4 0 .7 Henden township . . . . . . . . . . . . . . . 111 125 159 47 49 55 35 .96 35 .96 3 .1 1 .3 Howard city . . . . . . . . . . . . . . . . . . . 858 1,071 1,156 509 557 533 0 .95 0 .95 903 .2 535 .8 Howard township . . . . . . . . . . . . . . . 140 125 129 69 40 41 32 .76 32 .76 4 .3 2 .1 Miner township . . . . . . . . . . . . . . . . . 35 61 78 29 29 37 36 .06 36 .00 1 .0 0 .8 Redstone township . . . . . . . . . . . . . 19 25 45 19 19 24 34 .82 34 .82 0 .5 0 .5 Rock Creek township . . . . . . . . . . . . 78 99 127 37 49 51 36 .03 35 .81 2 .2 1 .0 Roswell town . . . . . . . . . . . . . . . . . . 15 21 19 11 12 10 1 .41 1 .41 10 .6 7 .8 Roswell township . . . . . . . . . . . . . . . 58 56 64 21 22 26 34 .49 34 .23 1 .7 0 .6 Vermillion township . . . . . . . . . . . . . 90 99 105 34 37 46 36 .06 36 .03 2 .5 0 .9 Vilas town . . . . . . . . . . . . . . . . . . . . . 20 19 28 13 9 12 2 .32 2 .32 8 .6 5 .6
Minnehaha County . . . . . . . . . . . . . . . 169,468 r 148,265 123,809 71,557 60,237 49,780 813 .86 807 .15 210 .0 88 .7 Baltic city . . . . . . . . . . . . . . . . . . . . . 1,089 811 666 409 311 249 0 .76 0 .74 1,471 .6 552 .7 Benton township . . . . . . . . . . . . . . . 768 753 630 262 241 200 32 .97 32 .95 23 .3 8 .0 Brandon township . . . . . . . . . . . . . . 774 678 610 293 249 216 31 .92 31 .71 24 .4 9 .2 Brandon city . . . . . . . . . . . . . . . . . . . 8,785 5,693 3,545 3,238 1,976 1,144 5 .40 5 .37 1,635 .9 603 .0 Buffalo township . . . . . . . . . . . . . . . . 212 224 238 94 88 86 35 .87 34 .53 6 .1 2 .7 Burk township . . . . . . . . . . . . . . . . . 383 389 306 130 117 102 35 .98 35 .97 10 .6 3 .6 Clear Lake township . . . . . . . . . . . . 191 179 175 76 65 68 36 .03 35 .36 5 .4 2 .1 Colton city . . . . . . . . . . . . . . . . . . . . 687 662 657 320 285 284 0 .70 0 .70 981 .4 457 .1 Crooks city . . . . . . . . . . . . . . . . . . . . 1,269 859 671 440 289 215 0 .77 0 .77 1,648 .1 571 .4 Dell Rapids city . . . . . . . . . . . . . . . . 3,633 2,980 2,484 1,495 1,181 955 2 .09 2 .03 1,789 .7 736 .5 Dell Rapids township . . . . . . . . . . . . 550 451 338 194 157 117 33 .65 33 .34 16 .5 5 .8 Edison township . . . . . . . . . . . . . . . . 510 400 346 186 147 122 36 .14 36 .04 14 .2 5 .2 Garretson city . . . . . . . . . . . . . . . . . . 1,166 1,165 924 476 458 380 1 .49 1 .45 804 .1 328 .3 Grand Meadow township . . . . . . . . . 296 296 268 110 99 94 35 .86 35 .75 8 .3 3 .1 Hartford city . . . . . . . . . . . . . . . . . . . 2,534 1,844 1,262 939 675 465 2 .27 2 .27 1,116 .3 413 .7 Hartford township . . . . . . . . . . . . . . . 699 619 542 245 205 173 33 .69 33 .44 20 .9 7 .3 Highland township . . . . . . . . . . . . . . 191 r 169 164 66 69 64 23 .70 23 .65 8 .1 2 .8 Humboldt town . . . . . . . . . . . . . . . . . 589 r 523 468 247 210 188 0 .63 0 .62 950 .0 398 .4 Humboldt township . . . . . . . . . . . . . 339 336 318 122 109 105 35 .46 34 .69 9 .8 3 .5 Logan township . . . . . . . . . . . . . . . . 273 292 277 104 97 98 35 .58 35 .56 7 .7 2 .9 Lyons township . . . . . . . . . . . . . . . . 613 629 559 238 241 210 35 .76 35 .75 17 .1 6 .7 Mapleton township . . . . . . . . . . . . . . 2,188 2,128 1,686 897 802 630 28 .96 28 .84 75 .9 31 .1 Meadow View Addition CDP . . . . . 538 (X) (X) 225 (X) (X) 1 .08 1 .08 498 .1 208 .3 Renner Corner CDP . . . . . . . . . . . 305 (X) (X) 140 (X) (X) 1 .29 1 .29 236 .4 108 .5 Palisade township . . . . . . . . . . . . . . 358 267 254 130 95 91 21 .79 21 .65 16 .5 6 .0 Red Rock township . . . . . . . . . . . . . 363 392 342 148 131 113 23 .46 23 .45 15 .5 6 .3 Sherman town . . . . . . . . . . . . . . . . . 78 87 88 32 33 33 0 .26 0 .26 300 .0 123 .1 Sioux Falls city (part) . . . . . . . . . . . . 132,793 r 117,522 99,427 57,583 49,166 41,103 61 .63 61 .12 2,172 .7 942 .1 Split Rock township . . . . . . . . . . . . . 3,248 3,025 2,137 1,158 996 715 31 .77 31 .57 102 .9 36 .7 Anderson CDP . . . . . . . . . . . . . . . 371 (X) (X) 135 (X) (X) 0 .99 0 .98 378 .6 137 .8 Pine Lakes Addition CDP . . . . . . . 314 (X) (X) 102 (X) (X) 0 .19 0 .19 1,652 .6 536 .8 Sverdrup township . . . . . . . . . . . . . . 809 704 614 318 261 218 35 .72 35 .57 22 .7 8 .9 Taopi township . . . . . . . . . . . . . . . . . 330 358 347 126 124 115 34 .93 34 .78 9 .5 3 .6 Valley Springs city . . . . . . . . . . . . . . 759 792 739 327 299 282 0 .82 0 .82 925 .6 398 .8 Valley Springs township . . . . . . . . . . 366 362 275 136 126 112 23 .04 23 .02 15 .9 5 .9 Wall Lake township . . . . . . . . . . . . . 1,152 1,095 863 437 369 305 36 .09 35 .51 32 .4 12 .3 Wayne township . . . . . . . . . . . . . . . . 1,196 1,303 1,285 462 462 427 22 .46 22 .39 53 .4 20 .6 Wellington township . . . . . . . . . . . . . 277 278 304 119 104 101 36 .21 35 .50 7 .8 3 .4
Moody County . . . . . . . . . . . . . . . . . . . 6,486 6,595 6,507 2,824 2,745 2,666 520 .81 519 .39 12 .5 5 .4 Alliance township . . . . . . . . . . . . . . . 95 102 114 46 45 46 21 .80 21 .80 4 .4 2 .1 Blinsmon township . . . . . . . . . . . . . . 207 253 258 85 87 101 36 .41 36 .41 5 .7 2 .3 Clare township . . . . . . . . . . . . . . . . . 151 167 179 67 69 73 35 .80 35 .80 4 .2 1 .9 Colman city . . . . . . . . . . . . . . . . . . . 594 572 482 263 259 224 1 .88 1 .88 316 .0 139 .9 Colman township . . . . . . . . . . . . . . . 204 212 235 89 75 88 34 .04 33 .65 6 .1 2 .6 Egan city . . . . . . . . . . . . . . . . . . . . . 278 265 244 127 119 110 1 .07 1 .07 259 .8 118 .7 Egan township . . . . . . . . . . . . . . . . . 201 190 204 73 67 69 35 .43 35 .43 5 .7 2 .1 Enterprise township . . . . . . . . . . . . . 267 246 282 101 94 93 35 .13 35 .13 7 .6 2 .9 Flandreau city . . . . . . . . . . . . . . . . . 2,341 2,376 2,311 1,091 1,090 1,010 1 .93 1 .86 1,258 .6 586 .6 Flandreau township . . . . . . . . . . . . . 372 379 367 155 139 141 34 .79 34 .51 10 .8 4 .5 Fremont township . . . . . . . . . . . . . . . 274 266 243 120 108 114 35 .62 35 .17 7 .8 3 .4 Grovena township . . . . . . . . . . . . . . 173 199 210 75 71 73 36 .17 36 .17 4 .8 2 .1 Jefferson township . . . . . . . . . . . . . . 160 172 153 67 60 60 35 .87 35 .85 4 .5 1 .9

26 South Dakota Population and Housing Unit CountsU.S. Census Bureau, 2010 Census
Table 8. Population and Housing Units: 1990 to 2010; and Area Measurements and Density: 2010—Con.[For information concerning historical counts and geographic change, see “User Notes .” For information on confidentiality, nonsampling error, and definitions, see Appendixes]
StateCounty/County EquivalentCounty SubdivisionPlace
Population Housing units Area measurements in square miles
Average per square mile of land
2010 2000 1990 2010 2000 1990 Total area Land areaPopulation
densityHousing unit
density
South Dakota—Con .
Moody County—Con . Lone Rock township . . . . . . . . . . . . . 99 79 99 39 33 42 21 .95 21 .95 4 .5 1 .8 Lynn township . . . . . . . . . . . . . . . . . 287 262 296 109 94 93 36 .08 35 .91 8 .0 3 .0 Riverview township . . . . . . . . . . . . . 130 173 190 65 66 71 35 .85 35 .83 3 .6 1 .8 Spring Creek township . . . . . . . . . . . 125 140 146 55 56 52 35 .36 35 .35 3 .5 1 .6 Trent town . . . . . . . . . . . . . . . . . . . . . 232 254 211 113 111 97 1 .04 1 .04 223 .1 108 .7 Union township . . . . . . . . . . . . . . . . 182 174 163 38 55 53 22 .44 22 .43 8 .1 1 .7 Ward town . . . . . . . . . . . . . . . . . . . . 48 41 35 21 22 22 0 .29 0 .29 165 .5 72 .4 Ward township . . . . . . . . . . . . . . . . . 66 73 85 25 25 34 21 .85 21 .85 3 .0 1 .1
Pennington County . . . . . . . . . . . . . . . 100,948 88,565 81,343 44,949 37,249 33,741 2,784 .26 2,776 .55 36 .4 16 .2 Ash township . . . . . . . . . . . . . . . . . . 20 28 (X) 17 15 (X) 43 .95 43 .83 0 .5 0 .4 Box Elder city (part) . . . . . . . . . . . . . 5,094 2,841 2,680 1,870 1,072 1,050 12 .58 12 .56 405 .6 148 .9 Castle Butte township . . . . . . . . . . . 28 37 39 13 12 12 51 .28 51 .02 0 .5 0 .3 Cedar Butte township . . . . . . . . . . . . 42 42 50 23 22 22 35 .53 35 .43 1 .2 0 .6 Central Pennington UT . . . . . . . . . . . 13,643 r 13,376 14,435 5,432 r 4,970 5,357 74 .69 74 .66 182 .7 72 .8 Ashland Heights CDP . . . . . . . . . . 754 837 (X) 351 355 (X) 2 .92 2 .92 258 .2 120 .2 Colonial Pine Hills CDP (part) . . . 795 879 576 296 315 211 9 .44 9 .44 84 .2 31 .4 Green Valley CDP . . . . . . . . . . . . 928 768 (X) 389 321 (X) 3 .84 3 .84 241 .7 101 .3 Rapid Valley CDP . . . . . . . . . . . . . 8,260 7,043 5,968 3,101 2,493 2,094 7 .44 7 .44 1,110 .2 416 .8 Conata township . . . . . . . . . . . . . . . 7 11 6 3 5 7 89 .65 89 .36 0 .1 – Crooked Creek township . . . . . . . . . 29 29 33 10 12 15 71 .38 71 .12 0 .4 0 .1 Dalzell Canyon UT . . . . . . . . . . . . . . 5 8 4 4 5 8 33 .25 33 .25 0 .2 0 .1 East Central Pennington UT . . . . . . 384 358 266 168 131 118 381 .53 381 .05 1 .0 0 .4 Fairview township . . . . . . . . . . . . . . . 54 33 22 21 14 9 34 .59 34 .42 1 .6 0 .6 Flat Butte township . . . . . . . . . . . . . 12 26 12 5 8 4 35 .76 35 .47 0 .3 0 .1 Hill City city . . . . . . . . . . . . . . . . . . . 948 780 650 473 340 324 1 .27 1 .26 752 .4 375 .4 Huron township . . . . . . . . . . . . . . . . 32 33 52 17 16 17 35 .82 35 .62 0 .9 0 .5 Imlay township . . . . . . . . . . . . . . . . . 7 20 14 5 7 5 110 .44 110 .36 0 .1 – Keystone town . . . . . . . . . . . . . . . . . 337 311 232 230 209 137 2 .86 2 .86 117 .8 80 .4 Lake Creek township . . . . . . . . . . . . 43 47 (X) 20 23 (X) 35 .90 35 .86 1 .2 0 .6 Lake Flat township . . . . . . . . . . . . . . 35 30 30 18 16 14 35 .31 34 .89 1 .0 0 .5 Lake Hill township . . . . . . . . . . . . . . 52 48 17 17 15 8 35 .42 35 .12 1 .5 0 .5 Mount Rushmore UT . . . . . . . . . . . . 6,802 6,361 4,197 3,118 2,734 1,884 220 .58 219 .92 30 .9 14 .2 Colonial Pine Hills CDP (part) . . . 1,698 1,682 977 607 552 329 6 .44 6 .44 263 .7 94 .3 Johnson Siding CDP . . . . . . . . . . 659 (X) (X) 337 (X) (X) 3 .73 3 .73 176 .7 90 .3 New Underwood city . . . . . . . . . . . . 660 616 553 280 265 232 1 .01 1 .01 653 .5 277 .2 Northeast Pennington UT . . . . . . . . 29 38 38 18 21 24 125 .56 125 .06 0 .2 0 .1 Owanka township . . . . . . . . . . . . . . . 28 36 50 18 17 20 50 .71 50 .71 0 .6 0 .4 Peno township . . . . . . . . . . . . . . . . . 21 41 37 12 13 17 35 .90 35 .77 0 .6 0 .3 Quinn town . . . . . . . . . . . . . . . . . . . . 54 44 72 27 23 35 1 .16 1 .16 46 .6 23 .3 Quinn township . . . . . . . . . . . . . . . . 12 14 11 4 5 3 34 .49 34 .26 0 .4 0 .1 Rainy Creek/Cheyenne township . . . 27 36 (X) 16 19 (X) 91 .81 91 .28 0 .3 0 .2 Rapid City city . . . . . . . . . . . . . . . . . 67,956 r 59,573 54,523 30,254 r 25,085 22,530 55 .49 55 .41 1,226 .4 546 .0 Rapid City East UT . . . . . . . . . . . . . 1,988 r 1,159 887 786 r 454 354 271 .54 271 .21 7 .3 2 .9 Scenic township . . . . . . . . . . . . . . . . 58 87 71 30 48 36 134 .21 134 .05 0 .4 0 .2 Shyne township . . . . . . . . . . . . . . . . 19 22 20 8 9 11 26 .99 26 .89 0 .7 0 .3 Sunnyside township . . . . . . . . . . . . . 16 13 22 7 4 16 38 .92 38 .86 0 .4 0 .2 Wall town . . . . . . . . . . . . . . . . . . . . . 766 818 834 436 438 421 2 .21 2 .17 353 .0 200 .9 Wasta town . . . . . . . . . . . . . . . . . . . . 80 75 82 46 46 43 0 .19 0 .19 421 .1 242 .1 Wasta township . . . . . . . . . . . . . . . . 13 21 13 10 13 7 35 .79 35 .78 0 .4 0 .3 West Pennington UT . . . . . . . . . . . . 1,647 1,553 1,276 1,533 1,163 933 536 .51 534 .67 3 .1 2 .9
Perkins County . . . . . . . . . . . . . . . . . . 2,982 3,363 3,932 1,739 1,854 2,007 2,889 .99 2,870 .48 1 .0 0 .6 Ada township . . . . . . . . . . . . . . . . . . 15 23 27 12 14 13 35 .66 35 .45 0 .4 0 .3 Anderson township . . . . . . . . . . . . . 18 30 30 24 25 24 35 .37 31 .82 0 .6 0 .8 Antelope township . . . . . . . . . . . . . . 35 22 28 14 11 14 35 .79 35 .63 1 .0 0 .4 Barrett township . . . . . . . . . . . . . . . . 13 11 16 13 10 9 36 .07 35 .90 0 .4 0 .4 Beck-Highland township . . . . . . . . . 13 (X) (X) 13 (X) (X) 71 .96 71 .81 0 .2 0 .2 Bison town . . . . . . . . . . . . . . . . . . . . 333 373 451 180 227 237 0 .99 0 .99 336 .4 181 .8 Bison township . . . . . . . . . . . . . . . . . 24 34 35 13 15 19 34 .96 34 .63 0 .7 0 .4 Burdick township . . . . . . . . . . . . . . . 23 29 38 17 16 18 36 .14 36 .05 0 .6 0 .5 Cash township . . . . . . . . . . . . . . . . . 14 17 27 11 11 12 35 .72 35 .65 0 .4 0 .3 Castle Butte township . . . . . . . . . . . 19 32 24 10 10 12 51 .86 51 .81 0 .4 0 .2 Chance township . . . . . . . . . . . . . . . 40 40 41 18 20 19 71 .62 71 .27 0 .6 0 .3 Chaudoin township . . . . . . . . . . . . . 18 14 12 8 7 7 36 .12 36 .05 0 .5 0 .2 Clark township . . . . . . . . . . . . . . . . . 10 16 27 8 11 14 35 .99 35 .83 0 .3 0 .2 De Witt township . . . . . . . . . . . . . . . 42 54 54 23 26 31 56 .95 56 .34 0 .7 0 .4 Duck Creek UT . . . . . . . . . . . . . . . . 14 18 29 11 14 17 36 .03 35 .95 0 .4 0 .3

Population and Housing Unit Counts South Dakota 27U.S. Census Bureau, 2010 Census
Table 8. Population and Housing Units: 1990 to 2010; and Area Measurements and Density: 2010—Con.[For information concerning historical counts and geographic change, see “User Notes .” For information on confidentiality, nonsampling error, and definitions, see Appendixes]
StateCounty/County EquivalentCounty SubdivisionPlace
Population Housing units Area measurements in square miles
Average per square mile of land
2010 2000 1990 2010 2000 1990 Total area Land areaPopulation
densityHousing unit
density
South Dakota—Con .
Perkins County—Con . Duell township . . . . . . . . . . . . . . . . . 15 26 19 8 9 10 35 .50 35 .37 0 .4 0 .2 Englewood township . . . . . . . . . . . . 24 14 8 10 7 4 64 .93 64 .78 0 .4 0 .2 Flat Creek township . . . . . . . . . . . . . 15 19 12 8 8 9 36 .04 35 .94 0 .4 0 .2 Foster township . . . . . . . . . . . . . . . . 30 24 22 11 11 8 64 .44 64 .32 0 .5 0 .2 Fredlund township . . . . . . . . . . . . . . 23 29 48 17 13 16 35 .45 35 .33 0 .7 0 .5 Glendo township . . . . . . . . . . . . . . . 14 13 16 5 5 8 35 .25 35 .23 0 .4 0 .1 Grand River township . . . . . . . . . . . . 17 18 35 11 10 15 51 .91 51 .73 0 .3 0 .2 Hall township . . . . . . . . . . . . . . . . . . 18 19 19 8 8 7 35 .60 35 .54 0 .5 0 .2 Horse Creek township . . . . . . . . . . . 40 37 48 20 22 26 52 .02 51 .98 0 .8 0 .4 Jones UT . . . . . . . . . . . . . . . . . . . . . 6 11 23 7 7 12 35 .74 35 .33 0 .2 0 .2 Lemmon city . . . . . . . . . . . . . . . . . . . 1,227 1,398 1,614 732 776 813 1 .04 1 .04 1,179 .8 703 .8 Liberty township . . . . . . . . . . . . . . . . 13 17 23 8 8 8 35 .87 35 .81 0 .4 0 .2 Lincoln township . . . . . . . . . . . . . . . 164 174 166 71 72 77 81 .31 81 .23 2 .0 0 .9 Lodgepole township . . . . . . . . . . . . . 34 42 51 21 21 22 36 .04 36 .00 0 .9 0 .6 Lone Tree township . . . . . . . . . . . . . 19 33 44 15 16 16 36 .09 35 .68 0 .5 0 .4 Maltby township . . . . . . . . . . . . . . . . 13 10 9 8 7 6 36 .07 35 .92 0 .4 0 .2 Marshfield township . . . . . . . . . . . . . 30 31 29 11 12 14 71 .79 71 .55 0 .4 0 .2 Martin township . . . . . . . . . . . . . . . . 2 7 9 2 2 2 36 .18 36 .14 0 .1 0 .1 Meadow township . . . . . . . . . . . . . . 48 35 45 22 24 26 35 .84 35 .58 1 .3 0 .6 Moreau township . . . . . . . . . . . . . . . 20 18 16 10 10 6 72 .04 72 .02 0 .3 0 .1 Northeast Perkins UT . . . . . . . . . . . . 101 (X) (X) 95 (X) (X) 279 .74 273 .04 0 .4 0 .3 Plateau township . . . . . . . . . . . . . . . 11 16 21 7 9 9 36 .06 35 .69 0 .3 0 .2 Pleasant Valley UT . . . . . . . . . . . . . . – 3 (X) 1 2 (X) 35 .53 35 .47 – – Rainbow township . . . . . . . . . . . . . . 42 31 34 16 15 17 35 .89 35 .34 1 .2 0 .5 Richland UT . . . . . . . . . . . . . . . . . . . 12 17 28 12 10 18 35 .91 35 .76 0 .3 0 .3 Rockford township . . . . . . . . . . . . . . 21 21 28 12 10 13 35 .50 35 .46 0 .6 0 .3 Scotch Cap township . . . . . . . . . . . . 29 34 41 13 16 18 35 .88 35 .40 0 .8 0 .4 Sidney township . . . . . . . . . . . . . . . . 9 14 32 9 8 13 35 .64 35 .61 0 .3 0 .3 South Perkins UT . . . . . . . . . . . . . . . 176 133 124 92 58 59 524 .85 524 .02 0 .3 0 .2 Strool township . . . . . . . . . . . . . . . . 51 60 81 33 32 41 35 .95 35 .11 1 .5 0 .9 Prairie City CDP . . . . . . . . . . . . . . 23 (X) (X) 14 (X) (X) 1 .47 1 .42 16 .2 9 .9 Trail township . . . . . . . . . . . . . . . . . . 20 33 40 13 13 24 16 .06 16 .06 1 .2 0 .8 Vail township . . . . . . . . . . . . . . . . . . 10 11 14 5 6 6 35 .85 35 .76 0 .3 0 .1 Vickers township . . . . . . . . . . . . . . . 18 21 21 7 8 11 36 .09 36 .01 0 .5 0 .2 Viking township . . . . . . . . . . . . . . . . 12 8 13 6 8 8 51 .88 51 .78 0 .2 0 .1 Vrooman township . . . . . . . . . . . . . . 8 11 9 3 3 4 35 .64 35 .58 0 .2 0 .1 Wells township . . . . . . . . . . . . . . . . . 10 19 17 7 7 8 35 .14 34 .87 0 .3 0 .2 White Butte township . . . . . . . . . . . . 19 23 38 11 11 21 16 .03 16 .00 1 .2 0 .7 White Hill UT . . . . . . . . . . . . . . . . . . 6 4 8 4 4 9 35 .87 35 .76 0 .2 0 .1 Wilson township . . . . . . . . . . . . . . . . 24 25 40 13 17 17 36 .08 36 .04 0 .7 0 .4
Potter County . . . . . . . . . . . . . . . . . . . . 2,329 2,693 3,190 1,500 1,760 1,664 898 .67 861 .14 2 .7 1 .7 Central Potter UT . . . . . . . . . . . . . . . 235 237 319 109 127 137 264 .82 261 .61 0 .9 0 .4 East Potter UT . . . . . . . . . . . . . . . . . 235 269 419 122 155 155 307 .29 304 .55 0 .8 0 .4 Gettysburg city . . . . . . . . . . . . . . . . . 1,162 1,352 1,510 617 683 680 1 .89 1 .89 614 .8 326 .5 Hoven town . . . . . . . . . . . . . . . . . . . 406 511 522 221 245 236 0 .31 0 .31 1,309 .7 712 .9 Lebanon town . . . . . . . . . . . . . . . . . 47 86 115 40 54 59 0 .53 0 .53 88 .7 75 .5 Tolstoy town . . . . . . . . . . . . . . . . . . . 36 64 69 31 47 46 0 .18 0 .18 200 .0 172 .2 West Potter UT . . . . . . . . . . . . . . . . . 208 174 236 360 449 351 323 .65 292 .07 0 .7 1 .2
Roberts County . . . . . . . . . . . . . . . . . . 10,149 10,016 9,914 4,905 4,734 4,728 1,135 .77 1,101 .04 9 .2 4 .5 Agency township . . . . . . . . . . . . . . . 323 277 315 112 98 99 36 .06 36 .00 9 .0 3 .1 Alto township . . . . . . . . . . . . . . . . . . 66 77 83 28 27 31 36 .08 34 .93 1 .9 0 .8 Becker township . . . . . . . . . . . . . . . . 109 115 141 60 53 54 29 .80 28 .48 3 .8 2 .1 Bossko township . . . . . . . . . . . . . . . 44 65 82 32 32 40 36 .02 36 .02 1 .2 0 .9 Bryant township . . . . . . . . . . . . . . . . 318 265 197 184 167 144 27 .43 21 .38 14 .9 8 .6 Claire City town . . . . . . . . . . . . . . . . 76 85 85 39 42 44 0 .18 0 .18 422 .2 216 .7 Corona town . . . . . . . . . . . . . . . . . . . 109 112 118 61 63 63 0 .25 0 .25 436 .0 244 .0 Dry Wood Lake township . . . . . . . . . 129 126 124 52 43 44 36 .20 31 .62 4 .1 1 .6 Easter township . . . . . . . . . . . . . . . . 152 143 184 74 66 80 33 .93 33 .37 4 .6 2 .2 Enterprise township . . . . . . . . . . . . . 101 101 120 47 49 52 35 .99 35 .81 2 .8 1 .3 Garfield township . . . . . . . . . . . . . . . 146 166 187 72 72 70 35 .12 34 .96 4 .2 2 .1 Geneseo township . . . . . . . . . . . . . . 271 275 216 299 253 262 35 .08 33 .69 8 .0 8 .9 Goodwill township . . . . . . . . . . . . . . 844 695 713 244 209 208 36 .27 36 .23 23 .3 6 .7 Agency Village CDP . . . . . . . . . . . 181 (X) (X) 44 (X) (X) 5 .71 5 .71 31 .7 7 .7 Goodwill CDP . . . . . . . . . . . . . . . . 513 (X) (X) 141 (X) (X) 0 .77 0 .76 675 .0 185 .5 Grant township . . . . . . . . . . . . . . . . . 194 158 176 74 67 67 36 .11 35 .76 5 .4 2 .1 Harmon township . . . . . . . . . . . . . . . 151 191 230 83 84 101 65 .50 61 .50 2 .5 1 .3 Hart township . . . . . . . . . . . . . . . . . . 97 108 111 46 48 50 36 .27 35 .88 2 .7 1 .3 Lake township . . . . . . . . . . . . . . . . . 249 226 170 253 238 238 39 .73 36 .83 6 .8 6 .9 Lawrence township . . . . . . . . . . . . . 260 263 170 76 69 64 22 .22 22 .21 11 .7 3 .4

28 South Dakota Population and Housing Unit CountsU.S. Census Bureau, 2010 Census
Table 8. Population and Housing Units: 1990 to 2010; and Area Measurements and Density: 2010—Con.[For information concerning historical counts and geographic change, see “User Notes .” For information on confidentiality, nonsampling error, and definitions, see Appendixes]
StateCounty/County EquivalentCounty SubdivisionPlace
Population Housing units Area measurements in square miles
Average per square mile of land
2010 2000 1990 2010 2000 1990 Total area Land areaPopulation
densityHousing unit
density
South Dakota—Con .
Roberts County—Con . Lee township . . . . . . . . . . . . . . . . . . 62 95 136 41 44 49 28 .26 28 .14 2 .2 1 .5 Lien township . . . . . . . . . . . . . . . . . . 122 165 172 58 66 65 47 .98 47 .47 2 .6 1 .2 Lockwood township . . . . . . . . . . . . . 304 277 185 326 355 260 25 .63 21 .61 14 .1 15 .1 Long Hollow township . . . . . . . . . . . 323 286 273 119 92 94 36 .25 35 .73 9 .0 3 .3 Long Hollow CDP . . . . . . . . . . . . . 192 (X) (X) 62 (X) (X) 14 .55 14 .43 13 .3 4 .3 Minnesota township . . . . . . . . . . . . . 120 120 149 51 53 73 48 .20 46 .90 2 .6 1 .1 New Effington town . . . . . . . . . . . . . 256 233 219 121 117 120 0 .27 0 .26 984 .6 465 .4 Norway township . . . . . . . . . . . . . . . 112 119 160 51 60 63 48 .34 48 .21 2 .3 1 .1 One Road township . . . . . . . . . . . . . 63 57 88 31 34 39 36 .02 34 .42 1 .8 0 .9 Ortley town . . . . . . . . . . . . . . . . . . . . 65 54 63 42 32 36 2 .24 2 .24 29 .0 18 .8 Ortley township . . . . . . . . . . . . . . . . 74 69 88 31 29 36 33 .84 33 .61 2 .2 0 .9 Peever town . . . . . . . . . . . . . . . . . . . 168 209 195 63 73 84 0 .12 0 .12 1,400 .0 525 .0 Rosholt town . . . . . . . . . . . . . . . . . . 423 419 408 228 199 200 0 .29 0 .29 1,458 .6 786 .2 Sisseton city . . . . . . . . . . . . . . . . . . . 2,470 2,572 2,181 1,057 1,093 1,008 1 .59 1 .59 1,553 .5 664 .8 Sisseton township . . . . . . . . . . . . . . 453 324 577 207 124 192 34 .55 34 .49 13 .1 6 .0 Springdale township . . . . . . . . . . . . . 110 115 130 51 50 52 34 .74 34 .72 3 .2 1 .5 Spring Grove township . . . . . . . . . . . 123 149 150 53 47 54 36 .32 35 .98 3 .4 1 .5 Summit town . . . . . . . . . . . . . . . . . . 288 281 267 129 144 138 0 .56 0 .56 514 .3 230 .4 Summit township . . . . . . . . . . . . . . . 53 43 52 24 20 27 32 .91 32 .32 1 .6 0 .7 Victor township . . . . . . . . . . . . . . . . . 180 181 169 79 81 81 47 .96 47 .03 3 .8 1 .7 White Rock town . . . . . . . . . . . . . . . 3 18 7 8 6 6 1 .57 1 .57 1 .9 5 .1 White Rock township . . . . . . . . . . . . 246 239 257 62 83 85 59 .36 58 .15 4 .2 1 .1 Wilmot city . . . . . . . . . . . . . . . . . . . . 492 543 566 237 252 255 0 .49 0 .49 1,004 .1 483 .7
Sanborn County . . . . . . . . . . . . . . . . . 2,355 2,675 2,833 1,172 1,220 1,326 570 .48 569 .32 4 .1 2 .1 Afton township . . . . . . . . . . . . . . . . . 44 52 55 23 22 30 34 .48 34 .48 1 .3 0 .7 Artesian town . . . . . . . . . . . . . . . . . . 138 157 217 96 99 119 0 .55 0 .55 250 .9 174 .5 Benedict township . . . . . . . . . . . . . . 29 40 49 18 17 23 35 .86 35 .86 0 .8 0 .5 Butler township . . . . . . . . . . . . . . . . 247 254 252 55 74 81 36 .17 36 .17 6 .8 1 .5 Diana township . . . . . . . . . . . . . . . . 52 50 49 26 26 29 35 .32 35 .31 1 .5 0 .7 Elliott township . . . . . . . . . . . . . . . . . 99 119 121 52 47 48 35 .94 35 .94 2 .8 1 .4 Floyd township . . . . . . . . . . . . . . . . . 57 75 95 30 35 48 34 .43 34 .39 1 .7 0 .9 Jackson township . . . . . . . . . . . . . . . 78 107 101 38 44 49 34 .43 34 .40 2 .3 1 .1 Letcher town . . . . . . . . . . . . . . . . . . 173 177 164 83 84 84 0 .65 0 .62 279 .0 133 .9 Letcher township . . . . . . . . . . . . . . . 120 144 185 61 58 72 35 .43 35 .42 3 .4 1 .7 Logan township . . . . . . . . . . . . . . . . 133 156 134 77 77 69 36 .00 35 .99 3 .7 2 .1 Forestburg CDP (part) . . . . . . . . . 69 (X) (X) 35 (X) (X) 0 .56 0 .56 123 .2 62 .5 Oneida township . . . . . . . . . . . . . . . 27 37 49 19 18 26 35 .88 35 .66 0 .8 0 .5 Ravenna township . . . . . . . . . . . . . . 53 66 61 27 29 35 35 .78 35 .48 1 .5 0 .8 Silver Creek township . . . . . . . . . . . 92 108 108 46 46 49 35 .92 35 .90 2 .6 1 .3 Forestburg CDP (part) . . . . . . . . . 4 (X) (X) 1 (X) (X) 0 .07 0 .04 100 .0 25 .0 Twin Lake township . . . . . . . . . . . . . 86 112 117 68 72 74 36 .05 35 .77 2 .4 1 .9 Union township . . . . . . . . . . . . . . . . 63 76 65 31 33 35 35 .88 35 .85 1 .8 0 .9 Warren township . . . . . . . . . . . . . . . 60 68 75 34 34 37 35 .29 35 .26 1 .7 1 .0 Woonsocket city . . . . . . . . . . . . . . . . 655 720 766 318 330 339 0 .79 0 .78 839 .7 407 .7 Woonsocket township . . . . . . . . . . . 149 157 170 70 75 79 35 .59 35 .49 4 .2 2 .0
Shannon County . . . . . . . . . . . . . . . . . 13,586 12,466 9,902 3,593 3,123 2,699 2,096 .65 2,093 .90 6 .5 1 .7 Batesland town . . . . . . . . . . . . . . . . 108 88 124 33 34 41 0 .09 0 .09 1,200 .0 366 .7 East Shannon UT . . . . . . . . . . . . . . . 5,325 4,764 4,083 1,420 1,222 1,124 882 .66 881 .65 6 .0 1 .6 Kyle CDP . . . . . . . . . . . . . . . . . . . 846 970 914 225 219 216 1 .53 1 .47 575 .5 153 .1 Manderson-White Horse Creek
CDP (part) . . . . . . . . . . . . . . . . . 214 165 243 45 42 65 0 .90 0 .90 237 .8 50 .0 Porcupine CDP . . . . . . . . . . . . . . . 1,062 407 783 223 103 175 9 .54 9 .54 111 .3 23 .4 Wounded Knee CDP . . . . . . . . . . 382 328 18 73 56 5 1 .07 1 .07 357 .0 68 .2 West Shannon UT . . . . . . . . . . . . . . 8,153 7,614 5,695 2,140 1,867 1,534 1,213 .90 1,212 .16 6 .7 1 .8 Manderson-White Horse Creek
CDP (part) . . . . . . . . . . . . . . . . . 412 461 – 73 74 – 4 .83 4 .83 85 .3 15 .1 Oglala CDP . . . . . . . . . . . . . . . . . 1,290 1,229 422 279 279 142 13 .36 12 .50 103 .2 22 .3 Pine Ridge CDP . . . . . . . . . . . . . . 3,308 3,171 2,596 863 742 694 2 .84 2 .84 1,164 .8 303 .9
Spink County . . . . . . . . . . . . . . . . . . . . 6,415 7,454 7,981 3,139 3,352 3,545 1,509 .74 1,503 .93 4 .3 2 .1 Antelope township . . . . . . . . . . . . . . 58 78 96 27 30 35 35 .93 35 .93 1 .6 0 .8 Ashton city . . . . . . . . . . . . . . . . . . . . 122 152 148 64 72 86 0 .44 0 .44 277 .3 145 .5 Athol township . . . . . . . . . . . . . . . . . 65 86 110 33 34 48 47 .81 47 .81 1 .4 0 .7 Belle Plaine township . . . . . . . . . . . . 79 73 118 36 30 48 36 .13 36 .11 2 .2 1 .0 Belmont township . . . . . . . . . . . . . . . 65 60 68 28 33 40 35 .94 35 .94 1 .8 0 .8 Benton township . . . . . . . . . . . . . . . 27 33 35 14 17 19 36 .09 36 .09 0 .7 0 .4 Beotia township . . . . . . . . . . . . . . . . 31 35 53 18 18 26 35 .55 35 .54 0 .9 0 .5 Brentford town . . . . . . . . . . . . . . . . . 77 65 69 33 29 32 0 .16 0 .16 481 .3 206 .3

Population and Housing Unit Counts South Dakota 29U.S. Census Bureau, 2010 Census
Table 8. Population and Housing Units: 1990 to 2010; and Area Measurements and Density: 2010—Con.[For information concerning historical counts and geographic change, see “User Notes .” For information on confidentiality, nonsampling error, and definitions, see Appendixes]
StateCounty/County EquivalentCounty SubdivisionPlace
Population Housing units Area measurements in square miles
Average per square mile of land
2010 2000 1990 2010 2000 1990 Total area Land areaPopulation
densityHousing unit
density
South Dakota—Con .
Spink County—Con . Buffalo township . . . . . . . . . . . . . . . . 56 66 77 29 31 34 35 .78 35 .78 1 .6 0 .8 Capitola township . . . . . . . . . . . . . . . 138 248 227 40 65 51 36 .08 35 .98 3 .8 1 .1 Clifton township . . . . . . . . . . . . . . . . 43 60 78 25 29 33 48 .20 48 .20 0 .9 0 .5 Conde city . . . . . . . . . . . . . . . . . . . . 140 187 203 111 119 124 0 .56 0 .56 250 .0 198 .2 Conde township . . . . . . . . . . . . . . . . 27 38 32 15 16 15 35 .34 35 .34 0 .8 0 .4 Cornwall township . . . . . . . . . . . . . . 45 55 61 24 23 23 35 .76 35 .53 1 .3 0 .7 Crandon township . . . . . . . . . . . . . . 73 72 103 31 34 39 35 .82 35 .81 2 .0 0 .9 Doland city . . . . . . . . . . . . . . . . . . . . 180 297 306 131 159 158 0 .59 0 .59 305 .1 222 .0 Exline township . . . . . . . . . . . . . . . . 54 71 77 28 24 28 36 .79 36 .72 1 .5 0 .8 Frankfort city . . . . . . . . . . . . . . . . . . 149 166 192 82 99 100 0 .79 0 .79 188 .6 103 .8 Frankfort township . . . . . . . . . . . . . . 39 54 64 22 24 26 35 .35 35 .11 1 .1 0 .6 Garfield township . . . . . . . . . . . . . . . 55 41 59 21 17 23 35 .89 35 .89 1 .5 0 .6 Great Bend township . . . . . . . . . . . . 44 34 56 19 17 20 36 .02 36 .01 1 .2 0 .5 Groveland township . . . . . . . . . . . . . 42 61 84 25 26 29 36 .03 36 .01 1 .2 0 .7 Harmony township . . . . . . . . . . . . . . 63 63 70 26 25 24 36 .10 36 .10 1 .7 0 .7 Harrison township . . . . . . . . . . . . . . 38 30 59 16 15 23 35 .85 35 .77 1 .1 0 .4 Jefferson township . . . . . . . . . . . . . . 61 65 60 28 27 29 47 .69 47 .68 1 .3 0 .6 Lake township . . . . . . . . . . . . . . . . . 104 125 91 146 151 151 35 .65 33 .64 3 .1 4 .3 La Prairie township . . . . . . . . . . . . . 40 53 71 23 24 33 49 .90 49 .90 0 .8 0 .5 Lincoln township . . . . . . . . . . . . . . . 241 257 216 38 61 50 35 .65 35 .33 6 .8 1 .1 Lodi township . . . . . . . . . . . . . . . . . . 80 92 84 35 36 35 36 .65 36 .65 2 .2 1 .0 Mellette city . . . . . . . . . . . . . . . . . . . 210 248 184 100 99 87 0 .26 0 .26 807 .7 384 .6 Mellette township . . . . . . . . . . . . . . . 130 138 78 54 62 68 75 .42 75 .41 1 .7 0 .7 Northville town . . . . . . . . . . . . . . . . . 143 124 105 61 51 54 0 .38 0 .38 376 .3 160 .5 Northville township . . . . . . . . . . . . . . 192 226 209 86 85 97 99 .37 99 .05 1 .9 0 .9 Mansfield CDP (part) . . . . . . . . . . 53 (X) (X) 21 (X) (X) 0 .64 0 .64 82 .8 32 .8 Olean township . . . . . . . . . . . . . . . . 31 41 66 17 19 29 36 .09 36 .09 0 .9 0 .5 Prairie Center township . . . . . . . . . . 81 43 47 19 17 16 35 .97 35 .95 2 .3 0 .5 Redfield city . . . . . . . . . . . . . . . . . . . 2,333 r 2,518 2,770 1,187 r 1,262 1,306 1 .91 1 .89 1,234 .4 628 .0 Redfield township . . . . . . . . . . . . . . . 463 r 716 654 129 r 138 149 35 .48 34 .98 13 .2 3 .7 Richfield township . . . . . . . . . . . . . . 25 40 35 12 14 17 35 .73 35 .70 0 .7 0 .3 Spring township . . . . . . . . . . . . . . . . 32 34 31 17 16 13 35 .75 35 .75 0 .9 0 .5 Sumner township . . . . . . . . . . . . . . . 11 24 37 12 13 15 36 .11 36 .09 0 .3 0 .3 Tetonka township . . . . . . . . . . . . . . . 58 75 117 31 34 42 58 .81 58 .79 1 .0 0 .5 Three Rivers township . . . . . . . . . . . 91 71 67 33 27 33 35 .98 35 .98 2 .5 0 .9 Tulare town . . . . . . . . . . . . . . . . . . . . 207 221 244 103 113 119 0 .26 0 .26 796 .2 396 .2 Tulare township . . . . . . . . . . . . . . . . 48 61 55 23 26 28 35 .56 33 .81 1 .4 0 .7 Turton town . . . . . . . . . . . . . . . . . . . 48 61 76 45 47 42 0 .37 0 .37 129 .7 121 .6 Turton township . . . . . . . . . . . . . . . . 25 29 41 12 14 15 35 .77 35 .77 0 .7 0 .3 Union township . . . . . . . . . . . . . . . . 51 67 78 30 30 33 36 .01 36 .01 1 .4 0 .8
Stanley County . . . . . . . . . . . . . . . . . . 2,966 2,772 2,453 1,387 1,277 1,056 1,517 .17 1,444 .43 2 .1 1 .0 Fort Pierre city . . . . . . . . . . . . . . . . . 2,078 1,991 1,854 959 875 738 3 .15 3 .11 668 .2 308 .4 Lower Brule UT . . . . . . . . . . . . . . . . 24 20 (X) 8 8 (X) 47 .21 42 .04 0 .6 0 .2 North Stanley UT . . . . . . . . . . . . . . . 395 328 268 218 194 151 770 .35 708 .16 0 .6 0 .3 South Stanley UT . . . . . . . . . . . . . . . 469 433 331 202 200 167 696 .46 691 .13 0 .7 0 .3
Sully County . . . . . . . . . . . . . . . . . . . . 1,373 1,556 1,589 845 844 811 1,070 .29 1,006 .82 1 .4 0 .8 Agar town . . . . . . . . . . . . . . . . . . . . . 76 82 82 48 54 42 0 .16 0 .16 475 .0 300 .0 East Sully UT . . . . . . . . . . . . . . . . . . 254 304 340 158 177 188 481 .22 477 .78 0 .5 0 .3 Onida city . . . . . . . . . . . . . . . . . . . . . 658 740 761 331 329 359 0 .64 0 .64 1,028 .1 517 .2 West Sully UT . . . . . . . . . . . . . . . . . 385 430 406 308 284 222 588 .27 528 .24 0 .7 0 .6 Cow Creek CDP . . . . . . . . . . . . . . 30 (X) (X) 44 (X) (X) 1 .83 1 .83 16 .4 24 .0
Todd County . . . . . . . . . . . . . . . . . . . . 9,612 9,050 8,352 3,142 2,766 2,572 1,390 .82 1,388 .56 6 .9 2 .3 East Todd UT . . . . . . . . . . . . . . . . . . 2,858 2,646 2,439 1,036 899 833 725 .41 724 .19 3 .9 1 .4 Antelope CDP . . . . . . . . . . . . . . . . 826 867 744 248 233 218 2 .29 2 .29 360 .7 108 .3 Okreek CDP . . . . . . . . . . . . . . . . . 269 (X) (X) 101 (X) (X) 45 .03 44 .99 6 .0 2 .2 White Horse CDP . . . . . . . . . . . . . 276 180 152 86 39 32 3 .17 3 .16 87 .3 27 .2 Mission city . . . . . . . . . . . . . . . . . . . 1,182 904 730 443 339 272 0 .59 0 .59 2,003 .4 750 .8 St . Francis town . . . . . . . . . . . . . . . . 709 675 815 211 204 237 0 .36 0 .36 1,969 .4 586 .1 West Todd UT . . . . . . . . . . . . . . . . . . 4,863 4,825 4,368 1,452 1,324 1,230 664 .45 663 .42 7 .3 2 .2 Parmelee CDP . . . . . . . . . . . . . . . 562 650 618 167 160 151 5 .80 5 .71 98 .4 29 .2 Rosebud CDP . . . . . . . . . . . . . . . 1,587 1,557 1,538 476 465 466 13 .01 12 .96 122 .5 36 .7 Soldier Creek CDP . . . . . . . . . . . . 227 (X) (X) 62 (X) (X) 12 .24 12 .23 18 .6 5 .1 Spring Creek CDP . . . . . . . . . . . . 268 136 231 71 33 57 10 .37 10 .37 25 .8 6 .8 Two Strike CDP . . . . . . . . . . . . . . 209 33 112 58 11 29 18 .57 18 .53 11 .3 3 .1

30 South Dakota Population and Housing Unit CountsU.S. Census Bureau, 2010 Census
Table 8. Population and Housing Units: 1990 to 2010; and Area Measurements and Density: 2010—Con.[For information concerning historical counts and geographic change, see “User Notes .” For information on confidentiality, nonsampling error, and definitions, see Appendixes]
StateCounty/County EquivalentCounty SubdivisionPlace
Population Housing units Area measurements in square miles
Average per square mile of land
2010 2000 1990 2010 2000 1990 Total area Land areaPopulation
densityHousing unit
density
South Dakota—Con .
Tripp County . . . . . . . . . . . . . . . . . . . . 5,644 6,430 6,924 3,072 3,036 3,023 1,617 .57 1,612 .45 3 .5 1 .9 Banner township . . . . . . . . . . . . . . . 17 25 18 12 13 11 28 .76 28 .75 0 .6 0 .4 Beaver Creek township . . . . . . . . . . 16 25 24 10 14 14 21 .04 21 .01 0 .8 0 .5 Black township . . . . . . . . . . . . . . . . . 133 188 150 62 90 59 35 .71 35 .70 3 .7 1 .7 Brunson township . . . . . . . . . . . . . . 48 42 53 27 21 21 28 .90 28 .81 1 .7 0 .9 Bull Creek township . . . . . . . . . . . . . 32 43 43 21 18 18 29 .04 29 .03 1 .1 0 .7 Carter township . . . . . . . . . . . . . . . . 42 46 52 21 25 23 26 .46 26 .30 1 .6 0 .8 Colome city . . . . . . . . . . . . . . . . . . . 296 340 309 174 170 171 0 .27 0 .27 1,096 .3 644 .4 Colome township . . . . . . . . . . . . . . . 75 95 108 44 41 39 35 .50 35 .48 2 .1 1 .2 Condon township . . . . . . . . . . . . . . . 37 41 47 21 20 20 36 .00 35 .85 1 .0 0 .6 Curlew township . . . . . . . . . . . . . . . . 44 44 38 21 18 17 39 .32 39 .28 1 .1 0 .5 Dog Ear township . . . . . . . . . . . . . . . 45 62 62 28 29 29 35 .89 35 .66 1 .3 0 .8 Elliston township . . . . . . . . . . . . . . . 23 31 47 23 24 22 35 .87 35 .73 0 .6 0 .6 Gassman UT . . . . . . . . . . . . . . . . . . 21 32 27 10 10 8 41 .83 41 .37 0 .5 0 .2 Greenwood township . . . . . . . . . . . . 7 19 21 7 9 8 44 .93 44 .63 0 .2 0 .2 Holsclaw township . . . . . . . . . . . . . . 17 22 24 13 12 17 23 .83 23 .83 0 .7 0 .5 Huggins township . . . . . . . . . . . . . . . 22 21 29 22 20 17 34 .91 34 .89 0 .6 0 .6 Ideal township . . . . . . . . . . . . . . . . . 126 188 208 56 58 59 35 .93 35 .88 3 .5 1 .6 Irwin township . . . . . . . . . . . . . . . . . 25 26 39 22 20 16 35 .81 35 .70 0 .7 0 .6 Jordan township . . . . . . . . . . . . . . . . 48 42 44 24 21 22 35 .73 35 .66 1 .3 0 .7 Keyapaha township . . . . . . . . . . . . . 22 28 36 14 19 19 34 .91 34 .85 0 .6 0 .4 King township . . . . . . . . . . . . . . . . . . 25 20 41 20 17 19 35 .92 35 .87 0 .7 0 .6 Lake township . . . . . . . . . . . . . . . . . 52 76 86 32 34 38 36 .02 35 .97 1 .4 0 .9 Lamro township . . . . . . . . . . . . . . . . 463 550 589 175 162 164 33 .70 33 .67 13 .8 5 .2 Lincoln township . . . . . . . . . . . . . . . 30 41 55 18 21 24 35 .88 35 .82 0 .8 0 .5 Lone Star township . . . . . . . . . . . . . 28 22 23 8 9 8 35 .89 35 .71 0 .8 0 .2 Lone Tree township . . . . . . . . . . . . . 14 25 44 14 16 21 35 .72 35 .71 0 .4 0 .4 McNeely township . . . . . . . . . . . . . . 52 64 75 35 38 39 35 .94 35 .88 1 .4 1 .0 Millboro township . . . . . . . . . . . . . . . 35 45 56 21 23 24 34 .92 34 .87 1 .0 0 .6 New Witten town . . . . . . . . . . . . . . . 79 51 87 51 37 53 0 .28 0 .28 282 .1 182 .1 Pahapesto UT . . . . . . . . . . . . . . . . . 9 15 25 13 9 10 50 .62 50 .14 0 .2 0 .3 Plainview township . . . . . . . . . . . . . . 56 60 112 35 34 38 35 .75 35 .66 1 .6 1 .0 Pleasant Valley township . . . . . . . . . 33 26 23 14 12 10 28 .95 28 .91 1 .1 0 .5 Pleasant View township . . . . . . . . . . 112 122 129 48 52 48 35 .92 35 .84 3 .1 1 .3 Progressive UT . . . . . . . . . . . . . . . . 18 22 30 12 12 11 22 .77 22 .55 0 .8 0 .5 Rames township . . . . . . . . . . . . . . . 40 45 39 27 29 28 34 .95 34 .87 1 .1 0 .8 Rosedale township . . . . . . . . . . . . . . 38 53 52 33 28 29 35 .92 35 .78 1 .1 0 .9 Roseland township . . . . . . . . . . . . . . 38 44 51 20 21 28 35 .88 35 .83 1 .1 0 .6 Hamill CDP . . . . . . . . . . . . . . . . . . 11 11 (X) 9 7 (X) 1 .25 1 .22 9 .0 7 .4 Star Prairie township . . . . . . . . . . . . 37 43 51 36 29 29 35 .91 35 .91 1 .0 1 .0 Star Valley township . . . . . . . . . . . . . 30 44 26 17 20 10 42 .41 41 .89 0 .7 0 .4 Stewart township . . . . . . . . . . . . . . . 104 111 115 42 44 45 36 .02 36 .02 2 .9 1 .2 Sully township . . . . . . . . . . . . . . . . . 23 43 54 20 22 17 35 .79 35 .63 0 .6 0 .6 Taylor township . . . . . . . . . . . . . . . . . 14 22 21 13 12 8 26 .38 26 .30 0 .5 0 .5 Valley township . . . . . . . . . . . . . . . . . 51 50 46 20 18 17 34 .80 34 .79 1 .5 0 .6 Weaver township . . . . . . . . . . . . . . . 39 57 70 24 27 23 35 .72 35 .72 1 .1 0 .7 Willow Creek township . . . . . . . . . . . 61 70 71 32 33 32 36 .01 35 .75 1 .7 0 .9 Wilson township . . . . . . . . . . . . . . . . 107 116 135 53 45 45 35 .85 35 .81 3 .0 1 .5 Winner city . . . . . . . . . . . . . . . . . . . . 2,897 3,137 3,354 1,547 1,526 1,540 2 .20 2 .20 1,316 .8 703 .2 Witten township . . . . . . . . . . . . . . . . 21 43 31 16 19 17 28 .54 28 .27 0 .7 0 .6 Wortman township . . . . . . . . . . . . . . 29 31 39 26 21 23 35 .95 35 .82 0 .8 0 .7 Wright township . . . . . . . . . . . . . . . . 13 22 15 18 14 15 26 .37 26 .33 0 .5 0 .7
Turner County . . . . . . . . . . . . . . . . . . . 8,347 8,849 8,576 3,939 3,852 3,800 617 .69 617 .06 13 .5 6 .4 Brothersfield township . . . . . . . . . . . 165 156 148 62 61 64 28 .45 28 .45 5 .8 2 .2 Centerville city . . . . . . . . . . . . . . . . . 882 910 887 425 429 423 0 .72 0 .72 1,225 .0 590 .3 Centerville township . . . . . . . . . . . . . 158 172 211 75 75 77 35 .20 35 .19 4 .5 2 .1 Chancellor town . . . . . . . . . . . . . . . . 264 328 276 131 142 132 0 .22 0 .22 1,200 .0 595 .5 Childstown township . . . . . . . . . . . . 237 261 283 94 94 100 36 .41 36 .41 6 .5 2 .6 Daneville township . . . . . . . . . . . . . . 207 225 13 89 89 88 35 .67 35 .67 5 .8 2 .5 Davis town . . . . . . . . . . . . . . . . . . . . 85 104 87 51 55 45 0 .43 0 .43 197 .7 118 .6 Dolton town . . . . . . . . . . . . . . . . . . . 37 41 43 22 26 29 0 .26 0 .26 142 .3 84 .6 Dolton township . . . . . . . . . . . . . . . . 129 159 169 56 58 70 29 .09 29 .08 4 .4 1 .9 Germantown township . . . . . . . . . . . 358 326 326 132 119 120 35 .55 35 .55 10 .1 3 .7 Home township . . . . . . . . . . . . . . . . 323 310 279 127 107 94 27 .98 27 .98 11 .5 4 .5 Hurley city . . . . . . . . . . . . . . . . . . . . 415 426 372 204 206 192 0 .62 0 .62 669 .4 329 .0 Hurley township . . . . . . . . . . . . . . . . 169 160 152 67 64 70 35 .26 34 .99 4 .8 1 .9 Irene city (part) . . . . . . . . . . . . . . . . . 231 233 253 111 111 112 0 .11 0 .11 2,100 .0 1,009 .1 Marion city . . . . . . . . . . . . . . . . . . . . 784 892 831 384 377 371 0 .87 0 .87 901 .1 441 .4 Marion township . . . . . . . . . . . . . . . . 186 202 237 78 77 81 35 .01 35 .01 5 .3 2 .2 Middleton township . . . . . . . . . . . . . 238 274 248 95 92 87 35 .46 35 .45 6 .7 2 .7 Monroe town . . . . . . . . . . . . . . . . . . 160 163 151 75 75 79 0 .38 0 .38 421 .1 197 .4

Population and Housing Unit Counts South Dakota 31U.S. Census Bureau, 2010 Census
Table 8. Population and Housing Units: 1990 to 2010; and Area Measurements and Density: 2010—Con.[For information concerning historical counts and geographic change, see “User Notes .” For information on confidentiality, nonsampling error, and definitions, see Appendixes]
StateCounty/County EquivalentCounty SubdivisionPlace
Population Housing units Area measurements in square miles
Average per square mile of land
2010 2000 1990 2010 2000 1990 Total area Land areaPopulation
densityHousing unit
density
South Dakota—Con .
Turner County—Con . Monroe township . . . . . . . . . . . . . . . 181 173 157 74 71 68 28 .22 28 .22 6 .4 2 .6 Norway township . . . . . . . . . . . . . . . 184 194 208 75 79 82 35 .77 35 .77 5 .1 2 .1 Parker city . . . . . . . . . . . . . . . . . . . . 1,022 1,031 984 489 450 429 1 .15 1 .15 888 .7 425 .2 Parker township . . . . . . . . . . . . . . . . 237 284 249 100 108 102 34 .69 34 .69 6 .8 2 .9 Rosefield township . . . . . . . . . . . . . . 183 198 218 79 77 87 36 .37 36 .37 5 .0 2 .2 Salem township . . . . . . . . . . . . . . . . 151 183 213 77 75 80 36 .35 36 .35 4 .2 2 .1 Spring Valley township . . . . . . . . . . . 193 208 205 73 74 79 35 .74 35 .74 5 .4 2 .0 Swan Lake township . . . . . . . . . . . . 209 213 208 175 168 178 35 .64 35 .37 5 .9 4 .9 Turner township . . . . . . . . . . . . . . . . 177 191 205 90 90 88 35 .67 35 .61 5 .0 2 .5 Viborg city . . . . . . . . . . . . . . . . . . . . 782 832 763 429 403 373 0 .40 0 .40 1,955 .0 1,072 .5
Union County . . . . . . . . . . . . . . . . . . . . 14,399 12,584 10,189 6,280 5,345 4,286 467 .13 460 .54 31 .3 13 .6 Alcester city . . . . . . . . . . . . . . . . . . . 807 880 843 408 430 409 0 .33 0 .33 2,445 .5 1,236 .4 Alcester township . . . . . . . . . . . . . . . 274 317 339 129 116 125 35 .62 35 .54 7 .7 3 .6 Beresford city (part) . . . . . . . . . . . . . 1,646 1,579 1,500 771 733 692 1 .31 1 .31 1,256 .5 588 .5 Big Sioux township . . . . . . . . . . . . . . 3,259 2,047 382 1,336 873 149 13 .35 11 .69 278 .8 114 .3 Dakota Dunes CDP . . . . . . . . . . . 2,540 (X) (X) 1,050 (X) (X) 2 .87 2 .44 1,041 .0 430 .3 Big Springs township . . . . . . . . . . . . 275 313 302 112 116 115 36 .66 36 .63 7 .5 3 .1 Brule township . . . . . . . . . . . . . . . . . 242 263 243 101 95 101 36 .32 36 .32 6 .7 2 .8 Civil Bend township . . . . . . . . . . . . . 299 301 302 134 119 154 32 .73 29 .94 10 .0 4 .5 Elk Point city . . . . . . . . . . . . . . . . . . . 1,963 1,714 1,423 830 750 597 1 .36 1 .36 1,443 .4 610 .3 Elk Point township . . . . . . . . . . . . . . 261 276 280 129 118 127 56 .39 55 .49 4 .7 2 .3 Emmet township . . . . . . . . . . . . . . . 214 257 278 101 100 107 35 .95 35 .95 6 .0 2 .8 Jefferson city . . . . . . . . . . . . . . . . . . 547 586 527 248 240 220 0 .50 0 .50 1,094 .0 496 .0 Jefferson township . . . . . . . . . . . . . . 943 585 523 342 224 206 39 .78 38 .80 24 .3 8 .8 North Sioux City city . . . . . . . . . . . . 2,530 2,288 2,019 1,146 953 795 2 .29 2 .26 1,119 .5 507 .1 Prairie township . . . . . . . . . . . . . . . . 240 235 218 94 86 85 34 .68 34 .67 6 .9 2 .7 Richland UT . . . . . . . . . . . . . . . . . . . 198 205 199 97 92 88 22 .28 22 .20 8 .9 4 .4 Richland CDP . . . . . . . . . . . . . . . . 89 (X) (X) 48 (X) (X) 5 .65 5 .65 15 .8 8 .5 Sioux Valley township . . . . . . . . . . . . 243 242 275 102 102 108 42 .22 42 .19 5 .8 2 .4 Spink township . . . . . . . . . . . . . . . . . 218 245 278 105 105 107 36 .30 36 .28 6 .0 2 .9 Virginia township . . . . . . . . . . . . . . . 240 251 258 95 93 101 39 .08 39 .08 6 .1 2 .4
Walworth County . . . . . . . . . . . . . . . . . 5,438 5,974 6,087 3,003 3,144 2,928 744 .62 708 .63 7 .7 4 .2 Akaska town . . . . . . . . . . . . . . . . . . . 42 31 52 172 188 114 0 .61 0 .61 68 .9 282 .0 East Walworth UT . . . . . . . . . . . . . . 375 503 584 199 220 231 398 .16 391 .64 1 .0 0 .5 Glenham town . . . . . . . . . . . . . . . . . 105 139 134 67 69 58 0 .33 0 .33 318 .2 203 .0 Java town . . . . . . . . . . . . . . . . . . . . . 129 197 161 119 133 125 0 .49 0 .49 263 .3 242 .9 Lowry town . . . . . . . . . . . . . . . . . . . . 6 10 15 6 6 5 0 .25 0 .25 24 .0 24 .0 Mobridge city . . . . . . . . . . . . . . . . . . 3,465 3,574 3,768 1,727 1,808 1,779 1 .89 1 .89 1,833 .3 913 .8 Selby city . . . . . . . . . . . . . . . . . . . . . 642 736 707 334 335 344 0 .71 0 .71 904 .2 470 .4 West Walworth UT . . . . . . . . . . . . . . 674 784 666 379 385 272 342 .18 312 .71 2 .2 1 .2
Yankton County . . . . . . . . . . . . . . . . . . 22,438 21,652 19,252 9,652 8,840 7,571 532 .22 521 .16 43 .1 18 .5 Gayville town . . . . . . . . . . . . . . . . . . 407 418 401 179 182 176 0 .21 0 .21 1,938 .1 852 .4 Gayville township . . . . . . . . . . . . . . . 197 218 171 88 92 77 32 .68 31 .07 6 .3 2 .8 Irene city (part) . . . . . . . . . . . . . . . . . 2 1 2 2 2 2 0 .06 0 .06 33 .3 33 .3 Jamesville township . . . . . . . . . . . . . 232 219 275 46 62 76 36 .19 36 .15 6 .4 1 .3 Lesterville town . . . . . . . . . . . . . . . . 127 158 168 68 73 66 0 .20 0 .20 635 .0 340 .0 Marindahl township . . . . . . . . . . . . . 182 198 187 76 79 77 35 .95 35 .75 5 .1 2 .1 Mayfield township . . . . . . . . . . . . . . . 206 237 229 87 84 91 36 .54 36 .51 5 .6 2 .4 Mission Hill town . . . . . . . . . . . . . . . 177 183 180 77 76 68 0 .33 0 .33 536 .4 233 .3 Mission Hill township . . . . . . . . . . . . 386 420 332 155 155 121 34 .98 34 .97 11 .0 4 .4 Southeast Yankton UT . . . . . . . . . . . 940 933 694 405 434 284 16 .06 14 .60 64 .4 27 .7 Turkey Valley township . . . . . . . . . . . 179 222 218 79 79 86 35 .76 35 .75 5 .0 2 .2 Utica town . . . . . . . . . . . . . . . . . . . . 65 86 115 44 43 43 0 .26 0 .26 250 .0 169 .2 Utica township . . . . . . . . . . . . . . . . . 859 715 846 152 123 125 35 .99 35 .86 24 .0 4 .2 Volin town . . . . . . . . . . . . . . . . . . . . . 161 207 175 76 81 68 0 .20 0 .20 805 .0 380 .0 Volin township . . . . . . . . . . . . . . . . . 233 235 240 99 94 101 35 .58 35 .55 6 .6 2 .8 Walshtown township . . . . . . . . . . . . . 157 195 214 74 80 91 36 .27 36 .27 4 .3 2 .0 West Yankton UT . . . . . . . . . . . . . . . 3,474 3,479 2,102 1,580 1,366 800 186 .50 179 .20 19 .4 8 .8 Yankton city . . . . . . . . . . . . . . . . . . . 14,454 13,528 12,703 6,365 5,735 5,219 8 .45 8 .21 1,760 .5 775 .3
Ziebach County . . . . . . . . . . . . . . . . . . 2,801 2,519 2,220 987 879 800 1,970 .62 1,961 .27 1 .4 0 .5 Dupree city . . . . . . . . . . . . . . . . . . . . 525 434 484 203 171 203 0 .39 0 .39 1,346 .2 520 .5 Dupree UT . . . . . . . . . . . . . . . . . . . . 148 175 154 55 57 51 84 .60 84 .41 1 .8 0 .7 Eagle Butte city (part) . . . . . . . . . . . 797 199 14 187 67 3 0 .84 0 .84 948 .8 222 .6 North Ziebach UT . . . . . . . . . . . . . . 342 338 346 142 136 155 699 .89 698 .02 0 .5 0 .2 South Ziebach UT . . . . . . . . . . . . . . 989 1,373 1,222 400 448 388 1,184 .90 1,177 .61 0 .8 0 .3
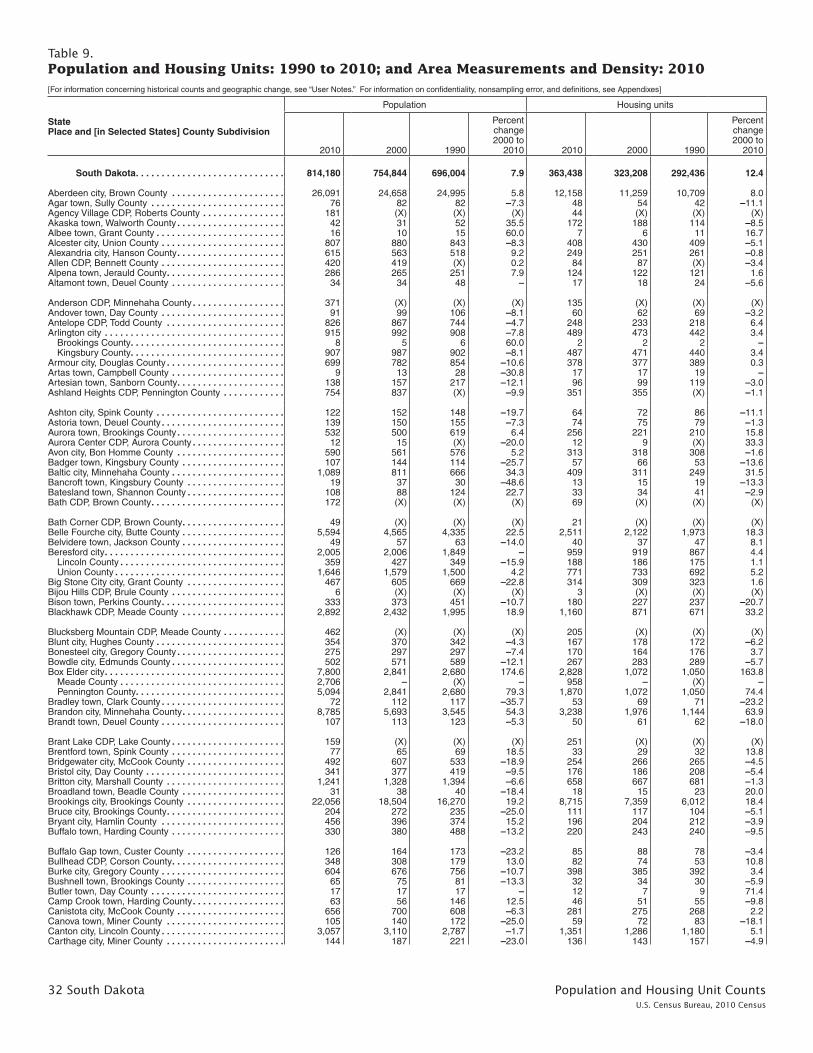
32 South Dakota Population and Housing Unit CountsU.S. Census Bureau, 2010 Census
Table 9. Population and Housing Units: 1990 to 2010; and Area Measurements and Density: 2010—Con.[For information concerning historical counts and geographic change, see “User Notes .” For information on confidentiality, nonsampling error, and definitions, see Appendixes]
Table 9. Population and Housing Units: 1990 to 2010; and Area Measurements and Density: 2010—Con.[For information concerning historical counts and geographic change, see “User Notes .” For information on confidentiality, nonsampling error, and definitions, see Appendixes]
StatePlace and [in Selected States] County Subdivision
Population Housing units Area measurements in square miles Average per square mile of land
StatePlace and [in Selected States] County Subdivision
2010 2000 1990
Percent change 2000 to
2010 2010 2000 1990
Percent change 2000 to
2010 Total area Land area Population density Housing unit density
South Dakota . . . . . . . . . . . . . . . . . . . . . . . . . . . . . 814,180 754,844 696,004 7 .9 363,438 323,208 292,436 12 .4 77,115 .68 75,811 .00 10 .7 4 .8 South Dakota
Aberdeen city, Brown County . . . . . . . . . . . . . . . . . . . . . . 26,091 24,658 24,995 5 .8 12,158 11,259 10,709 8 .0 15 .61 15 .50 1,683 .3 784 .4 Aberdeen city, Brown CountyAgar town, Sully County . . . . . . . . . . . . . . . . . . . . . . . . . . 76 82 82 –7 .3 48 54 42 –11 .1 0 .16 0 .16 475 .0 300 .0 Agar town, Sully CountyAgency Village CDP, Roberts County . . . . . . . . . . . . . . . . 181 (X) (X) (X) 44 (X) (X) (X) 5 .71 5 .71 31 .7 7 .7 Agency Village CDP, Roberts CountyAkaska town, Walworth County . . . . . . . . . . . . . . . . . . . . . 42 31 52 35 .5 172 188 114 –8 .5 0 .61 0 .61 68 .9 282 .0 Akaska town, Walworth CountyAlbee town, Grant County . . . . . . . . . . . . . . . . . . . . . . . . . 16 10 15 60 .0 7 6 11 16 .7 0 .13 0 .13 123 .1 53 .8 Albee town, Grant CountyAlcester city, Union County . . . . . . . . . . . . . . . . . . . . . . . . 807 880 843 –8 .3 408 430 409 –5 .1 0 .33 0 .33 2,445 .5 1,236 .4 Alcester city, Union CountyAlexandria city, Hanson County . . . . . . . . . . . . . . . . . . . . . 615 563 518 9 .2 249 251 261 –0 .8 0 .62 0 .62 991 .9 401 .6 Alexandria city, Hanson CountyAllen CDP, Bennett County . . . . . . . . . . . . . . . . . . . . . . . . 420 419 (X) 0 .2 84 87 (X) –3 .4 3 .24 3 .24 129 .6 25 .9 Allen CDP, Bennett CountyAlpena town, Jerauld County . . . . . . . . . . . . . . . . . . . . . . . 286 265 251 7 .9 124 122 121 1 .6 1 .64 1 .63 175 .5 76 .1 Alpena town, Jerauld CountyAltamont town, Deuel County . . . . . . . . . . . . . . . . . . . . . . 34 34 48 – 17 18 24 –5 .6 1 .25 1 .25 27 .2 13 .6 Altamont town, Deuel County
Anderson CDP, Minnehaha County . . . . . . . . . . . . . . . . . . 371 (X) (X) (X) 135 (X) (X) (X) 0 .99 0 .98 378 .6 137 .8 Anderson CDP, Minnehaha CountyAndover town, Day County . . . . . . . . . . . . . . . . . . . . . . . . 91 99 106 –8 .1 60 62 69 –3 .2 0 .27 0 .27 337 .0 222 .2 Andover town, Day CountyAntelope CDP, Todd County . . . . . . . . . . . . . . . . . . . . . . . 826 867 744 –4 .7 248 233 218 6 .4 2 .29 2 .29 360 .7 108 .3 Antelope CDP, Todd CountyArlington city . . . . . . . . . . . . . . . . . . . . . . . . . . . . . . . . . . . 915 992 908 –7 .8 489 473 442 3 .4 1 .66 1 .66 551 .2 294 .6 Arlington city Brookings County . . . . . . . . . . . . . . . . . . . . . . . . . . . . . . 8 5 6 60 .0 2 2 2 – 0 .45 0 .45 17 .8 4 .4 Brookings County Kingsbury County . . . . . . . . . . . . . . . . . . . . . . . . . . . . . . 907 987 902 –8 .1 487 471 440 3 .4 1 .21 1 .21 749 .6 402 .5 Kingsbury CountyArmour city, Douglas County . . . . . . . . . . . . . . . . . . . . . . . 699 782 854 –10 .6 378 377 389 0 .3 0 .95 0 .94 743 .6 402 .1 Armour city, Douglas CountyArtas town, Campbell County . . . . . . . . . . . . . . . . . . . . . . 9 13 28 –30 .8 17 17 19 – 0 .10 0 .10 90 .0 170 .0 Artas town, Campbell CountyArtesian town, Sanborn County . . . . . . . . . . . . . . . . . . . . . 138 157 217 –12 .1 96 99 119 –3 .0 0 .55 0 .55 250 .9 174 .5 Artesian town, Sanborn CountyAshland Heights CDP, Pennington County . . . . . . . . . . . . 754 837 (X) –9 .9 351 355 (X) –1 .1 2 .92 2 .92 258 .2 120 .2 Ashland Heights CDP, Pennington County
Ashton city, Spink County . . . . . . . . . . . . . . . . . . . . . . . . . 122 152 148 –19 .7 64 72 86 –11 .1 0 .44 0 .44 277 .3 145 .5 Ashton city, Spink CountyAstoria town, Deuel County . . . . . . . . . . . . . . . . . . . . . . . . 139 150 155 –7 .3 74 75 79 –1 .3 0 .16 0 .16 868 .8 462 .5 Astoria town, Deuel CountyAurora town, Brookings County . . . . . . . . . . . . . . . . . . . . . 532 500 619 6 .4 256 221 210 15 .8 0 .46 0 .46 1,156 .5 556 .5 Aurora town, Brookings CountyAurora Center CDP, Aurora County . . . . . . . . . . . . . . . . . . 12 15 (X) –20 .0 12 9 (X) 33 .3 0 .04 0 .04 300 .0 300 .0 Aurora Center CDP, Aurora CountyAvon city, Bon Homme County . . . . . . . . . . . . . . . . . . . . . 590 561 576 5 .2 313 318 308 –1 .6 0 .64 0 .64 921 .9 489 .1 Avon city, Bon Homme CountyBadger town, Kingsbury County . . . . . . . . . . . . . . . . . . . . 107 144 114 –25 .7 57 66 53 –13 .6 1 .06 1 .06 100 .9 53 .8 Badger town, Kingsbury CountyBaltic city, Minnehaha County . . . . . . . . . . . . . . . . . . . . . . 1,089 811 666 34 .3 409 311 249 31 .5 0 .76 0 .74 1,471 .6 552 .7 Baltic city, Minnehaha CountyBancroft town, Kingsbury County . . . . . . . . . . . . . . . . . . . 19 37 30 –48 .6 13 15 19 –13 .3 0 .23 0 .23 82 .6 56 .5 Bancroft town, Kingsbury CountyBatesland town, Shannon County . . . . . . . . . . . . . . . . . . . 108 88 124 22 .7 33 34 41 –2 .9 0 .09 0 .09 1,200 .0 366 .7 Batesland town, Shannon CountyBath CDP, Brown County . . . . . . . . . . . . . . . . . . . . . . . . . . 172 (X) (X) (X) 69 (X) (X) (X) 0 .29 0 .29 593 .1 237 .9 Bath CDP, Brown County
Bath Corner CDP, Brown County . . . . . . . . . . . . . . . . . . . . 49 (X) (X) (X) 21 (X) (X) (X) 0 .17 0 .17 288 .2 123 .5 Bath Corner CDP, Brown CountyBelle Fourche city, Butte County . . . . . . . . . . . . . . . . . . . . 5,594 4,565 4,335 22 .5 2,511 2,122 1,973 18 .3 8 .60 8 .53 655 .8 294 .4 Belle Fourche city, Butte CountyBelvidere town, Jackson County . . . . . . . . . . . . . . . . . . . . 49 57 63 –14 .0 40 37 47 8 .1 0 .83 0 .76 64 .5 52 .6 Belvidere town, Jackson CountyBeresford city . . . . . . . . . . . . . . . . . . . . . . . . . . . . . . . . . . . 2,005 2,006 1,849 – 959 919 867 4 .4 1 .78 1 .78 1,126 .4 538 .8 Beresford city Lincoln County . . . . . . . . . . . . . . . . . . . . . . . . . . . . . . . . 359 427 349 –15 .9 188 186 175 1 .1 0 .48 0 .48 747 .9 391 .7 Lincoln County Union County . . . . . . . . . . . . . . . . . . . . . . . . . . . . . . . . . 1,646 1,579 1,500 4 .2 771 733 692 5 .2 1 .31 1 .31 1,256 .5 588 .5 Union CountyBig Stone City city, Grant County . . . . . . . . . . . . . . . . . . . 467 605 669 –22 .8 314 309 323 1 .6 1 .20 1 .20 389 .2 261 .7 Big Stone City city, Grant CountyBijou Hills CDP, Brule County . . . . . . . . . . . . . . . . . . . . . . 6 (X) (X) (X) 3 (X) (X) (X) 5 .25 5 .25 1 .1 0 .6 Bijou Hills CDP, Brule CountyBison town, Perkins County . . . . . . . . . . . . . . . . . . . . . . . . 333 373 451 –10 .7 180 227 237 –20 .7 0 .99 0 .99 336 .4 181 .8 Bison town, Perkins CountyBlackhawk CDP, Meade County . . . . . . . . . . . . . . . . . . . . 2,892 2,432 1,995 18 .9 1,160 871 671 33 .2 4 .88 4 .88 592 .6 237 .7 Blackhawk CDP, Meade County
Blucksberg Mountain CDP, Meade County . . . . . . . . . . . . 462 (X) (X) (X) 205 (X) (X) (X) 0 .67 0 .67 689 .6 306 .0 Blucksberg Mountain CDP, Meade CountyBlunt city, Hughes County . . . . . . . . . . . . . . . . . . . . . . . . . 354 370 342 –4 .3 167 178 172 –6 .2 0 .49 0 .49 722 .4 340 .8 Blunt city, Hughes CountyBonesteel city, Gregory County . . . . . . . . . . . . . . . . . . . . . 275 297 297 –7 .4 170 164 176 3 .7 0 .35 0 .35 785 .7 485 .7 Bonesteel city, Gregory CountyBowdle city, Edmunds County . . . . . . . . . . . . . . . . . . . . . . 502 571 589 –12 .1 267 283 289 –5 .7 0 .64 0 .64 784 .4 417 .2 Bowdle city, Edmunds CountyBox Elder city . . . . . . . . . . . . . . . . . . . . . . . . . . . . . . . . . . . 7,800 2,841 2,680 174 .6 2,828 1,072 1,050 163 .8 13 .92 13 .90 561 .2 203 .5 Box Elder city Meade County . . . . . . . . . . . . . . . . . . . . . . . . . . . . . . . . 2,706 – (X) – 958 – (X) – 1 .34 1 .34 2,019 .4 714 .9 Meade County Pennington County . . . . . . . . . . . . . . . . . . . . . . . . . . . . . 5,094 2,841 2,680 79 .3 1,870 1,072 1,050 74 .4 12 .58 12 .56 405 .6 148 .9 Pennington CountyBradley town, Clark County . . . . . . . . . . . . . . . . . . . . . . . . 72 112 117 –35 .7 53 69 71 –23 .2 0 .25 0 .25 288 .0 212 .0 Bradley town, Clark CountyBrandon city, Minnehaha County . . . . . . . . . . . . . . . . . . . . 8,785 5,693 3,545 54 .3 3,238 1,976 1,144 63 .9 5 .40 5 .37 1,635 .9 603 .0 Brandon city, Minnehaha CountyBrandt town, Deuel County . . . . . . . . . . . . . . . . . . . . . . . . 107 113 123 –5 .3 50 61 62 –18 .0 1 .26 1 .26 84 .9 39 .7 Brandt town, Deuel County
Brant Lake CDP, Lake County . . . . . . . . . . . . . . . . . . . . . . 159 (X) (X) (X) 251 (X) (X) (X) 2 .73 1 .19 133 .6 210 .9 Brant Lake CDP, Lake CountyBrentford town, Spink County . . . . . . . . . . . . . . . . . . . . . . 77 65 69 18 .5 33 29 32 13 .8 0 .16 0 .16 481 .3 206 .3 Brentford town, Spink CountyBridgewater city, McCook County . . . . . . . . . . . . . . . . . . . 492 607 533 –18 .9 254 266 265 –4 .5 1 .13 1 .13 435 .4 224 .8 Bridgewater city, McCook CountyBristol city, Day County . . . . . . . . . . . . . . . . . . . . . . . . . . . 341 377 419 –9 .5 176 186 208 –5 .4 0 .53 0 .52 655 .8 338 .5 Bristol city, Day CountyBritton city, Marshall County . . . . . . . . . . . . . . . . . . . . . . . 1,241 1,328 1,394 –6 .6 658 667 681 –1 .3 0 .73 0 .73 1,700 .0 901 .4 Britton city, Marshall CountyBroadland town, Beadle County . . . . . . . . . . . . . . . . . . . . 31 38 40 –18 .4 18 15 23 20 .0 1 .01 1 .01 30 .7 17 .8 Broadland town, Beadle CountyBrookings city, Brookings County . . . . . . . . . . . . . . . . . . . 22,056 18,504 16,270 19 .2 8,715 7,359 6,012 18 .4 13 .04 12 .94 1,704 .5 673 .5 Brookings city, Brookings CountyBruce city, Brookings County . . . . . . . . . . . . . . . . . . . . . . . 204 272 235 –25 .0 111 117 104 –5 .1 0 .38 0 .37 551 .4 300 .0 Bruce city, Brookings CountyBryant city, Hamlin County . . . . . . . . . . . . . . . . . . . . . . . . 456 396 374 15 .2 196 204 212 –3 .9 0 .52 0 .52 876 .9 376 .9 Bryant city, Hamlin CountyBuffalo town, Harding County . . . . . . . . . . . . . . . . . . . . . . 330 380 488 –13 .2 220 243 240 –9 .5 0 .55 0 .55 600 .0 400 .0 Buffalo town, Harding County
Buffalo Gap town, Custer County . . . . . . . . . . . . . . . . . . . 126 164 173 –23 .2 85 88 78 –3 .4 0 .31 0 .31 406 .5 274 .2 Buffalo Gap town, Custer CountyBullhead CDP, Corson County . . . . . . . . . . . . . . . . . . . . . . 348 308 179 13 .0 82 74 53 10 .8 3 .09 3 .01 115 .6 27 .2 Bullhead CDP, Corson CountyBurke city, Gregory County . . . . . . . . . . . . . . . . . . . . . . . . 604 676 756 –10 .7 398 385 392 3 .4 0 .56 0 .56 1,078 .6 710 .7 Burke city, Gregory CountyBushnell town, Brookings County . . . . . . . . . . . . . . . . . . . 65 75 81 –13 .3 32 34 30 –5 .9 0 .71 0 .71 91 .5 45 .1 Bushnell town, Brookings CountyButler town, Day County . . . . . . . . . . . . . . . . . . . . . . . . . . 17 17 17 – 12 7 9 71 .4 0 .29 0 .29 58 .6 41 .4 Butler town, Day CountyCamp Crook town, Harding County . . . . . . . . . . . . . . . . . . 63 56 146 12 .5 46 51 55 –9 .8 0 .14 0 .14 450 .0 328 .6 Camp Crook town, Harding CountyCanistota city, McCook County . . . . . . . . . . . . . . . . . . . . . 656 700 608 –6 .3 281 275 268 2 .2 0 .56 0 .56 1,171 .4 501 .8 Canistota city, McCook CountyCanova town, Miner County . . . . . . . . . . . . . . . . . . . . . . . 105 140 172 –25 .0 59 72 83 –18 .1 0 .31 0 .31 338 .7 190 .3 Canova town, Miner CountyCanton city, Lincoln County . . . . . . . . . . . . . . . . . . . . . . . . 3,057 3,110 2,787 –1 .7 1,351 1,286 1,180 5 .1 3 .22 3 .19 958 .3 423 .5 Canton city, Lincoln CountyCarthage city, Miner County . . . . . . . . . . . . . . . . . . . . . . . 144 187 221 –23 .0 136 143 157 –4 .9 1 .49 1 .46 98 .6 93 .2 Carthage city, Miner County

Population and Housing Unit Counts South Dakota 33U.S. Census Bureau, 2010 Census
Table 9. Population and Housing Units: 1990 to 2010; and Area Measurements and Density: 2010—Con.[For information concerning historical counts and geographic change, see “User Notes .” For information on confidentiality, nonsampling error, and definitions, see Appendixes]
Area measurements in square miles Average per square mile of land
StatePlace and [in Selected States] County Subdivision
Total area Land area Population density Housing unit density
77,115 .68 75,811 .00 10 .7 4 .8 South Dakota
15 .61 15 .50 1,683 .3 784 .4 Aberdeen city, Brown County0 .16 0 .16 475 .0 300 .0 Agar town, Sully County5 .71 5 .71 31 .7 7 .7 Agency Village CDP, Roberts County0 .61 0 .61 68 .9 282 .0 Akaska town, Walworth County0 .13 0 .13 123 .1 53 .8 Albee town, Grant County0 .33 0 .33 2,445 .5 1,236 .4 Alcester city, Union County0 .62 0 .62 991 .9 401 .6 Alexandria city, Hanson County3 .24 3 .24 129 .6 25 .9 Allen CDP, Bennett County1 .64 1 .63 175 .5 76 .1 Alpena town, Jerauld County1 .25 1 .25 27 .2 13 .6 Altamont town, Deuel County
0 .99 0 .98 378 .6 137 .8 Anderson CDP, Minnehaha County0 .27 0 .27 337 .0 222 .2 Andover town, Day County2 .29 2 .29 360 .7 108 .3 Antelope CDP, Todd County1 .66 1 .66 551 .2 294 .6 Arlington city0 .45 0 .45 17 .8 4 .4 Brookings County1 .21 1 .21 749 .6 402 .5 Kingsbury County0 .95 0 .94 743 .6 402 .1 Armour city, Douglas County0 .10 0 .10 90 .0 170 .0 Artas town, Campbell County0 .55 0 .55 250 .9 174 .5 Artesian town, Sanborn County2 .92 2 .92 258 .2 120 .2 Ashland Heights CDP, Pennington County
0 .44 0 .44 277 .3 145 .5 Ashton city, Spink County0 .16 0 .16 868 .8 462 .5 Astoria town, Deuel County0 .46 0 .46 1,156 .5 556 .5 Aurora town, Brookings County0 .04 0 .04 300 .0 300 .0 Aurora Center CDP, Aurora County0 .64 0 .64 921 .9 489 .1 Avon city, Bon Homme County1 .06 1 .06 100 .9 53 .8 Badger town, Kingsbury County0 .76 0 .74 1,471 .6 552 .7 Baltic city, Minnehaha County0 .23 0 .23 82 .6 56 .5 Bancroft town, Kingsbury County0 .09 0 .09 1,200 .0 366 .7 Batesland town, Shannon County0 .29 0 .29 593 .1 237 .9 Bath CDP, Brown County
0 .17 0 .17 288 .2 123 .5 Bath Corner CDP, Brown County8 .60 8 .53 655 .8 294 .4 Belle Fourche city, Butte County0 .83 0 .76 64 .5 52 .6 Belvidere town, Jackson County1 .78 1 .78 1,126 .4 538 .8 Beresford city0 .48 0 .48 747 .9 391 .7 Lincoln County1 .31 1 .31 1,256 .5 588 .5 Union County1 .20 1 .20 389 .2 261 .7 Big Stone City city, Grant County5 .25 5 .25 1 .1 0 .6 Bijou Hills CDP, Brule County0 .99 0 .99 336 .4 181 .8 Bison town, Perkins County4 .88 4 .88 592 .6 237 .7 Blackhawk CDP, Meade County
0 .67 0 .67 689 .6 306 .0 Blucksberg Mountain CDP, Meade County0 .49 0 .49 722 .4 340 .8 Blunt city, Hughes County0 .35 0 .35 785 .7 485 .7 Bonesteel city, Gregory County0 .64 0 .64 784 .4 417 .2 Bowdle city, Edmunds County
13 .92 13 .90 561 .2 203 .5 Box Elder city1 .34 1 .34 2,019 .4 714 .9 Meade County
12 .58 12 .56 405 .6 148 .9 Pennington County0 .25 0 .25 288 .0 212 .0 Bradley town, Clark County5 .40 5 .37 1,635 .9 603 .0 Brandon city, Minnehaha County1 .26 1 .26 84 .9 39 .7 Brandt town, Deuel County
2 .73 1 .19 133 .6 210 .9 Brant Lake CDP, Lake County0 .16 0 .16 481 .3 206 .3 Brentford town, Spink County1 .13 1 .13 435 .4 224 .8 Bridgewater city, McCook County0 .53 0 .52 655 .8 338 .5 Bristol city, Day County0 .73 0 .73 1,700 .0 901 .4 Britton city, Marshall County1 .01 1 .01 30 .7 17 .8 Broadland town, Beadle County
13 .04 12 .94 1,704 .5 673 .5 Brookings city, Brookings County0 .38 0 .37 551 .4 300 .0 Bruce city, Brookings County0 .52 0 .52 876 .9 376 .9 Bryant city, Hamlin County0 .55 0 .55 600 .0 400 .0 Buffalo town, Harding County
0 .31 0 .31 406 .5 274 .2 Buffalo Gap town, Custer County3 .09 3 .01 115 .6 27 .2 Bullhead CDP, Corson County0 .56 0 .56 1,078 .6 710 .7 Burke city, Gregory County0 .71 0 .71 91 .5 45 .1 Bushnell town, Brookings County0 .29 0 .29 58 .6 41 .4 Butler town, Day County0 .14 0 .14 450 .0 328 .6 Camp Crook town, Harding County0 .56 0 .56 1,171 .4 501 .8 Canistota city, McCook County0 .31 0 .31 338 .7 190 .3 Canova town, Miner County3 .22 3 .19 958 .3 423 .5 Canton city, Lincoln County1 .49 1 .46 98 .6 93 .2 Carthage city, Miner County
Table 9. Population and Housing Units: 1990 to 2010; and Area Measurements and Density: 2010—Con.[For information concerning historical counts and geographic change, see “User Notes .” For information on confidentiality, nonsampling error, and definitions, see Appendixes]
StatePlace and [in Selected States] County Subdivision
Population Housing units
2010 2000 1990
Percent change 2000 to
2010 2010 2000 1990
Percent change 2000 to
2010
South Dakota . . . . . . . . . . . . . . . . . . . . . . . . . . . . . 814,180 754,844 696,004 7 .9 363,438 323,208 292,436 12 .4
Aberdeen city, Brown County . . . . . . . . . . . . . . . . . . . . . . 26,091 24,658 24,995 5 .8 12,158 11,259 10,709 8 .0Agar town, Sully County . . . . . . . . . . . . . . . . . . . . . . . . . . 76 82 82 –7 .3 48 54 42 –11 .1Agency Village CDP, Roberts County . . . . . . . . . . . . . . . . 181 (X) (X) (X) 44 (X) (X) (X)Akaska town, Walworth County . . . . . . . . . . . . . . . . . . . . . 42 31 52 35 .5 172 188 114 –8 .5Albee town, Grant County . . . . . . . . . . . . . . . . . . . . . . . . . 16 10 15 60 .0 7 6 11 16 .7Alcester city, Union County . . . . . . . . . . . . . . . . . . . . . . . . 807 880 843 –8 .3 408 430 409 –5 .1Alexandria city, Hanson County . . . . . . . . . . . . . . . . . . . . . 615 563 518 9 .2 249 251 261 –0 .8Allen CDP, Bennett County . . . . . . . . . . . . . . . . . . . . . . . . 420 419 (X) 0 .2 84 87 (X) –3 .4Alpena town, Jerauld County . . . . . . . . . . . . . . . . . . . . . . . 286 265 251 7 .9 124 122 121 1 .6Altamont town, Deuel County . . . . . . . . . . . . . . . . . . . . . . 34 34 48 – 17 18 24 –5 .6
Anderson CDP, Minnehaha County . . . . . . . . . . . . . . . . . . 371 (X) (X) (X) 135 (X) (X) (X)Andover town, Day County . . . . . . . . . . . . . . . . . . . . . . . . 91 99 106 –8 .1 60 62 69 –3 .2Antelope CDP, Todd County . . . . . . . . . . . . . . . . . . . . . . . 826 867 744 –4 .7 248 233 218 6 .4Arlington city . . . . . . . . . . . . . . . . . . . . . . . . . . . . . . . . . . . 915 992 908 –7 .8 489 473 442 3 .4 Brookings County . . . . . . . . . . . . . . . . . . . . . . . . . . . . . . 8 5 6 60 .0 2 2 2 – Kingsbury County . . . . . . . . . . . . . . . . . . . . . . . . . . . . . . 907 987 902 –8 .1 487 471 440 3 .4Armour city, Douglas County . . . . . . . . . . . . . . . . . . . . . . . 699 782 854 –10 .6 378 377 389 0 .3Artas town, Campbell County . . . . . . . . . . . . . . . . . . . . . . 9 13 28 –30 .8 17 17 19 –Artesian town, Sanborn County . . . . . . . . . . . . . . . . . . . . . 138 157 217 –12 .1 96 99 119 –3 .0Ashland Heights CDP, Pennington County . . . . . . . . . . . . 754 837 (X) –9 .9 351 355 (X) –1 .1
Ashton city, Spink County . . . . . . . . . . . . . . . . . . . . . . . . . 122 152 148 –19 .7 64 72 86 –11 .1Astoria town, Deuel County . . . . . . . . . . . . . . . . . . . . . . . . 139 150 155 –7 .3 74 75 79 –1 .3Aurora town, Brookings County . . . . . . . . . . . . . . . . . . . . . 532 500 619 6 .4 256 221 210 15 .8Aurora Center CDP, Aurora County . . . . . . . . . . . . . . . . . . 12 15 (X) –20 .0 12 9 (X) 33 .3Avon city, Bon Homme County . . . . . . . . . . . . . . . . . . . . . 590 561 576 5 .2 313 318 308 –1 .6Badger town, Kingsbury County . . . . . . . . . . . . . . . . . . . . 107 144 114 –25 .7 57 66 53 –13 .6Baltic city, Minnehaha County . . . . . . . . . . . . . . . . . . . . . . 1,089 811 666 34 .3 409 311 249 31 .5Bancroft town, Kingsbury County . . . . . . . . . . . . . . . . . . . 19 37 30 –48 .6 13 15 19 –13 .3Batesland town, Shannon County . . . . . . . . . . . . . . . . . . . 108 88 124 22 .7 33 34 41 –2 .9Bath CDP, Brown County . . . . . . . . . . . . . . . . . . . . . . . . . . 172 (X) (X) (X) 69 (X) (X) (X)
Bath Corner CDP, Brown County . . . . . . . . . . . . . . . . . . . . 49 (X) (X) (X) 21 (X) (X) (X)Belle Fourche city, Butte County . . . . . . . . . . . . . . . . . . . . 5,594 4,565 4,335 22 .5 2,511 2,122 1,973 18 .3Belvidere town, Jackson County . . . . . . . . . . . . . . . . . . . . 49 57 63 –14 .0 40 37 47 8 .1Beresford city . . . . . . . . . . . . . . . . . . . . . . . . . . . . . . . . . . . 2,005 2,006 1,849 – 959 919 867 4 .4 Lincoln County . . . . . . . . . . . . . . . . . . . . . . . . . . . . . . . . 359 427 349 –15 .9 188 186 175 1 .1 Union County . . . . . . . . . . . . . . . . . . . . . . . . . . . . . . . . . 1,646 1,579 1,500 4 .2 771 733 692 5 .2Big Stone City city, Grant County . . . . . . . . . . . . . . . . . . . 467 605 669 –22 .8 314 309 323 1 .6Bijou Hills CDP, Brule County . . . . . . . . . . . . . . . . . . . . . . 6 (X) (X) (X) 3 (X) (X) (X)Bison town, Perkins County . . . . . . . . . . . . . . . . . . . . . . . . 333 373 451 –10 .7 180 227 237 –20 .7Blackhawk CDP, Meade County . . . . . . . . . . . . . . . . . . . . 2,892 2,432 1,995 18 .9 1,160 871 671 33 .2
Blucksberg Mountain CDP, Meade County . . . . . . . . . . . . 462 (X) (X) (X) 205 (X) (X) (X)Blunt city, Hughes County . . . . . . . . . . . . . . . . . . . . . . . . . 354 370 342 –4 .3 167 178 172 –6 .2Bonesteel city, Gregory County . . . . . . . . . . . . . . . . . . . . . 275 297 297 –7 .4 170 164 176 3 .7Bowdle city, Edmunds County . . . . . . . . . . . . . . . . . . . . . . 502 571 589 –12 .1 267 283 289 –5 .7Box Elder city . . . . . . . . . . . . . . . . . . . . . . . . . . . . . . . . . . . 7,800 2,841 2,680 174 .6 2,828 1,072 1,050 163 .8 Meade County . . . . . . . . . . . . . . . . . . . . . . . . . . . . . . . . 2,706 – (X) – 958 – (X) – Pennington County . . . . . . . . . . . . . . . . . . . . . . . . . . . . . 5,094 2,841 2,680 79 .3 1,870 1,072 1,050 74 .4Bradley town, Clark County . . . . . . . . . . . . . . . . . . . . . . . . 72 112 117 –35 .7 53 69 71 –23 .2Brandon city, Minnehaha County . . . . . . . . . . . . . . . . . . . . 8,785 5,693 3,545 54 .3 3,238 1,976 1,144 63 .9Brandt town, Deuel County . . . . . . . . . . . . . . . . . . . . . . . . 107 113 123 –5 .3 50 61 62 –18 .0
Brant Lake CDP, Lake County . . . . . . . . . . . . . . . . . . . . . . 159 (X) (X) (X) 251 (X) (X) (X)Brentford town, Spink County . . . . . . . . . . . . . . . . . . . . . . 77 65 69 18 .5 33 29 32 13 .8Bridgewater city, McCook County . . . . . . . . . . . . . . . . . . . 492 607 533 –18 .9 254 266 265 –4 .5Bristol city, Day County . . . . . . . . . . . . . . . . . . . . . . . . . . . 341 377 419 –9 .5 176 186 208 –5 .4Britton city, Marshall County . . . . . . . . . . . . . . . . . . . . . . . 1,241 1,328 1,394 –6 .6 658 667 681 –1 .3Broadland town, Beadle County . . . . . . . . . . . . . . . . . . . . 31 38 40 –18 .4 18 15 23 20 .0Brookings city, Brookings County . . . . . . . . . . . . . . . . . . . 22,056 18,504 16,270 19 .2 8,715 7,359 6,012 18 .4Bruce city, Brookings County . . . . . . . . . . . . . . . . . . . . . . . 204 272 235 –25 .0 111 117 104 –5 .1Bryant city, Hamlin County . . . . . . . . . . . . . . . . . . . . . . . . 456 396 374 15 .2 196 204 212 –3 .9Buffalo town, Harding County . . . . . . . . . . . . . . . . . . . . . . 330 380 488 –13 .2 220 243 240 –9 .5
Buffalo Gap town, Custer County . . . . . . . . . . . . . . . . . . . 126 164 173 –23 .2 85 88 78 –3 .4Bullhead CDP, Corson County . . . . . . . . . . . . . . . . . . . . . . 348 308 179 13 .0 82 74 53 10 .8Burke city, Gregory County . . . . . . . . . . . . . . . . . . . . . . . . 604 676 756 –10 .7 398 385 392 3 .4Bushnell town, Brookings County . . . . . . . . . . . . . . . . . . . 65 75 81 –13 .3 32 34 30 –5 .9Butler town, Day County . . . . . . . . . . . . . . . . . . . . . . . . . . 17 17 17 – 12 7 9 71 .4Camp Crook town, Harding County . . . . . . . . . . . . . . . . . . 63 56 146 12 .5 46 51 55 –9 .8Canistota city, McCook County . . . . . . . . . . . . . . . . . . . . . 656 700 608 –6 .3 281 275 268 2 .2Canova town, Miner County . . . . . . . . . . . . . . . . . . . . . . . 105 140 172 –25 .0 59 72 83 –18 .1Canton city, Lincoln County . . . . . . . . . . . . . . . . . . . . . . . . 3,057 3,110 2,787 –1 .7 1,351 1,286 1,180 5 .1Carthage city, Miner County . . . . . . . . . . . . . . . . . . . . . . . 144 187 221 –23 .0 136 143 157 –4 .9

34 South Dakota Population and Housing Unit CountsU.S. Census Bureau, 2010 Census
Table 9. Population and Housing Units: 1990 to 2010; and Area Measurements and Density: 2010—Con.[For information concerning historical counts and geographic change, see “User Notes .” For information on confidentiality, nonsampling error, and definitions, see Appendixes]
StatePlace and [in Selected States] County Subdivision
Population Housing units
2010 2000 1990
Percent change 2000 to
2010 2010 2000 1990
Percent change 2000 to
2010
Castlewood city, Hamlin County . . . . . . . . . . . . . . . . . . . . 627 666 549 –5 .9 292 265 233 10 .2Cavour town, Beadle County . . . . . . . . . . . . . . . . . . . . . . . 114 141 166 –19 .1 61 71 71 –14 .1Centerville city, Turner County . . . . . . . . . . . . . . . . . . . . . . 882 910 887 –3 .1 425 429 423 –0 .9Central City city, Lawrence County . . . . . . . . . . . . . . . . . . 134 149 185 –10 .1 78 76 67 2 .6Chamberlain city, Brule County . . . . . . . . . . . . . . . . . . . . . 2,387 2,338 2,347 2 .1 1,142 1,044 1,024 9 .4Chancellor town, Turner County . . . . . . . . . . . . . . . . . . . . 264 328 276 –19 .5 131 142 132 –7 .7Chelsea town, Faulk County . . . . . . . . . . . . . . . . . . . . . . . 27 33 33 –18 .2 15 15 14 –Chester CDP, Lake County . . . . . . . . . . . . . . . . . . . . . . . . 261 (X) (X) (X) 116 (X) (X) (X)Claire City town, Roberts County . . . . . . . . . . . . . . . . . . . 76 85 85 –10 .6 39 42 44 –7 .1Claremont town, Brown County . . . . . . . . . . . . . . . . . . . . . 127 130 135 –2 .3 61 75 73 –18 .7
Clark city, Clark County . . . . . . . . . . . . . . . . . . . . . . . . . . . 1,139 1,285 1,292 –11 .4 627 632 631 –0 .8Clear Lake city, Deuel County . . . . . . . . . . . . . . . . . . . . . . 1,273 1,335 1,247 –4 .6 617 607 589 1 .6Colman city, Moody County . . . . . . . . . . . . . . . . . . . . . . . . 594 572 482 3 .8 263 259 224 1 .5Colome city, Tripp County . . . . . . . . . . . . . . . . . . . . . . . . . 296 340 309 –12 .9 174 170 171 2 .4Colonial Pine Hills CDP, Pennington County . . . . . . . . . . . 2,493 2,561 1,553 –2 .7 903 867 540 4 .2Colton city, Minnehaha County . . . . . . . . . . . . . . . . . . . . . 687 662 657 3 .8 320 285 284 12 .3Columbia city, Brown County . . . . . . . . . . . . . . . . . . . . . . . 136 140 133 –2 .9 80 76 72 5 .3Conde city, Spink County . . . . . . . . . . . . . . . . . . . . . . . . . . 140 187 203 –25 .1 111 119 124 –6 .7Corn Creek CDP, Mellette County . . . . . . . . . . . . . . . . . . . 105 (X) (X) (X) 29 (X) (X) (X)Corona town, Roberts County . . . . . . . . . . . . . . . . . . . . . . 109 112 118 –2 .7 61 63 63 –3 .2
Corsica city, Douglas County . . . . . . . . . . . . . . . . . . . . . . . 592 644 619 –8 .1 286 271 259 5 .5Cottonwood town, Jackson County . . . . . . . . . . . . . . . . . . 9 6 12 50 .0 9 5 6 80 .0Cow Creek CDP, Sully County . . . . . . . . . . . . . . . . . . . . . . 30 (X) (X) (X) 44 (X) (X) (X)Cresbard town, Faulk County . . . . . . . . . . . . . . . . . . . . . . 104 143 185 –27 .3 85 89 95 –4 .5Crocker CDP, Clark County . . . . . . . . . . . . . . . . . . . . . . . . 19 (X) (X) (X) 19 (X) (X) (X)Crooks city, Minnehaha County . . . . . . . . . . . . . . . . . . . . . 1,269 859 671 47 .7 440 289 215 52 .2Custer city, Custer County . . . . . . . . . . . . . . . . . . . . . . . . . 2,067 1,860 1,741 11 .1 1,129 934 792 20 .9Dakota Dunes CDP, Union County . . . . . . . . . . . . . . . . . . 2,540 (X) (X) (X) 1,050 (X) (X) (X)Dallas town, Gregory County . . . . . . . . . . . . . . . . . . . . . . . 120 144 142 –16 .7 74 68 74 8 .8Dante town, Charles Mix County . . . . . . . . . . . . . . . . . . . . 84 82 98 2 .4 35 37 39 –5 .4
Davis town, Turner County . . . . . . . . . . . . . . . . . . . . . . . . . 85 104 87 –18 .3 51 55 45 –7 .3Deadwood city, Lawrence County . . . . . . . . . . . . . . . . . . . 1,270 1,380 1,830 –8 .0 803 817 896 –1 .7Dell Rapids city, Minnehaha County . . . . . . . . . . . . . . . . . 3,633 2,980 2,484 21 .9 1,495 1,181 955 26 .6Delmont city, Douglas County . . . . . . . . . . . . . . . . . . . . . . 234 263 235 –11 .0 141 133 148 6 .0De Smet city, Kingsbury County . . . . . . . . . . . . . . . . . . . . 1,089 1,164 1,172 –6 .4 552 582 555 –5 .2Dimock town, Hutchinson County . . . . . . . . . . . . . . . . . . . 125 151 157 –17 .2 61 63 65 –3 .2Doland city, Spink County . . . . . . . . . . . . . . . . . . . . . . . . . 180 297 306 –39 .4 131 159 158 –17 .6Dolton town, Turner County . . . . . . . . . . . . . . . . . . . . . . . . 37 41 43 –9 .8 22 26 29 –15 .4Draper town, Jones County . . . . . . . . . . . . . . . . . . . . . . . . 82 92 123 –10 .9 48 57 74 –15 .8Dupree city, Ziebach County . . . . . . . . . . . . . . . . . . . . . . . 525 434 484 21 .0 203 171 203 18 .7
Eagle Butte city . . . . . . . . . . . . . . . . . . . . . . . . . . . . . . . . . 1,318 619 489 112 .9 414 262 184 58 .0 Dewey County . . . . . . . . . . . . . . . . . . . . . . . . . . . . . . . . 521 420 475 24 .0 227 195 181 16 .4 Ziebach County . . . . . . . . . . . . . . . . . . . . . . . . . . . . . . . 797 199 14 300 .5 187 67 3 179 .1Eden town, Marshall County . . . . . . . . . . . . . . . . . . . . . . . 89 97 97 –8 .2 63 61 68 3 .3Edgemont city, Fall River County . . . . . . . . . . . . . . . . . . . . 774 867 906 –10 .7 509 516 564 –1 .4Egan city, Moody County . . . . . . . . . . . . . . . . . . . . . . . . . . 278 265 244 4 .9 127 119 110 6 .7Elk Point city, Union County . . . . . . . . . . . . . . . . . . . . . . . . 1,963 1,714 1,423 14 .5 830 750 597 10 .7Elkton city, Brookings County . . . . . . . . . . . . . . . . . . . . . . 736 677 602 8 .7 324 289 269 12 .1Emery city, Hanson County . . . . . . . . . . . . . . . . . . . . . . . . 447 439 417 1 .8 210 204 210 2 .9Erwin town, Kingsbury County . . . . . . . . . . . . . . . . . . . . . . 45 58 42 –22 .4 29 34 42 –14 .7
Estelline city, Hamlin County . . . . . . . . . . . . . . . . . . . . . . . 768 675 658 13 .8 321 311 300 3 .2Ethan town, Davison County . . . . . . . . . . . . . . . . . . . . . . . 331 330 312 0 .3 142 138 134 2 .9Eureka city, McPherson County . . . . . . . . . . . . . . . . . . . . . 868 1,101 1,197 –21 .2 649 625 644 3 .8Fairburn town, Custer County . . . . . . . . . . . . . . . . . . . . . . 85 80 62 6 .3 47 41 34 14 .6Fairfax town, Gregory County . . . . . . . . . . . . . . . . . . . . . . 115 123 144 –6 .5 81 76 93 6 .6Fairview town, Lincoln County . . . . . . . . . . . . . . . . . . . . . . 60 94 73 –36 .2 31 34 34 –8 .8Faith city, Meade County . . . . . . . . . . . . . . . . . . . . . . . . . . 421 489 548 –13 .9 236 274 249 –13 .9Farmer town, Hanson County . . . . . . . . . . . . . . . . . . . . . . 10 18 23 –44 .4 9 10 12 –10 .0Faulkton city, Faulk County . . . . . . . . . . . . . . . . . . . . . . . . 736 785 809 –6 .2 418 413 427 1 .2Fedora CDP, Miner County . . . . . . . . . . . . . . . . . . . . . . . . 37 (X) (X) (X) 21 (X) (X) (X)
Ferney CDP, Brown County . . . . . . . . . . . . . . . . . . . . . . . . 43 (X) (X) (X) 24 (X) (X) (X)Flandreau city, Moody County . . . . . . . . . . . . . . . . . . . . . . 2,341 2,376 2,311 –1 .5 1,091 1,090 1,010 0 .1Florence town, Codington County . . . . . . . . . . . . . . . . . . . 374 299 192 25 .1 159 112 79 42 .0Forestburg CDP, Sanborn County . . . . . . . . . . . . . . . . . . . 73 (X) (X) (X) 36 (X) (X) (X)Fort Pierre city, Stanley County . . . . . . . . . . . . . . . . . . . . . 2,078 1,991 1,854 4 .4 959 875 738 9 .6Fort Thompson CDP, Buffalo County . . . . . . . . . . . . . . . . . 1,282 1,375 1,088 –6 .8 343 355 275 –3 .4Frankfort city, Spink County . . . . . . . . . . . . . . . . . . . . . . . . 149 166 192 –10 .2 82 99 100 –17 .2Frederick town, Brown County . . . . . . . . . . . . . . . . . . . . . . 199 255 241 –22 .0 119 140 140 –15 .0Freeman city, Hutchinson County . . . . . . . . . . . . . . . . . . . 1,306 1,317 1,293 –0 .8 672 648 625 3 .7Fruitdale town, Butte County . . . . . . . . . . . . . . . . . . . . . . . 64 62 43 3 .2 32 29 16 10 .3
Fulton town, Hanson County . . . . . . . . . . . . . . . . . . . . . . . 91 86 70 5 .8 44 41 35 7 .3Gann Valley CDP, Buffalo County . . . . . . . . . . . . . . . . . . . 14 (X) (X) (X) 15 (X) (X) (X)Garden City town, Clark County . . . . . . . . . . . . . . . . . . . . 53 72 93 –26 .4 35 46 57 –23 .9
Table 9. Population and Housing Units: 1990 to 2010; and Area Measurements and Density: 2010—Con.[For information concerning historical counts and geographic change, see “User Notes .” For information on confidentiality, nonsampling error, and definitions, see Appendixes]
Area measurements in square miles Average per square mile of land
StatePlace and [in Selected States] County Subdivision
Total area Land area Population density Housing unit density
1 .15 1 .15 545 .2 253 .9 Castlewood city, Hamlin County0 .41 0 .41 278 .0 148 .8 Cavour town, Beadle County0 .72 0 .72 1,225 .0 590 .3 Centerville city, Turner County0 .15 0 .15 893 .3 520 .0 Central City city, Lawrence County7 .84 6 .64 359 .5 172 .0 Chamberlain city, Brule County0 .22 0 .22 1,200 .0 595 .5 Chancellor town, Turner County0 .32 0 .32 84 .4 46 .9 Chelsea town, Faulk County0 .82 0 .82 318 .3 141 .5 Chester CDP, Lake County0 .18 0 .18 422 .2 216 .7 Claire City town, Roberts County0 .26 0 .25 508 .0 244 .0 Claremont town, Brown County
1 .28 1 .28 889 .8 489 .8 Clark city, Clark County3 .25 3 .07 414 .7 201 .0 Clear Lake city, Deuel County1 .88 1 .88 316 .0 139 .9 Colman city, Moody County0 .27 0 .27 1,096 .3 644 .4 Colome city, Tripp County
15 .89 15 .89 156 .9 56 .8 Colonial Pine Hills CDP, Pennington County0 .70 0 .70 981 .4 457 .1 Colton city, Minnehaha County1 .52 1 .52 89 .5 52 .6 Columbia city, Brown County0 .56 0 .56 250 .0 198 .2 Conde city, Spink County2 .10 2 .04 51 .5 14 .2 Corn Creek CDP, Mellette County0 .25 0 .25 436 .0 244 .0 Corona town, Roberts County
0 .84 0 .84 704 .8 340 .5 Corsica city, Douglas County0 .92 0 .92 9 .8 9 .8 Cottonwood town, Jackson County1 .83 1 .83 16 .4 24 .0 Cow Creek CDP, Sully County0 .42 0 .41 253 .7 207 .3 Cresbard town, Faulk County3 .94 3 .63 5 .2 5 .2 Crocker CDP, Clark County0 .77 0 .77 1,648 .1 571 .4 Crooks city, Minnehaha County2 .54 2 .53 817 .0 446 .2 Custer city, Custer County2 .87 2 .44 1,041 .0 430 .3 Dakota Dunes CDP, Union County0 .50 0 .50 240 .0 148 .0 Dallas town, Gregory County0 .44 0 .44 190 .9 79 .5 Dante town, Charles Mix County
0 .43 0 .43 197 .7 118 .6 Davis town, Turner County3 .83 3 .83 331 .6 209 .7 Deadwood city, Lawrence County2 .09 2 .03 1,789 .7 736 .5 Dell Rapids city, Minnehaha County0 .76 0 .76 307 .9 185 .5 Delmont city, Douglas County1 .16 1 .16 938 .8 475 .9 De Smet city, Kingsbury County0 .16 0 .16 781 .3 381 .3 Dimock town, Hutchinson County0 .59 0 .59 305 .1 222 .0 Doland city, Spink County0 .26 0 .26 142 .3 84 .6 Dolton town, Turner County0 .65 0 .65 126 .2 73 .8 Draper town, Jones County0 .39 0 .39 1,346 .2 520 .5 Dupree city, Ziebach County
1 .17 1 .17 1,126 .5 353 .8 Eagle Butte city0 .33 0 .33 1,578 .8 687 .9 Dewey County0 .84 0 .84 948 .8 222 .6 Ziebach County0 .15 0 .15 593 .3 420 .0 Eden town, Marshall County0 .97 0 .97 797 .9 524 .7 Edgemont city, Fall River County1 .07 1 .07 259 .8 118 .7 Egan city, Moody County1 .36 1 .36 1,443 .4 610 .3 Elk Point city, Union County1 .55 1 .55 474 .8 209 .0 Elkton city, Brookings County0 .45 0 .45 993 .3 466 .7 Emery city, Hanson County0 .48 0 .48 93 .8 60 .4 Erwin town, Kingsbury County
0 .95 0 .95 808 .4 337 .9 Estelline city, Hamlin County0 .25 0 .25 1,324 .0 568 .0 Ethan town, Davison County1 .00 0 .93 933 .3 697 .8 Eureka city, McPherson County0 .33 0 .33 257 .6 142 .4 Fairburn town, Custer County0 .30 0 .30 383 .3 270 .0 Fairfax town, Gregory County0 .09 0 .09 666 .7 344 .4 Fairview town, Lincoln County1 .20 1 .20 350 .8 196 .7 Faith city, Meade County0 .08 0 .08 125 .0 112 .5 Farmer town, Hanson County1 .01 1 .01 728 .7 413 .9 Faulkton city, Faulk County3 .36 3 .36 11 .0 6 .3 Fedora CDP, Miner County
1 .00 1 .00 43 .0 24 .0 Ferney CDP, Brown County1 .93 1 .86 1,258 .6 586 .6 Flandreau city, Moody County0 .69 0 .69 542 .0 230 .4 Florence town, Codington County0 .62 0 .60 121 .7 60 .0 Forestburg CDP, Sanborn County3 .15 3 .11 668 .2 308 .4 Fort Pierre city, Stanley County
12 .60 10 .38 123 .5 33 .0 Fort Thompson CDP, Buffalo County0 .79 0 .79 188 .6 103 .8 Frankfort city, Spink County0 .39 0 .39 510 .3 305 .1 Frederick town, Brown County1 .11 1 .11 1,176 .6 605 .4 Freeman city, Hutchinson County0 .27 0 .27 237 .0 118 .5 Fruitdale town, Butte County
0 .85 0 .85 107 .1 51 .8 Fulton town, Hanson County0 .08 0 .08 175 .0 187 .5 Gann Valley CDP, Buffalo County0 .39 0 .39 135 .9 89 .7 Garden City town, Clark County

Population and Housing Unit Counts South Dakota 35U.S. Census Bureau, 2010 Census
Table 9. Population and Housing Units: 1990 to 2010; and Area Measurements and Density: 2010—Con.[For information concerning historical counts and geographic change, see “User Notes .” For information on confidentiality, nonsampling error, and definitions, see Appendixes]
Table 9. Population and Housing Units: 1990 to 2010; and Area Measurements and Density: 2010—Con.[For information concerning historical counts and geographic change, see “User Notes .” For information on confidentiality, nonsampling error, and definitions, see Appendixes]
Area measurements in square miles Average per square mile of land
StatePlace and [in Selected States] County Subdivision
Total area Land area Population density Housing unit density
1 .15 1 .15 545 .2 253 .9 Castlewood city, Hamlin County0 .41 0 .41 278 .0 148 .8 Cavour town, Beadle County0 .72 0 .72 1,225 .0 590 .3 Centerville city, Turner County0 .15 0 .15 893 .3 520 .0 Central City city, Lawrence County7 .84 6 .64 359 .5 172 .0 Chamberlain city, Brule County0 .22 0 .22 1,200 .0 595 .5 Chancellor town, Turner County0 .32 0 .32 84 .4 46 .9 Chelsea town, Faulk County0 .82 0 .82 318 .3 141 .5 Chester CDP, Lake County0 .18 0 .18 422 .2 216 .7 Claire City town, Roberts County0 .26 0 .25 508 .0 244 .0 Claremont town, Brown County
1 .28 1 .28 889 .8 489 .8 Clark city, Clark County3 .25 3 .07 414 .7 201 .0 Clear Lake city, Deuel County1 .88 1 .88 316 .0 139 .9 Colman city, Moody County0 .27 0 .27 1,096 .3 644 .4 Colome city, Tripp County
15 .89 15 .89 156 .9 56 .8 Colonial Pine Hills CDP, Pennington County0 .70 0 .70 981 .4 457 .1 Colton city, Minnehaha County1 .52 1 .52 89 .5 52 .6 Columbia city, Brown County0 .56 0 .56 250 .0 198 .2 Conde city, Spink County2 .10 2 .04 51 .5 14 .2 Corn Creek CDP, Mellette County0 .25 0 .25 436 .0 244 .0 Corona town, Roberts County
0 .84 0 .84 704 .8 340 .5 Corsica city, Douglas County0 .92 0 .92 9 .8 9 .8 Cottonwood town, Jackson County1 .83 1 .83 16 .4 24 .0 Cow Creek CDP, Sully County0 .42 0 .41 253 .7 207 .3 Cresbard town, Faulk County3 .94 3 .63 5 .2 5 .2 Crocker CDP, Clark County0 .77 0 .77 1,648 .1 571 .4 Crooks city, Minnehaha County2 .54 2 .53 817 .0 446 .2 Custer city, Custer County2 .87 2 .44 1,041 .0 430 .3 Dakota Dunes CDP, Union County0 .50 0 .50 240 .0 148 .0 Dallas town, Gregory County0 .44 0 .44 190 .9 79 .5 Dante town, Charles Mix County
0 .43 0 .43 197 .7 118 .6 Davis town, Turner County3 .83 3 .83 331 .6 209 .7 Deadwood city, Lawrence County2 .09 2 .03 1,789 .7 736 .5 Dell Rapids city, Minnehaha County0 .76 0 .76 307 .9 185 .5 Delmont city, Douglas County1 .16 1 .16 938 .8 475 .9 De Smet city, Kingsbury County0 .16 0 .16 781 .3 381 .3 Dimock town, Hutchinson County0 .59 0 .59 305 .1 222 .0 Doland city, Spink County0 .26 0 .26 142 .3 84 .6 Dolton town, Turner County0 .65 0 .65 126 .2 73 .8 Draper town, Jones County0 .39 0 .39 1,346 .2 520 .5 Dupree city, Ziebach County
1 .17 1 .17 1,126 .5 353 .8 Eagle Butte city0 .33 0 .33 1,578 .8 687 .9 Dewey County0 .84 0 .84 948 .8 222 .6 Ziebach County0 .15 0 .15 593 .3 420 .0 Eden town, Marshall County0 .97 0 .97 797 .9 524 .7 Edgemont city, Fall River County1 .07 1 .07 259 .8 118 .7 Egan city, Moody County1 .36 1 .36 1,443 .4 610 .3 Elk Point city, Union County1 .55 1 .55 474 .8 209 .0 Elkton city, Brookings County0 .45 0 .45 993 .3 466 .7 Emery city, Hanson County0 .48 0 .48 93 .8 60 .4 Erwin town, Kingsbury County
0 .95 0 .95 808 .4 337 .9 Estelline city, Hamlin County0 .25 0 .25 1,324 .0 568 .0 Ethan town, Davison County1 .00 0 .93 933 .3 697 .8 Eureka city, McPherson County0 .33 0 .33 257 .6 142 .4 Fairburn town, Custer County0 .30 0 .30 383 .3 270 .0 Fairfax town, Gregory County0 .09 0 .09 666 .7 344 .4 Fairview town, Lincoln County1 .20 1 .20 350 .8 196 .7 Faith city, Meade County0 .08 0 .08 125 .0 112 .5 Farmer town, Hanson County1 .01 1 .01 728 .7 413 .9 Faulkton city, Faulk County3 .36 3 .36 11 .0 6 .3 Fedora CDP, Miner County
1 .00 1 .00 43 .0 24 .0 Ferney CDP, Brown County1 .93 1 .86 1,258 .6 586 .6 Flandreau city, Moody County0 .69 0 .69 542 .0 230 .4 Florence town, Codington County0 .62 0 .60 121 .7 60 .0 Forestburg CDP, Sanborn County3 .15 3 .11 668 .2 308 .4 Fort Pierre city, Stanley County
12 .60 10 .38 123 .5 33 .0 Fort Thompson CDP, Buffalo County0 .79 0 .79 188 .6 103 .8 Frankfort city, Spink County0 .39 0 .39 510 .3 305 .1 Frederick town, Brown County1 .11 1 .11 1,176 .6 605 .4 Freeman city, Hutchinson County0 .27 0 .27 237 .0 118 .5 Fruitdale town, Butte County
0 .85 0 .85 107 .1 51 .8 Fulton town, Hanson County0 .08 0 .08 175 .0 187 .5 Gann Valley CDP, Buffalo County0 .39 0 .39 135 .9 89 .7 Garden City town, Clark County
StatePlace and [in Selected States] County Subdivision
Population Housing units
2010 2000 1990
Percent change 2000 to
2010 2010 2000 1990
Percent change 2000 to
2010
Castlewood city, Hamlin County . . . . . . . . . . . . . . . . . . . . 627 666 549 –5 .9 292 265 233 10 .2Cavour town, Beadle County . . . . . . . . . . . . . . . . . . . . . . . 114 141 166 –19 .1 61 71 71 –14 .1Centerville city, Turner County . . . . . . . . . . . . . . . . . . . . . . 882 910 887 –3 .1 425 429 423 –0 .9Central City city, Lawrence County . . . . . . . . . . . . . . . . . . 134 149 185 –10 .1 78 76 67 2 .6Chamberlain city, Brule County . . . . . . . . . . . . . . . . . . . . . 2,387 2,338 2,347 2 .1 1,142 1,044 1,024 9 .4Chancellor town, Turner County . . . . . . . . . . . . . . . . . . . . 264 328 276 –19 .5 131 142 132 –7 .7Chelsea town, Faulk County . . . . . . . . . . . . . . . . . . . . . . . 27 33 33 –18 .2 15 15 14 –Chester CDP, Lake County . . . . . . . . . . . . . . . . . . . . . . . . 261 (X) (X) (X) 116 (X) (X) (X)Claire City town, Roberts County . . . . . . . . . . . . . . . . . . . 76 85 85 –10 .6 39 42 44 –7 .1Claremont town, Brown County . . . . . . . . . . . . . . . . . . . . . 127 130 135 –2 .3 61 75 73 –18 .7
Clark city, Clark County . . . . . . . . . . . . . . . . . . . . . . . . . . . 1,139 1,285 1,292 –11 .4 627 632 631 –0 .8Clear Lake city, Deuel County . . . . . . . . . . . . . . . . . . . . . . 1,273 1,335 1,247 –4 .6 617 607 589 1 .6Colman city, Moody County . . . . . . . . . . . . . . . . . . . . . . . . 594 572 482 3 .8 263 259 224 1 .5Colome city, Tripp County . . . . . . . . . . . . . . . . . . . . . . . . . 296 340 309 –12 .9 174 170 171 2 .4Colonial Pine Hills CDP, Pennington County . . . . . . . . . . . 2,493 2,561 1,553 –2 .7 903 867 540 4 .2Colton city, Minnehaha County . . . . . . . . . . . . . . . . . . . . . 687 662 657 3 .8 320 285 284 12 .3Columbia city, Brown County . . . . . . . . . . . . . . . . . . . . . . . 136 140 133 –2 .9 80 76 72 5 .3Conde city, Spink County . . . . . . . . . . . . . . . . . . . . . . . . . . 140 187 203 –25 .1 111 119 124 –6 .7Corn Creek CDP, Mellette County . . . . . . . . . . . . . . . . . . . 105 (X) (X) (X) 29 (X) (X) (X)Corona town, Roberts County . . . . . . . . . . . . . . . . . . . . . . 109 112 118 –2 .7 61 63 63 –3 .2
Corsica city, Douglas County . . . . . . . . . . . . . . . . . . . . . . . 592 644 619 –8 .1 286 271 259 5 .5Cottonwood town, Jackson County . . . . . . . . . . . . . . . . . . 9 6 12 50 .0 9 5 6 80 .0Cow Creek CDP, Sully County . . . . . . . . . . . . . . . . . . . . . . 30 (X) (X) (X) 44 (X) (X) (X)Cresbard town, Faulk County . . . . . . . . . . . . . . . . . . . . . . 104 143 185 –27 .3 85 89 95 –4 .5Crocker CDP, Clark County . . . . . . . . . . . . . . . . . . . . . . . . 19 (X) (X) (X) 19 (X) (X) (X)Crooks city, Minnehaha County . . . . . . . . . . . . . . . . . . . . . 1,269 859 671 47 .7 440 289 215 52 .2Custer city, Custer County . . . . . . . . . . . . . . . . . . . . . . . . . 2,067 1,860 1,741 11 .1 1,129 934 792 20 .9Dakota Dunes CDP, Union County . . . . . . . . . . . . . . . . . . 2,540 (X) (X) (X) 1,050 (X) (X) (X)Dallas town, Gregory County . . . . . . . . . . . . . . . . . . . . . . . 120 144 142 –16 .7 74 68 74 8 .8Dante town, Charles Mix County . . . . . . . . . . . . . . . . . . . . 84 82 98 2 .4 35 37 39 –5 .4
Davis town, Turner County . . . . . . . . . . . . . . . . . . . . . . . . . 85 104 87 –18 .3 51 55 45 –7 .3Deadwood city, Lawrence County . . . . . . . . . . . . . . . . . . . 1,270 1,380 1,830 –8 .0 803 817 896 –1 .7Dell Rapids city, Minnehaha County . . . . . . . . . . . . . . . . . 3,633 2,980 2,484 21 .9 1,495 1,181 955 26 .6Delmont city, Douglas County . . . . . . . . . . . . . . . . . . . . . . 234 263 235 –11 .0 141 133 148 6 .0De Smet city, Kingsbury County . . . . . . . . . . . . . . . . . . . . 1,089 1,164 1,172 –6 .4 552 582 555 –5 .2Dimock town, Hutchinson County . . . . . . . . . . . . . . . . . . . 125 151 157 –17 .2 61 63 65 –3 .2Doland city, Spink County . . . . . . . . . . . . . . . . . . . . . . . . . 180 297 306 –39 .4 131 159 158 –17 .6Dolton town, Turner County . . . . . . . . . . . . . . . . . . . . . . . . 37 41 43 –9 .8 22 26 29 –15 .4Draper town, Jones County . . . . . . . . . . . . . . . . . . . . . . . . 82 92 123 –10 .9 48 57 74 –15 .8Dupree city, Ziebach County . . . . . . . . . . . . . . . . . . . . . . . 525 434 484 21 .0 203 171 203 18 .7
Eagle Butte city . . . . . . . . . . . . . . . . . . . . . . . . . . . . . . . . . 1,318 619 489 112 .9 414 262 184 58 .0 Dewey County . . . . . . . . . . . . . . . . . . . . . . . . . . . . . . . . 521 420 475 24 .0 227 195 181 16 .4 Ziebach County . . . . . . . . . . . . . . . . . . . . . . . . . . . . . . . 797 199 14 300 .5 187 67 3 179 .1Eden town, Marshall County . . . . . . . . . . . . . . . . . . . . . . . 89 97 97 –8 .2 63 61 68 3 .3Edgemont city, Fall River County . . . . . . . . . . . . . . . . . . . . 774 867 906 –10 .7 509 516 564 –1 .4Egan city, Moody County . . . . . . . . . . . . . . . . . . . . . . . . . . 278 265 244 4 .9 127 119 110 6 .7Elk Point city, Union County . . . . . . . . . . . . . . . . . . . . . . . . 1,963 1,714 1,423 14 .5 830 750 597 10 .7Elkton city, Brookings County . . . . . . . . . . . . . . . . . . . . . . 736 677 602 8 .7 324 289 269 12 .1Emery city, Hanson County . . . . . . . . . . . . . . . . . . . . . . . . 447 439 417 1 .8 210 204 210 2 .9Erwin town, Kingsbury County . . . . . . . . . . . . . . . . . . . . . . 45 58 42 –22 .4 29 34 42 –14 .7
Estelline city, Hamlin County . . . . . . . . . . . . . . . . . . . . . . . 768 675 658 13 .8 321 311 300 3 .2Ethan town, Davison County . . . . . . . . . . . . . . . . . . . . . . . 331 330 312 0 .3 142 138 134 2 .9Eureka city, McPherson County . . . . . . . . . . . . . . . . . . . . . 868 1,101 1,197 –21 .2 649 625 644 3 .8Fairburn town, Custer County . . . . . . . . . . . . . . . . . . . . . . 85 80 62 6 .3 47 41 34 14 .6Fairfax town, Gregory County . . . . . . . . . . . . . . . . . . . . . . 115 123 144 –6 .5 81 76 93 6 .6Fairview town, Lincoln County . . . . . . . . . . . . . . . . . . . . . . 60 94 73 –36 .2 31 34 34 –8 .8Faith city, Meade County . . . . . . . . . . . . . . . . . . . . . . . . . . 421 489 548 –13 .9 236 274 249 –13 .9Farmer town, Hanson County . . . . . . . . . . . . . . . . . . . . . . 10 18 23 –44 .4 9 10 12 –10 .0Faulkton city, Faulk County . . . . . . . . . . . . . . . . . . . . . . . . 736 785 809 –6 .2 418 413 427 1 .2Fedora CDP, Miner County . . . . . . . . . . . . . . . . . . . . . . . . 37 (X) (X) (X) 21 (X) (X) (X)
Ferney CDP, Brown County . . . . . . . . . . . . . . . . . . . . . . . . 43 (X) (X) (X) 24 (X) (X) (X)Flandreau city, Moody County . . . . . . . . . . . . . . . . . . . . . . 2,341 2,376 2,311 –1 .5 1,091 1,090 1,010 0 .1Florence town, Codington County . . . . . . . . . . . . . . . . . . . 374 299 192 25 .1 159 112 79 42 .0Forestburg CDP, Sanborn County . . . . . . . . . . . . . . . . . . . 73 (X) (X) (X) 36 (X) (X) (X)Fort Pierre city, Stanley County . . . . . . . . . . . . . . . . . . . . . 2,078 1,991 1,854 4 .4 959 875 738 9 .6Fort Thompson CDP, Buffalo County . . . . . . . . . . . . . . . . . 1,282 1,375 1,088 –6 .8 343 355 275 –3 .4Frankfort city, Spink County . . . . . . . . . . . . . . . . . . . . . . . . 149 166 192 –10 .2 82 99 100 –17 .2Frederick town, Brown County . . . . . . . . . . . . . . . . . . . . . . 199 255 241 –22 .0 119 140 140 –15 .0Freeman city, Hutchinson County . . . . . . . . . . . . . . . . . . . 1,306 1,317 1,293 –0 .8 672 648 625 3 .7Fruitdale town, Butte County . . . . . . . . . . . . . . . . . . . . . . . 64 62 43 3 .2 32 29 16 10 .3
Fulton town, Hanson County . . . . . . . . . . . . . . . . . . . . . . . 91 86 70 5 .8 44 41 35 7 .3Gann Valley CDP, Buffalo County . . . . . . . . . . . . . . . . . . . 14 (X) (X) (X) 15 (X) (X) (X)Garden City town, Clark County . . . . . . . . . . . . . . . . . . . . 53 72 93 –26 .4 35 46 57 –23 .9
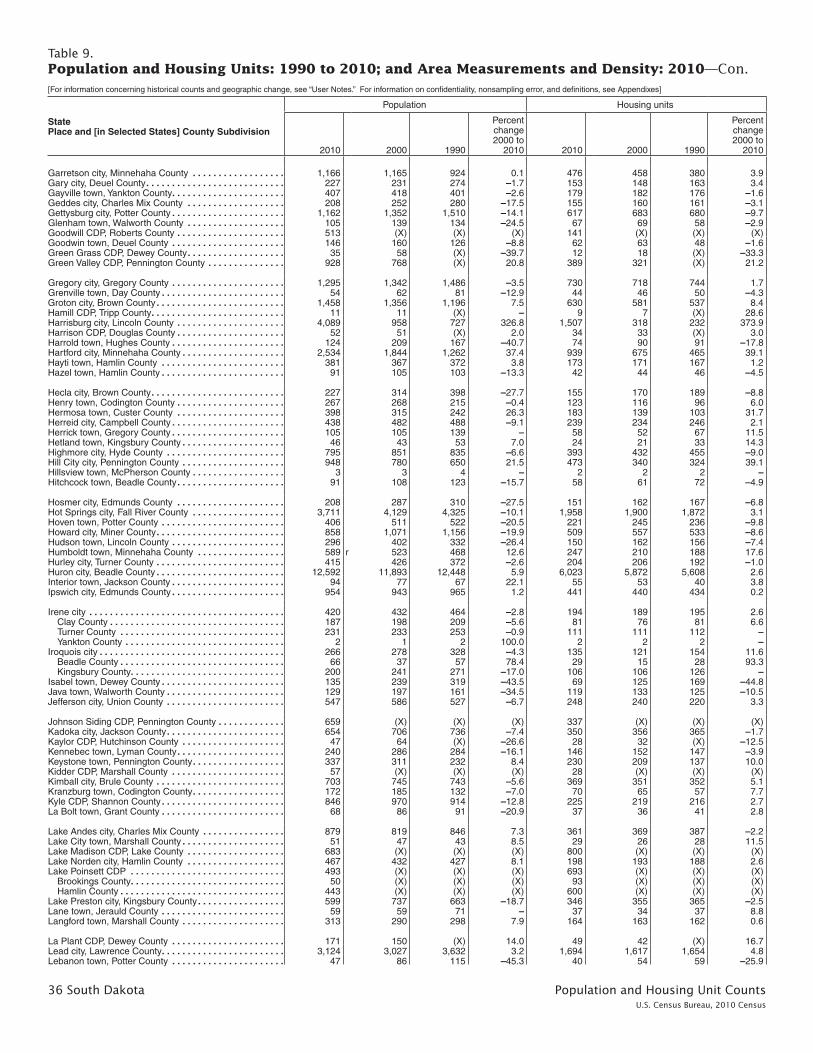
36 South Dakota Population and Housing Unit CountsU.S. Census Bureau, 2010 Census
Table 9. Population and Housing Units: 1990 to 2010; and Area Measurements and Density: 2010—Con.[For information concerning historical counts and geographic change, see “User Notes .” For information on confidentiality, nonsampling error, and definitions, see Appendixes]
StatePlace and [in Selected States] County Subdivision
Population Housing units
2010 2000 1990
Percent change 2000 to
2010 2010 2000 1990
Percent change 2000 to
2010
Garretson city, Minnehaha County . . . . . . . . . . . . . . . . . . 1,166 1,165 924 0 .1 476 458 380 3 .9Gary city, Deuel County . . . . . . . . . . . . . . . . . . . . . . . . . . . 227 231 274 –1 .7 153 148 163 3 .4Gayville town, Yankton County . . . . . . . . . . . . . . . . . . . . . . 407 418 401 –2 .6 179 182 176 –1 .6Geddes city, Charles Mix County . . . . . . . . . . . . . . . . . . . 208 252 280 –17 .5 155 160 161 –3 .1Gettysburg city, Potter County . . . . . . . . . . . . . . . . . . . . . . 1,162 1,352 1,510 –14 .1 617 683 680 –9 .7Glenham town, Walworth County . . . . . . . . . . . . . . . . . . . 105 139 134 –24 .5 67 69 58 –2 .9Goodwill CDP, Roberts County . . . . . . . . . . . . . . . . . . . . . 513 (X) (X) (X) 141 (X) (X) (X)Goodwin town, Deuel County . . . . . . . . . . . . . . . . . . . . . . 146 160 126 –8 .8 62 63 48 –1 .6Green Grass CDP, Dewey County . . . . . . . . . . . . . . . . . . . 35 58 (X) –39 .7 12 18 (X) –33 .3Green Valley CDP, Pennington County . . . . . . . . . . . . . . . 928 768 (X) 20 .8 389 321 (X) 21 .2
Gregory city, Gregory County . . . . . . . . . . . . . . . . . . . . . . 1,295 1,342 1,486 –3 .5 730 718 744 1 .7Grenville town, Day County . . . . . . . . . . . . . . . . . . . . . . . . 54 62 81 –12 .9 44 46 50 –4 .3Groton city, Brown County . . . . . . . . . . . . . . . . . . . . . . . . . 1,458 1,356 1,196 7 .5 630 581 537 8 .4Hamill CDP, Tripp County . . . . . . . . . . . . . . . . . . . . . . . . . . 11 11 (X) – 9 7 (X) 28 .6Harrisburg city, Lincoln County . . . . . . . . . . . . . . . . . . . . . 4,089 958 727 326 .8 1,507 318 232 373 .9Harrison CDP, Douglas County . . . . . . . . . . . . . . . . . . . . . 52 51 (X) 2 .0 34 33 (X) 3 .0Harrold town, Hughes County . . . . . . . . . . . . . . . . . . . . . . 124 209 167 –40 .7 74 90 91 –17 .8Hartford city, Minnehaha County . . . . . . . . . . . . . . . . . . . . 2,534 1,844 1,262 37 .4 939 675 465 39 .1Hayti town, Hamlin County . . . . . . . . . . . . . . . . . . . . . . . . 381 367 372 3 .8 173 171 167 1 .2Hazel town, Hamlin County . . . . . . . . . . . . . . . . . . . . . . . . 91 105 103 –13 .3 42 44 46 –4 .5
Hecla city, Brown County . . . . . . . . . . . . . . . . . . . . . . . . . . 227 314 398 –27 .7 155 170 189 –8 .8Henry town, Codington County . . . . . . . . . . . . . . . . . . . . . 267 268 215 –0 .4 123 116 96 6 .0Hermosa town, Custer County . . . . . . . . . . . . . . . . . . . . . 398 315 242 26 .3 183 139 103 31 .7Herreid city, Campbell County . . . . . . . . . . . . . . . . . . . . . . 438 482 488 –9 .1 239 234 246 2 .1Herrick town, Gregory County . . . . . . . . . . . . . . . . . . . . . . 105 105 139 – 58 52 67 11 .5Hetland town, Kingsbury County . . . . . . . . . . . . . . . . . . . . 46 43 53 7 .0 24 21 33 14 .3Highmore city, Hyde County . . . . . . . . . . . . . . . . . . . . . . . 795 851 835 –6 .6 393 432 455 –9 .0Hill City city, Pennington County . . . . . . . . . . . . . . . . . . . . 948 780 650 21 .5 473 340 324 39 .1Hillsview town, McPherson County . . . . . . . . . . . . . . . . . . 3 3 4 – 2 2 2 –Hitchcock town, Beadle County . . . . . . . . . . . . . . . . . . . . . 91 108 123 –15 .7 58 61 72 –4 .9
Hosmer city, Edmunds County . . . . . . . . . . . . . . . . . . . . . 208 287 310 –27 .5 151 162 167 –6 .8Hot Springs city, Fall River County . . . . . . . . . . . . . . . . . . 3,711 4,129 4,325 –10 .1 1,958 1,900 1,872 3 .1Hoven town, Potter County . . . . . . . . . . . . . . . . . . . . . . . . 406 511 522 –20 .5 221 245 236 –9 .8Howard city, Miner County . . . . . . . . . . . . . . . . . . . . . . . . . 858 1,071 1,156 –19 .9 509 557 533 –8 .6Hudson town, Lincoln County . . . . . . . . . . . . . . . . . . . . . . 296 402 332 –26 .4 150 162 156 –7 .4Humboldt town, Minnehaha County . . . . . . . . . . . . . . . . . 589 r 523 468 12 .6 247 210 188 17 .6Hurley city, Turner County . . . . . . . . . . . . . . . . . . . . . . . . . 415 426 372 –2 .6 204 206 192 –1 .0Huron city, Beadle County . . . . . . . . . . . . . . . . . . . . . . . . . 12,592 11,893 12,448 5 .9 6,023 5,872 5,608 2 .6Interior town, Jackson County . . . . . . . . . . . . . . . . . . . . . . 94 77 67 22 .1 55 53 40 3 .8Ipswich city, Edmunds County . . . . . . . . . . . . . . . . . . . . . . 954 943 965 1 .2 441 440 434 0 .2
Irene city . . . . . . . . . . . . . . . . . . . . . . . . . . . . . . . . . . . . . . 420 432 464 –2 .8 194 189 195 2 .6 Clay County . . . . . . . . . . . . . . . . . . . . . . . . . . . . . . . . . . 187 198 209 –5 .6 81 76 81 6 .6 Turner County . . . . . . . . . . . . . . . . . . . . . . . . . . . . . . . . 231 233 253 –0 .9 111 111 112 – Yankton County . . . . . . . . . . . . . . . . . . . . . . . . . . . . . . . 2 1 2 100 .0 2 2 2 –Iroquois city . . . . . . . . . . . . . . . . . . . . . . . . . . . . . . . . . . . . 266 278 328 –4 .3 135 121 154 11 .6 Beadle County . . . . . . . . . . . . . . . . . . . . . . . . . . . . . . . . 66 37 57 78 .4 29 15 28 93 .3 Kingsbury County . . . . . . . . . . . . . . . . . . . . . . . . . . . . . . 200 241 271 –17 .0 106 106 126 –Isabel town, Dewey County . . . . . . . . . . . . . . . . . . . . . . . . 135 239 319 –43 .5 69 125 169 –44 .8Java town, Walworth County . . . . . . . . . . . . . . . . . . . . . . . 129 197 161 –34 .5 119 133 125 –10 .5Jefferson city, Union County . . . . . . . . . . . . . . . . . . . . . . . 547 586 527 –6 .7 248 240 220 3 .3
Johnson Siding CDP, Pennington County . . . . . . . . . . . . . 659 (X) (X) (X) 337 (X) (X) (X)Kadoka city, Jackson County . . . . . . . . . . . . . . . . . . . . . . . 654 706 736 –7 .4 350 356 365 –1 .7Kaylor CDP, Hutchinson County . . . . . . . . . . . . . . . . . . . . 47 64 (X) –26 .6 28 32 (X) –12 .5Kennebec town, Lyman County . . . . . . . . . . . . . . . . . . . . . 240 286 284 –16 .1 146 152 147 –3 .9Keystone town, Pennington County . . . . . . . . . . . . . . . . . . 337 311 232 8 .4 230 209 137 10 .0Kidder CDP, Marshall County . . . . . . . . . . . . . . . . . . . . . . 57 (X) (X) (X) 28 (X) (X) (X)Kimball city, Brule County . . . . . . . . . . . . . . . . . . . . . . . . . 703 745 743 –5 .6 369 351 352 5 .1Kranzburg town, Codington County . . . . . . . . . . . . . . . . . . 172 185 132 –7 .0 70 65 57 7 .7Kyle CDP, Shannon County . . . . . . . . . . . . . . . . . . . . . . . . 846 970 914 –12 .8 225 219 216 2 .7La Bolt town, Grant County . . . . . . . . . . . . . . . . . . . . . . . . 68 86 91 –20 .9 37 36 41 2 .8
Lake Andes city, Charles Mix County . . . . . . . . . . . . . . . . 879 819 846 7 .3 361 369 387 –2 .2Lake City town, Marshall County . . . . . . . . . . . . . . . . . . . . 51 47 43 8 .5 29 26 28 11 .5Lake Madison CDP, Lake County . . . . . . . . . . . . . . . . . . . 683 (X) (X) (X) 800 (X) (X) (X)Lake Norden city, Hamlin County . . . . . . . . . . . . . . . . . . . 467 432 427 8 .1 198 193 188 2 .6Lake Poinsett CDP . . . . . . . . . . . . . . . . . . . . . . . . . . . . . . 493 (X) (X) (X) 693 (X) (X) (X) Brookings County . . . . . . . . . . . . . . . . . . . . . . . . . . . . . . 50 (X) (X) (X) 93 (X) (X) (X) Hamlin County . . . . . . . . . . . . . . . . . . . . . . . . . . . . . . . . 443 (X) (X) (X) 600 (X) (X) (X)Lake Preston city, Kingsbury County . . . . . . . . . . . . . . . . . 599 737 663 –18 .7 346 355 365 –2 .5Lane town, Jerauld County . . . . . . . . . . . . . . . . . . . . . . . . 59 59 71 – 37 34 37 8 .8Langford town, Marshall County . . . . . . . . . . . . . . . . . . . . 313 290 298 7 .9 164 163 162 0 .6
La Plant CDP, Dewey County . . . . . . . . . . . . . . . . . . . . . . 171 150 (X) 14 .0 49 42 (X) 16 .7Lead city, Lawrence County . . . . . . . . . . . . . . . . . . . . . . . . 3,124 3,027 3,632 3 .2 1,694 1,617 1,654 4 .8Lebanon town, Potter County . . . . . . . . . . . . . . . . . . . . . . 47 86 115 –45 .3 40 54 59 –25 .9
Table 9. Population and Housing Units: 1990 to 2010; and Area Measurements and Density: 2010—Con.[For information concerning historical counts and geographic change, see “User Notes .” For information on confidentiality, nonsampling error, and definitions, see Appendixes]
Area measurements in square miles Average per square mile of land
StatePlace and [in Selected States] County Subdivision
Total area Land area Population density Housing unit density
1 .49 1 .45 804 .1 328 .3 Garretson city, Minnehaha County0 .69 0 .69 329 .0 221 .7 Gary city, Deuel County0 .21 0 .21 1,938 .1 852 .4 Gayville town, Yankton County0 .61 0 .61 341 .0 254 .1 Geddes city, Charles Mix County1 .89 1 .89 614 .8 326 .5 Gettysburg city, Potter County0 .33 0 .33 318 .2 203 .0 Glenham town, Walworth County0 .77 0 .76 675 .0 185 .5 Goodwill CDP, Roberts County0 .47 0 .47 310 .6 131 .9 Goodwin town, Deuel County8 .13 8 .13 4 .3 1 .5 Green Grass CDP, Dewey County3 .84 3 .84 241 .7 101 .3 Green Valley CDP, Pennington County
1 .71 1 .71 757 .3 426 .9 Gregory city, Gregory County0 .24 0 .24 225 .0 183 .3 Grenville town, Day County1 .75 1 .75 833 .1 360 .0 Groton city, Brown County1 .25 1 .22 9 .0 7 .4 Hamill CDP, Tripp County2 .48 2 .48 1,648 .8 607 .7 Harrisburg city, Lincoln County0 .11 0 .11 472 .7 309 .1 Harrison CDP, Douglas County0 .27 0 .27 459 .3 274 .1 Harrold town, Hughes County2 .27 2 .27 1,116 .3 413 .7 Hartford city, Minnehaha County0 .31 0 .31 1,229 .0 558 .1 Hayti town, Hamlin County0 .24 0 .24 379 .2 175 .0 Hazel town, Hamlin County
0 .34 0 .34 667 .6 455 .9 Hecla city, Brown County1 .45 1 .45 184 .1 84 .8 Henry town, Codington County0 .48 0 .48 829 .2 381 .3 Hermosa town, Custer County1 .39 1 .39 315 .1 171 .9 Herreid city, Campbell County0 .52 0 .52 201 .9 111 .5 Herrick town, Gregory County0 .11 0 .11 418 .2 218 .2 Hetland town, Kingsbury County1 .88 1 .88 422 .9 209 .0 Highmore city, Hyde County1 .27 1 .26 752 .4 375 .4 Hill City city, Pennington County0 .64 0 .64 4 .7 3 .1 Hillsview town, McPherson County0 .27 0 .27 337 .0 214 .8 Hitchcock town, Beadle County
0 .99 0 .99 210 .1 152 .5 Hosmer city, Edmunds County3 .61 3 .61 1,028 .0 542 .4 Hot Springs city, Fall River County0 .31 0 .31 1,309 .7 712 .9 Hoven town, Potter County0 .95 0 .95 903 .2 535 .8 Howard city, Miner County0 .28 0 .28 1,057 .1 535 .7 Hudson town, Lincoln County0 .63 0 .62 950 .0 398 .4 Humboldt town, Minnehaha County0 .62 0 .62 669 .4 329 .0 Hurley city, Turner County
10 .56 9 .48 1,328 .3 635 .3 Huron city, Beadle County1 .34 1 .34 70 .1 41 .0 Interior town, Jackson County1 .34 1 .34 711 .9 329 .1 Ipswich city, Edmunds County
0 .26 0 .26 1,615 .4 746 .2 Irene city0 .09 0 .09 2,077 .8 900 .0 Clay County0 .11 0 .11 2,100 .0 1,009 .1 Turner County0 .06 0 .06 33 .3 33 .3 Yankton County0 .62 0 .62 429 .0 217 .7 Iroquois city0 .08 0 .08 825 .0 362 .5 Beadle County0 .54 0 .54 370 .4 196 .3 Kingsbury County0 .91 0 .91 148 .4 75 .8 Isabel town, Dewey County0 .49 0 .49 263 .3 242 .9 Java town, Walworth County0 .50 0 .50 1,094 .0 496 .0 Jefferson city, Union County
3 .73 3 .73 176 .7 90 .3 Johnson Siding CDP, Pennington County2 .31 2 .28 286 .8 153 .5 Kadoka city, Jackson County0 .67 0 .64 73 .4 43 .8 Kaylor CDP, Hutchinson County0 .85 0 .85 282 .4 171 .8 Kennebec town, Lyman County2 .86 2 .86 117 .8 80 .4 Keystone town, Pennington County0 .24 0 .24 237 .5 116 .7 Kidder CDP, Marshall County3 .09 3 .09 227 .5 119 .4 Kimball city, Brule County0 .76 0 .76 226 .3 92 .1 Kranzburg town, Codington County1 .53 1 .47 575 .5 153 .1 Kyle CDP, Shannon County0 .24 0 .24 283 .3 154 .2 La Bolt town, Grant County
0 .82 0 .80 1,098 .8 451 .3 Lake Andes city, Charles Mix County0 .23 0 .22 231 .8 131 .8 Lake City town, Marshall County9 .10 4 .75 143 .8 168 .4 Lake Madison CDP, Lake County0 .88 0 .83 562 .7 238 .6 Lake Norden city, Hamlin County
17 .77 5 .21 94 .6 133 .0 Lake Poinsett CDP1 .19 0 .20 250 .0 465 .0 Brookings County
16 .57 5 .01 88 .4 119 .8 Hamlin County0 .76 0 .76 788 .2 455 .3 Lake Preston city, Kingsbury County0 .46 0 .46 128 .3 80 .4 Lane town, Jerauld County0 .31 0 .31 1,009 .7 529 .0 Langford town, Marshall County
9 .49 9 .45 18 .1 5 .2 La Plant CDP, Dewey County2 .06 2 .06 1,516 .5 822 .3 Lead city, Lawrence County0 .53 0 .53 88 .7 75 .5 Lebanon town, Potter County

Population and Housing Unit Counts South Dakota 37U.S. Census Bureau, 2010 Census
Table 9. Population and Housing Units: 1990 to 2010; and Area Measurements and Density: 2010—Con.[For information concerning historical counts and geographic change, see “User Notes .” For information on confidentiality, nonsampling error, and definitions, see Appendixes]
Area measurements in square miles Average per square mile of land
StatePlace and [in Selected States] County Subdivision
Total area Land area Population density Housing unit density
1 .49 1 .45 804 .1 328 .3 Garretson city, Minnehaha County0 .69 0 .69 329 .0 221 .7 Gary city, Deuel County0 .21 0 .21 1,938 .1 852 .4 Gayville town, Yankton County0 .61 0 .61 341 .0 254 .1 Geddes city, Charles Mix County1 .89 1 .89 614 .8 326 .5 Gettysburg city, Potter County0 .33 0 .33 318 .2 203 .0 Glenham town, Walworth County0 .77 0 .76 675 .0 185 .5 Goodwill CDP, Roberts County0 .47 0 .47 310 .6 131 .9 Goodwin town, Deuel County8 .13 8 .13 4 .3 1 .5 Green Grass CDP, Dewey County3 .84 3 .84 241 .7 101 .3 Green Valley CDP, Pennington County
1 .71 1 .71 757 .3 426 .9 Gregory city, Gregory County0 .24 0 .24 225 .0 183 .3 Grenville town, Day County1 .75 1 .75 833 .1 360 .0 Groton city, Brown County1 .25 1 .22 9 .0 7 .4 Hamill CDP, Tripp County2 .48 2 .48 1,648 .8 607 .7 Harrisburg city, Lincoln County0 .11 0 .11 472 .7 309 .1 Harrison CDP, Douglas County0 .27 0 .27 459 .3 274 .1 Harrold town, Hughes County2 .27 2 .27 1,116 .3 413 .7 Hartford city, Minnehaha County0 .31 0 .31 1,229 .0 558 .1 Hayti town, Hamlin County0 .24 0 .24 379 .2 175 .0 Hazel town, Hamlin County
0 .34 0 .34 667 .6 455 .9 Hecla city, Brown County1 .45 1 .45 184 .1 84 .8 Henry town, Codington County0 .48 0 .48 829 .2 381 .3 Hermosa town, Custer County1 .39 1 .39 315 .1 171 .9 Herreid city, Campbell County0 .52 0 .52 201 .9 111 .5 Herrick town, Gregory County0 .11 0 .11 418 .2 218 .2 Hetland town, Kingsbury County1 .88 1 .88 422 .9 209 .0 Highmore city, Hyde County1 .27 1 .26 752 .4 375 .4 Hill City city, Pennington County0 .64 0 .64 4 .7 3 .1 Hillsview town, McPherson County0 .27 0 .27 337 .0 214 .8 Hitchcock town, Beadle County
0 .99 0 .99 210 .1 152 .5 Hosmer city, Edmunds County3 .61 3 .61 1,028 .0 542 .4 Hot Springs city, Fall River County0 .31 0 .31 1,309 .7 712 .9 Hoven town, Potter County0 .95 0 .95 903 .2 535 .8 Howard city, Miner County0 .28 0 .28 1,057 .1 535 .7 Hudson town, Lincoln County0 .63 0 .62 950 .0 398 .4 Humboldt town, Minnehaha County0 .62 0 .62 669 .4 329 .0 Hurley city, Turner County
10 .56 9 .48 1,328 .3 635 .3 Huron city, Beadle County1 .34 1 .34 70 .1 41 .0 Interior town, Jackson County1 .34 1 .34 711 .9 329 .1 Ipswich city, Edmunds County
0 .26 0 .26 1,615 .4 746 .2 Irene city0 .09 0 .09 2,077 .8 900 .0 Clay County0 .11 0 .11 2,100 .0 1,009 .1 Turner County0 .06 0 .06 33 .3 33 .3 Yankton County0 .62 0 .62 429 .0 217 .7 Iroquois city0 .08 0 .08 825 .0 362 .5 Beadle County0 .54 0 .54 370 .4 196 .3 Kingsbury County0 .91 0 .91 148 .4 75 .8 Isabel town, Dewey County0 .49 0 .49 263 .3 242 .9 Java town, Walworth County0 .50 0 .50 1,094 .0 496 .0 Jefferson city, Union County
3 .73 3 .73 176 .7 90 .3 Johnson Siding CDP, Pennington County2 .31 2 .28 286 .8 153 .5 Kadoka city, Jackson County0 .67 0 .64 73 .4 43 .8 Kaylor CDP, Hutchinson County0 .85 0 .85 282 .4 171 .8 Kennebec town, Lyman County2 .86 2 .86 117 .8 80 .4 Keystone town, Pennington County0 .24 0 .24 237 .5 116 .7 Kidder CDP, Marshall County3 .09 3 .09 227 .5 119 .4 Kimball city, Brule County0 .76 0 .76 226 .3 92 .1 Kranzburg town, Codington County1 .53 1 .47 575 .5 153 .1 Kyle CDP, Shannon County0 .24 0 .24 283 .3 154 .2 La Bolt town, Grant County
0 .82 0 .80 1,098 .8 451 .3 Lake Andes city, Charles Mix County0 .23 0 .22 231 .8 131 .8 Lake City town, Marshall County9 .10 4 .75 143 .8 168 .4 Lake Madison CDP, Lake County0 .88 0 .83 562 .7 238 .6 Lake Norden city, Hamlin County
17 .77 5 .21 94 .6 133 .0 Lake Poinsett CDP1 .19 0 .20 250 .0 465 .0 Brookings County
16 .57 5 .01 88 .4 119 .8 Hamlin County0 .76 0 .76 788 .2 455 .3 Lake Preston city, Kingsbury County0 .46 0 .46 128 .3 80 .4 Lane town, Jerauld County0 .31 0 .31 1,009 .7 529 .0 Langford town, Marshall County
9 .49 9 .45 18 .1 5 .2 La Plant CDP, Dewey County2 .06 2 .06 1,516 .5 822 .3 Lead city, Lawrence County0 .53 0 .53 88 .7 75 .5 Lebanon town, Potter County
Table 9. Population and Housing Units: 1990 to 2010; and Area Measurements and Density: 2010—Con.[For information concerning historical counts and geographic change, see “User Notes .” For information on confidentiality, nonsampling error, and definitions, see Appendixes]
StatePlace and [in Selected States] County Subdivision
Population Housing units
2010 2000 1990
Percent change 2000 to
2010 2010 2000 1990
Percent change 2000 to
2010
Garretson city, Minnehaha County . . . . . . . . . . . . . . . . . . 1,166 1,165 924 0 .1 476 458 380 3 .9Gary city, Deuel County . . . . . . . . . . . . . . . . . . . . . . . . . . . 227 231 274 –1 .7 153 148 163 3 .4Gayville town, Yankton County . . . . . . . . . . . . . . . . . . . . . . 407 418 401 –2 .6 179 182 176 –1 .6Geddes city, Charles Mix County . . . . . . . . . . . . . . . . . . . 208 252 280 –17 .5 155 160 161 –3 .1Gettysburg city, Potter County . . . . . . . . . . . . . . . . . . . . . . 1,162 1,352 1,510 –14 .1 617 683 680 –9 .7Glenham town, Walworth County . . . . . . . . . . . . . . . . . . . 105 139 134 –24 .5 67 69 58 –2 .9Goodwill CDP, Roberts County . . . . . . . . . . . . . . . . . . . . . 513 (X) (X) (X) 141 (X) (X) (X)Goodwin town, Deuel County . . . . . . . . . . . . . . . . . . . . . . 146 160 126 –8 .8 62 63 48 –1 .6Green Grass CDP, Dewey County . . . . . . . . . . . . . . . . . . . 35 58 (X) –39 .7 12 18 (X) –33 .3Green Valley CDP, Pennington County . . . . . . . . . . . . . . . 928 768 (X) 20 .8 389 321 (X) 21 .2
Gregory city, Gregory County . . . . . . . . . . . . . . . . . . . . . . 1,295 1,342 1,486 –3 .5 730 718 744 1 .7Grenville town, Day County . . . . . . . . . . . . . . . . . . . . . . . . 54 62 81 –12 .9 44 46 50 –4 .3Groton city, Brown County . . . . . . . . . . . . . . . . . . . . . . . . . 1,458 1,356 1,196 7 .5 630 581 537 8 .4Hamill CDP, Tripp County . . . . . . . . . . . . . . . . . . . . . . . . . . 11 11 (X) – 9 7 (X) 28 .6Harrisburg city, Lincoln County . . . . . . . . . . . . . . . . . . . . . 4,089 958 727 326 .8 1,507 318 232 373 .9Harrison CDP, Douglas County . . . . . . . . . . . . . . . . . . . . . 52 51 (X) 2 .0 34 33 (X) 3 .0Harrold town, Hughes County . . . . . . . . . . . . . . . . . . . . . . 124 209 167 –40 .7 74 90 91 –17 .8Hartford city, Minnehaha County . . . . . . . . . . . . . . . . . . . . 2,534 1,844 1,262 37 .4 939 675 465 39 .1Hayti town, Hamlin County . . . . . . . . . . . . . . . . . . . . . . . . 381 367 372 3 .8 173 171 167 1 .2Hazel town, Hamlin County . . . . . . . . . . . . . . . . . . . . . . . . 91 105 103 –13 .3 42 44 46 –4 .5
Hecla city, Brown County . . . . . . . . . . . . . . . . . . . . . . . . . . 227 314 398 –27 .7 155 170 189 –8 .8Henry town, Codington County . . . . . . . . . . . . . . . . . . . . . 267 268 215 –0 .4 123 116 96 6 .0Hermosa town, Custer County . . . . . . . . . . . . . . . . . . . . . 398 315 242 26 .3 183 139 103 31 .7Herreid city, Campbell County . . . . . . . . . . . . . . . . . . . . . . 438 482 488 –9 .1 239 234 246 2 .1Herrick town, Gregory County . . . . . . . . . . . . . . . . . . . . . . 105 105 139 – 58 52 67 11 .5Hetland town, Kingsbury County . . . . . . . . . . . . . . . . . . . . 46 43 53 7 .0 24 21 33 14 .3Highmore city, Hyde County . . . . . . . . . . . . . . . . . . . . . . . 795 851 835 –6 .6 393 432 455 –9 .0Hill City city, Pennington County . . . . . . . . . . . . . . . . . . . . 948 780 650 21 .5 473 340 324 39 .1Hillsview town, McPherson County . . . . . . . . . . . . . . . . . . 3 3 4 – 2 2 2 –Hitchcock town, Beadle County . . . . . . . . . . . . . . . . . . . . . 91 108 123 –15 .7 58 61 72 –4 .9
Hosmer city, Edmunds County . . . . . . . . . . . . . . . . . . . . . 208 287 310 –27 .5 151 162 167 –6 .8Hot Springs city, Fall River County . . . . . . . . . . . . . . . . . . 3,711 4,129 4,325 –10 .1 1,958 1,900 1,872 3 .1Hoven town, Potter County . . . . . . . . . . . . . . . . . . . . . . . . 406 511 522 –20 .5 221 245 236 –9 .8Howard city, Miner County . . . . . . . . . . . . . . . . . . . . . . . . . 858 1,071 1,156 –19 .9 509 557 533 –8 .6Hudson town, Lincoln County . . . . . . . . . . . . . . . . . . . . . . 296 402 332 –26 .4 150 162 156 –7 .4Humboldt town, Minnehaha County . . . . . . . . . . . . . . . . . 589 r 523 468 12 .6 247 210 188 17 .6Hurley city, Turner County . . . . . . . . . . . . . . . . . . . . . . . . . 415 426 372 –2 .6 204 206 192 –1 .0Huron city, Beadle County . . . . . . . . . . . . . . . . . . . . . . . . . 12,592 11,893 12,448 5 .9 6,023 5,872 5,608 2 .6Interior town, Jackson County . . . . . . . . . . . . . . . . . . . . . . 94 77 67 22 .1 55 53 40 3 .8Ipswich city, Edmunds County . . . . . . . . . . . . . . . . . . . . . . 954 943 965 1 .2 441 440 434 0 .2
Irene city . . . . . . . . . . . . . . . . . . . . . . . . . . . . . . . . . . . . . . 420 432 464 –2 .8 194 189 195 2 .6 Clay County . . . . . . . . . . . . . . . . . . . . . . . . . . . . . . . . . . 187 198 209 –5 .6 81 76 81 6 .6 Turner County . . . . . . . . . . . . . . . . . . . . . . . . . . . . . . . . 231 233 253 –0 .9 111 111 112 – Yankton County . . . . . . . . . . . . . . . . . . . . . . . . . . . . . . . 2 1 2 100 .0 2 2 2 –Iroquois city . . . . . . . . . . . . . . . . . . . . . . . . . . . . . . . . . . . . 266 278 328 –4 .3 135 121 154 11 .6 Beadle County . . . . . . . . . . . . . . . . . . . . . . . . . . . . . . . . 66 37 57 78 .4 29 15 28 93 .3 Kingsbury County . . . . . . . . . . . . . . . . . . . . . . . . . . . . . . 200 241 271 –17 .0 106 106 126 –Isabel town, Dewey County . . . . . . . . . . . . . . . . . . . . . . . . 135 239 319 –43 .5 69 125 169 –44 .8Java town, Walworth County . . . . . . . . . . . . . . . . . . . . . . . 129 197 161 –34 .5 119 133 125 –10 .5Jefferson city, Union County . . . . . . . . . . . . . . . . . . . . . . . 547 586 527 –6 .7 248 240 220 3 .3
Johnson Siding CDP, Pennington County . . . . . . . . . . . . . 659 (X) (X) (X) 337 (X) (X) (X)Kadoka city, Jackson County . . . . . . . . . . . . . . . . . . . . . . . 654 706 736 –7 .4 350 356 365 –1 .7Kaylor CDP, Hutchinson County . . . . . . . . . . . . . . . . . . . . 47 64 (X) –26 .6 28 32 (X) –12 .5Kennebec town, Lyman County . . . . . . . . . . . . . . . . . . . . . 240 286 284 –16 .1 146 152 147 –3 .9Keystone town, Pennington County . . . . . . . . . . . . . . . . . . 337 311 232 8 .4 230 209 137 10 .0Kidder CDP, Marshall County . . . . . . . . . . . . . . . . . . . . . . 57 (X) (X) (X) 28 (X) (X) (X)Kimball city, Brule County . . . . . . . . . . . . . . . . . . . . . . . . . 703 745 743 –5 .6 369 351 352 5 .1Kranzburg town, Codington County . . . . . . . . . . . . . . . . . . 172 185 132 –7 .0 70 65 57 7 .7Kyle CDP, Shannon County . . . . . . . . . . . . . . . . . . . . . . . . 846 970 914 –12 .8 225 219 216 2 .7La Bolt town, Grant County . . . . . . . . . . . . . . . . . . . . . . . . 68 86 91 –20 .9 37 36 41 2 .8
Lake Andes city, Charles Mix County . . . . . . . . . . . . . . . . 879 819 846 7 .3 361 369 387 –2 .2Lake City town, Marshall County . . . . . . . . . . . . . . . . . . . . 51 47 43 8 .5 29 26 28 11 .5Lake Madison CDP, Lake County . . . . . . . . . . . . . . . . . . . 683 (X) (X) (X) 800 (X) (X) (X)Lake Norden city, Hamlin County . . . . . . . . . . . . . . . . . . . 467 432 427 8 .1 198 193 188 2 .6Lake Poinsett CDP . . . . . . . . . . . . . . . . . . . . . . . . . . . . . . 493 (X) (X) (X) 693 (X) (X) (X) Brookings County . . . . . . . . . . . . . . . . . . . . . . . . . . . . . . 50 (X) (X) (X) 93 (X) (X) (X) Hamlin County . . . . . . . . . . . . . . . . . . . . . . . . . . . . . . . . 443 (X) (X) (X) 600 (X) (X) (X)Lake Preston city, Kingsbury County . . . . . . . . . . . . . . . . . 599 737 663 –18 .7 346 355 365 –2 .5Lane town, Jerauld County . . . . . . . . . . . . . . . . . . . . . . . . 59 59 71 – 37 34 37 8 .8Langford town, Marshall County . . . . . . . . . . . . . . . . . . . . 313 290 298 7 .9 164 163 162 0 .6
La Plant CDP, Dewey County . . . . . . . . . . . . . . . . . . . . . . 171 150 (X) 14 .0 49 42 (X) 16 .7Lead city, Lawrence County . . . . . . . . . . . . . . . . . . . . . . . . 3,124 3,027 3,632 3 .2 1,694 1,617 1,654 4 .8Lebanon town, Potter County . . . . . . . . . . . . . . . . . . . . . . 47 86 115 –45 .3 40 54 59 –25 .9

38 South Dakota Population and Housing Unit CountsU.S. Census Bureau, 2010 Census
Table 9. Population and Housing Units: 1990 to 2010; and Area Measurements and Density: 2010—Con.[For information concerning historical counts and geographic change, see “User Notes .” For information on confidentiality, nonsampling error, and definitions, see Appendixes]
Table 9. Population and Housing Units: 1990 to 2010; and Area Measurements and Density: 2010—Con.[For information concerning historical counts and geographic change, see “User Notes .” For information on confidentiality, nonsampling error, and definitions, see Appendixes]
StatePlace and [in Selected States] County Subdivision
Population Housing units Area measurements in square miles Average per square mile of land
StatePlace and [in Selected States] County Subdivision
2010 2000 1990
Percent change 2000 to
2010 2010 2000 1990
Percent change 2000 to
2010 Total area Land area Population density Housing unit density
Lemmon city, Perkins County . . . . . . . . . . . . . . . . . . . . . . 1,227 1,398 1,614 –12 .2 732 776 813 –5 .7 1 .04 1 .04 1,179 .8 703 .8 Lemmon city, Perkins CountyLennox city, Lincoln County . . . . . . . . . . . . . . . . . . . . . . . . 2,111 2,037 1,767 3 .6 914 836 718 9 .3 1 .31 1 .31 1,611 .5 697 .7 Lennox city, Lincoln CountyLeola city, McPherson County . . . . . . . . . . . . . . . . . . . . . . 457 462 521 –1 .1 258 268 300 –3 .7 0 .72 0 .71 643 .7 363 .4 Leola city, McPherson CountyLesterville town, Yankton County . . . . . . . . . . . . . . . . . . . . 127 158 168 –19 .6 68 73 66 –6 .8 0 .20 0 .20 635 .0 340 .0 Lesterville town, Yankton CountyLetcher town, Sanborn County . . . . . . . . . . . . . . . . . . . . . 173 177 164 –2 .3 83 84 84 –1 .2 0 .65 0 .62 279 .0 133 .9 Letcher town, Sanborn CountyLily town, Day County . . . . . . . . . . . . . . . . . . . . . . . . . . . . 4 21 26 –81 .0 13 14 19 –7 .1 0 .30 0 .30 13 .3 43 .3 Lily town, Day CountyLittle Eagle CDP, Corson County . . . . . . . . . . . . . . . . . . . . 319 370 294 –13 .8 74 74 72 – 1 .42 1 .40 227 .9 52 .9 Little Eagle CDP, Corson CountyLong Hollow CDP, Roberts County . . . . . . . . . . . . . . . . . . 192 (X) (X) (X) 62 (X) (X) (X) 14 .55 14 .43 13 .3 4 .3 Long Hollow CDP, Roberts CountyLong Lake town, McPherson County . . . . . . . . . . . . . . . . . 31 58 64 –46 .6 47 44 46 6 .8 0 .28 0 .28 110 .7 167 .9 Long Lake town, McPherson CountyLoomis CDP, Davison County . . . . . . . . . . . . . . . . . . . . . . 34 47 (X) –27 .7 16 19 (X) –15 .8 0 .23 0 .23 147 .8 69 .6 Loomis CDP, Davison County
Lower Brule CDP, Lyman County . . . . . . . . . . . . . . . . . . . 613 599 655 2 .3 188 182 182 3 .3 0 .36 0 .36 1,702 .8 522 .2 Lower Brule CDP, Lyman CountyLowry town, Walworth County . . . . . . . . . . . . . . . . . . . . . . 6 10 15 –40 .0 6 6 5 – 0 .25 0 .25 24 .0 24 .0 Lowry town, Walworth CountyMcIntosh city, Corson County . . . . . . . . . . . . . . . . . . . . . . 173 217 302 –20 .3 111 135 154 –17 .8 0 .77 0 .73 237 .0 152 .1 McIntosh city, Corson CountyMcLaughlin city, Corson County . . . . . . . . . . . . . . . . . . . . 663 775 780 –14 .5 270 291 320 –7 .2 0 .40 0 .40 1,657 .5 675 .0 McLaughlin city, Corson CountyMadison city, Lake County . . . . . . . . . . . . . . . . . . . . . . . . . 6,474 6,540 6,257 –1 .0 2,848 2,706 2,613 5 .2 4 .61 4 .61 1,404 .3 617 .8 Madison city, Lake CountyManderson-White Horse Creek CDP, Shannon County . . 626 626 243 – 118 116 65 1 .7 5 .73 5 .73 109 .2 20 .6 Manderson-White Horse Creek CDP, Shannon CountyMansfield CDP . . . . . . . . . . . . . . . . . . . . . . . . . . . . . . . . . . 93 (X) (X) (X) 39 (X) (X) (X) 2 .41 2 .41 38 .6 16 .2 Mansfield CDP Brown County . . . . . . . . . . . . . . . . . . . . . . . . . . . . . . . . 40 (X) (X) (X) 18 (X) (X) (X) 1 .77 1 .77 22 .6 10 .2 Brown County Spink County . . . . . . . . . . . . . . . . . . . . . . . . . . . . . . . . . 53 (X) (X) (X) 21 (X) (X) (X) 0 .64 0 .64 82 .8 32 .8 Spink CountyMarion city, Turner County . . . . . . . . . . . . . . . . . . . . . . . . . 784 892 831 –12 .1 384 377 371 1 .9 0 .87 0 .87 901 .1 441 .4 Marion city, Turner County
Martin city, Bennett County . . . . . . . . . . . . . . . . . . . . . . . . 1,071 1,106 1,151 –3 .2 467 480 544 –2 .7 0 .53 0 .53 2,020 .8 881 .1 Martin city, Bennett CountyMarty CDP, Charles Mix County . . . . . . . . . . . . . . . . . . . . 402 421 436 –4 .5 109 106 92 2 .8 3 .22 3 .22 124 .8 33 .9 Marty CDP, Charles Mix CountyMarvin town, Grant County . . . . . . . . . . . . . . . . . . . . . . . . 34 66 38 –48 .5 21 28 27 –25 .0 0 .55 0 .55 61 .8 38 .2 Marvin town, Grant CountyMeadow View Addition CDP, Minnehaha County . . . . . . . 538 (X) (X) (X) 225 (X) (X) (X) 1 .08 1 .08 498 .1 208 .3 Meadow View Addition CDP, Minnehaha CountyMellette city, Spink County . . . . . . . . . . . . . . . . . . . . . . . . . 210 248 184 –15 .3 100 99 87 1 .0 0 .26 0 .26 807 .7 384 .6 Mellette city, Spink CountyMenno city, Hutchinson County . . . . . . . . . . . . . . . . . . . . . 608 729 768 –16 .6 327 358 372 –8 .7 0 .52 0 .52 1,169 .2 628 .8 Menno city, Hutchinson CountyMidland town, Haakon County . . . . . . . . . . . . . . . . . . . . . . 129 179 233 –27 .9 92 91 103 1 .1 0 .34 0 .34 379 .4 270 .6 Midland town, Haakon CountyMilbank city, Grant County . . . . . . . . . . . . . . . . . . . . . . . . . 3,353 3,640 3,879 –7 .9 1,683 1,698 1,711 –0 .9 2 .84 2 .76 1,214 .9 609 .8 Milbank city, Grant CountyMiller city, Hand County . . . . . . . . . . . . . . . . . . . . . . . . . . . 1,489 1,530 1,678 –2 .7 839 845 877 –0 .7 0 .98 0 .98 1,519 .4 856 .1 Miller city, Hand CountyMilltown CDP, Hutchinson County . . . . . . . . . . . . . . . . . . . 10 8 (X) 25 .0 7 9 (X) –22 .2 0 .44 0 .44 22 .7 15 .9 Milltown CDP, Hutchinson County
Mission city, Todd County . . . . . . . . . . . . . . . . . . . . . . . . . 1,182 904 730 30 .8 443 339 272 30 .7 0 .59 0 .59 2,003 .4 750 .8 Mission city, Todd CountyMission Hill town, Yankton County . . . . . . . . . . . . . . . . . . . 177 183 180 –3 .3 77 76 68 1 .3 0 .33 0 .33 536 .4 233 .3 Mission Hill town, Yankton CountyMitchell city, Davison County . . . . . . . . . . . . . . . . . . . . . . . 15,254 14,558 13,798 4 .8 7,120 6,555 6,064 8 .6 12 .14 11 .14 1,369 .3 639 .1 Mitchell city, Davison CountyMobridge city, Walworth County . . . . . . . . . . . . . . . . . . . . 3,465 3,574 3,768 –3 .0 1,727 1,808 1,779 –4 .5 1 .89 1 .89 1,833 .3 913 .8 Mobridge city, Walworth CountyMonroe town, Turner County . . . . . . . . . . . . . . . . . . . . . . . 160 163 151 –1 .8 75 75 79 – 0 .38 0 .38 421 .1 197 .4 Monroe town, Turner CountyMontrose city, McCook County . . . . . . . . . . . . . . . . . . . . . 472 460 420 2 .6 208 202 176 3 .0 0 .41 0 .41 1,151 .2 507 .3 Montrose city, McCook CountyMorningside CDP, Beadle County . . . . . . . . . . . . . . . . . . . 105 (X) (X) (X) 57 (X) (X) (X) 0 .52 0 .52 201 .9 109 .6 Morningside CDP, Beadle CountyMorristown town, Corson County . . . . . . . . . . . . . . . . . . . 67 82 64 –18 .3 42 44 49 –4 .5 0 .35 0 .35 191 .4 120 .0 Morristown town, Corson CountyMound City town, Campbell County . . . . . . . . . . . . . . . . . 71 84 89 –15 .5 51 54 63 –5 .6 0 .13 0 .13 546 .2 392 .3 Mound City town, Campbell CountyMount Vernon city, Davison County . . . . . . . . . . . . . . . . . . 462 477 368 –3 .1 205 189 174 8 .5 0 .35 0 .35 1,320 .0 585 .7 Mount Vernon city, Davison County
Murdo city, Jones County . . . . . . . . . . . . . . . . . . . . . . . . . 488 612 679 –20 .3 291 315 331 –7 .6 0 .63 0 .63 774 .6 461 .9 Murdo city, Jones CountyNaples town, Clark County . . . . . . . . . . . . . . . . . . . . . . . . 41 25 35 64 .0 12 14 17 –14 .3 0 .14 0 .14 292 .9 85 .7 Naples town, Clark CountyNew Effington town, Roberts County . . . . . . . . . . . . . . . . . 256 233 219 9 .9 121 117 120 3 .4 0 .27 0 .26 984 .6 465 .4 New Effington town, Roberts CountyNewell city, Butte County . . . . . . . . . . . . . . . . . . . . . . . . . . 603 646 675 –6 .7 344 337 335 2 .1 1 .01 1 .01 597 .0 340 .6 Newell city, Butte CountyNew Holland CDP, Douglas County . . . . . . . . . . . . . . . . . . 76 78 (X) –2 .6 45 44 (X) 2 .3 0 .12 0 .12 633 .3 375 .0 New Holland CDP, Douglas CountyNew Underwood city, Pennington County . . . . . . . . . . . . . 660 616 553 7 .1 280 265 232 5 .7 1 .01 1 .01 653 .5 277 .2 New Underwood city, Pennington CountyNew Witten town, Tripp County . . . . . . . . . . . . . . . . . . . . . 79 51 87 54 .9 51 37 53 37 .8 0 .28 0 .28 282 .1 182 .1 New Witten town, Tripp CountyNisland town, Butte County . . . . . . . . . . . . . . . . . . . . . . . . 232 204 174 13 .7 114 100 80 14 .0 0 .27 0 .27 859 .3 422 .2 Nisland town, Butte CountyNorris CDP, Mellette County . . . . . . . . . . . . . . . . . . . . . . . 152 (X) (X) (X) 47 (X) (X) (X) 0 .87 0 .87 174 .7 54 .0 Norris CDP, Mellette CountyNorth Eagle Butte CDP, Dewey County . . . . . . . . . . . . . . . 1,954 2,163 1,423 –9 .7 626 697 517 –10 .2 9 .11 9 .10 214 .7 68 .8 North Eagle Butte CDP, Dewey County
North Sioux City city, Union County . . . . . . . . . . . . . . . . . . 2,530 2,288 2,019 10 .6 1,146 953 795 20 .3 2 .29 2 .26 1,119 .5 507 .1 North Sioux City city, Union CountyNorth Spearfish CDP, Lawrence County . . . . . . . . . . . . . . 2,221 2,306 2,274 –3 .7 948 914 853 3 .7 3 .17 3 .17 700 .6 299 .1 North Spearfish CDP, Lawrence CountyNorthville town, Spink County . . . . . . . . . . . . . . . . . . . . . . 143 124 105 15 .3 61 51 54 19 .6 0 .38 0 .38 376 .3 160 .5 Northville town, Spink CountyNunda town, Lake County . . . . . . . . . . . . . . . . . . . . . . . . . 43 47 45 –8 .5 24 27 28 –11 .1 1 .01 1 .01 42 .6 23 .8 Nunda town, Lake CountyOacoma town, Lyman County . . . . . . . . . . . . . . . . . . . . . . 451 390 367 15 .6 236 188 145 25 .5 4 .18 2 .59 174 .1 91 .1 Oacoma town, Lyman CountyOelrichs town, Fall River County . . . . . . . . . . . . . . . . . . . . 126 145 138 –13 .1 74 76 67 –2 .6 0 .38 0 .38 331 .6 194 .7 Oelrichs town, Fall River CountyOglala CDP, Shannon County . . . . . . . . . . . . . . . . . . . . . . 1,290 1,229 422 5 .0 279 279 142 – 13 .36 12 .50 103 .2 22 .3 Oglala CDP, Shannon CountyOkaton CDP, Jones County . . . . . . . . . . . . . . . . . . . . . . . . 36 29 (X) 24 .1 17 18 (X) –5 .6 29 .80 29 .77 1 .2 0 .6 Okaton CDP, Jones CountyOkreek CDP, Todd County . . . . . . . . . . . . . . . . . . . . . . . . . 269 (X) (X) (X) 101 (X) (X) (X) 45 .03 44 .99 6 .0 2 .2 Okreek CDP, Todd CountyOla CDP, Brule County . . . . . . . . . . . . . . . . . . . . . . . . . . . 13 (X) (X) (X) 6 (X) (X) (X) 4 .02 4 .02 3 .2 1 .5 Ola CDP, Brule County
Oldham city, Kingsbury County . . . . . . . . . . . . . . . . . . . . . 133 206 189 –35 .4 98 106 119 –7 .5 0 .25 0 .25 532 .0 392 .0 Oldham city, Kingsbury CountyOlivet town, Hutchinson County . . . . . . . . . . . . . . . . . . . . . 74 70 74 5 .7 47 43 53 9 .3 0 .15 0 .15 493 .3 313 .3 Olivet town, Hutchinson CountyOnaka town, Faulk County . . . . . . . . . . . . . . . . . . . . . . . . 15 30 52 –50 .0 22 25 31 –12 .0 0 .27 0 .26 57 .7 84 .6 Onaka town, Faulk CountyOnida city, Sully County . . . . . . . . . . . . . . . . . . . . . . . . . . . 658 740 761 –11 .1 331 329 359 0 .6 0 .64 0 .64 1,028 .1 517 .2 Onida city, Sully CountyOrient town, Faulk County . . . . . . . . . . . . . . . . . . . . . . . . . 63 57 59 10 .5 38 38 45 – 0 .30 0 .29 217 .2 131 .0 Orient town, Faulk CountyOrtley town, Roberts County . . . . . . . . . . . . . . . . . . . . . . . 65 54 63 20 .4 42 32 36 31 .3 2 .24 2 .24 29 .0 18 .8 Ortley town, Roberts CountyParker city, Turner County . . . . . . . . . . . . . . . . . . . . . . . . . 1,022 1,031 984 –0 .9 489 450 429 8 .7 1 .15 1 .15 888 .7 425 .2 Parker city, Turner CountyParkston city, Hutchinson County . . . . . . . . . . . . . . . . . . . 1,508 1,674 1,572 –9 .9 737 752 716 –2 .0 0 .91 0 .91 1,657 .1 809 .9 Parkston city, Hutchinson CountyParmelee CDP, Todd County . . . . . . . . . . . . . . . . . . . . . . . 562 650 618 –13 .5 167 160 151 4 .4 5 .80 5 .71 98 .4 29 .2 Parmelee CDP, Todd CountyPeever town, Roberts County . . . . . . . . . . . . . . . . . . . . . . 168 209 195 –19 .6 63 73 84 –13 .7 0 .12 0 .12 1,400 .0 525 .0 Peever town, Roberts County
Philip city, Haakon County . . . . . . . . . . . . . . . . . . . . . . . . . 779 885 1,077 –12 .0 423 424 450 –0 .2 0 .60 0 .60 1,298 .3 705 .0 Philip city, Haakon CountyPickstown town, Charles Mix County . . . . . . . . . . . . . . . . . 201 168 95 19 .6 114 88 49 29 .5 0 .65 0 .65 309 .2 175 .4 Pickstown town, Charles Mix CountyPiedmont city, Meade County . . . . . . . . . . . . . . . . . . . . . . 222 (X) (X) (X) 110 (X) (X) (X) 0 .29 0 .29 765 .5 379 .3 Piedmont city, Meade County

Population and Housing Unit Counts South Dakota 39U.S. Census Bureau, 2010 Census
Table 9. Population and Housing Units: 1990 to 2010; and Area Measurements and Density: 2010—Con.[For information concerning historical counts and geographic change, see “User Notes .” For information on confidentiality, nonsampling error, and definitions, see Appendixes]
Table 9. Population and Housing Units: 1990 to 2010; and Area Measurements and Density: 2010—Con.[For information concerning historical counts and geographic change, see “User Notes .” For information on confidentiality, nonsampling error, and definitions, see Appendixes]
Area measurements in square miles Average per square mile of land
StatePlace and [in Selected States] County Subdivision
Total area Land area Population density Housing unit density
1 .04 1 .04 1,179 .8 703 .8 Lemmon city, Perkins County1 .31 1 .31 1,611 .5 697 .7 Lennox city, Lincoln County0 .72 0 .71 643 .7 363 .4 Leola city, McPherson County0 .20 0 .20 635 .0 340 .0 Lesterville town, Yankton County0 .65 0 .62 279 .0 133 .9 Letcher town, Sanborn County0 .30 0 .30 13 .3 43 .3 Lily town, Day County1 .42 1 .40 227 .9 52 .9 Little Eagle CDP, Corson County
14 .55 14 .43 13 .3 4 .3 Long Hollow CDP, Roberts County0 .28 0 .28 110 .7 167 .9 Long Lake town, McPherson County0 .23 0 .23 147 .8 69 .6 Loomis CDP, Davison County
0 .36 0 .36 1,702 .8 522 .2 Lower Brule CDP, Lyman County0 .25 0 .25 24 .0 24 .0 Lowry town, Walworth County0 .77 0 .73 237 .0 152 .1 McIntosh city, Corson County0 .40 0 .40 1,657 .5 675 .0 McLaughlin city, Corson County4 .61 4 .61 1,404 .3 617 .8 Madison city, Lake County5 .73 5 .73 109 .2 20 .6 Manderson-White Horse Creek CDP, Shannon County2 .41 2 .41 38 .6 16 .2 Mansfield CDP1 .77 1 .77 22 .6 10 .2 Brown County0 .64 0 .64 82 .8 32 .8 Spink County0 .87 0 .87 901 .1 441 .4 Marion city, Turner County
0 .53 0 .53 2,020 .8 881 .1 Martin city, Bennett County3 .22 3 .22 124 .8 33 .9 Marty CDP, Charles Mix County0 .55 0 .55 61 .8 38 .2 Marvin town, Grant County1 .08 1 .08 498 .1 208 .3 Meadow View Addition CDP, Minnehaha County0 .26 0 .26 807 .7 384 .6 Mellette city, Spink County0 .52 0 .52 1,169 .2 628 .8 Menno city, Hutchinson County0 .34 0 .34 379 .4 270 .6 Midland town, Haakon County2 .84 2 .76 1,214 .9 609 .8 Milbank city, Grant County0 .98 0 .98 1,519 .4 856 .1 Miller city, Hand County0 .44 0 .44 22 .7 15 .9 Milltown CDP, Hutchinson County
0 .59 0 .59 2,003 .4 750 .8 Mission city, Todd County0 .33 0 .33 536 .4 233 .3 Mission Hill town, Yankton County
12 .14 11 .14 1,369 .3 639 .1 Mitchell city, Davison County1 .89 1 .89 1,833 .3 913 .8 Mobridge city, Walworth County0 .38 0 .38 421 .1 197 .4 Monroe town, Turner County0 .41 0 .41 1,151 .2 507 .3 Montrose city, McCook County0 .52 0 .52 201 .9 109 .6 Morningside CDP, Beadle County0 .35 0 .35 191 .4 120 .0 Morristown town, Corson County0 .13 0 .13 546 .2 392 .3 Mound City town, Campbell County0 .35 0 .35 1,320 .0 585 .7 Mount Vernon city, Davison County
0 .63 0 .63 774 .6 461 .9 Murdo city, Jones County0 .14 0 .14 292 .9 85 .7 Naples town, Clark County0 .27 0 .26 984 .6 465 .4 New Effington town, Roberts County1 .01 1 .01 597 .0 340 .6 Newell city, Butte County0 .12 0 .12 633 .3 375 .0 New Holland CDP, Douglas County1 .01 1 .01 653 .5 277 .2 New Underwood city, Pennington County0 .28 0 .28 282 .1 182 .1 New Witten town, Tripp County0 .27 0 .27 859 .3 422 .2 Nisland town, Butte County0 .87 0 .87 174 .7 54 .0 Norris CDP, Mellette County9 .11 9 .10 214 .7 68 .8 North Eagle Butte CDP, Dewey County
2 .29 2 .26 1,119 .5 507 .1 North Sioux City city, Union County3 .17 3 .17 700 .6 299 .1 North Spearfish CDP, Lawrence County0 .38 0 .38 376 .3 160 .5 Northville town, Spink County1 .01 1 .01 42 .6 23 .8 Nunda town, Lake County4 .18 2 .59 174 .1 91 .1 Oacoma town, Lyman County0 .38 0 .38 331 .6 194 .7 Oelrichs town, Fall River County
13 .36 12 .50 103 .2 22 .3 Oglala CDP, Shannon County29 .80 29 .77 1 .2 0 .6 Okaton CDP, Jones County45 .03 44 .99 6 .0 2 .2 Okreek CDP, Todd County4 .02 4 .02 3 .2 1 .5 Ola CDP, Brule County
0 .25 0 .25 532 .0 392 .0 Oldham city, Kingsbury County0 .15 0 .15 493 .3 313 .3 Olivet town, Hutchinson County0 .27 0 .26 57 .7 84 .6 Onaka town, Faulk County0 .64 0 .64 1,028 .1 517 .2 Onida city, Sully County0 .30 0 .29 217 .2 131 .0 Orient town, Faulk County2 .24 2 .24 29 .0 18 .8 Ortley town, Roberts County1 .15 1 .15 888 .7 425 .2 Parker city, Turner County0 .91 0 .91 1,657 .1 809 .9 Parkston city, Hutchinson County5 .80 5 .71 98 .4 29 .2 Parmelee CDP, Todd County0 .12 0 .12 1,400 .0 525 .0 Peever town, Roberts County
0 .60 0 .60 1,298 .3 705 .0 Philip city, Haakon County0 .65 0 .65 309 .2 175 .4 Pickstown town, Charles Mix County0 .29 0 .29 765 .5 379 .3 Piedmont city, Meade County
StatePlace and [in Selected States] County Subdivision
Population Housing units
2010 2000 1990
Percent change 2000 to
2010 2010 2000 1990
Percent change 2000 to
2010
Lemmon city, Perkins County . . . . . . . . . . . . . . . . . . . . . . 1,227 1,398 1,614 –12 .2 732 776 813 –5 .7Lennox city, Lincoln County . . . . . . . . . . . . . . . . . . . . . . . . 2,111 2,037 1,767 3 .6 914 836 718 9 .3Leola city, McPherson County . . . . . . . . . . . . . . . . . . . . . . 457 462 521 –1 .1 258 268 300 –3 .7Lesterville town, Yankton County . . . . . . . . . . . . . . . . . . . . 127 158 168 –19 .6 68 73 66 –6 .8Letcher town, Sanborn County . . . . . . . . . . . . . . . . . . . . . 173 177 164 –2 .3 83 84 84 –1 .2Lily town, Day County . . . . . . . . . . . . . . . . . . . . . . . . . . . . 4 21 26 –81 .0 13 14 19 –7 .1Little Eagle CDP, Corson County . . . . . . . . . . . . . . . . . . . . 319 370 294 –13 .8 74 74 72 –Long Hollow CDP, Roberts County . . . . . . . . . . . . . . . . . . 192 (X) (X) (X) 62 (X) (X) (X)Long Lake town, McPherson County . . . . . . . . . . . . . . . . . 31 58 64 –46 .6 47 44 46 6 .8Loomis CDP, Davison County . . . . . . . . . . . . . . . . . . . . . . 34 47 (X) –27 .7 16 19 (X) –15 .8
Lower Brule CDP, Lyman County . . . . . . . . . . . . . . . . . . . 613 599 655 2 .3 188 182 182 3 .3Lowry town, Walworth County . . . . . . . . . . . . . . . . . . . . . . 6 10 15 –40 .0 6 6 5 –McIntosh city, Corson County . . . . . . . . . . . . . . . . . . . . . . 173 217 302 –20 .3 111 135 154 –17 .8McLaughlin city, Corson County . . . . . . . . . . . . . . . . . . . . 663 775 780 –14 .5 270 291 320 –7 .2Madison city, Lake County . . . . . . . . . . . . . . . . . . . . . . . . . 6,474 6,540 6,257 –1 .0 2,848 2,706 2,613 5 .2Manderson-White Horse Creek CDP, Shannon County . . 626 626 243 – 118 116 65 1 .7Mansfield CDP . . . . . . . . . . . . . . . . . . . . . . . . . . . . . . . . . . 93 (X) (X) (X) 39 (X) (X) (X) Brown County . . . . . . . . . . . . . . . . . . . . . . . . . . . . . . . . 40 (X) (X) (X) 18 (X) (X) (X) Spink County . . . . . . . . . . . . . . . . . . . . . . . . . . . . . . . . . 53 (X) (X) (X) 21 (X) (X) (X)Marion city, Turner County . . . . . . . . . . . . . . . . . . . . . . . . . 784 892 831 –12 .1 384 377 371 1 .9
Martin city, Bennett County . . . . . . . . . . . . . . . . . . . . . . . . 1,071 1,106 1,151 –3 .2 467 480 544 –2 .7Marty CDP, Charles Mix County . . . . . . . . . . . . . . . . . . . . 402 421 436 –4 .5 109 106 92 2 .8Marvin town, Grant County . . . . . . . . . . . . . . . . . . . . . . . . 34 66 38 –48 .5 21 28 27 –25 .0Meadow View Addition CDP, Minnehaha County . . . . . . . 538 (X) (X) (X) 225 (X) (X) (X)Mellette city, Spink County . . . . . . . . . . . . . . . . . . . . . . . . . 210 248 184 –15 .3 100 99 87 1 .0Menno city, Hutchinson County . . . . . . . . . . . . . . . . . . . . . 608 729 768 –16 .6 327 358 372 –8 .7Midland town, Haakon County . . . . . . . . . . . . . . . . . . . . . . 129 179 233 –27 .9 92 91 103 1 .1Milbank city, Grant County . . . . . . . . . . . . . . . . . . . . . . . . . 3,353 3,640 3,879 –7 .9 1,683 1,698 1,711 –0 .9Miller city, Hand County . . . . . . . . . . . . . . . . . . . . . . . . . . . 1,489 1,530 1,678 –2 .7 839 845 877 –0 .7Milltown CDP, Hutchinson County . . . . . . . . . . . . . . . . . . . 10 8 (X) 25 .0 7 9 (X) –22 .2
Mission city, Todd County . . . . . . . . . . . . . . . . . . . . . . . . . 1,182 904 730 30 .8 443 339 272 30 .7Mission Hill town, Yankton County . . . . . . . . . . . . . . . . . . . 177 183 180 –3 .3 77 76 68 1 .3Mitchell city, Davison County . . . . . . . . . . . . . . . . . . . . . . . 15,254 14,558 13,798 4 .8 7,120 6,555 6,064 8 .6Mobridge city, Walworth County . . . . . . . . . . . . . . . . . . . . 3,465 3,574 3,768 –3 .0 1,727 1,808 1,779 –4 .5Monroe town, Turner County . . . . . . . . . . . . . . . . . . . . . . . 160 163 151 –1 .8 75 75 79 –Montrose city, McCook County . . . . . . . . . . . . . . . . . . . . . 472 460 420 2 .6 208 202 176 3 .0Morningside CDP, Beadle County . . . . . . . . . . . . . . . . . . . 105 (X) (X) (X) 57 (X) (X) (X)Morristown town, Corson County . . . . . . . . . . . . . . . . . . . 67 82 64 –18 .3 42 44 49 –4 .5Mound City town, Campbell County . . . . . . . . . . . . . . . . . 71 84 89 –15 .5 51 54 63 –5 .6Mount Vernon city, Davison County . . . . . . . . . . . . . . . . . . 462 477 368 –3 .1 205 189 174 8 .5
Murdo city, Jones County . . . . . . . . . . . . . . . . . . . . . . . . . 488 612 679 –20 .3 291 315 331 –7 .6Naples town, Clark County . . . . . . . . . . . . . . . . . . . . . . . . 41 25 35 64 .0 12 14 17 –14 .3New Effington town, Roberts County . . . . . . . . . . . . . . . . . 256 233 219 9 .9 121 117 120 3 .4Newell city, Butte County . . . . . . . . . . . . . . . . . . . . . . . . . . 603 646 675 –6 .7 344 337 335 2 .1New Holland CDP, Douglas County . . . . . . . . . . . . . . . . . . 76 78 (X) –2 .6 45 44 (X) 2 .3New Underwood city, Pennington County . . . . . . . . . . . . . 660 616 553 7 .1 280 265 232 5 .7New Witten town, Tripp County . . . . . . . . . . . . . . . . . . . . . 79 51 87 54 .9 51 37 53 37 .8Nisland town, Butte County . . . . . . . . . . . . . . . . . . . . . . . . 232 204 174 13 .7 114 100 80 14 .0Norris CDP, Mellette County . . . . . . . . . . . . . . . . . . . . . . . 152 (X) (X) (X) 47 (X) (X) (X)North Eagle Butte CDP, Dewey County . . . . . . . . . . . . . . . 1,954 2,163 1,423 –9 .7 626 697 517 –10 .2
North Sioux City city, Union County . . . . . . . . . . . . . . . . . . 2,530 2,288 2,019 10 .6 1,146 953 795 20 .3North Spearfish CDP, Lawrence County . . . . . . . . . . . . . . 2,221 2,306 2,274 –3 .7 948 914 853 3 .7Northville town, Spink County . . . . . . . . . . . . . . . . . . . . . . 143 124 105 15 .3 61 51 54 19 .6Nunda town, Lake County . . . . . . . . . . . . . . . . . . . . . . . . . 43 47 45 –8 .5 24 27 28 –11 .1Oacoma town, Lyman County . . . . . . . . . . . . . . . . . . . . . . 451 390 367 15 .6 236 188 145 25 .5Oelrichs town, Fall River County . . . . . . . . . . . . . . . . . . . . 126 145 138 –13 .1 74 76 67 –2 .6Oglala CDP, Shannon County . . . . . . . . . . . . . . . . . . . . . . 1,290 1,229 422 5 .0 279 279 142 –Okaton CDP, Jones County . . . . . . . . . . . . . . . . . . . . . . . . 36 29 (X) 24 .1 17 18 (X) –5 .6Okreek CDP, Todd County . . . . . . . . . . . . . . . . . . . . . . . . . 269 (X) (X) (X) 101 (X) (X) (X)Ola CDP, Brule County . . . . . . . . . . . . . . . . . . . . . . . . . . . 13 (X) (X) (X) 6 (X) (X) (X)
Oldham city, Kingsbury County . . . . . . . . . . . . . . . . . . . . . 133 206 189 –35 .4 98 106 119 –7 .5Olivet town, Hutchinson County . . . . . . . . . . . . . . . . . . . . . 74 70 74 5 .7 47 43 53 9 .3Onaka town, Faulk County . . . . . . . . . . . . . . . . . . . . . . . . 15 30 52 –50 .0 22 25 31 –12 .0Onida city, Sully County . . . . . . . . . . . . . . . . . . . . . . . . . . . 658 740 761 –11 .1 331 329 359 0 .6Orient town, Faulk County . . . . . . . . . . . . . . . . . . . . . . . . . 63 57 59 10 .5 38 38 45 –Ortley town, Roberts County . . . . . . . . . . . . . . . . . . . . . . . 65 54 63 20 .4 42 32 36 31 .3Parker city, Turner County . . . . . . . . . . . . . . . . . . . . . . . . . 1,022 1,031 984 –0 .9 489 450 429 8 .7Parkston city, Hutchinson County . . . . . . . . . . . . . . . . . . . 1,508 1,674 1,572 –9 .9 737 752 716 –2 .0Parmelee CDP, Todd County . . . . . . . . . . . . . . . . . . . . . . . 562 650 618 –13 .5 167 160 151 4 .4Peever town, Roberts County . . . . . . . . . . . . . . . . . . . . . . 168 209 195 –19 .6 63 73 84 –13 .7
Philip city, Haakon County . . . . . . . . . . . . . . . . . . . . . . . . . 779 885 1,077 –12 .0 423 424 450 –0 .2Pickstown town, Charles Mix County . . . . . . . . . . . . . . . . . 201 168 95 19 .6 114 88 49 29 .5Piedmont city, Meade County . . . . . . . . . . . . . . . . . . . . . . 222 (X) (X) (X) 110 (X) (X) (X)

40 South Dakota Population and Housing Unit CountsU.S. Census Bureau, 2010 Census
Table 9. Population and Housing Units: 1990 to 2010; and Area Measurements and Density: 2010—Con.[For information concerning historical counts and geographic change, see “User Notes .” For information on confidentiality, nonsampling error, and definitions, see Appendixes]
Table 9. Population and Housing Units: 1990 to 2010; and Area Measurements and Density: 2010—Con.[For information concerning historical counts and geographic change, see “User Notes .” For information on confidentiality, nonsampling error, and definitions, see Appendixes]
StatePlace and [in Selected States] County Subdivision
Population Housing units Area measurements in square miles Average per square mile of land
StatePlace and [in Selected States] County Subdivision
2010 2000 1990
Percent change 2000 to
2010 2010 2000 1990
Percent change 2000 to
2010 Total area Land area Population density Housing unit density
Pierpont town, Day County . . . . . . . . . . . . . . . . . . . . . . . . 135 122 173 10 .7 78 83 90 –6 .0 0 .15 0 .15 900 .0 520 .0 Pierpont town, Day CountyPierre city, Hughes County . . . . . . . . . . . . . . . . . . . . . . . . 13,646 13,876 12,906 –1 .7 6,159 5,949 5,390 3 .5 13 .07 13 .06 1,044 .9 471 .6 Pierre city, Hughes CountyPine Lakes Addition CDP, Minnehaha County . . . . . . . . . . 314 (X) (X) (X) 102 (X) (X) (X) 0 .19 0 .19 1,652 .6 536 .8 Pine Lakes Addition CDP, Minnehaha CountyPine Ridge CDP, Shannon County . . . . . . . . . . . . . . . . . . 3,308 3,171 2,596 4 .3 863 742 694 16 .3 2 .84 2 .84 1,164 .8 303 .9 Pine Ridge CDP, Shannon CountyPlankinton city, Aurora County . . . . . . . . . . . . . . . . . . . . . . 707 601 604 17 .6 341 298 306 14 .4 0 .76 0 .76 930 .3 448 .7 Plankinton city, Aurora CountyPlatte city, Charles Mix County . . . . . . . . . . . . . . . . . . . . . 1,230 1,367 1,311 –10 .0 625 637 600 –1 .9 1 .02 1 .02 1,205 .9 612 .7 Platte city, Charles Mix CountyPollock town, Campbell County . . . . . . . . . . . . . . . . . . . . . 241 339 379 –28 .9 203 204 180 –0 .5 0 .32 0 .32 753 .1 634 .4 Pollock town, Campbell CountyPorcupine CDP, Shannon County . . . . . . . . . . . . . . . . . . . 1,062 407 783 160 .9 223 103 175 116 .5 9 .54 9 .54 111 .3 23 .4 Porcupine CDP, Shannon CountyPrairie City CDP, Perkins County . . . . . . . . . . . . . . . . . . . . 23 (X) (X) (X) 14 (X) (X) (X) 1 .47 1 .42 16 .2 9 .9 Prairie City CDP, Perkins CountyPresho city, Lyman County . . . . . . . . . . . . . . . . . . . . . . . . 497 588 654 –15 .5 285 305 306 –6 .6 0 .67 0 .67 741 .8 425 .4 Presho city, Lyman County
Pringle town, Custer County . . . . . . . . . . . . . . . . . . . . . . . 112 125 96 –10 .4 68 64 51 6 .3 0 .24 0 .24 466 .7 283 .3 Pringle town, Custer CountyPukwana town, Brule County . . . . . . . . . . . . . . . . . . . . . . 285 287 263 –0 .7 133 131 122 1 .5 0 .76 0 .76 375 .0 175 .0 Pukwana town, Brule CountyQuinn town, Pennington County . . . . . . . . . . . . . . . . . . . . 54 44 72 22 .7 27 23 35 17 .4 1 .16 1 .16 46 .6 23 .3 Quinn town, Pennington CountyRamona town, Lake County . . . . . . . . . . . . . . . . . . . . . . . 174 190 194 –8 .4 112 99 97 13 .1 0 .27 0 .27 644 .4 414 .8 Ramona town, Lake CountyRapid City city, Pennington County . . . . . . . . . . . . . . . . . . 67,956 r 59,573 54,523 14 .1 30,254 r 25,085 22,530 20 .6 55 .49 55 .41 1,226 .4 546 .0 Rapid City city, Pennington CountyRapid Valley CDP, Pennington County . . . . . . . . . . . . . . . . 8,260 7,043 5,968 17 .3 3,101 2,493 2,094 24 .4 7 .44 7 .44 1,110 .2 416 .8 Rapid Valley CDP, Pennington CountyRavinia town, Charles Mix County . . . . . . . . . . . . . . . . . . . 61 79 79 –22 .8 36 33 36 9 .1 0 .25 0 .25 244 .0 144 .0 Ravinia town, Charles Mix CountyRaymond town, Clark County . . . . . . . . . . . . . . . . . . . . . . 50 86 96 –41 .9 38 39 51 –2 .6 0 .26 0 .26 192 .3 146 .2 Raymond town, Clark CountyRedfield city, Spink County . . . . . . . . . . . . . . . . . . . . . . . . 2,333 r 2,518 2,770 –7 .3 1,187 r 1,262 1,306 –5 .9 1 .91 1 .89 1,234 .4 628 .0 Redfield city, Spink CountyRee Heights town, Hand County . . . . . . . . . . . . . . . . . . . . 62 85 91 –27 .1 52 46 49 13 .0 0 .30 0 .30 206 .7 173 .3 Ree Heights town, Hand County
Reliance town, Lyman County . . . . . . . . . . . . . . . . . . . . . . 191 206 169 –7 .3 85 92 84 –7 .6 1 .14 1 .09 175 .2 78 .0 Reliance town, Lyman CountyRenner Corner CDP, Minnehaha County . . . . . . . . . . . . . . 305 (X) (X) (X) 140 (X) (X) (X) 1 .29 1 .29 236 .4 108 .5 Renner Corner CDP, Minnehaha CountyRevillo town, Grant County . . . . . . . . . . . . . . . . . . . . . . . . 119 147 152 –19 .0 67 79 95 –15 .2 0 .17 0 .17 700 .0 394 .1 Revillo town, Grant CountyRichland CDP, Union County . . . . . . . . . . . . . . . . . . . . . . . 89 (X) (X) (X) 48 (X) (X) (X) 5 .65 5 .65 15 .8 8 .5 Richland CDP, Union CountyRockham town, Faulk County . . . . . . . . . . . . . . . . . . . . . . 33 53 48 –37 .7 28 27 22 3 .7 0 .50 0 .50 66 .0 56 .0 Rockham town, Faulk CountyRoscoe city, Edmunds County . . . . . . . . . . . . . . . . . . . . . . 329 324 362 1 .5 177 167 183 6 .0 0 .47 0 .47 700 .0 376 .6 Roscoe city, Edmunds CountyRosebud CDP, Todd County . . . . . . . . . . . . . . . . . . . . . . . 1,587 1,557 1,538 1 .9 476 465 466 2 .4 13 .01 12 .96 122 .5 36 .7 Rosebud CDP, Todd CountyRosholt town, Roberts County . . . . . . . . . . . . . . . . . . . . . . 423 419 408 1 .0 228 199 200 14 .6 0 .29 0 .29 1,458 .6 786 .2 Rosholt town, Roberts CountyRoslyn town, Day County . . . . . . . . . . . . . . . . . . . . . . . . . 183 225 251 –18 .7 105 109 114 –3 .7 0 .20 0 .20 915 .0 525 .0 Roslyn town, Day CountyRoswell town, Miner County . . . . . . . . . . . . . . . . . . . . . . . 15 21 19 –28 .6 11 12 10 –8 .3 1 .41 1 .41 10 .6 7 .8 Roswell town, Miner County
Running Water CDP, Bon Homme County . . . . . . . . . . . . . 36 (X) (X) (X) 37 (X) (X) (X) 2 .09 2 .09 17 .2 17 .7 Running Water CDP, Bon Homme CountySt . Charles CDP, Gregory County . . . . . . . . . . . . . . . . . . . 11 19 (X) –42 .1 11 12 (X) –8 .3 0 .20 0 .20 55 .0 55 .0 St . Charles CDP, Gregory CountySt . Francis town, Todd County . . . . . . . . . . . . . . . . . . . . . . 709 675 815 5 .0 211 204 237 3 .4 0 .36 0 .36 1,969 .4 586 .1 St . Francis town, Todd CountySt . Lawrence town, Hand County . . . . . . . . . . . . . . . . . . . 198 210 223 –5 .7 90 104 114 –13 .5 0 .34 0 .34 582 .4 264 .7 St . Lawrence town, Hand CountySt . Onge CDP, Lawrence County . . . . . . . . . . . . . . . . . . . . 191 (X) (X) (X) 89 (X) (X) (X) 1 .34 1 .34 142 .5 66 .4 St . Onge CDP, Lawrence CountySalem city, McCook County . . . . . . . . . . . . . . . . . . . . . . . . 1,347 1,371 1,289 –1 .8 667 640 581 4 .2 1 .24 1 .24 1,086 .3 537 .9 Salem city, McCook CountyScotland city, Bon Homme County . . . . . . . . . . . . . . . . . . 841 891 968 –5 .6 455 469 496 –3 .0 0 .85 0 .85 989 .4 535 .3 Scotland city, Bon Homme CountySelby city, Walworth County . . . . . . . . . . . . . . . . . . . . . . . 642 736 707 –12 .8 334 335 344 –0 .3 0 .71 0 .71 904 .2 470 .4 Selby city, Walworth CountySeneca town, Faulk County . . . . . . . . . . . . . . . . . . . . . . . . 38 58 81 –34 .5 29 36 45 –19 .4 0 .42 0 .42 90 .5 69 .0 Seneca town, Faulk CountySherman town, Minnehaha County . . . . . . . . . . . . . . . . . . 78 87 88 –10 .3 32 33 33 –3 .0 0 .26 0 .26 300 .0 123 .1 Sherman town, Minnehaha County
Shindler CDP, Lincoln County . . . . . . . . . . . . . . . . . . . . . . 584 (X) (X) (X) 184 (X) (X) (X) 1 .50 1 .50 389 .3 122 .7 Shindler CDP, Lincoln CountySinai town, Brookings County . . . . . . . . . . . . . . . . . . . . . . 120 133 120 –9 .8 61 62 63 –1 .6 0 .37 0 .37 324 .3 164 .9 Sinai town, Brookings CountySioux Falls city . . . . . . . . . . . . . . . . . . . . . . . . . . . . . . . . . . 153,888 r 124,158 100,836 23 .9 66,283 51,680 41,576 28 .3 73 .47 72 .96 2,109 .2 908 .5 Sioux Falls city Lincoln County . . . . . . . . . . . . . . . . . . . . . . . . . . . . . . . . 21,095 r 6,636 1,409 217 .9 8,700 2,514 473 246 .1 11 .84 11 .84 1,781 .7 734 .8 Lincoln County Minnehaha County . . . . . . . . . . . . . . . . . . . . . . . . . . . . . 132,793 r 117,522 99,427 13 .0 57,583 49,166 41,103 17 .1 61 .63 61 .12 2,172 .7 942 .1 Minnehaha CountySisseton city, Roberts County . . . . . . . . . . . . . . . . . . . . . . 2,470 2,572 2,181 –4 .0 1,057 1,093 1,008 –3 .3 1 .59 1 .59 1,553 .5 664 .8 Sisseton city, Roberts CountySoldier Creek CDP, Todd County . . . . . . . . . . . . . . . . . . . . 227 (X) (X) (X) 62 (X) (X) (X) 12 .24 12 .23 18 .6 5 .1 Soldier Creek CDP, Todd CountySouth Shore town, Codington County . . . . . . . . . . . . . . . . 225 270 260 –16 .7 122 131 115 –6 .9 1 .40 1 .40 160 .7 87 .1 South Shore town, Codington CountySpearfish city, Lawrence County . . . . . . . . . . . . . . . . . . . . 10,494 8,606 6,966 21 .9 5,045 3,904 2,913 29 .2 16 .34 16 .34 642 .2 308 .8 Spearfish city, Lawrence CountySpencer city, McCook County . . . . . . . . . . . . . . . . . . . . . . 154 157 317 –1 .9 77 73 162 5 .5 0 .27 0 .27 570 .4 285 .2 Spencer city, McCook County
Spring Creek CDP, Todd County . . . . . . . . . . . . . . . . . . . . 268 136 231 97 .1 71 33 57 115 .2 10 .37 10 .37 25 .8 6 .8 Spring Creek CDP, Todd CountySpringfield city, Bon Homme County . . . . . . . . . . . . . . . . . 1,989 792 834 151 .1 433 400 382 8 .3 1 .01 1 .01 1,969 .3 428 .7 Springfield city, Bon Homme CountyStickney town, Aurora County . . . . . . . . . . . . . . . . . . . . . . 284 334 323 –15 .0 152 169 170 –10 .1 0 .27 0 .27 1,051 .9 563 .0 Stickney town, Aurora CountyStockholm town, Grant County . . . . . . . . . . . . . . . . . . . . . 108 105 89 2 .9 55 57 43 –3 .5 0 .44 0 .43 251 .2 127 .9 Stockholm town, Grant CountyStorla CDP, Aurora County . . . . . . . . . . . . . . . . . . . . . . . . 6 7 (X) –14 .3 6 3 (X) 100 .0 0 .13 0 .13 46 .2 46 .2 Storla CDP, Aurora CountyStrandburg town, Grant County . . . . . . . . . . . . . . . . . . . . . 72 69 74 4 .3 36 33 39 9 .1 0 .07 0 .07 1,028 .6 514 .3 Strandburg town, Grant CountyStratford town, Brown County . . . . . . . . . . . . . . . . . . . . . . 72 96 85 –25 .0 41 42 43 –2 .4 0 .25 0 .25 288 .0 164 .0 Stratford town, Brown CountySturgis city, Meade County . . . . . . . . . . . . . . . . . . . . . . . . 6,627 6,442 5,330 2 .9 3,154 2,989 2,358 5 .5 3 .99 3 .99 1,660 .9 790 .5 Sturgis city, Meade CountySummerset city, Meade County . . . . . . . . . . . . . . . . . . . . . 1,814 (X) (X) (X) 707 (X) (X) (X) 2 .21 2 .21 820 .8 319 .9 Summerset city, Meade CountySummit town, Roberts County . . . . . . . . . . . . . . . . . . . . . . 288 281 267 2 .5 129 144 138 –10 .4 0 .56 0 .56 514 .3 230 .4 Summit town, Roberts County
Tabor town, Bon Homme County . . . . . . . . . . . . . . . . . . . . 423 417 403 1 .4 199 201 194 –1 .0 0 .37 0 .37 1,143 .2 537 .8 Tabor town, Bon Homme CountyTea city, Lincoln County . . . . . . . . . . . . . . . . . . . . . . . . . . . 3,806 1,742 786 118 .5 1,354 600 261 125 .7 1 .69 1 .69 2,252 .1 801 .2 Tea city, Lincoln CountyTimber Lake city, Dewey County . . . . . . . . . . . . . . . . . . . . 443 443 517 – 208 207 252 0 .5 0 .41 0 .41 1,080 .5 507 .3 Timber Lake city, Dewey CountyTolstoy town, Potter County . . . . . . . . . . . . . . . . . . . . . . . . 36 64 69 –43 .8 31 47 46 –34 .0 0 .18 0 .18 200 .0 172 .2 Tolstoy town, Potter CountyToronto town, Deuel County . . . . . . . . . . . . . . . . . . . . . . . 212 202 201 5 .0 115 113 105 1 .8 0 .31 0 .31 683 .9 371 .0 Toronto town, Deuel CountyTrent town, Moody County . . . . . . . . . . . . . . . . . . . . . . . . . 232 254 211 –8 .7 113 111 97 1 .8 1 .04 1 .04 223 .1 108 .7 Trent town, Moody CountyTripp city, Hutchinson County . . . . . . . . . . . . . . . . . . . . . . 647 711 664 –9 .0 360 373 369 –3 .5 0 .59 0 .59 1,096 .6 610 .2 Tripp city, Hutchinson CountyTulare town, Spink County . . . . . . . . . . . . . . . . . . . . . . . . . 207 221 244 –6 .3 103 113 119 –8 .8 0 .26 0 .26 796 .2 396 .2 Tulare town, Spink CountyTurton town, Spink County . . . . . . . . . . . . . . . . . . . . . . . . . 48 61 76 –21 .3 45 47 42 –4 .3 0 .37 0 .37 129 .7 121 .6 Turton town, Spink CountyTwin Brooks town, Grant County . . . . . . . . . . . . . . . . . . . . 69 55 54 25 .5 31 28 26 10 .7 0 .41 0 .41 168 .3 75 .6 Twin Brooks town, Grant County
Two Strike CDP, Todd County . . . . . . . . . . . . . . . . . . . . . . 209 33 112 533 .3 58 11 29 427 .3 18 .57 18 .53 11 .3 3 .1 Two Strike CDP, Todd CountyTyndall city, Bon Homme County . . . . . . . . . . . . . . . . . . . . 1,067 1,239 1,201 –13 .9 531 579 564 –8 .3 1 .58 1 .58 675 .3 336 .1 Tyndall city, Bon Homme CountyUtica town, Yankton County . . . . . . . . . . . . . . . . . . . . . . . . 65 86 115 –24 .4 44 43 43 2 .3 0 .26 0 .26 250 .0 169 .2 Utica town, Yankton County

Population and Housing Unit Counts South Dakota 41U.S. Census Bureau, 2010 Census
Table 9. Population and Housing Units: 1990 to 2010; and Area Measurements and Density: 2010—Con.[For information concerning historical counts and geographic change, see “User Notes .” For information on confidentiality, nonsampling error, and definitions, see Appendixes]
Table 9. Population and Housing Units: 1990 to 2010; and Area Measurements and Density: 2010—Con.[For information concerning historical counts and geographic change, see “User Notes .” For information on confidentiality, nonsampling error, and definitions, see Appendixes]
Area measurements in square miles Average per square mile of land
StatePlace and [in Selected States] County Subdivision
Total area Land area Population density Housing unit density
0 .15 0 .15 900 .0 520 .0 Pierpont town, Day County13 .07 13 .06 1,044 .9 471 .6 Pierre city, Hughes County0 .19 0 .19 1,652 .6 536 .8 Pine Lakes Addition CDP, Minnehaha County2 .84 2 .84 1,164 .8 303 .9 Pine Ridge CDP, Shannon County0 .76 0 .76 930 .3 448 .7 Plankinton city, Aurora County1 .02 1 .02 1,205 .9 612 .7 Platte city, Charles Mix County0 .32 0 .32 753 .1 634 .4 Pollock town, Campbell County9 .54 9 .54 111 .3 23 .4 Porcupine CDP, Shannon County1 .47 1 .42 16 .2 9 .9 Prairie City CDP, Perkins County0 .67 0 .67 741 .8 425 .4 Presho city, Lyman County
0 .24 0 .24 466 .7 283 .3 Pringle town, Custer County0 .76 0 .76 375 .0 175 .0 Pukwana town, Brule County1 .16 1 .16 46 .6 23 .3 Quinn town, Pennington County0 .27 0 .27 644 .4 414 .8 Ramona town, Lake County
55 .49 55 .41 1,226 .4 546 .0 Rapid City city, Pennington County7 .44 7 .44 1,110 .2 416 .8 Rapid Valley CDP, Pennington County0 .25 0 .25 244 .0 144 .0 Ravinia town, Charles Mix County0 .26 0 .26 192 .3 146 .2 Raymond town, Clark County1 .91 1 .89 1,234 .4 628 .0 Redfield city, Spink County0 .30 0 .30 206 .7 173 .3 Ree Heights town, Hand County
1 .14 1 .09 175 .2 78 .0 Reliance town, Lyman County1 .29 1 .29 236 .4 108 .5 Renner Corner CDP, Minnehaha County0 .17 0 .17 700 .0 394 .1 Revillo town, Grant County5 .65 5 .65 15 .8 8 .5 Richland CDP, Union County0 .50 0 .50 66 .0 56 .0 Rockham town, Faulk County0 .47 0 .47 700 .0 376 .6 Roscoe city, Edmunds County
13 .01 12 .96 122 .5 36 .7 Rosebud CDP, Todd County0 .29 0 .29 1,458 .6 786 .2 Rosholt town, Roberts County0 .20 0 .20 915 .0 525 .0 Roslyn town, Day County1 .41 1 .41 10 .6 7 .8 Roswell town, Miner County
2 .09 2 .09 17 .2 17 .7 Running Water CDP, Bon Homme County0 .20 0 .20 55 .0 55 .0 St . Charles CDP, Gregory County0 .36 0 .36 1,969 .4 586 .1 St . Francis town, Todd County0 .34 0 .34 582 .4 264 .7 St . Lawrence town, Hand County1 .34 1 .34 142 .5 66 .4 St . Onge CDP, Lawrence County1 .24 1 .24 1,086 .3 537 .9 Salem city, McCook County0 .85 0 .85 989 .4 535 .3 Scotland city, Bon Homme County0 .71 0 .71 904 .2 470 .4 Selby city, Walworth County0 .42 0 .42 90 .5 69 .0 Seneca town, Faulk County0 .26 0 .26 300 .0 123 .1 Sherman town, Minnehaha County
1 .50 1 .50 389 .3 122 .7 Shindler CDP, Lincoln County0 .37 0 .37 324 .3 164 .9 Sinai town, Brookings County
73 .47 72 .96 2,109 .2 908 .5 Sioux Falls city11 .84 11 .84 1,781 .7 734 .8 Lincoln County61 .63 61 .12 2,172 .7 942 .1 Minnehaha County
1 .59 1 .59 1,553 .5 664 .8 Sisseton city, Roberts County12 .24 12 .23 18 .6 5 .1 Soldier Creek CDP, Todd County1 .40 1 .40 160 .7 87 .1 South Shore town, Codington County
16 .34 16 .34 642 .2 308 .8 Spearfish city, Lawrence County0 .27 0 .27 570 .4 285 .2 Spencer city, McCook County
10 .37 10 .37 25 .8 6 .8 Spring Creek CDP, Todd County1 .01 1 .01 1,969 .3 428 .7 Springfield city, Bon Homme County0 .27 0 .27 1,051 .9 563 .0 Stickney town, Aurora County0 .44 0 .43 251 .2 127 .9 Stockholm town, Grant County0 .13 0 .13 46 .2 46 .2 Storla CDP, Aurora County0 .07 0 .07 1,028 .6 514 .3 Strandburg town, Grant County0 .25 0 .25 288 .0 164 .0 Stratford town, Brown County3 .99 3 .99 1,660 .9 790 .5 Sturgis city, Meade County2 .21 2 .21 820 .8 319 .9 Summerset city, Meade County0 .56 0 .56 514 .3 230 .4 Summit town, Roberts County
0 .37 0 .37 1,143 .2 537 .8 Tabor town, Bon Homme County1 .69 1 .69 2,252 .1 801 .2 Tea city, Lincoln County0 .41 0 .41 1,080 .5 507 .3 Timber Lake city, Dewey County0 .18 0 .18 200 .0 172 .2 Tolstoy town, Potter County0 .31 0 .31 683 .9 371 .0 Toronto town, Deuel County1 .04 1 .04 223 .1 108 .7 Trent town, Moody County0 .59 0 .59 1,096 .6 610 .2 Tripp city, Hutchinson County0 .26 0 .26 796 .2 396 .2 Tulare town, Spink County0 .37 0 .37 129 .7 121 .6 Turton town, Spink County0 .41 0 .41 168 .3 75 .6 Twin Brooks town, Grant County
18 .57 18 .53 11 .3 3 .1 Two Strike CDP, Todd County1 .58 1 .58 675 .3 336 .1 Tyndall city, Bon Homme County0 .26 0 .26 250 .0 169 .2 Utica town, Yankton County
StatePlace and [in Selected States] County Subdivision
Population Housing units
2010 2000 1990
Percent change 2000 to
2010 2010 2000 1990
Percent change 2000 to
2010
Pierpont town, Day County . . . . . . . . . . . . . . . . . . . . . . . . 135 122 173 10 .7 78 83 90 –6 .0Pierre city, Hughes County . . . . . . . . . . . . . . . . . . . . . . . . 13,646 13,876 12,906 –1 .7 6,159 5,949 5,390 3 .5Pine Lakes Addition CDP, Minnehaha County . . . . . . . . . . 314 (X) (X) (X) 102 (X) (X) (X)Pine Ridge CDP, Shannon County . . . . . . . . . . . . . . . . . . 3,308 3,171 2,596 4 .3 863 742 694 16 .3Plankinton city, Aurora County . . . . . . . . . . . . . . . . . . . . . . 707 601 604 17 .6 341 298 306 14 .4Platte city, Charles Mix County . . . . . . . . . . . . . . . . . . . . . 1,230 1,367 1,311 –10 .0 625 637 600 –1 .9Pollock town, Campbell County . . . . . . . . . . . . . . . . . . . . . 241 339 379 –28 .9 203 204 180 –0 .5Porcupine CDP, Shannon County . . . . . . . . . . . . . . . . . . . 1,062 407 783 160 .9 223 103 175 116 .5Prairie City CDP, Perkins County . . . . . . . . . . . . . . . . . . . . 23 (X) (X) (X) 14 (X) (X) (X)Presho city, Lyman County . . . . . . . . . . . . . . . . . . . . . . . . 497 588 654 –15 .5 285 305 306 –6 .6
Pringle town, Custer County . . . . . . . . . . . . . . . . . . . . . . . 112 125 96 –10 .4 68 64 51 6 .3Pukwana town, Brule County . . . . . . . . . . . . . . . . . . . . . . 285 287 263 –0 .7 133 131 122 1 .5Quinn town, Pennington County . . . . . . . . . . . . . . . . . . . . 54 44 72 22 .7 27 23 35 17 .4Ramona town, Lake County . . . . . . . . . . . . . . . . . . . . . . . 174 190 194 –8 .4 112 99 97 13 .1Rapid City city, Pennington County . . . . . . . . . . . . . . . . . . 67,956 r 59,573 54,523 14 .1 30,254 r 25,085 22,530 20 .6Rapid Valley CDP, Pennington County . . . . . . . . . . . . . . . . 8,260 7,043 5,968 17 .3 3,101 2,493 2,094 24 .4Ravinia town, Charles Mix County . . . . . . . . . . . . . . . . . . . 61 79 79 –22 .8 36 33 36 9 .1Raymond town, Clark County . . . . . . . . . . . . . . . . . . . . . . 50 86 96 –41 .9 38 39 51 –2 .6Redfield city, Spink County . . . . . . . . . . . . . . . . . . . . . . . . 2,333 r 2,518 2,770 –7 .3 1,187 r 1,262 1,306 –5 .9Ree Heights town, Hand County . . . . . . . . . . . . . . . . . . . . 62 85 91 –27 .1 52 46 49 13 .0
Reliance town, Lyman County . . . . . . . . . . . . . . . . . . . . . . 191 206 169 –7 .3 85 92 84 –7 .6Renner Corner CDP, Minnehaha County . . . . . . . . . . . . . . 305 (X) (X) (X) 140 (X) (X) (X)Revillo town, Grant County . . . . . . . . . . . . . . . . . . . . . . . . 119 147 152 –19 .0 67 79 95 –15 .2Richland CDP, Union County . . . . . . . . . . . . . . . . . . . . . . . 89 (X) (X) (X) 48 (X) (X) (X)Rockham town, Faulk County . . . . . . . . . . . . . . . . . . . . . . 33 53 48 –37 .7 28 27 22 3 .7Roscoe city, Edmunds County . . . . . . . . . . . . . . . . . . . . . . 329 324 362 1 .5 177 167 183 6 .0Rosebud CDP, Todd County . . . . . . . . . . . . . . . . . . . . . . . 1,587 1,557 1,538 1 .9 476 465 466 2 .4Rosholt town, Roberts County . . . . . . . . . . . . . . . . . . . . . . 423 419 408 1 .0 228 199 200 14 .6Roslyn town, Day County . . . . . . . . . . . . . . . . . . . . . . . . . 183 225 251 –18 .7 105 109 114 –3 .7Roswell town, Miner County . . . . . . . . . . . . . . . . . . . . . . . 15 21 19 –28 .6 11 12 10 –8 .3
Running Water CDP, Bon Homme County . . . . . . . . . . . . . 36 (X) (X) (X) 37 (X) (X) (X)St . Charles CDP, Gregory County . . . . . . . . . . . . . . . . . . . 11 19 (X) –42 .1 11 12 (X) –8 .3St . Francis town, Todd County . . . . . . . . . . . . . . . . . . . . . . 709 675 815 5 .0 211 204 237 3 .4St . Lawrence town, Hand County . . . . . . . . . . . . . . . . . . . 198 210 223 –5 .7 90 104 114 –13 .5St . Onge CDP, Lawrence County . . . . . . . . . . . . . . . . . . . . 191 (X) (X) (X) 89 (X) (X) (X)Salem city, McCook County . . . . . . . . . . . . . . . . . . . . . . . . 1,347 1,371 1,289 –1 .8 667 640 581 4 .2Scotland city, Bon Homme County . . . . . . . . . . . . . . . . . . 841 891 968 –5 .6 455 469 496 –3 .0Selby city, Walworth County . . . . . . . . . . . . . . . . . . . . . . . 642 736 707 –12 .8 334 335 344 –0 .3Seneca town, Faulk County . . . . . . . . . . . . . . . . . . . . . . . . 38 58 81 –34 .5 29 36 45 –19 .4Sherman town, Minnehaha County . . . . . . . . . . . . . . . . . . 78 87 88 –10 .3 32 33 33 –3 .0
Shindler CDP, Lincoln County . . . . . . . . . . . . . . . . . . . . . . 584 (X) (X) (X) 184 (X) (X) (X)Sinai town, Brookings County . . . . . . . . . . . . . . . . . . . . . . 120 133 120 –9 .8 61 62 63 –1 .6Sioux Falls city . . . . . . . . . . . . . . . . . . . . . . . . . . . . . . . . . . 153,888 r 124,158 100,836 23 .9 66,283 51,680 41,576 28 .3 Lincoln County . . . . . . . . . . . . . . . . . . . . . . . . . . . . . . . . 21,095 r 6,636 1,409 217 .9 8,700 2,514 473 246 .1 Minnehaha County . . . . . . . . . . . . . . . . . . . . . . . . . . . . . 132,793 r 117,522 99,427 13 .0 57,583 49,166 41,103 17 .1Sisseton city, Roberts County . . . . . . . . . . . . . . . . . . . . . . 2,470 2,572 2,181 –4 .0 1,057 1,093 1,008 –3 .3Soldier Creek CDP, Todd County . . . . . . . . . . . . . . . . . . . . 227 (X) (X) (X) 62 (X) (X) (X)South Shore town, Codington County . . . . . . . . . . . . . . . . 225 270 260 –16 .7 122 131 115 –6 .9Spearfish city, Lawrence County . . . . . . . . . . . . . . . . . . . . 10,494 8,606 6,966 21 .9 5,045 3,904 2,913 29 .2Spencer city, McCook County . . . . . . . . . . . . . . . . . . . . . . 154 157 317 –1 .9 77 73 162 5 .5
Spring Creek CDP, Todd County . . . . . . . . . . . . . . . . . . . . 268 136 231 97 .1 71 33 57 115 .2Springfield city, Bon Homme County . . . . . . . . . . . . . . . . . 1,989 792 834 151 .1 433 400 382 8 .3Stickney town, Aurora County . . . . . . . . . . . . . . . . . . . . . . 284 334 323 –15 .0 152 169 170 –10 .1Stockholm town, Grant County . . . . . . . . . . . . . . . . . . . . . 108 105 89 2 .9 55 57 43 –3 .5Storla CDP, Aurora County . . . . . . . . . . . . . . . . . . . . . . . . 6 7 (X) –14 .3 6 3 (X) 100 .0Strandburg town, Grant County . . . . . . . . . . . . . . . . . . . . . 72 69 74 4 .3 36 33 39 9 .1Stratford town, Brown County . . . . . . . . . . . . . . . . . . . . . . 72 96 85 –25 .0 41 42 43 –2 .4Sturgis city, Meade County . . . . . . . . . . . . . . . . . . . . . . . . 6,627 6,442 5,330 2 .9 3,154 2,989 2,358 5 .5Summerset city, Meade County . . . . . . . . . . . . . . . . . . . . . 1,814 (X) (X) (X) 707 (X) (X) (X)Summit town, Roberts County . . . . . . . . . . . . . . . . . . . . . . 288 281 267 2 .5 129 144 138 –10 .4
Tabor town, Bon Homme County . . . . . . . . . . . . . . . . . . . . 423 417 403 1 .4 199 201 194 –1 .0Tea city, Lincoln County . . . . . . . . . . . . . . . . . . . . . . . . . . . 3,806 1,742 786 118 .5 1,354 600 261 125 .7Timber Lake city, Dewey County . . . . . . . . . . . . . . . . . . . . 443 443 517 – 208 207 252 0 .5Tolstoy town, Potter County . . . . . . . . . . . . . . . . . . . . . . . . 36 64 69 –43 .8 31 47 46 –34 .0Toronto town, Deuel County . . . . . . . . . . . . . . . . . . . . . . . 212 202 201 5 .0 115 113 105 1 .8Trent town, Moody County . . . . . . . . . . . . . . . . . . . . . . . . . 232 254 211 –8 .7 113 111 97 1 .8Tripp city, Hutchinson County . . . . . . . . . . . . . . . . . . . . . . 647 711 664 –9 .0 360 373 369 –3 .5Tulare town, Spink County . . . . . . . . . . . . . . . . . . . . . . . . . 207 221 244 –6 .3 103 113 119 –8 .8Turton town, Spink County . . . . . . . . . . . . . . . . . . . . . . . . . 48 61 76 –21 .3 45 47 42 –4 .3Twin Brooks town, Grant County . . . . . . . . . . . . . . . . . . . . 69 55 54 25 .5 31 28 26 10 .7
Two Strike CDP, Todd County . . . . . . . . . . . . . . . . . . . . . . 209 33 112 533 .3 58 11 29 427 .3Tyndall city, Bon Homme County . . . . . . . . . . . . . . . . . . . . 1,067 1,239 1,201 –13 .9 531 579 564 –8 .3Utica town, Yankton County . . . . . . . . . . . . . . . . . . . . . . . . 65 86 115 –24 .4 44 43 43 2 .3

42 South Dakota Population and Housing Unit CountsU.S. Census Bureau, 2010 Census
Table 9. Population and Housing Units: 1990 to 2010; and Area Measurements and Density: 2010—Con.[For information concerning historical counts and geographic change, see “User Notes .” For information on confidentiality, nonsampling error, and definitions, see Appendixes]
Table 9. Population and Housing Units: 1990 to 2010; and Area Measurements and Density: 2010—Con.[For information concerning historical counts and geographic change, see “User Notes .” For information on confidentiality, nonsampling error, and definitions, see Appendixes]
StatePlace and [in Selected States] County Subdivision
Population Housing units Area measurements in square miles Average per square mile of land
StatePlace and [in Selected States] County Subdivision
2010 2000 1990
Percent change 2000 to
2010 2010 2000 1990
Percent change 2000 to
2010 Total area Land area Population density Housing unit density
Vale CDP, Butte County . . . . . . . . . . . . . . . . . . . . . . . . . . . 136 (X) (X) (X) 77 (X) (X) (X) 1 .47 1 .47 92 .5 52 .4 Vale CDP, Butte CountyValley Springs city, Minnehaha County . . . . . . . . . . . . . . . 759 792 739 –4 .2 327 299 282 9 .4 0 .82 0 .82 925 .6 398 .8 Valley Springs city, Minnehaha CountyVeblen city, Marshall County . . . . . . . . . . . . . . . . . . . . . . . 531 281 321 89 .0 174 167 172 4 .2 0 .31 0 .31 1,712 .9 561 .3 Veblen city, Marshall CountyVerdon town, Brown County . . . . . . . . . . . . . . . . . . . . . . . 5 6 7 –16 .7 4 4 6 – 0 .25 0 .25 20 .0 16 .0 Verdon town, Brown CountyVermillion city, Clay County . . . . . . . . . . . . . . . . . . . . . . . . 10,571 r 10,276 10,034 2 .9 4,043 3,967 3,428 1 .9 4 .03 4 .03 2,623 .1 1,003 .2 Vermillion city, Clay CountyViborg city, Turner County . . . . . . . . . . . . . . . . . . . . . . . . . 782 832 763 –6 .0 429 403 373 6 .5 0 .40 0 .40 1,955 .0 1,072 .5 Viborg city, Turner CountyVienna town, Clark County . . . . . . . . . . . . . . . . . . . . . . . . 45 78 93 –42 .3 22 41 47 –46 .3 0 .84 0 .84 53 .6 26 .2 Vienna town, Clark CountyVilas town, Miner County . . . . . . . . . . . . . . . . . . . . . . . . . . 20 19 28 5 .3 13 9 12 44 .4 2 .32 2 .32 8 .6 5 .6 Vilas town, Miner CountyVirgil town, Beadle County . . . . . . . . . . . . . . . . . . . . . . . . 16 25 33 –36 .0 14 15 19 –6 .7 1 .00 1 .00 16 .0 14 .0 Virgil town, Beadle CountyVivian CDP, Lyman County . . . . . . . . . . . . . . . . . . . . . . . . 119 131 (X) –9 .2 63 61 (X) 3 .3 1 .73 1 .73 68 .8 36 .4 Vivian CDP, Lyman County
Volga city, Brookings County . . . . . . . . . . . . . . . . . . . . . . . 1,768 1,435 1,263 23 .2 783 596 503 31 .4 0 .91 0 .91 1,942 .9 860 .4 Volga city, Brookings CountyVolin town, Yankton County . . . . . . . . . . . . . . . . . . . . . . . . 161 207 175 –22 .2 76 81 68 –6 .2 0 .20 0 .20 805 .0 380 .0 Volin town, Yankton CountyWagner city, Charles Mix County . . . . . . . . . . . . . . . . . . . . 1,566 1,675 1,462 –6 .5 726 747 696 –2 .8 2 .05 2 .04 767 .6 355 .9 Wagner city, Charles Mix CountyWakonda town, Clay County . . . . . . . . . . . . . . . . . . . . . . . 321 374 329 –14 .2 163 156 150 4 .5 0 .39 0 .39 823 .1 417 .9 Wakonda town, Clay CountyWall town, Pennington County . . . . . . . . . . . . . . . . . . . . . . 766 818 834 –6 .4 436 438 421 –0 .5 2 .21 2 .17 353 .0 200 .9 Wall town, Pennington CountyWallace town, Codington County . . . . . . . . . . . . . . . . . . . . 85 86 83 –1 .2 42 45 52 –6 .7 0 .13 0 .13 653 .8 323 .1 Wallace town, Codington CountyWanblee CDP, Jackson County . . . . . . . . . . . . . . . . . . . . . 725 641 654 13 .1 153 144 149 6 .3 2 .15 2 .14 338 .8 71 .5 Wanblee CDP, Jackson CountyWard town, Moody County . . . . . . . . . . . . . . . . . . . . . . . . 48 41 35 17 .1 21 22 22 –4 .5 0 .29 0 .29 165 .5 72 .4 Ward town, Moody CountyWarner town, Brown County . . . . . . . . . . . . . . . . . . . . . . . 457 419 336 9 .1 171 153 119 11 .8 0 .28 0 .28 1,632 .1 610 .7 Warner town, Brown CountyWasta town, Pennington County . . . . . . . . . . . . . . . . . . . . 80 75 82 6 .7 46 46 43 – 0 .19 0 .19 421 .1 242 .1 Wasta town, Pennington County
Watertown city, Codington County . . . . . . . . . . . . . . . . . . . 21,482 20,237 17,623 6 .2 10,050 9,193 7,641 9 .3 25 .04 17 .45 1,231 .1 575 .9 Watertown city, Codington CountyWaubay city, Day County . . . . . . . . . . . . . . . . . . . . . . . . . . 576 662 647 –13 .0 374 389 341 –3 .9 1 .45 1 .45 397 .2 257 .9 Waubay city, Day CountyWaverly CDP, Codington County . . . . . . . . . . . . . . . . . . . . 37 (X) (X) (X) 19 (X) (X) (X) 1 .02 1 .02 36 .3 18 .6 Waverly CDP, Codington CountyWebster city, Day County . . . . . . . . . . . . . . . . . . . . . . . . . . 1,886 1,952 2,017 –3 .4 1,007 1,023 1,018 –1 .6 1 .49 1 .49 1,265 .8 675 .8 Webster city, Day CountyWentworth village, Lake County . . . . . . . . . . . . . . . . . . . . 171 188 181 –9 .0 86 90 87 –4 .4 0 .25 0 .25 684 .0 344 .0 Wentworth village, Lake CountyWessington city . . . . . . . . . . . . . . . . . . . . . . . . . . . . . . . . . 170 248 265 –31 .5 139 143 145 –2 .8 0 .38 0 .38 447 .4 365 .8 Wessington city Beadle County . . . . . . . . . . . . . . . . . . . . . . . . . . . . . . . . 160 230 241 –30 .4 130 134 137 –3 .0 0 .34 0 .34 470 .6 382 .4 Beadle County Hand County . . . . . . . . . . . . . . . . . . . . . . . . . . . . . . . . . 10 18 24 –44 .4 9 9 8 – 0 .04 0 .04 250 .0 225 .0 Hand CountyWessington Springs city, Jerauld County . . . . . . . . . . . . . 956 1,011 1,083 –5 .4 526 580 569 –9 .3 1 .77 1 .77 540 .1 297 .2 Wessington Springs city, Jerauld CountyWestport town, Brown County . . . . . . . . . . . . . . . . . . . . . . 133 125 112 6 .4 51 52 42 –1 .9 0 .23 0 .23 578 .3 221 .7 Westport town, Brown County
Wetonka town, McPherson County . . . . . . . . . . . . . . . . . . 8 12 12 –33 .3 3 7 9 –57 .1 0 .25 0 .25 32 .0 12 .0 Wetonka town, McPherson CountyWhite city, Brookings County . . . . . . . . . . . . . . . . . . . . . . . 485 530 536 –8 .5 212 212 201 – 0 .99 0 .99 489 .9 214 .1 White city, Brookings CountyWhitehorse CDP, Dewey County . . . . . . . . . . . . . . . . . . . . 141 141 (X) – 40 43 (X) –7 .0 2 .74 2 .74 51 .5 14 .6 Whitehorse CDP, Dewey CountyWhite Horse CDP, Todd County . . . . . . . . . . . . . . . . . . . . . 276 180 152 53 .3 86 39 32 120 .5 3 .17 3 .16 87 .3 27 .2 White Horse CDP, Todd CountyWhite Lake city, Aurora County . . . . . . . . . . . . . . . . . . . . . 372 405 419 –8 .1 192 166 178 15 .7 0 .43 0 .43 865 .1 446 .5 White Lake city, Aurora CountyWhite River city, Mellette County . . . . . . . . . . . . . . . . . . . . 581 598 595 –2 .8 245 252 272 –2 .8 0 .52 0 .52 1,117 .3 471 .2 White River city, Mellette CountyWhite Rock town, Roberts County . . . . . . . . . . . . . . . . . . . 3 18 7 –83 .3 8 6 6 33 .3 1 .57 1 .57 1 .9 5 .1 White Rock town, Roberts CountyWhitewood city, Lawrence County . . . . . . . . . . . . . . . . . . . 927 844 891 9 .8 392 356 330 10 .1 0 .64 0 .64 1,448 .4 612 .5 Whitewood city, Lawrence CountyWillow Lake city, Clark County . . . . . . . . . . . . . . . . . . . . . . 263 294 317 –10 .5 129 148 164 –12 .8 0 .38 0 .37 710 .8 348 .6 Willow Lake city, Clark CountyWilmot city, Roberts County . . . . . . . . . . . . . . . . . . . . . . . 492 543 566 –9 .4 237 252 255 –6 .0 0 .49 0 .49 1,004 .1 483 .7 Wilmot city, Roberts County
Winfred CDP, Lake County . . . . . . . . . . . . . . . . . . . . . . . . 52 (X) (X) (X) 26 (X) (X) (X) 1 .03 0 .99 52 .5 26 .3 Winfred CDP, Lake CountyWinner city, Tripp County . . . . . . . . . . . . . . . . . . . . . . . . . . 2,897 3,137 3,354 –7 .7 1,547 1,526 1,540 1 .4 2 .20 2 .20 1,316 .8 703 .2 Winner city, Tripp CountyWolsey town, Beadle County . . . . . . . . . . . . . . . . . . . . . . . 376 418 442 –10 .0 194 185 193 4 .9 2 .30 2 .26 166 .4 85 .8 Wolsey town, Beadle CountyWood town, Mellette County . . . . . . . . . . . . . . . . . . . . . . . 62 66 73 –6 .1 33 38 48 –13 .2 0 .25 0 .25 248 .0 132 .0 Wood town, Mellette CountyWoonsocket city, Sanborn County . . . . . . . . . . . . . . . . . . . 655 720 766 –9 .0 318 330 339 –3 .6 0 .79 0 .78 839 .7 407 .7 Woonsocket city, Sanborn CountyWorthing city, Lincoln County . . . . . . . . . . . . . . . . . . . . . . 877 585 371 49 .9 334 213 141 56 .8 0 .56 0 .56 1,566 .1 596 .4 Worthing city, Lincoln CountyWounded Knee CDP, Shannon County . . . . . . . . . . . . . . . 382 328 18 16 .5 73 56 5 30 .4 1 .07 1 .07 357 .0 68 .2 Wounded Knee CDP, Shannon CountyYale town, Beadle County . . . . . . . . . . . . . . . . . . . . . . . . . 108 118 128 –8 .5 56 55 56 1 .8 0 .15 0 .15 720 .0 373 .3 Yale town, Beadle CountyYankton city, Yankton County . . . . . . . . . . . . . . . . . . . . . . . 14,454 13,528 12,703 6 .8 6,365 5,735 5,219 11 .0 8 .45 8 .21 1,760 .5 775 .3 Yankton city, Yankton County
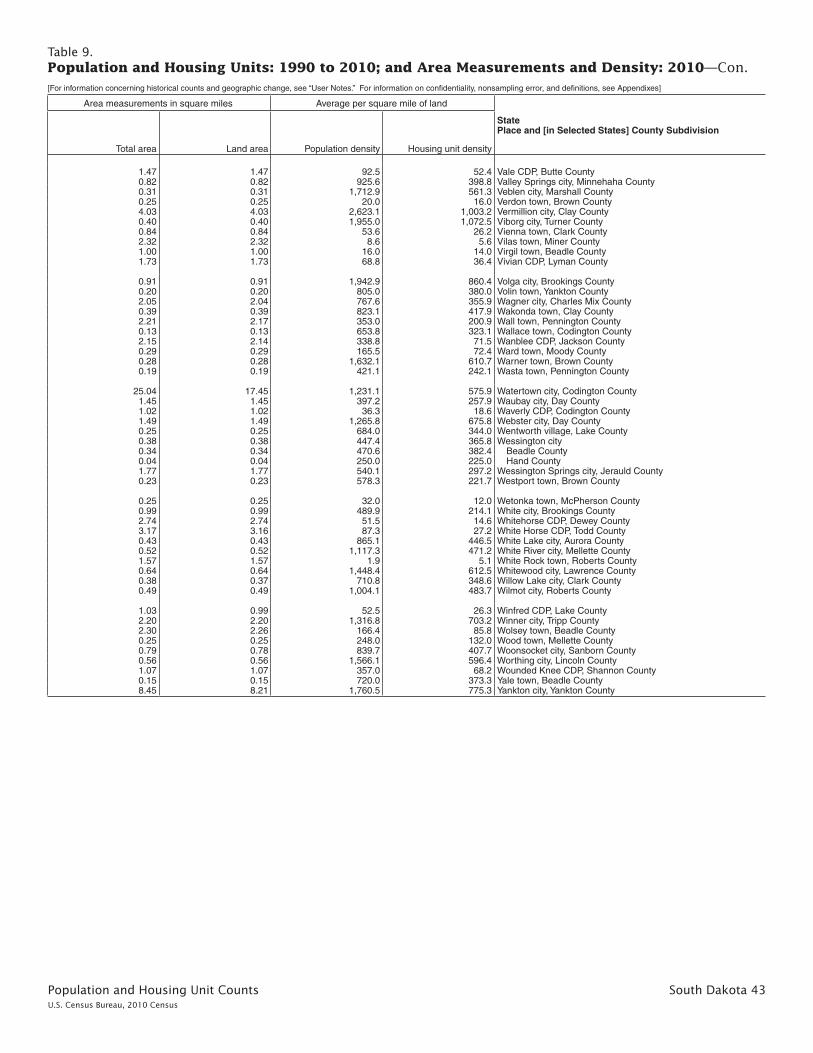
Population and Housing Unit Counts South Dakota 43U.S. Census Bureau, 2010 Census
Table 9. Population and Housing Units: 1990 to 2010; and Area Measurements and Density: 2010—Con.[For information concerning historical counts and geographic change, see “User Notes .” For information on confidentiality, nonsampling error, and definitions, see Appendixes]
Table 9. Population and Housing Units: 1990 to 2010; and Area Measurements and Density: 2010—Con.[For information concerning historical counts and geographic change, see “User Notes .” For information on confidentiality, nonsampling error, and definitions, see Appendixes]
Area measurements in square miles Average per square mile of land
StatePlace and [in Selected States] County Subdivision
Total area Land area Population density Housing unit density
1 .47 1 .47 92 .5 52 .4 Vale CDP, Butte County0 .82 0 .82 925 .6 398 .8 Valley Springs city, Minnehaha County0 .31 0 .31 1,712 .9 561 .3 Veblen city, Marshall County0 .25 0 .25 20 .0 16 .0 Verdon town, Brown County4 .03 4 .03 2,623 .1 1,003 .2 Vermillion city, Clay County0 .40 0 .40 1,955 .0 1,072 .5 Viborg city, Turner County0 .84 0 .84 53 .6 26 .2 Vienna town, Clark County2 .32 2 .32 8 .6 5 .6 Vilas town, Miner County1 .00 1 .00 16 .0 14 .0 Virgil town, Beadle County1 .73 1 .73 68 .8 36 .4 Vivian CDP, Lyman County
0 .91 0 .91 1,942 .9 860 .4 Volga city, Brookings County0 .20 0 .20 805 .0 380 .0 Volin town, Yankton County2 .05 2 .04 767 .6 355 .9 Wagner city, Charles Mix County0 .39 0 .39 823 .1 417 .9 Wakonda town, Clay County2 .21 2 .17 353 .0 200 .9 Wall town, Pennington County0 .13 0 .13 653 .8 323 .1 Wallace town, Codington County2 .15 2 .14 338 .8 71 .5 Wanblee CDP, Jackson County0 .29 0 .29 165 .5 72 .4 Ward town, Moody County0 .28 0 .28 1,632 .1 610 .7 Warner town, Brown County0 .19 0 .19 421 .1 242 .1 Wasta town, Pennington County
25 .04 17 .45 1,231 .1 575 .9 Watertown city, Codington County1 .45 1 .45 397 .2 257 .9 Waubay city, Day County1 .02 1 .02 36 .3 18 .6 Waverly CDP, Codington County1 .49 1 .49 1,265 .8 675 .8 Webster city, Day County0 .25 0 .25 684 .0 344 .0 Wentworth village, Lake County0 .38 0 .38 447 .4 365 .8 Wessington city0 .34 0 .34 470 .6 382 .4 Beadle County0 .04 0 .04 250 .0 225 .0 Hand County1 .77 1 .77 540 .1 297 .2 Wessington Springs city, Jerauld County0 .23 0 .23 578 .3 221 .7 Westport town, Brown County
0 .25 0 .25 32 .0 12 .0 Wetonka town, McPherson County0 .99 0 .99 489 .9 214 .1 White city, Brookings County2 .74 2 .74 51 .5 14 .6 Whitehorse CDP, Dewey County3 .17 3 .16 87 .3 27 .2 White Horse CDP, Todd County0 .43 0 .43 865 .1 446 .5 White Lake city, Aurora County0 .52 0 .52 1,117 .3 471 .2 White River city, Mellette County1 .57 1 .57 1 .9 5 .1 White Rock town, Roberts County0 .64 0 .64 1,448 .4 612 .5 Whitewood city, Lawrence County0 .38 0 .37 710 .8 348 .6 Willow Lake city, Clark County0 .49 0 .49 1,004 .1 483 .7 Wilmot city, Roberts County
1 .03 0 .99 52 .5 26 .3 Winfred CDP, Lake County2 .20 2 .20 1,316 .8 703 .2 Winner city, Tripp County2 .30 2 .26 166 .4 85 .8 Wolsey town, Beadle County0 .25 0 .25 248 .0 132 .0 Wood town, Mellette County0 .79 0 .78 839 .7 407 .7 Woonsocket city, Sanborn County0 .56 0 .56 1,566 .1 596 .4 Worthing city, Lincoln County1 .07 1 .07 357 .0 68 .2 Wounded Knee CDP, Shannon County0 .15 0 .15 720 .0 373 .3 Yale town, Beadle County8 .45 8 .21 1,760 .5 775 .3 Yankton city, Yankton County
StatePlace and [in Selected States] County Subdivision
Population Housing units
2010 2000 1990
Percent change 2000 to
2010 2010 2000 1990
Percent change 2000 to
2010
Vale CDP, Butte County . . . . . . . . . . . . . . . . . . . . . . . . . . . 136 (X) (X) (X) 77 (X) (X) (X)Valley Springs city, Minnehaha County . . . . . . . . . . . . . . . 759 792 739 –4 .2 327 299 282 9 .4Veblen city, Marshall County . . . . . . . . . . . . . . . . . . . . . . . 531 281 321 89 .0 174 167 172 4 .2Verdon town, Brown County . . . . . . . . . . . . . . . . . . . . . . . 5 6 7 –16 .7 4 4 6 –Vermillion city, Clay County . . . . . . . . . . . . . . . . . . . . . . . . 10,571 r 10,276 10,034 2 .9 4,043 3,967 3,428 1 .9Viborg city, Turner County . . . . . . . . . . . . . . . . . . . . . . . . . 782 832 763 –6 .0 429 403 373 6 .5Vienna town, Clark County . . . . . . . . . . . . . . . . . . . . . . . . 45 78 93 –42 .3 22 41 47 –46 .3Vilas town, Miner County . . . . . . . . . . . . . . . . . . . . . . . . . . 20 19 28 5 .3 13 9 12 44 .4Virgil town, Beadle County . . . . . . . . . . . . . . . . . . . . . . . . 16 25 33 –36 .0 14 15 19 –6 .7Vivian CDP, Lyman County . . . . . . . . . . . . . . . . . . . . . . . . 119 131 (X) –9 .2 63 61 (X) 3 .3
Volga city, Brookings County . . . . . . . . . . . . . . . . . . . . . . . 1,768 1,435 1,263 23 .2 783 596 503 31 .4Volin town, Yankton County . . . . . . . . . . . . . . . . . . . . . . . . 161 207 175 –22 .2 76 81 68 –6 .2Wagner city, Charles Mix County . . . . . . . . . . . . . . . . . . . . 1,566 1,675 1,462 –6 .5 726 747 696 –2 .8Wakonda town, Clay County . . . . . . . . . . . . . . . . . . . . . . . 321 374 329 –14 .2 163 156 150 4 .5Wall town, Pennington County . . . . . . . . . . . . . . . . . . . . . . 766 818 834 –6 .4 436 438 421 –0 .5Wallace town, Codington County . . . . . . . . . . . . . . . . . . . . 85 86 83 –1 .2 42 45 52 –6 .7Wanblee CDP, Jackson County . . . . . . . . . . . . . . . . . . . . . 725 641 654 13 .1 153 144 149 6 .3Ward town, Moody County . . . . . . . . . . . . . . . . . . . . . . . . 48 41 35 17 .1 21 22 22 –4 .5Warner town, Brown County . . . . . . . . . . . . . . . . . . . . . . . 457 419 336 9 .1 171 153 119 11 .8Wasta town, Pennington County . . . . . . . . . . . . . . . . . . . . 80 75 82 6 .7 46 46 43 –
Watertown city, Codington County . . . . . . . . . . . . . . . . . . . 21,482 20,237 17,623 6 .2 10,050 9,193 7,641 9 .3Waubay city, Day County . . . . . . . . . . . . . . . . . . . . . . . . . . 576 662 647 –13 .0 374 389 341 –3 .9Waverly CDP, Codington County . . . . . . . . . . . . . . . . . . . . 37 (X) (X) (X) 19 (X) (X) (X)Webster city, Day County . . . . . . . . . . . . . . . . . . . . . . . . . . 1,886 1,952 2,017 –3 .4 1,007 1,023 1,018 –1 .6Wentworth village, Lake County . . . . . . . . . . . . . . . . . . . . 171 188 181 –9 .0 86 90 87 –4 .4Wessington city . . . . . . . . . . . . . . . . . . . . . . . . . . . . . . . . . 170 248 265 –31 .5 139 143 145 –2 .8 Beadle County . . . . . . . . . . . . . . . . . . . . . . . . . . . . . . . . 160 230 241 –30 .4 130 134 137 –3 .0 Hand County . . . . . . . . . . . . . . . . . . . . . . . . . . . . . . . . . 10 18 24 –44 .4 9 9 8 –Wessington Springs city, Jerauld County . . . . . . . . . . . . . 956 1,011 1,083 –5 .4 526 580 569 –9 .3Westport town, Brown County . . . . . . . . . . . . . . . . . . . . . . 133 125 112 6 .4 51 52 42 –1 .9
Wetonka town, McPherson County . . . . . . . . . . . . . . . . . . 8 12 12 –33 .3 3 7 9 –57 .1White city, Brookings County . . . . . . . . . . . . . . . . . . . . . . . 485 530 536 –8 .5 212 212 201 –Whitehorse CDP, Dewey County . . . . . . . . . . . . . . . . . . . . 141 141 (X) – 40 43 (X) –7 .0White Horse CDP, Todd County . . . . . . . . . . . . . . . . . . . . . 276 180 152 53 .3 86 39 32 120 .5White Lake city, Aurora County . . . . . . . . . . . . . . . . . . . . . 372 405 419 –8 .1 192 166 178 15 .7White River city, Mellette County . . . . . . . . . . . . . . . . . . . . 581 598 595 –2 .8 245 252 272 –2 .8White Rock town, Roberts County . . . . . . . . . . . . . . . . . . . 3 18 7 –83 .3 8 6 6 33 .3Whitewood city, Lawrence County . . . . . . . . . . . . . . . . . . . 927 844 891 9 .8 392 356 330 10 .1Willow Lake city, Clark County . . . . . . . . . . . . . . . . . . . . . . 263 294 317 –10 .5 129 148 164 –12 .8Wilmot city, Roberts County . . . . . . . . . . . . . . . . . . . . . . . 492 543 566 –9 .4 237 252 255 –6 .0
Winfred CDP, Lake County . . . . . . . . . . . . . . . . . . . . . . . . 52 (X) (X) (X) 26 (X) (X) (X)Winner city, Tripp County . . . . . . . . . . . . . . . . . . . . . . . . . . 2,897 3,137 3,354 –7 .7 1,547 1,526 1,540 1 .4Wolsey town, Beadle County . . . . . . . . . . . . . . . . . . . . . . . 376 418 442 –10 .0 194 185 193 4 .9Wood town, Mellette County . . . . . . . . . . . . . . . . . . . . . . . 62 66 73 –6 .1 33 38 48 –13 .2Woonsocket city, Sanborn County . . . . . . . . . . . . . . . . . . . 655 720 766 –9 .0 318 330 339 –3 .6Worthing city, Lincoln County . . . . . . . . . . . . . . . . . . . . . . 877 585 371 49 .9 334 213 141 56 .8Wounded Knee CDP, Shannon County . . . . . . . . . . . . . . . 382 328 18 16 .5 73 56 5 30 .4Yale town, Beadle County . . . . . . . . . . . . . . . . . . . . . . . . . 108 118 128 –8 .5 56 55 56 1 .8Yankton city, Yankton County . . . . . . . . . . . . . . . . . . . . . . . 14,454 13,528 12,703 6 .8 6,365 5,735 5,219 11 .0

44 South Dakota Population and Housing Unit CountsU.S. Census Bureau, 2010 Census
Table 10. Rank by 2010 Population and Housing Units: 2000 and 2010 [For information concerning historical counts and geographic change, see “User Notes .” For information on confidentiality, nonsampling error, and definitions, see Appendixes]
Place [2,500 or More Population]Population Housing units
2010 rank 2010 2000 2010 rank 2010 2000
Sioux Falls city . . . . . . . . . . . . . . . . . . . . . . . . . . . . . . . . . . . 1 153,888 r 124,158 1 66,283 51,680Rapid City city . . . . . . . . . . . . . . . . . . . . . . . . . . . . . . . . . . . 2 67,956 r 59,573 2 30,254 r 25,085Aberdeen city . . . . . . . . . . . . . . . . . . . . . . . . . . . . . . . . . . . . 3 26,091 24,658 3 12,158 11,259Brookings city . . . . . . . . . . . . . . . . . . . . . . . . . . . . . . . . . . . 4 22,056 18,504 5 8,715 7,359Watertown city . . . . . . . . . . . . . . . . . . . . . . . . . . . . . . . . . . . 5 21,482 20,237 4 10,050 9,193Mitchell city . . . . . . . . . . . . . . . . . . . . . . . . . . . . . . . . . . . . . 6 15,254 14,558 6 7,120 6,555Yankton city . . . . . . . . . . . . . . . . . . . . . . . . . . . . . . . . . . . . . 7 14,454 13,528 7 6,365 5,735Pierre city . . . . . . . . . . . . . . . . . . . . . . . . . . . . . . . . . . . . . . . 8 13,646 13,876 8 6,159 5,949Huron city . . . . . . . . . . . . . . . . . . . . . . . . . . . . . . . . . . . . . . 9 12,592 11,893 9 6,023 5,872Vermillion city . . . . . . . . . . . . . . . . . . . . . . . . . . . . . . . . . . . . 10 10,571 r 10,276 11 4,043 3,967
Spearfish city . . . . . . . . . . . . . . . . . . . . . . . . . . . . . . . . . . . . 11 10,494 8,606 10 5,045 3,904Brandon city . . . . . . . . . . . . . . . . . . . . . . . . . . . . . . . . . . . . . 12 8,785 5,693 12 3,238 1,976Rapid Valley CDP . . . . . . . . . . . . . . . . . . . . . . . . . . . . . . . . 13 8,260 7,043 14 3,101 2,493Box Elder city . . . . . . . . . . . . . . . . . . . . . . . . . . . . . . . . . . . . 14 7,800 2,841 16 2,828 1,072Sturgis city . . . . . . . . . . . . . . . . . . . . . . . . . . . . . . . . . . . . . . 15 6,627 6,442 13 3,154 2,989Madison city . . . . . . . . . . . . . . . . . . . . . . . . . . . . . . . . . . . . . 16 6,474 6,540 15 2,848 2,706Belle Fourche city . . . . . . . . . . . . . . . . . . . . . . . . . . . . . . . . 17 5,594 4,565 17 2,511 2,122Harrisburg city . . . . . . . . . . . . . . . . . . . . . . . . . . . . . . . . . . . 18 4,089 958 23 1,507 318Tea city . . . . . . . . . . . . . . . . . . . . . . . . . . . . . . . . . . . . . . . . 19 3,806 1,742 25 1,354 600Hot Springs city . . . . . . . . . . . . . . . . . . . . . . . . . . . . . . . . . . 20 3,711 4,129 18 1,958 1,900
Dell Rapids city . . . . . . . . . . . . . . . . . . . . . . . . . . . . . . . . . . 21 3,633 2,980 24 1,495 1,181Mobridge city . . . . . . . . . . . . . . . . . . . . . . . . . . . . . . . . . . . . 22 3,465 3,574 19 1,727 1,808Milbank city . . . . . . . . . . . . . . . . . . . . . . . . . . . . . . . . . . . . . 23 3,353 3,640 21 1,683 1,698Pine Ridge CDP . . . . . . . . . . . . . . . . . . . . . . . . . . . . . . . . . 24 3,308 3,171 31 863 742Lead city . . . . . . . . . . . . . . . . . . . . . . . . . . . . . . . . . . . . . . . 25 3,124 3,027 20 1,694 1,617Canton city . . . . . . . . . . . . . . . . . . . . . . . . . . . . . . . . . . . . . . 26 3,057 3,110 26 1,351 1,286Winner city . . . . . . . . . . . . . . . . . . . . . . . . . . . . . . . . . . . . . . 27 2,897 3,137 22 1,547 1,526Blackhawk CDP . . . . . . . . . . . . . . . . . . . . . . . . . . . . . . . . . . 28 2,892 2,432 27 1,160 871Dakota Dunes CDP . . . . . . . . . . . . . . . . . . . . . . . . . . . . . . . 29 2,540 (X) 29 1,050 (X)Hartford city . . . . . . . . . . . . . . . . . . . . . . . . . . . . . . . . . . . . . 30 2,534 1,844 30 939 675North Sioux City city . . . . . . . . . . . . . . . . . . . . . . . . . . . . . . 31 2,530 2,288 28 1,146 953
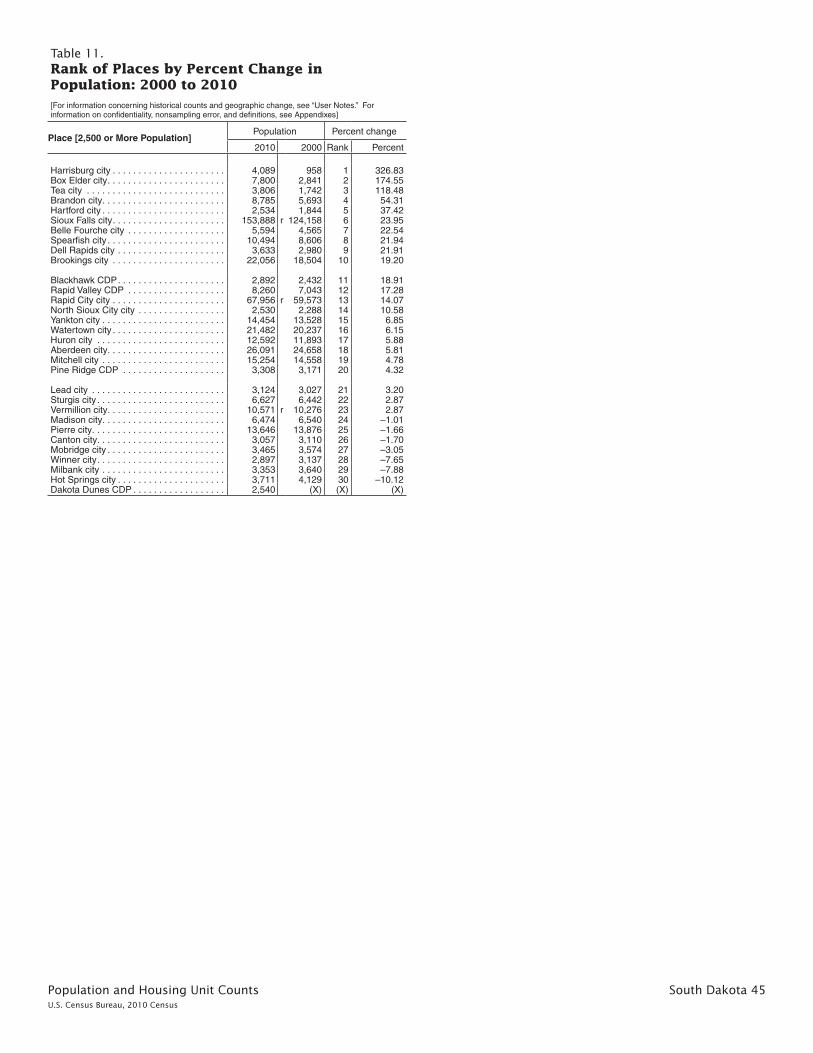
Population and Housing Unit Counts South Dakota 45U.S. Census Bureau, 2010 Census
Table 11. Rank of Places by Percent Change in Population: 2000 to 2010 [For information concerning historical counts and geographic change, see “User Notes .” For information on confidentiality, nonsampling error, and definitions, see Appendixes]
Place [2,500 or More Population]Population Percent change
2010 2000 Rank Percent
Harrisburg city . . . . . . . . . . . . . . . . . . . . . . 4,089 958 1 326 .83Box Elder city . . . . . . . . . . . . . . . . . . . . . . . 7,800 2,841 2 174 .55Tea city . . . . . . . . . . . . . . . . . . . . . . . . . . . 3,806 1,742 3 118 .48Brandon city . . . . . . . . . . . . . . . . . . . . . . . . 8,785 5,693 4 54 .31Hartford city . . . . . . . . . . . . . . . . . . . . . . . . 2,534 1,844 5 37 .42Sioux Falls city . . . . . . . . . . . . . . . . . . . . . . 153,888 r 124,158 6 23 .95Belle Fourche city . . . . . . . . . . . . . . . . . . . 5,594 4,565 7 22 .54Spearfish city . . . . . . . . . . . . . . . . . . . . . . . 10,494 8,606 8 21 .94Dell Rapids city . . . . . . . . . . . . . . . . . . . . . 3,633 2,980 9 21 .91Brookings city . . . . . . . . . . . . . . . . . . . . . . 22,056 18,504 10 19 .20
Blackhawk CDP . . . . . . . . . . . . . . . . . . . . . 2,892 2,432 11 18 .91Rapid Valley CDP . . . . . . . . . . . . . . . . . . . 8,260 7,043 12 17 .28Rapid City city . . . . . . . . . . . . . . . . . . . . . . 67,956 r 59,573 13 14 .07North Sioux City city . . . . . . . . . . . . . . . . . 2,530 2,288 14 10 .58Yankton city . . . . . . . . . . . . . . . . . . . . . . . . 14,454 13,528 15 6 .85Watertown city . . . . . . . . . . . . . . . . . . . . . . 21,482 20,237 16 6 .15Huron city . . . . . . . . . . . . . . . . . . . . . . . . . 12,592 11,893 17 5 .88Aberdeen city . . . . . . . . . . . . . . . . . . . . . . . 26,091 24,658 18 5 .81Mitchell city . . . . . . . . . . . . . . . . . . . . . . . . 15,254 14,558 19 4 .78Pine Ridge CDP . . . . . . . . . . . . . . . . . . . . 3,308 3,171 20 4 .32
Lead city . . . . . . . . . . . . . . . . . . . . . . . . . . 3,124 3,027 21 3 .20Sturgis city . . . . . . . . . . . . . . . . . . . . . . . . . 6,627 6,442 22 2 .87Vermillion city . . . . . . . . . . . . . . . . . . . . . . . 10,571 r 10,276 23 2 .87Madison city . . . . . . . . . . . . . . . . . . . . . . . . 6,474 6,540 24 –1 .01Pierre city . . . . . . . . . . . . . . . . . . . . . . . . . . 13,646 13,876 25 –1 .66Canton city . . . . . . . . . . . . . . . . . . . . . . . . . 3,057 3,110 26 –1 .70Mobridge city . . . . . . . . . . . . . . . . . . . . . . . 3,465 3,574 27 –3 .05Winner city . . . . . . . . . . . . . . . . . . . . . . . . . 2,897 3,137 28 –7 .65Milbank city . . . . . . . . . . . . . . . . . . . . . . . . 3,353 3,640 29 –7 .88Hot Springs city . . . . . . . . . . . . . . . . . . . . . 3,711 4,129 30 –10 .12Dakota Dunes CDP . . . . . . . . . . . . . . . . . . 2,540 (X) (X) (X)

46 South Dakota Population and Housing Unit CountsU.S. Census Bureau, 2010 Census
Table 12. Population and Housing Units for Urban Areas: 2010[For information on confidentiality, nonsampling error, and definitions, see Appendixes]
StateUrbanized AreaUrban Cluster
State total Total for urban areas crossing state lines
Population Housing units Population Housing units
South Dakota . . . . . . . . . . . . . . . . . . . . . . . . . . . . 814,180 363,438 (X) (X)
Urban . . . . . . . . . . . . . . . . . . . . . . . . . . . . . . . . . . . . . . 461,247 200,981 (X) (X)In urbanized area . . . . . . . . . . . . . . . . . . . . . . . . . . . . . . . 243,587 105,088 (X) (X)In urban cluster . . . . . . . . . . . . . . . . . . . . . . . . . . . . . . . . 217,660 95,893 (X) (X) Rural . . . . . . . . . . . . . . . . . . . . . . . . . . . . . . . . . . . . . . 352,933 162,457 (X) (X)
URBANIZED AREA
Rapid City, SD . . . . . . . . . . . . . . . . . . . . . . . . . . . . . . . . . 81,251 35,309 (X) (X)Sioux City, IA--NE--SD . . . . . . . . . . . . . . . . . . . . . . . . . . . 5,559 2,414 106,494 42,096Sioux Falls, SD . . . . . . . . . . . . . . . . . . . . . . . . . . . . . . . . 156,777 67,365 (X) (X)
URBAN CLUSTER
Aberdeen, SD . . . . . . . . . . . . . . . . . . . . . . . . . . . . . . . . . 25,977 12,114 (X) (X)Belle Fourche, SD . . . . . . . . . . . . . . . . . . . . . . . . . . . . . . 5,240 2,367 (X) (X)Box Elder, SD . . . . . . . . . . . . . . . . . . . . . . . . . . . . . . . . . 7,885 2,873 (X) (X)Brandon, SD . . . . . . . . . . . . . . . . . . . . . . . . . . . . . . . . . . 8,173 3,009 (X) (X)Brookings, SD . . . . . . . . . . . . . . . . . . . . . . . . . . . . . . . . . 22,482 8,864 (X) (X)Canton, SD . . . . . . . . . . . . . . . . . . . . . . . . . . . . . . . . . . . 2,679 1,204 (X) (X)Dell Rapids, SD . . . . . . . . . . . . . . . . . . . . . . . . . . . . . . . . 3,584 1,476 (X) (X)Harrisburg, SD . . . . . . . . . . . . . . . . . . . . . . . . . . . . . . . . . 3,071 1,152 (X) (X)Hot Springs, SD . . . . . . . . . . . . . . . . . . . . . . . . . . . . . . . . 3,550 1,833 (X) (X)Huron, SD . . . . . . . . . . . . . . . . . . . . . . . . . . . . . . . . . . . . 12,637 6,038 (X) (X)
Lead, SD . . . . . . . . . . . . . . . . . . . . . . . . . . . . . . . . . . . . . 3,750 2,061 (X) (X)Madison, SD . . . . . . . . . . . . . . . . . . . . . . . . . . . . . . . . . . 6,174 2,733 (X) (X)Milbank, SD . . . . . . . . . . . . . . . . . . . . . . . . . . . . . . . . . . . 3,283 1,658 (X) (X)Mitchell, SD . . . . . . . . . . . . . . . . . . . . . . . . . . . . . . . . . . . 14,955 6,979 (X) (X)Mobridge, SD . . . . . . . . . . . . . . . . . . . . . . . . . . . . . . . . . . 3,457 1,730 (X) (X)North Eagle Butte, SD . . . . . . . . . . . . . . . . . . . . . . . . . . . 2,645 868 (X) (X)Pierre, SD . . . . . . . . . . . . . . . . . . . . . . . . . . . . . . . . . . . . 14,425 6,605 (X) (X)Pine Ridge, SD . . . . . . . . . . . . . . . . . . . . . . . . . . . . . . . . 2,720 685 (X) (X)Spearfish, SD . . . . . . . . . . . . . . . . . . . . . . . . . . . . . . . . . 11,459 5,459 (X) (X)Sturgis, SD . . . . . . . . . . . . . . . . . . . . . . . . . . . . . . . . . . . 6,583 3,139 (X) (X)
Tea, SD . . . . . . . . . . . . . . . . . . . . . . . . . . . . . . . . . . . . . . 3,784 1,343 (X) (X)Vermillion, SD . . . . . . . . . . . . . . . . . . . . . . . . . . . . . . . . . 10,492 4,004 (X) (X)Watertown, SD . . . . . . . . . . . . . . . . . . . . . . . . . . . . . . . . 21,111 9,869 (X) (X)Winner, SD . . . . . . . . . . . . . . . . . . . . . . . . . . . . . . . . . . . 2,907 1,520 (X) (X)Yankton, SD . . . . . . . . . . . . . . . . . . . . . . . . . . . . . . . . . . . 14,637 6,310 (X) (X)

Appendixes U.S. Census Bureau, 2010 Census
Appendixes
Several appendixes traditionally found in printed reports are now available in a separate volume. For the following, see CPH-2-A, Population and Housing Unit Counts, Selected Appendixes, in print or on the Internet at <www.census.gov/prod/cen2010/cph-2-a.pdf> :
Appendix A. Geographic Terms and ConceptsAppendix B. Definitions of Subject CharacteristicsAppendix C. Data Collection and Processing ProceduresAppendix D. QuestionnaireAppendix F. Operational Overview and Accuracy of the DataAppendix G. Residence Rule and Residence Situations for the 2010 Census of the United StatesAppendix H. Acknowledgments
This Appendix section contains:
Appendix E. Maps


Maps South Dakota E-1U.S. Census Bureau, 2010 Census
Appendix E. Maps
BROW
N
BRUL
E
BUTT
E
CAM
PBEL
L
CLAR
K
CLAY
CODI
NGTO
N
CORS
ON
CUST
ER
DAY
DEUE
L
DOUG
LAS
EDM
UNDS
FALL
RIVE
R
FAUL
KGR
ANT
GREG
ORYHAND
HANS
ON
HARD
ING
HUGH
ES
HUTC
HINS
ON
JACK
SON
JERA
ULD
KING
SBUR
Y
LAKE
LAW
RENC
E
LINCO
LN
AURO
RA
BEAD
LE
BENN
ETT
BON
HOM
ME
BROO
KING
S
BUFF
ALO
CHAR
LES
MIX
DAVI
SON
DEW
EY
HAAK
ON
HYDE
JONE
SLY
MAN
MEA
DE
MEL
LETT
E
PENN
INGT
ONSA
NBOR
N
STAN
LEY
TRIP
PTU
RNER
ZIEB
ACH
ROBE
RTS
SHAN
NON
SPIN
K
SULL
Y
TODD
UNIO
N
WAL
WOR
TH
YANK
TON
HAM
LIN
McC
OOK
McP
HERS
ONM
ARSH
ALL
MIN
ER
MIN
NEHA
HA
MOO
DY
PERK
INS
POTT
ER
MO
NTA
NA
IOW
A
MIN
NE
SO
TA
NE
BR
AS
KA
NO
RTH
DA
KO
TA
WYOMING
100°
100°
96°
97°
97°
98°
98°
99°
99°
101°10
1°
102°
102°
103°
103°
104°
104°
46°
46°
45°
45°
44°
44°
43°
43°
42°
42°
Counties
010
2030
Kilometers
010
2030
Miles
LEG
EN
DIO
WA
Sta
teHU
GHES
Cou
nty
Not
e:A
llbo
unda
ries
and
nam
esar
eas
ofJa
nuar
y1,
2010
.

E-2 South Dakota MapsU.S. Census Bureau, 2010 Census
Geographic Areas Reference Map Legend, Section Locator, and Location Index
MEADE
BUTTE
DEWEY
PERKINS
CORSONHARDING
TRIPP
DAY
LYMAN
SPINK
HAND
TODD
ZIEBACH
BROWN
HAAKON
SHANNON
PENNINGTON
JACKSONCUSTER
SULLY
STANLEY BEADLE
FAULK
HYDE
FALL RIVER
CLARK
JONES
BRULEMELLETTE
BENNETT
ROBERTS
LAKE
POTTER
EDMUNDS
GREGORY
GRANT
DEUEL
HUGHES
McPHERSON
MINER
CLAY
AURORA
MARSHALL
TURNER
CAMPBELL
KINGSBURY
LAWRENCE
MOODY
HAMLIN
BROOKINGS
MINNEHAHAMcCOOK
LINCOLN
WALWORTH
HUTCHINSON
JERAULDBUFFALO
DOUGLAS
CHARLESMIX
UNIO
N
SANBORN
CODINGTON
YANKTON
HANSON
DAVISON
BONHOMME
1 3
78
2
9 6
4 5
Geographic Areas Reference Map Legend
Census Designated Place
Large River, Lake, Water Body,or Shoreline
Zena
Lake Erie
American Indian Reservation(Federal)1CAMPO
Off-Reservation Trust LandZIA
Inset
A fishhook joins contiguous and/or discontiguousparts of the same geographic entity.
SEE INSET A
LEGENDADAMS County
1 Map Section
State
Incorporated Place2ROME
YORK County Subdivision2
CountyERIE
Note: All legal and statistical area boundaries and names are as of January 1, 2010. Where international, state, county, independent city, and/or county subdivision boundariescoincide, the map shows the boundary symbol for the highest level of these geographic entities. The county and independent city boundaries are always shown. Where a countysubdivision boundary symbol coincides with a place boundary, the map does not show the place boundary symbol. Where American Indian Reservation (Federal), American IndianReservation (State), State Designated Tribal Statistical Area, and/or Tribal Designated Statistical Area boundaries coincide with a county subdivision boundary, the map does notshow the county subdivision boundary symbol. Any geographic entity name may include ’(pt)’ if some portion of the entity extends beyond the limits of the map area displayed onthe page, or if multiple discontiguous pieces of the entity have been discretely labeled on the page. A geographic entity name may include ’(pts)’ if many discontiguous piecesexist for that entity that cannot be discretely labeled. The boundaries shown on this map are for Census Bureau statistical data collection and tabulation purposes only; theirdepiction and designation for statistical purposes does not constitute a determination of jurisdictional authority or rights of ownership or entitlement.
1 A ’ ’ following an American Indian area name indicates that tribal subdivisions are defined for that area. The tribal subdivision boundaries are displayed on the tribal subdivisionmap(s) immediately following the geographic areas reference maps.
**
Section Locator
2 A ’°’ following a place name indicates that the place is an independent place or independent city. An independent place is not part of any legal county subdivision and thusserves as the statistical equivalent of a legal county subdivision. An independent city is not part of any county or legal county subdivision and thus serves as both the statisticalequivalent of a county and a legal county subdivision. The name for the county subdivision is always the same as that of the place and never shown separately on the map.

Maps South Dakota E-3U.S. Census Bureau, 2010 Census
COUNTY MAP COUNTY MAPSEC SEC
Aurora 7 Roberts 5Beadle 4 Sanborn 7Bennett 8 Shannon 9Bon Homme 6 Spink 4Brookings 5 Stanley 2Brown 4 Sully 3Brule 7 Todd 8Buffalo 7 Tripp 7Butte 1 Turner 6Campbell 3 Union 6Charles Mix 7 Walworth 3Clark 4 Yankton 6Clay 6 Ziebach 2Codington 5Corson 2Custer 9Davison 7Day 4Deuel 5Dewey 2Douglas 7Edmunds 3Fall River 9Faulk 3Grant 5Gregory 7Haakon 8Hamlin 5Hand 3Hanson 6Harding 1Hughes 3Hutchinson 6Hyde 3Jackson 8Jerauld 7Jones 8Kingsbury 5Lake 6Lawrence 1Lincoln 6Lyman 7Marshall 4McCook 6McPherson 3Meade 1Mellette 8Miner 6Minnehaha 6Moody 6Pennington 9Perkins 1Potter 3
Map section numbers refer to the geographic areas reference maps only.This list presents the map section numbers for each county in the state.
County Location Index
Geographic Areas Reference Map Legend, Section Locator, and Location Index

E-4 South Dakota MapsU.S. Census Bureau, 2010 Census
BUTTE
HARDING
LAWRENCE
MEADE
PERKINS
BELLEFOURCHE°
BISON°
BOX ELDER° (pt)
BUFFALO°CAMP CROOK°
CENTRALCITY°
DEADWOOD°
FAITH°
FRUITDALE°
LEAD°
LEMMON°
NEWELL°
PIEDMONT°
NISLAND°
SPEARFISH°STURGIS°
SUMMERSET°
WHITE-WOOD°
St.Onge
Vale
NorthSpearfish
PrairieCity
Blackhawk
BlucksbergMountain
CHEYENNERIVER (pt)
NORTHERNCHEYENNE (pt)
TURTLEMOUNTAIN (pt)
TURTLEMOUNTAIN (pt)
EAST BUTTE
UNION
VALE
WEST BUTTE
NORTHLAWRENCE
ST. ONGE
SOUTH LAWRENCE
ADA
ANDER-SON
ANTELOPE
BARRETT
BECK
-HI
GHLAN
D
BISON
BURDICK
CASH
NORTH HARDING
SOUTH HARDING
CASTLEBUTTE
CHANCE
CHAUDOIN
CLARK
DE WITTDUCK
CREEK
DUELL
ENGLEWOOD
FLATCREEK
FOSTER
FRED-LUND
GLENDO
GRANDRIVER
HALL
HORSECREEK
JONES
LIBERTY LINCOLN
LODGE-POLE
BELLE FOURCHE-CHEYENNE VALLEYS
DAKOTA(pt)
DAKOTA(pt)
EAGLE
ELMSPRINGS
LONETREE
MALTBY
MARSHFIELD
MARTIN
MEADOW
HOWARD
LAKESIDE
NORTH MEADE
SMITH-VILLE
SOUTHWEST MEADE
UNION
UPPERRED OWL
MOREAU
NORTHEASTPERKINS (pt)
NORTHEAST
PERKINS (p
t)
PLATEAU
PLEASANTVALLEY
RAINBOW
RICHLAND
ROCK-FORD
SCOTCHCAP
SIDNEY
SOUTH PERKINS (pt)
SOUTHPERKINS (pt)
STROOL
TRAIL
VAIL
VICKERS
VIKING
VROOMAN
WELLS
WHITE BUTTE
WHITEHILL
WILSON
SEE SECTIO
N 2
SEESECTION 9
Chey
enne
Riv
er
102°
102°
102°30’
102°30’
103°
103°
103°30’
103°30’
104°
104°
46°
45°3
0’
45°3
0’
45°
45°
44°3
0’
44°3
0’
44°
American Indian Areas, Counties, County Subdivisions, and Places - Section 1
0 5 10 15 Kilometers
0 5 10 15 Miles

Maps South Dakota E-5U.S. Census Bureau, 2010 Census
CORSON
DEWEY
STANLEY
ZIEBACH
CHEYENNERIVER (pt)
DUPREE°
EAGLE BUTTE°
FORT PIERRE°
McLAUGHLIN°
ISABEL°
McINTOSH°
MORRISTOWN°
TIMBER LAKE°
Bullhead
Green Grass
La Plant
Little Eagle
North Eagle Butte
Whitehorse
STANDING ROCK* (pt)
CHEYENNE RIVER*
LOWERBRULE (pt)
CHEYENNERIVER (pts)
CHEYENNERIVER (pts)
LOWERBRULE (pt)
CUSTER
EAST CORSON
LEMMON
PLEASANTRIDGE
PRAIRIEVIEW
RIDGELAND
ROLLINGGREEN SHERMAN
WAKPALA
WATAUGA
WEST CORSON
NORTH DEWEY
SOUTH DEWEY
LOWER BRULE
NORTHSTANLEY
SOUTH STANLEY
DUPREE
NORTH ZIEBACH
SOUTH ZIEBACH
SEE
SEC
TIO
N 1
SEESECTION 3
SEESECTION 7
SEESECTION 8
Cheyenne River
Missouri River
Missouri River
100°
100°
100°30’
100°30’
101°
101°
101°30’
101°30’
102°
102°
46°
46°
45°3
0’
45°3
0’
45°
45°
44°3
0’
44°3
0’
American Indian Areas, Counties, County Subdivisions, and Places - Section 2
0 5 10 15 Kilometers
0 5 10 15 Miles

E-6 South Dakota MapsU.S. Census Bureau, 2010 Census
CAMPBELL
EDMUNDS
FAULK
HAND
HUGHES
HYDE
McPHERSON
POTTER
SULLY
WALWORTH
River
BLUNT°
BOWDLE°
CRES-BARD° CHELSEA°
AGAR°
AKASKA°
ARTAS°
GETTYSBURG°
GLENHAM°
HARROLD°
EUREKA°
FAULK-TON°
MILLER°
HERREID°
HIGHMORE°
HILLSVIEW°
HOSMER°
HOVEN°
IPSWICH°
JAVA°
LEBANON°
LEOLA°
LONG LAKE°
LOWRY°
MOBRIDGE°
MOUND CITY°
PIERRE°
ONAKA°
ONIDA°
ORIENT°
POLLOCK°
REEHEIGHTS°
ROCK-HAM°
ROSCOE°
ST.LAW-RENCE°
SELBY°
SENECA°
TOLSTOY°
WESSING-TON° (pt)
WETONKA°
Cow Creek
CROW CREEK* (pt)
CHEYENNERIVER (pt)
NORTH CAMPBELL
SOUTH CAMPBELL
ADRIAN BELLE
BOWDLE BRYANT
CLEARLAKE
CLEVE-LAND
CLOYDVALLEY
CORT-LANDT
COTTON-WOODLAKE FOUNTA
INGLEN
GLOVER HARMONY
HILLSIDE
HOSMER
HUDSON
HUNTLEYIPSWICH
KENTLIBERTYMADISON
MODENA
MONT-PELIER
NORTHBRYANT
ODESSA
PEM-BROOK
POWELL
RICHLAND
ROSETTE
SANGAMON
UNION
VERMONT
ARCADE
BRYANTCENTER-
VILLE
CLARK
DEVOE
ELLISVILL
E
EMER-SON
ENTER-PRISE
FAIRVIEWFREE-DOM
HILLS-DALEIRVING
LAFOON
MYRONO’NEIL
ORIENT
PIONEER
PULASKISARATOGA
SHERMAN
SOUTHWESTFAULK
TAM-WORTH
UNION
WESLEY
ZELL
HILAND
HOLDEN
HULBERT
LINN
LOGAN
MIDLANDMILLER
MONDAMIN
NORTHWESTHAND
OHIO
ONTARIO
PARK
PEARL
PLATO
PLEASANTVALLEY
REEHEIGHTS
RIVER-SIDE
ROCKDALE
ROSEHILL
ST. LAW-RENCE
SPRINGHILL
SPRINGLAKE
WHEATON
YORK
CROW CREEK
NORTH HUGHES
RABER
WEST HUGHES
CARL
CENTRAL McPHERSON
HOFFMAN
WACHTERWACKER WEBER
WEST McPHERSON
CENTRAL HYDE
EAST SULLYWEST SULLY
CROW CREEK
NORTH HYDE
VALLEY
WILL
IAM
HAMILTON
CENTRALPOTTER
EAST POTTER
WEST POTTER
ALDEN
ALPHA
BATES
BURDETTE
CAMPBELL
CARLTON
CEDAR
COMO
FLORENCE
GILBERT
GLENDALE
GRAND
GREEN-LEAF
EASTWALWORTH
WESTWALWORTH
SEESECTION 2
SEE SECTIO
N 4
SEESECTION 7
Missouri
American Indian Areas, Counties, County Subdivisions, and Places - Section 3
0 5 10 15 Kilometers
0 5 10 15 Miles
100°
100°
100°30’
100°30’
99°
99°
99°30’
99°30’
46° 46
°
45°3
0’
45°3
0’
45° 45
°
44°3
0’
44°3
0’

Maps South Dakota E-7U.S. Census Bureau, 2010 Census
BEADLE
BROWN
CLARK
DAY
MARSHALL
SPINKBRADLEY°
BRENTFORD°
BRISTOL°
COLUMBIA°
CONDE°
BRITTON°
BROAD-LAND°
BUTLER°
CAVOUR°
CLARE-MONT°
CLARK°
ABER-DEEN°
ANDOVER°
ASHTON°
GREN-VILLE°
GROTON°
HECLA°
DOLAND°
EDEN°
FRANK-FORT°
FRED-ERICK°
GARDENCITY°
MELLETTE°
HITCH-COCK°
HURON°
IROQUOIS° (pt)
LAKECITY°
LANG-FORD°
LILY°
NAPLES°
PIERPONT°
NORTHVILLE°
TULARE°
TURTON°
VEBLEN°
VERDON°
RAY-MOND°
REDFIELD°
ROSLYN°
STRAT-FORD°
VIENNA°
VIRGIL°
WARNER°WAUBAY°
WEBSTER°
WESSINGTON° (pt)
WESTPORT°
WILLOWLAKE°
WOLSEY°
YALE°
Crocker
Ferney
Kidder
Mansfield
Morningside
BathBathCorner
LAKETRAVERSE* (pt)
ALLEN
ALTOONA
BANNER
BARRETT
BELLEPRAIRIE
BONILLA
BROAD-LAND
BURROAK
CARLYLE
CAVOUR
CLIFTON
CLYDE CUSTER
DEAR-BORN
FAIRFIELDFOSTER
GRANT
HARTLAND
IOWA
KELLOGG
LAKEBYRON
LIBERTY
LOGAN
MILFORDNANCE
PEARLCREEK
PLEASANTVIEW
RICHLANDSANDCREEK
THERESAVALLEY
VERNON
WESSING-TON
WHITESIDE
WOLSEY
ABERDEEN
ALLISON
BATES
BATH
BRAINARD
CAMBRIA
CARLISLE CLAREMONT
COLUMBIA
EASTHANSON
EASTRONDELL
FRANKLYN
FRED-ERICK
GARDENPRAIRIE
GARLAND
GEM
GREEN-FIELD
GROTON
HECLA
HENRY
HIGH-LAND
LANSING
LIBERTY
LINCOLN
MERCIER
NEWHOPE
NORTHDETROIT
ONEOTA
ORDWAY
OSCEOLAPALMYRA PORTAGE
PRAIRIE-WOOD PUTNEYRAVINIA
RICHLAND
RIVERSIDE
SAVO
SHELBY SOUTHDETROIT
WARNERWEST
HANSON
WESTPORT
WESTRONDELL
ASH
BLAINE
COLLINS
COTTON-WOOD
DARLINGTON
DAY
EDEN
ELROD
FORD-HAM FOXTON
GARFIELD
HAGUE LAKE
LINCOLNLOGAN
MAYDELL
MERTON
MOUNTPLEASANT
PLEASANT
RAYMOND
RICHLA
ND
ROSE-DALE
SPRINGVALLEY
THORP
WARREN
WASHING-TON
WOODLA
ND
ANDOVER
BRISTOL
BUTLER CENTRALPOINT
EGELAND
FARMIN
GTON
GRENVILLE
HIGH-LAND
HOMERINDE-PEN-
DENCE
KIDDER
KOSCIUSKO
LIBERTY
LYNN
MORTON
NUTLEY
OAKGULCH
RACINE
RARITAN
RUSK
SCOTLAND
TROY
UNION
VALLEY
WAUBAYWEBSTER
WHEAT-LAND
YORK
ANTELOPE
ATHOL
BELLEPLAINE
BELMONT
BENTON
BEOTIA
BUFFALO
CAPITOLA
CLIFTON
CONDE
CORNWALL
CRANDON
EXLINE FRANK-FORT
GARFIELD
GREATBEND
GROVE-LAND HARMONY
HARRISON
JEFFERSON
LAKE
LA PRAIRIE
LINCOLN
LODI
MELLETTE
NORTHVILLE OLEAN
PRAIRIECENTER
REDFIELD
BUFFALO
DAYTON
DU
MAR
CE
EDENFORT
HAMILTON
HICKMAN
LA BELLE
LAKE
LOWELL
McKINLEY
MILLER
NEWARK
NEWPORT
NORDLANDPLEASANT
VALLEY
REDIRONLAKE
SISSETON
STENA
VEBLENVICTOR
WAVERLYWESTON
WHITE
WISMER
RICHFIE
LD
SPRING
SUMNER
TETONKA
THREERIVERS
TULARE
TURTON
UNION
SEESECTION 3
SEESECTION 5
SEESECTION 7
97°
97°
97°30’
97°30’
98°
98°
98°30’
98°30’
99°
99°
46°
46°
45°3
0’ 45°3
0’
45°
45°
44°3
0’ 44°3
0’
American Indian Areas, Counties, County Subdivisions, and Places - Section 4
0 5 10 15 Kilometers
0 5 10 15 Miles
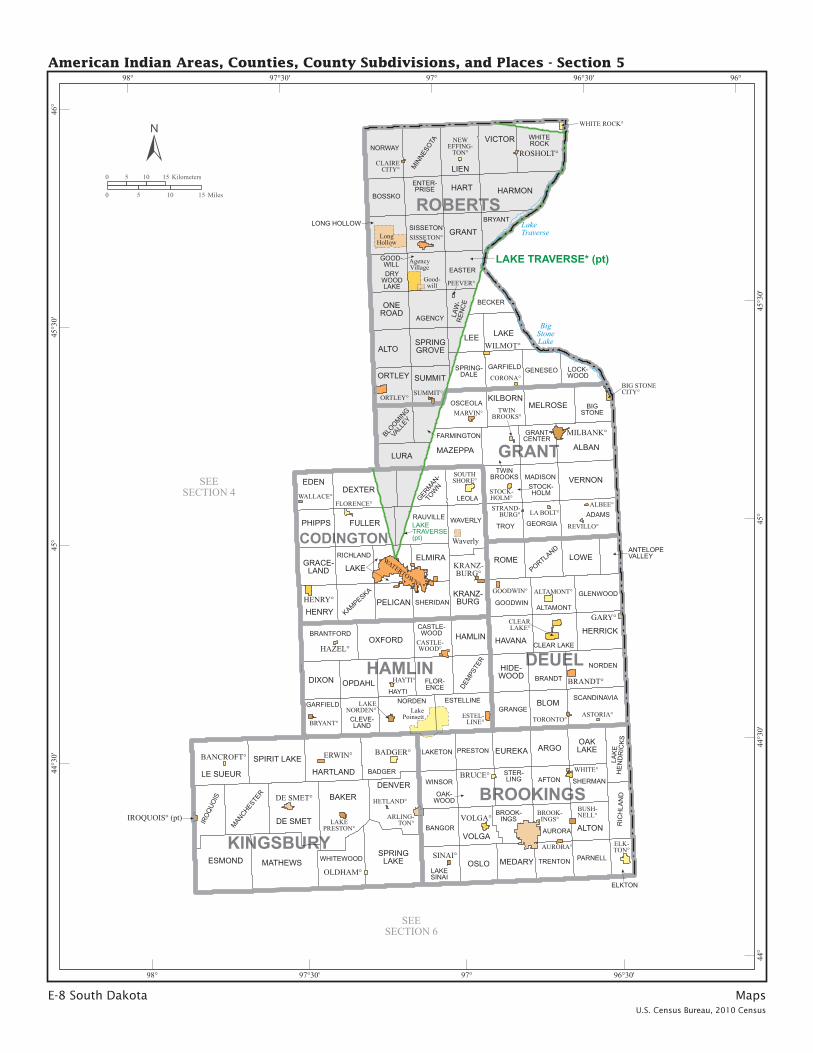
E-8 South Dakota MapsU.S. Census Bureau, 2010 Census
BROOKINGS
CODINGTON
DEUEL
GRANT
HAMLIN
KINGSBURY
ROBERTS
BANCROFT°
BIG STONECITY°
BRANDT°
CORONA°
BROOK-INGS°
BRUCE°
BRYANT°
BUSH-NELL°
CASTLE-WOOD°
CLAIRECITY°
CLEARLAKE°
ALBEE°
ALTAMONT°
ARLING-TON°
ASTORIA°
AURORA°
BADGER°
GOODWIN°
HAYTI°
HAZEL°
DE SMET°
ELK-TON°
ERWIN°
ESTEL-LINE°
FLORENCE°
GARY°
MARVIN°
MILBANK°
HENRY°
HETLAND°
IROQUOIS° (pt)
KRANZ-BURG°
LA BOLT°
LAKENORDEN°
LAKEPRESTON°
NEWEFFING-
TON°
ORTLEY°
PEEVER°
OLDHAM°
TORONTO°
TWINBROOKS°
REVILLO°
ROSHOLT°
SINAI°
SISSETON°
SOUTHSHORE°
STOCK-HOLM°STRAND-
BURG°
SUMMIT°
VOLGA°
WALLACE°
WATERTOWN°
WHITE°
WHITE ROCK°
WILMOT°
Good-will
LakePoinsett
LongHollow
AgencyVillage
Waverly
LAKE TRAVERSE* (pt)
LAKETRAVERSE(pt)
AFTON
ALTON
ARGO
AURORABANGOR
BROOK-INGS
ELKTON
EUREKA
LAKE
HEN
DR
ICK
S
LAKESINAI
LAKETON
MEDARY
OAKLAKE
OAK-WOOD
OSLOPARNELL
PRESTON
RIC
HLA
ND
SHERMANSTER-LING
TRENTON
VOLGA
WINSOR
DEXTEREDEN
ELMIRA
FULLER
GERMAN-TO
WN
GRACE-LAND
HENRY KAMPESKA KRANZ-BURG
LAKE
LEOLA
PELICAN
PHIPPSRAUVILLE
RICHLAND
SHERIDAN
WAVERLY
ALTAMONT
ANTELOPEVALLEY
BLOM
BRANDT
CLEAR LAKE
GLENWOODGOODWIN
GRANGE
HAVANAHERRICK
HIDE-WOOD
LOWE
NORDEN
PORTLANDROME
SCANDINAVIA
ADAMS
ALBAN
BIGSTONE
BLOOMIN
G
VALL
EY
FARMINGTON
GEORGIA
GRANTCENTER
KILBORN
LURA
MADISON
MAZEPPA
MELROSEOSCEOLA
STOCK-HOLM
TROY
TWINBROOKS VERNON
BRANTFORD
MIN
NESOTA
NORWAY
ONEROAD
ORTLEY
SISSETON
BAKERDENVER
DE SMET
ESMOND
HARTLAND
SPRING-DALE
SPRINGGROVE
SUMMIT
VICTOR WHITEROCK
IRO
QUO
IS
LE SUEUR
MANCHESTER
MATHEWS
SPIRIT LAKE
SPRINGLAKEWHITEWOOD
CASTLE-WOOD
CLEVE-LAND
DEM
PSTE
R
DIXON
ESTELLINE
FLOR-ENCE
GARFIELD
HAMLIN
AGENCY
ALTO
BECKER
BOSSKO
BRYANT
DRYWOODLAKE
HAYTINORDEN
OPDAHL
OXFORD
EASTER
ENTER-PRISE
GARFIELD GENESEO
GOOD-WILL
GRANT
HARMONHART
LAKE
LAW
-R
ENC
E
LEE
LIEN
LOCK-WOOD
LONG HOLLOW
BADGER
SEESECTION 4
SEESECTION 6
BigStoneLake
LakeTraverse
96°
96°30’
96°30’
97°
97°
97°30’
97°30’
98°
98°
46°
45°3
0’
45°3
0’
45°
45°
44°3
0’
44°3
0’44
°
American Indian Areas, Counties, County Subdivisions, and Places - Section 5
0 5 10 15 Kilometers
0 5 10 15 Miles

Maps South Dakota E-9U.S. Census Bureau, 2010 Census
BON HOMME
CLAY
HANSON
HUTCHINSON
LAKE
LINCOLN
McCOOK
MINER
MINNEHAHA
MOODY
TURNER
UNION
YANKTON
12
VALLEYSPRINGS°1
2
34 5
KEY
1 Pine Lakes Addition2 Anderson345
Renner CornerMeadow View AdditionMAPLETON
MOODY12
FLANDREAUFLANDREAU°
MINNEHAHA
BERES-FORD°
BRANDON°
BRIDGE-WATER°
COLMAN°
COLTON°
CROOKS°
DAVIS°
CAN-ISTOTA°
CANOVA°
CANTON°
CAR-THAGE°
CENTER-VILLE°
CHAN-CELLOR°
ALCESTER°
ALEX-ANDRIA°
AVON°
BALTIC°
HARRIS-BURG°
HART-FORD°
DELLRAPIDS°
DIMOCK° DOLTON°
EGAN°
ELK POINT°
EMERY°
FAIRVIEW°
FARMER°
FREEMAN°
FULTON° GARRETSON°
GAY-VILLE°
MADISON°
MARION°
MENNO°
MISSIONHILL°
HOWARD°
HUDSON°
HUM-BOLDT°
HURLEY°
IRENE°
JEFFER-SON°
LENNOX°
LESTERVILLE°
MONROE°
MON-TROSE°
PARKER°
PARKS-TON°
NORTHSIOUX CITY°
NUNDA°
OLIVET°
TRENT°
TRIPP°
TYNDALL° UTICA°
RAMONA°
ROSWELL°
SALEM°
SCOTLAND°
SHERMAN°
SIOUXFALLS°
SPENCER°
SPRINGFIELD°
TABOR°
TEA°
VER-MIL-LION°
VIBORG°
VILAS°
VOLIN°
WA-KONDA°
WARD°
WENT-WORTH°
WOR-THING°
YANKTON°
Chester
Dakota Dunes
Fedora
Richland
RunningWater
Shindler
Kaylor
LakeMadison
Milltown
BrantLake
Winfred
NORTHEASTBON HOMME
NORTHWESTBON HOMME
SOUTHEASTBON HOMME
SOUTHWESTBON HOMME
BETHEL
FAIR-VIEW
GARFIELD
GLEN-WOOD
MECKLING
NORWAY
PLEASANTVALLEY
PRAIRIECENTER
RIVERSIDE
SPIRITMOUND
STAR
VERMILLION
UN
ION
WARDBADUS
CHESTERCLARNO
CONCORD
FARMING-TON
FRANKLIN
HERMAN LAKEVIEW
LE ROY
NUNDA
ORLAND
RUTLAND
SUMMITWAYNE
WENT-WORTH
WINFRED
BEULAH
EDGER-TON
FAIRVIEW
BROOK-LYN
CANTON
DAYTON
DELAPRE
DELA-WARE
EDEN
FAIR-VIEW
GRANT
HIGH-LAND
HANSONJASPER
PLANO
PLEASANTROSE-DALE
SPRINGLAKE
LA VALLEY
LINCOLN
LYNN
NORWAY
PERRY
TAYLOR
WAYNE
WORTHEN
PLEASANT
SPRINGDALE
CAPITAL
CLAYTONCROSSPLAINS
FAIR
BENTON
BRIDGE-WATER
BROOK-FIELD
CAN-ISTOTA
EMERY
FOSTER
GERMAN
GRAND-VIEW
KASSEL
KAYLOR
GRANT
GREEN-LAND
JEFFERSON
MON-TROSE
PEARL RAMSEY
RICH-LANDSALEM
SPRINGVALLEY
SUNPRAIRIE
UNION
KULM
LIBERTYMILLTOWN
MOLANOAKHOLLOW
PLEASANT
SHARON
SILVERLAKE BROTHERS-
FIELD
CENTER-VILLE
CHILDS-TOWN
DANE-VILLE
DOLTON
GERMAN-TOWN
HOME
HURLEY
MARION
MIDDLE-TON
MONROE
NORWAY
PARKERROSE-FIELD
STARR
SUSQUE-HANNA
SWEET
VALLEYWITTEN-
BERG
WOLFCREEK
ADAMS
BEAVER
BELLEVIEW
CANOVA
CARTHAGE
CLEAR-WATER
CLINTON
GRAFTON
GREENVALLEY
HENDEN
HOWARD
MINER
RED-STONE
ROCKCREEK
ROSWELL
VERMILLIO
N
BENTON
BRANDON
BUFFALO BURK
CLEARLAKE
DELLRAPIDS
EDISONGRAND
MEADOW
HARTFORD
HIG
HLA
ND
HUM-BOLDT
LOGAN
LYONSPALISADE
REDROCK
SPLITROCK
SVERDRUP
TAOPI
VALLEYSPRINGSWALL
LAKE
WAYNE
WELL
INGTO
N
ALLIANCEBLINSMON
CLARE
COLMAN
EGAN
ENTER-PRISE
FLAN-DREAU
FREMONT
GROVENA
JEFFER-SON
LONEROCK
LYNN
RIVER-VIEW
SPRINGCREEK
SALEMSPRINGVALLEY
SWANLAKE TURNER
ALCESTER
BIG SIOUX
BIGSPRINGS
BRULE
CIVILBEND
ELK POINT
EMMET
JEFFERSON
PRAIRIE
RICHLAND
SIOUXVALLEY
SPINK
VIR
GIN
IA
GAYVILLE
JAMESVILL
E
MARIN-DAHL
MAYFIELD
MISSIONHILL
SOUTHEASTYANKTON
TURKEYVALLEY
UTICA VOLIN
WALSH-TOWN
WESTYANKTON
SEESECTION 5
SEESECTION 7
Missouri River
96°30’
96°30’
97°
97°
97°30’
97°30’
98°
98°
44°
44°
43°3
0’
43°3
0’
43°
43°
42°3
0’
42°3
0’
American Indian Areas, Counties, County Subdivisions, and Places - Section 6
0 5 10 15 Kilometers
0 5 10 15 Miles

E-10 South Dakota MapsU.S. Census Bureau, 2010 Census
AU
RO
RA
BR
ULE
BU
FFA
LO
CH
AR
LES
MIX
DAV
ISO
N
DO
UG
LAS
GR
EGO
RY
JER
AU
LD
LYM
AN
SAN
BO
RN
TRIP
PP
RO
GR
ES
SIV
EB
RU
NS
ON
Missouri Rive
r
RO
SE
BU
D (p
ts)
BO
NE-
STEE
L°
CO
LOM
E°
CO
RSI
CA
°
DA
LLA
S°
DA
NTE
°
BU
RK
E°CH
AM
BER
-LA
IN°
ALP
ENA
°
AR
MO
UR
°
ART
E-SI
AN
°
GR
EGO
RY°
DEL
-M
ON
T°
ETH
AN
°
FAIR
FAX
°
GED
DES
°
MIT
CH
ELL°
HER
RIC
K°
KEN
NEB
EC°
KIM
BA
LL°
LAK
EA
ND
ES°
LAN
E°
LETC
HER
°
MO
UN
TV
ERN
ON
°
PIC
KS-
TOW
N°
NEW
WIT
TEN
°
OA
CO
MA
°
PLA
N-
KIN
TON
°
PLAT
TE°
PRES
HO
°
PUK
-W
AN
A°
RAV
INIA
°
REL
IAN
CE°
STIC
K-
NEY
°
WA
GN
ER°
WES
-SI
NG
TON
SPR
ING
S°
WH
ITE
LAK
E°
WIN
NER
°
WO
ON
-SO
CK
ET°
Fore
stbu
rg
Fort
Thom
pson
St. C
harle
s
Stor
la
Viv
ian
Gan
n Va
lley
Ham
ill
Har
rison
Loom
is
Low
er B
rule
Mar
ty
New
Hol
land
Ola
Aur
ora
Cen
ter
Bijo
uH
ills
CR
OW
CR
EEK
* (pt
)LO
WER
BR
ULE
(pt)
YAN
KTO
N
LOW
ER
BR
ULE
(pt)
LOW
ER
BR
ULE
(pt)
RO
SE
BU
D (p
ts)
RO
SE
BU
D (p
ts)
PLE
AS
AN
TVA
LLE
Y
TRU
RO
WA
SH
ING
-TO
N
WH
ITE
LAK
E
AU
RO
RA
BE
LFO
RD
BR
ISTO
L
CE
NTE
R
CO
OP
ER
CR
YS
TAL
LAK
ED
UD
LEY
EU
RE
KA
FIR
E-
STE
EL
GAL
ES
HO
PP
ER
LAKE
PALA
TIN
E
PATT
EN
PLA
N-
KIN
TON
PLE
A-
SA
NT
LAK
E
AM
ER
ICA
BR
ULE
CH
AM
BE
R-
LAIN
CLEVELA
ND
EA
GLE
GR
AN
DV
IEW
HIG
H-
LAN
D
KIM
BA
LL
LYO
N
OLA
PLA
IN-
FIE
LD
PLE
AS
AN
TG
RO
VE
PLU
MM
ER
PU
KW
AN
A
RED
LAKE
RIC
HLA
ND
SM
ITH
TOR
REY
LAKE
UN
ION
WA
LDR
O
WE
ST
PO
INT
WIL
BUR
WIL
LOW
LAK
E
CR
OW
CR
EEK
ELV
IRA
NO
RTH
BU
FFA
LO
SO
UTH
EA
ST
BU
FFA
LO
BRYA
N
CA
RR
OLL
CA
STA
LIA
CH
OTE
AU
CR
EE
K
DA
RLI
NG
TON
FOR
BE
S
GO
OS
E LA
KE
HA
MIL
TON
HIG
H-
LAN
D
HO
WA
RD
JAC
KS
ON
KE
NN
ED
Y
LAKE
GEO
RG
ELA
RO
CH
E
LAW
-R
EN
CE
LON
ETR
EE
MO
OR
E
PLA
INC
EN
TER
PLA
TTE
REE
RH
OD
A
RO
US
E
SIG
NA
L
WAH
EH
E
WH
ITE
SW
AN
BA
DG
ER
BA
KE
R
BE
ULA
H
BLE
ND
ON
LIS
BO
N
MIT
CH
ELL
MO
UN
TV
ER
NO
N
PE
RR
Y
PR
OS
PE
R
RO
ME
TOB
IN
UN
ION
BE
LMO
NT
CH
ES
TER
CLA
RK
EA
ST
CH
OTE
AU
GA
RFI
ELD
GR
AN
D-
VIE
W
HO
LLA
ND
IND
E-
PE
ND
EN
CE
IOW
A
JOU
BE
RT
LIN
CO
LNVA
LLEY
WA
LNU
TG
RO
VE
WA
SH
ING
-TO
N
DIX
ON
EAS
T G
RE
GO
RY
ED
EN
S
FAIR
FAX
JON
ES
LAN
DIN
GC
RE
EK N
OR
TH G
RE
GO
RY
PLE
AS
AN
TVA
LLE
Y
SC
HR
IEV
ER
SO
UTH
EA
ST
GR
EG
OR
Y
STA
RVA
LLEY
WES
T G
REG
OR
Y
AFT
ON
BE
NE
DIC
T
BU
TLE
R
DIA
NA
ELL
IOTT
FLO
YDJA
CK
SO
N
LETC
HE
R
LOG
AN
MIL
LBO
RO
PAH
A-
PE
STO
PLA
IN-
VIE
W
PLE
AS
AN
TVA
LLE
Y
PLE
AS
AN
TV
IEW
RA
ME
S
ROSEDALE
RO
SE
-LA
ND
STA
RP
RA
IRIE
STA
RVA
LLE
Y
ON
EID
A
RAV
EN
NA
SIL
VE
RC
RE
EK
TWIN
LAKE
UN
ION
WA
RR
EN
BA
ILE
Y
BLA
CK
DO
G
CE
NTR
AL
LYM
AN
EA
ST
LYM
AN
ION
A
LOW
ER
BR
ULE
(pt)
LOW
ER
BR
ULE
(pt)
OA
CO
MA
PLE
AS
AN
T
PRAT
T
BE
AVE
RC
RE
EK
BLA
CK
BU
LLC
RE
EK
CARTER
CO
LOM
E
CO
ND
ON
CU
RLE
W
DO
GEA
R
ELL
ISTO
N
GA
SS
-M
AN
GR
EE
NW
OO
D
REX
RO
SE
VIV
IANW
EST
LYM
AN
STE
WA
RT
SU
LLY
TAYLO
R
VALL
EY
WEA
VER
WIL
LOW
CR
EE
K
WIL
SON
WIT
TEN
WO
RTM
AN
WO
ON
-S
OC
KE
THOLSCLAW
HU
GG
INS
IDE
AL
IRW
IN
JOR
DA
N
KE
YAPA
HA
KIN
G
LAKE
LAM
RO
LIN
CO
LN
LON
ES
TAR
LON
ETR
EE
McN
EE
LYW
RIG
HT
BA
NN
ER
ALP
EN
A
AN
INA
BLA
INE
CH
ER
Y
CR
OW
CR
OW
LAKE
DAL
E
FRA
NK
LIN
HA
RM
ON
Y
LOG
AN
MA
RLA
R
ME
DIA
PLE
AS
AN
T
VIO
LA
WE
S-
SIN
GTO
NS
PR
ING
S
SEE
SEC
TIO
N 2
SEE
SEC
TIO
N 3
SEE
SEC
TIO
N 4
SEE
SEC
TIO
N 6
SEE
SEC
TIO
N 8
American Indian Areas, Counties, County Subdivisions, and Places - Section 7
100°
100°
98°
98°
98°3
0’
98°3
0’
99°
99°
99°3
0’
99°3
0’
44°
44°
43°30’
43°30’
43°
43°
05
1015
Kilo
met
ers
05
1015
Mile
s
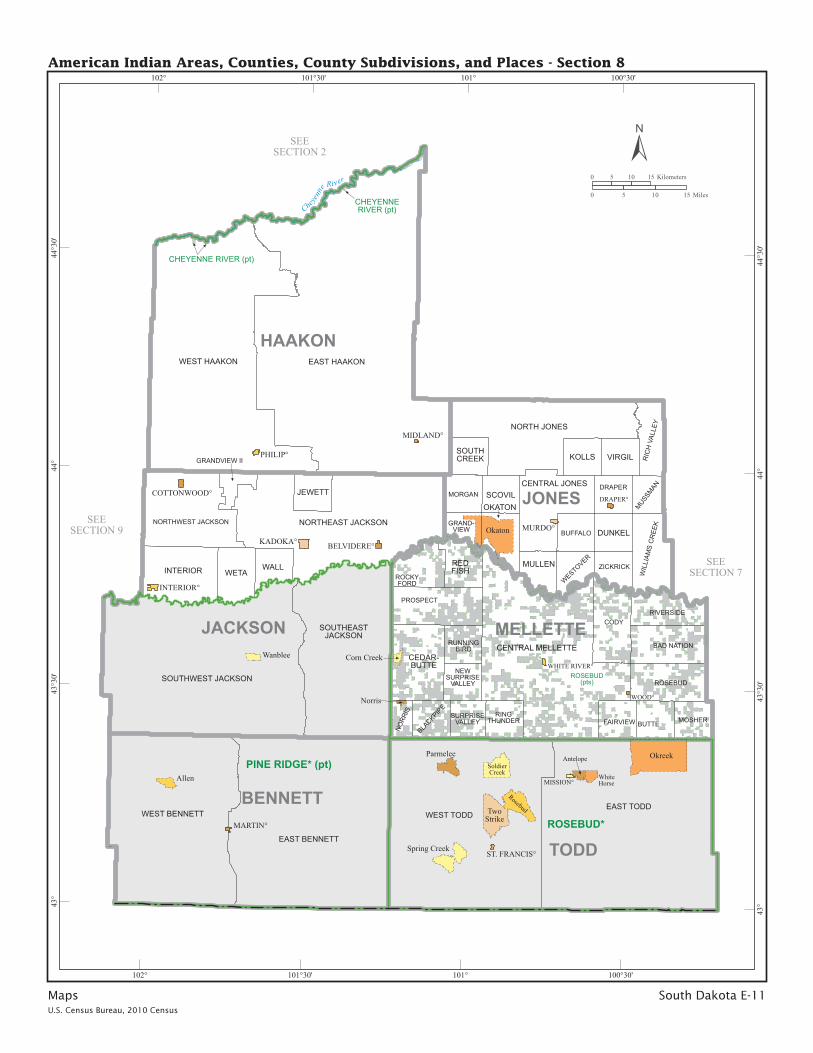
Maps South Dakota E-11U.S. Census Bureau, 2010 Census
BENNETT
HAAKON
JACKSON
JONES
MELLETTE
TODD
SURPRISEVALLEY
CENTRAL MELLETTE
BUTTE
Che
yenn
e River
BELVIDERE°
COTTONWOOD°DRAPER°
MARTIN°
MIDLAND°
MISSION°
INTERIOR°
KADOKA°
MURDO°
PHILIP°
ST. FRANCIS°
WHITE RIVER°
WOOD°
Corn Creek
Rosebud
SoldierCreek
Spring Creek
TwoStrike
Wanblee
Norris
Okaton
OkreekParmelee
Allen
Antelope
WhiteHorse
PINE RIDGE* (pt)
ROSEBUD*
CHEYENNERIVER (pt)
CHEYENNE RIVER (pt)
ROSEBUD(pts)
EAST BENNETT
WEST BENNETT
EAST HAAKONWEST HAAKON
BAD NATION
BLACKPIP
E
CEDAR-BUTTE
CODY
FAIRVIEW MOSHER
NEWSURPRISE
VALLEY
NORR
IS
PROSPECT
REDFISH
RINGTHUNDER
RIVERSIDE
ROCKYFORD
ROSEBUD
RUNNINGBIRD
EAST TODDWEST TODD
GRANDVIEW II
INTERIOR
JEWETT
NORTHEAST JACKSONNORTHWEST JACKSON
SOUTHEASTJACKSON
SOUTHWEST JACKSON
WALLWETA
BUFFALO
CENTRAL JONES DRAPER
DUNKELGRAND-
VIEW
KOLLS
MORGAN
MULLEN
MUSSMAN
NORTH JONES
OKATON
RIC
H V
ALLE
Y
SCOVIL
SOUTHCREEK VIRGIL
WESTOVER
WIL
LIAM
S C
REE
K
ZICKRICK
SEESECTION 2
SEESECTION 7
SEESECTION 9
100°30’
100°30’
101°
101°
101°30’
101°30’
102°
102°
44°3
0’
44°3
0’
44°
44°
43°3
0’
43°3
0’
43°
43°
American Indian Areas, Counties, County Subdivisions, and Places - Section 8
0 5 10 15 Kilometers
0 5 10 15 Miles

E-12 South Dakota MapsU.S. Census Bureau, 2010 Census
CU
STER
FALL
RIV
ER
PEN
NIN
GTO
N
SHA
NN
ON
RA
PID
CIT
Y° (
pt)
1 24
3
KEY
1A
shla
nd H
eigh
ts2
Gre
en V
alle
y3 4
Rap
id V
alle
y (p
t)R
apid
Val
ley
(pt)
PEN
NIN
GTO
N
BAT
ESLA
ND
°
BO
X E
LDER
° (pt
)
CU
STER
°
BU
FFA
LO G
AP°
EDG
EMO
NT°
FAIR
BU
RN
°
HER
MO
SA°
HIL
L C
ITY
°
HO
T SP
RIN
GS°
KEY
STO
NE°
NEW
UN
DER
WO
OD
°
OEL
RIC
HS°
PRIN
GLE
°
QU
INN
°
RA
PID
CIT
Y° (
pt)
WA
LL°
WA
STA
°C
olon
ial
Pine
Hill
s
John
son
Sidi
ng
Kyl
e
Man
ders
on-
Whi
te H
orse
Cre
ek
Ogl
ala
Pine
Rid
ge
Porc
upin
e
Wou
nded
Kne
e
PIN
E R
IDG
E* (p
t)
EA
ST
CU
STE
RW
ES
T C
US
TER
ARGENTINE
NO
RTH
EAS
T FA
LL R
IVER
PR
OV
O
RO
BIN
S
SO
UTH
WE
ST F
ALL
RIV
ER
AS
H (p
t)
AS
H (p
t)
CAS
TLE
BU
TTE
CE
DA
RB
UTT
E
CE
NTR
AL
PE
NN
ING
TON
(pt)
CE
NTR
AL
PE
NN
ING
TON
(pt)
CO
NAT
A
CR
OO
KE
DC
RE
EK
DA
LZE
LLC
AN
YO
N
EA
ST
CE
NTR
AL
PE
NN
ING
TON
(pt)
EA
ST
CE
NTR
AL
PE
NN
ING
TON
(pt)
FAIR
VIE
W
FLAT
BU
TTE
HU
RO
N
IMLA
Y
LAKE
CR
EEK
LAKE
FLAT
LAKE
HIL
L
MO
UN
TR
US
HM
OR
E
NORTHEAST PENNINGTON
OW
AN
KA
PE
NO
QU
INN
RA
INY
CR
EE
K/
CH
EY
EN
NE
RAP
ID C
ITY
EA
ST
SC
EN
IC
SH
YN
E
SU
NN
Y-S
IDE
WAS
TAW
ES
T P
EN
NIN
GTO
N
EA
ST
SH
AN
NO
NW
ES
T S
HA
NN
ON
SEE
SEC
TIO
N 1
SEE
SEC
TIO
N 8
Cheyenn
e Rive
r
American Indian Areas, Counties, County Subdivisions, and Places - Section 9
05
1015
Kilo
met
ers
05
1015
Mile
s
101°
30’
101°
30’
102°
102°
102°
30’102°
30’
103°
103°
103°
30’10
3°30
’
104°
104°
44°30’
44°
44°
43°30’
43°30’
43°
43°

Maps South Dakota E-13U.S. Census Bureau, 2010 Census
Dis
tric
t 4
Dis
tric
t 6
Dis
tric
t 1
Dis
tric
t 2
Dis
tric
t 3
Dis
tric
t 5
American Indian Reservation and Off-Reservation Trust Land, Tribal Subdivisions -Cheyenne River
05
1015
Kilometers
05
1015
Miles
Are
a Lo
cato
r Map
Map
Leg
en
d
Tri
bal
Su
bd
ivis
ion
Amer
ican
Ind
ian
Rese
rvat
ion/
Off-
Rese
rvat
ion
Trus
t La
nd
Not
e: A
ll le
gal b
ound
arie
s an
d na
mes
are
as
of J
anua
ry 1
, 201
0. W
here
the
boun
darie
s co
inci
de, t
he m
ap s
how
s th
e bo
unda
ry s
ymbo
l for
the
Amer
ican
Ind
ian
rese
rvat
ion
and/
or o
ff-re
serv
atio
n tr
ust
land
. Any
geog
raph
ic e
ntity
nam
e m
ay in
clud
e ’(p
t)’ i
f so
me
port
ion
of t
he e
ntity
exte
nds
beyo
nd t
he li
mits
of
the
map
are
a di
spla
yed
on t
he p
age,
or
ifm
ultip
le d
isco
ntig
uous
pie
ces
of t
he e
ntity
hav
e be
en d
iscr
etel
y la
bele
don
the
pag
e. A
geo
grap
hic
entit
y na
me
may
incl
ude
’(pts
)’ if
man
y di
scon
tiguo
us p
iece
s ex
ists
for
tha
t en
tity
that
can
not
be d
iscr
etel
y la
bele
d.Th
e bo
unda
ries
show
n on
thi
s m
ap a
re for
Cen
sus
Bure
au s
tatis
tical
dat
aco
llect
ion
and
tabu
latio
n pu
rpos
es o
nly;
the
ir de
pict
ion
and
desi
gnat
ion
for
stat
istic
al p
urpo
ses
does
not
con
stitu
te a
det
erm
inat
ion
of ju
risdi
ctio
nal
auth
ority
or
right
s of
ow
ners
hip
or e
ntitl
emen
t.

E-14 South Dakota MapsU.S. Census Bureau, 2010 Census
Fort
Th
om
pso
n
Big
Ben
d
Cro
w C
reek
American Indian Reservation, Tribal Subdivisions - Crow Creek
02
46Kilometers
02
46Miles
Are
a Lo
cato
r Map
Map
Leg
en
d
Tri
bal
Su
bd
ivis
ion
Amer
ican
Ind
ian
Rese
rvat
ion
Not
e: A
ll le
gal b
ound
arie
s an
d na
mes
are
as
of J
anua
ry 1
, 201
0. W
here
the
boun
darie
s co
inci
de, t
he m
ap s
how
s th
e bo
unda
ry s
ymbo
l for
the
Amer
ican
Ind
ian
rese
rvat
ion
and/
or o
ff-re
serv
atio
n tr
ust
land
. Any
geog
raph
ic e
ntity
nam
e m
ay in
clud
e ’(p
t)’ i
f so
me
port
ion
of t
he e
ntity
exte
nds
beyo
nd t
he li
mits
of
the
map
are
a di
spla
yed
on t
he p
age,
or
ifm
ultip
le d
isco
ntig
uous
pie
ces
of t
he e
ntity
hav
e be
en d
iscr
etel
y la
bele
don
the
pag
e. A
geo
grap
hic
entit
y na
me
may
incl
ude
’(pts
)’ if
man
y di
scon
tiguo
us p
iece
s ex
ists
for
tha
t en
tity
that
can
not
be d
iscr
etel
y la
bele
d.Th
e bo
unda
ries
show
n on
thi
s m
ap a
re for
Cen
sus
Bure
au s
tatis
tical
dat
aco
llect
ion
and
tabu
latio
n pu
rpos
es o
nly;
the
ir de
pict
ion
and
desi
gnat
ion
for
stat
istic
al p
urpo
ses
does
not
con
stitu
te a
det
erm
inat
ion
of ju
risdi
ctio
nal
auth
ority
or
right
s of
ow
ners
hip
or e
ntitl
emen
t.

Maps South Dakota E-15U.S. Census Bureau, 2010 Census
Heipa(pt)
Lake Traverse
Enemy Swim
Big Coulee
Old Agency
Buffalo Lake
Long Hollow
American Indian Reservation and Off-Reservation Trust Land, Tribal Subdivisions -Lake Traverse (pt)
Note: All legal boundaries and names are as of January 1, 2010. Wherethe boundaries coincide, the map shows the boundary symbol for theAmerican Indian reservation and/or off-reservation trust land. Anygeographic entity name may include ’(pt)’ if some portion of the entityextends beyond the limits of the map area displayed on the page, or ifmultiple discontiguous pieces of the entity have been discretely labeledon the page. A geographic entity name may include ’(pts)’ if many discontiguous pieces exists for that entity that cannot be discretely labeled.The boundaries shown on this map are for Census Bureau statistical datacollection and tabulation purposes only; their depiction and designation forstatistical purposes does not constitute a determination of jurisdictionalauthority or rights of ownership or entitlement.
Tribal Subdivision
American Indian Reservation/Off-Reservation Trust Land
Map Legend
Area Locator Map
0 3 6 9 Kilometers
0 3 6 9 Miles

E-16 South Dakota MapsU.S. Census Bureau, 2010 Census
LaC
reek
Eagle
Nes
t
Wh
ite
Cla
y
Wak
pam
ni
(pt)
Med
icin
e R
oot
Porc
up
ine
Wou
nd
ed K
nee
Pass
Cre
ek
American Indian Reservation, Tribal Subdivisions - Pine Ridge (pt)
04
812
Kilometers
04
812
Miles
Are
a Lo
cato
r Map
Map
Leg
en
d
Tri
bal
Su
bd
ivis
ion
Amer
ican
Ind
ian
Rese
rvat
ion
Not
e: A
ll le
gal b
ound
arie
s an
d na
mes
are
as
of J
anua
ry 1
, 201
0. W
here
the
boun
darie
s co
inci
de, t
he m
ap s
how
s th
e bo
unda
ry s
ymbo
l for
the
Amer
ican
Ind
ian
rese
rvat
ion
and/
or o
ff-re
serv
atio
n tr
ust
land
. Any
geog
raph
ic e
ntity
nam
e m
ay in
clud
e ’(p
t)’ i
f so
me
port
ion
of t
he e
ntity
exte
nds
beyo
nd t
he li
mits
of
the
map
are
a di
spla
yed
on t
he p
age,
or
ifm
ultip
le d
isco
ntig
uous
pie
ces
of t
he e
ntity
hav
e be
en d
iscr
etel
y la
bele
don
the
pag
e. A
geo
grap
hic
entit
y na
me
may
incl
ude
’(pts
)’ if
man
y di
scon
tiguo
us p
iece
s ex
ists
for
tha
t en
tity
that
can
not
be d
iscr
etel
y la
bele
d.Th
e bo
unda
ries
show
n on
thi
s m
ap a
re for
Cen
sus
Bure
au s
tatis
tical
dat
aco
llect
ion
and
tabu
latio
n pu
rpos
es o
nly;
the
ir de
pict
ion
and
desi
gnat
ion
for
stat
istic
al p
urpo
ses
does
not
con
stitu
te a
det
erm
inat
ion
of ju
risdi
ctio
nal
auth
ority
or
right
s of
ow
ners
hip
or e
ntitl
emen
t.

Maps South Dakota E-17U.S. Census Bureau, 2010 Census
An
telo
pe
(pt)
Okre
ek(p
ts)
Idea
l(p
t)
Idea
l(p
t)
Okre
ek(p
t)A
nte
lop
e(p
t)
St.
Fran
cis
Spri
ng C
reek
Parm
elee
He
Dog
Rose
bu
d
Up
per
Cu
t M
eat
Tw
oSt
rikeSw
ift
Bea
r(p
ts)
Idea
l(p
ts)
Bla
ckPi
pe
(pts
)
RingThunder
Corn
Cre
ek(p
ts)
Bu
tte
Cre
ek(p
ts)
Sold
ier
Cre
ek GrassMountain
Hors
eC
reek
(pts
)
Mil
k’s
Cam
p(p
ts)
Bu
ll C
reek
(pts
)
American Indian Reservation and Off-Reservation Trust Land, Tribal Subdivisions - Rosebud
05
1015
Kilometers
05
1015
Miles
Are
a Lo
cato
r Map
Map
Leg
en
d
Tri
bal
Su
bd
ivis
ion
Amer
ican
Ind
ian
Rese
rvat
ion/
Off-
Rese
rvat
ion
Trus
t La
nd
Not
e: A
ll le
gal b
ound
arie
s an
d na
mes
are
as
of J
anua
ry 1
, 201
0. W
here
the
boun
darie
s co
inci
de, t
he m
ap s
how
s th
e bo
unda
ry s
ymbo
l for
the
Amer
ican
Ind
ian
rese
rvat
ion
and/
or o
ff-re
serv
atio
n tr
ust
land
. Any
geog
raph
ic e
ntity
nam
e m
ay in
clud
e ’(p
t)’ i
f so
me
port
ion
of t
he e
ntity
exte
nds
beyo
nd t
he li
mits
of
the
map
are
a di
spla
yed
on t
he p
age,
or
ifm
ultip
le d
isco
ntig
uous
pie
ces
of t
he e
ntity
hav
e be
en d
iscr
etel
y la
bele
don
the
pag
e. A
geo
grap
hic
entit
y na
me
may
incl
ude
’(pts
)’ if
man
y di
scon
tiguo
us p
iece
s ex
ists
for
tha
t en
tity
that
can
not
be d
iscr
etel
y la
bele
d.Th
e bo
unda
ries
show
n on
thi
s m
ap a
re for
Cen
sus
Bure
au s
tatis
tical
dat
aco
llect
ion
and
tabu
latio
n pu
rpos
es o
nly;
the
ir de
pict
ion
and
desi
gnat
ion
for
stat
istic
al p
urpo
ses
does
not
con
stitu
te a
det
erm
inat
ion
of ju
risdi
ctio
nal
auth
ority
or
right
s of
ow
ners
hip
or e
ntitl
emen
t.

E-18 South Dakota MapsU.S. Census Bureau, 2010 Census
Rock
Cre
ek
Wak
pal
a
Ken
el(p
t)
Litt
le E
agle
Bea
r So
ldie
r
American Indian Reservation, Tribal Subdivisions - Standing Rock (pt)A
rea
Loca
tor M
ap
Map
Leg
en
d
Tri
bal
Su
bd
ivis
ion
Amer
ican
Ind
ian
Rese
rvat
ion
Not
e: A
ll le
gal b
ound
arie
s an
d na
mes
are
as
of J
anua
ry 1
, 201
0. W
here
the
boun
darie
s co
inci
de, t
he m
ap s
how
s th
e bo
unda
ry s
ymbo
l for
the
Amer
ican
Ind
ian
rese
rvat
ion
and/
or o
ff-re
serv
atio
n tr
ust
land
. Any
geog
raph
ic e
ntity
nam
e m
ay in
clud
e ’(p
t)’ i
f so
me
port
ion
of t
he e
ntity
exte
nds
beyo
nd t
he li
mits
of
the
map
are
a di
spla
yed
on t
he p
age,
or
ifm
ultip
le d
isco
ntig
uous
pie
ces
of t
he e
ntity
hav
e be
en d
iscr
etel
y la
bele
don
the
pag
e. A
geo
grap
hic
entit
y na
me
may
incl
ude
’(pts
)’ if
man
y di
scon
tiguo
us p
iece
s ex
ists
for
tha
t en
tity
that
can
not
be d
iscr
etel
y la
bele
d.Th
e bo
unda
ries
show
n on
thi
s m
ap a
re for
Cen
sus
Bure
au s
tatis
tical
dat
aco
llect
ion
and
tabu
latio
n pu
rpos
es o
nly;
the
ir de
pict
ion
and
desi
gnat
ion
for
stat
istic
al p
urpo
ses
does
not
con
stitu
te a
det
erm
inat
ion
of ju
risdi
ctio
nal
auth
ority
or
right
s of
ow
ners
hip
or e
ntitl
emen
t.
04
812
Kilometers
04
812
Miles

Maps South Dakota E-19U.S. Census Bureau, 2010 Census
DIXON
DAKOTA
WOODBURY
(PART)
Aberdeen
Brookings
Huron M
itchell
Pierre
RapidCity
SiouxCity
Sioux
Falls
Spearfish
Vermillion
Watertown
Yankton
BROW
N
BRULE
BUTTE
CAM
PBEL
L
CLARK
CLAY
CODINGTON
CORSON
CUSTER
DAY
DEUEL
DOUGLAS
EDMUNDS
FALLRIVER
FAULK
GRANT
GREGORYHAND
HANSON
HARDING
HUGHES
HUTCHINSON
JACKSON
JERAULD
KINGSBURY
LAKE
LAWRENCE
LINCOLN
AURORA
BEADLE
BENNETT
BONHOMME
BROOKINGS
BUFFALO
CHARLESMIX
DAVISON
DEWEY
HAAKON
HYDE
JONES
LYMAN
MEADE
MELLETTE
PENNINGTON
SANBORN
STANLEY
TRIPP
TURNER
ZIEBACH
ROBERTS
SHANNON
SPINK
SULLY
TODD
UNION
WALWORTH
YANKTON
HAMLIN
McCOOK
McPHERSON
MARSHALL
MINER
MINNEHAHA
MOODY
PERKINS
POTTER
MONTANA
IOWA
MINNESOTA
NEBRASKA
NORTHDAKOTA
WYOMING
Aberdeen
Brookings
Huron
Mitchell
Pierre
Spearfish
Ver-
million
Watertown
Yankton
RAPIDCITY
SIOUXCITY
(PART)
SIOUXFALLS
SiouxC
ity-
Vermillion
(Part)
100°
100°
96°
96°
97°
97°
98°
98°
99°
99°
101°10
1°
102°
102°
103°
103°
104°
104°
46°
46°
45°
45°
44°
44°
43°
43°
42°
42°
Core Based Statistical Areas, Counties, and Principal Cities
020
4060
Kilometers
020
4060
Miles
CB
SA
boun
darie
san
dna
mes
are
asof
Dec
embe
r200
9.A
llot
herb
ound
arie
san
dna
mes
are
asof
Janu
ary
1,20
10.
NEBRASKA
Sta
te
LEG
EN
D
SiouxC
ity-Vermillion
Com
bine
dS
tatis
tical
Are
a
Pierre
Mic
ropo
litan
Sta
tistic
alAr
eaRAPIDCITY
Met
ropo
litan
Sta
tistic
alAr
ea
FALLRIVER
Cou
nty
Pierre
Prin
cipa
lCity
Sta
teca
pita
lund
erlin
ed
Cou
nty
outs
ide
Sou
thD
akot
a

E-20 South Dakota MapsU.S. Census Bureau, 2010 Census
#
#
#
#
#
#
##
##
#
#
#
#
#
#
#
#
#
#
#
#
#
#
#
MONTANA
IOW
A
MINNESOTA
NEB
RA
SKA
NO
RTH
DA
KO
TA
WYOMING
RAPI
D CI
TY
SIOU
X CI
TY, I
A--N
E--S
D
SIOU
XFA
LLS
Belle
Fou
rche
Aber
deen
Box
Elde
r
Bran
don
Broo
king
s
Dell
Rapi
ds Harri
sbur
gHo
t Spr
ings
Huro
nLe
ad
Milb
ank
Mitc
hell
Mob
ridge
Nor
th E
agle
But
te
Verm
illio
n
Wat
erto
wn
Win
ner
Yank
ton
Spea
rfish
Stur
gis
Tea
Pier
re
Pine
Rid
ge
Mad
ison
Cant
on
100°
100°
96°
97°
97°
98°
98°
99°
99°
101°10
1°
102°
102°
103°
103°
104°
104°
46°
46°
45°
45°
44°
44°
43°
43°
42°
42°
Urban Areas
±0
1020
30M
iles
010
2030
Kilo
met
ers
LEG
EN
D
URBA
NIZ
ED A
REA
All
lega
l and
sta
tistic
al a
rea
boun
darie
s ar
e as
of J
anua
ry 1
, 201
0. U
rban
Are
as a
re b
ased
on
resu
lts fr
om th
e 20
10 D
ecen
nial
Cen
sus.
STAT
E
#Ur
ban
Clus
ter
Cou
nty
Bou
ndar
y