population and labour force forecast for nine … · current document specifies the assumptions for...
TRANSCRIPT

Central European ForumFor Migration and Population Research
Środkowoeuropejskie ForumBadań Migracyjnych i Ludnościowych
International OrganizationFor Migration
Foundation for Population, Migration and Environment
Institute of Geography and Spatial Organisation, Polish Academy of Sciences
POPULATION AND LABOUR FORCE FORECASTFOR NINE EUROPEAN COUNTRIES:ASSUMPTIONS AND RESULTS
Jakub Bijak and Marek Kupiszewski
CEFMR Working Paper 4/2007
ul. T
war
da
51/5
5,
00-8
18 W
arsa
w,
Pola
nd
tel. +
48 2
2 6
97 8
8 3
4,
fax
+48 2
2 6
97 8
8 4
3e-
mai
l: c
efm
r@ce
fmr.pan
.pl
Inte
rnet
: w
ww
.cef
mr.pan
.pl
Central European Forum for Migration and Population Research (CEFMR) is a research partnership of the Foundation for Population, Migration andEnvironment, Institute of Geography and Spatial Organization of the Polish Academy of Sciences and IOM - International Organization for Migration

CEFMR Working Paper 4/2007
POPULATION AND LABOUR FORCE FORECAST FOR NINE EUROPEAN COUNTRIES: ASSUMPTIONS AND RESULTS
Jakub Bijak* and Marek Kupiszewski*
* Central European Forum for Migration and Population Research in Warsaw Abstract: The paper presents selected demographic and labour market consequences of migration in Central and Eastern Europe in the light of long-term population and labour force forecasts for nine countries: the Czech Republic, Hungary, Italy, Poland, Portugal, Slovakia, Romania, Ukraine and the United Kingdom. The forecast is based on the 2004 benchmark population and spans over the period 2004–2054. Single mortality, fertility and labour force participation scenarios, and a number of variant international migration scenarios are considered. The paper aims at identifying main demographic and labour market threats envisaged for the first half of the 21st century, and for assessing the role of international migration in augmenting these threats. Keywords: Population forecast, labour market forecast, Europe The report constitutes preliminary outcomes of the Polish case study prepared within the research project “European Cooperation in Labour Migration: Search for Best Practices” for the European Commission, DG Justice, Freedom and Security (contract no. JLS/2005/ ARGO/GC/06), coordinated by IOM - International Organisation for Migration, Mission with Regional Functions in Budapest. Project management: Mr. Heikki Mattila, IOM Budapest, scientific coordination: Dr. Elmar Hönekopp, IAB Nuremberg (gratefully acknowledged).
Reprinted with the kind permission of IOM Budapest The views presented in this paper are those of the authors and do not necessarily reflect those of the European Commission, IOM – International Organization for Migration, Institute of Geography and Spatial Organization of the Polish Academy of Sciences, or Foundation for Population, Migration and Environment. Editor ul. Twarda 51/55, 00-818 Warsaw, Poland tel. +48 22 697 88 34, fax +48 22 697 88 43 e-mail: [email protected] Internet: www.cefmr.pan.pl © Copyright by IOM – International Organization for Migration This edition: Central European Forum for Migration and Population Research Warsaw, December 2007 ISSN 1732-0631 ISBN 978-83-60462-09-6
1
Contents
Introductory Notes _____________________________________________________________ 3
1. Background and assumptions of population and labour force forecasts for 2004–2054 ___ 3 1.1. Forecast horizon, geographic scope, data sources and population dynamics model .............................. 3 1.2. Assumptions on fertility ......................................................................................................................... 4 1.3. Assumptions on mortality....................................................................................................................... 5 1.4. International migration ........................................................................................................................... 6
1.4.1. Migration within the system of ARGO-9 countries ......................................................................... 7 1.4.2. Net external migration scenarios from other countries of the world .............................................. 9
1.5. Assumptions on labour force participation........................................................................................... 13
2. The futures of population and labour force in selected countries in Europe ___________ 14 2.1. General remarks.................................................................................................................................... 14 2.2. Evolution of population and population age structures over time ........................................................ 15 2.3. Evolution of labour force and labour force age structures over time.................................................... 18
3. Critical assessment of results and conclusions ____________________________________ 22
References ___________________________________________________________________ 25

2
3
Introductory Notes
This paper presents the assumptions and results of a 50-year (2004–2054) population and labour force forecast1 prepared for the countries analysed in the current project. It is intended to give a long-term demographic outlook at the futures of populations of selected European countries and to set the scene for consideration of existing and future labour migration. The paper consists of three parts. The first part presents the assumptions of the population and labour force forecast, while the second part – the results obtained in the forecast. Finally, the third part contains a critical assessment of the results and a summary of major conclusions.
1. Background and assumptions of population and labour force forecasts for 2004–2054
1.1. Forecast horizon, geographic scope, data sources and population dynamics model
The forecast is prepared for the period 2004–2054 (with 2004 as the base year), at five-year intervals 2005–2009, … , 2050–2054. Population and demographic events are considered in five-year age groups, with the last (open-ended) group covering people aged 85+ for population and 75+ for the labour force. The geographical scope covers nine European countries analyzed in the ARGO 2005 project (hereafter: ARGO-9): the Czech Republic (CZ), Hungary (HU), Italy (IT), Poland (PL), Portugal (PT), Romania (RO), Slovakia (SK), Ukraine (UA) and the United Kingdom (UK). Data on demographic variables (base population size and structure, fertility, mortality, and migration) come from two main sources, treated as complementary: the NewCronos database of Eurostat (epp.eurostat.ec.europa.eu, downloaded in February 2007), and yearbooks “Recent Demographic Developments in Europe” of the Council of Europe (in particular, the 2005 edition). Labour force participation data come from the ILO estimates available from the Laborsta database (laborsta.ilo.org, downloaded in February 2007), and consider only people aged 15+. Wherever necessary, the missing values have been supplemented by data from national statistical offices, or estimated on the basis of the available information. All data sources and potential modifications are documented in relevant data spreadsheets. Subsequent subsections of this section present assumptions on future developments of: 1. fertility, expressed in terms of total fertility rates (TFR); 2. mortality, in terms of life expectancies; 3. international migration flows, both within the system of nine countries under
1 While well aware of the distinction between the terms ‘forecast’ and ‘projection’, in the current study we
always use ‘forecast’, as it reflects our beliefs in the future developments of the components under study. We nonetheless readily concede that any forecast beyond the horizon of, say, 20 years is in fact a projection.
4
study (emigration rates per 1,000 population of a sending country), and net ‘external’ migration flows; as well as 4. age-specific labour force participation rates. As the current study uses wherever possible the 2002-based CEFMR population and labour force forecast, detailed qualitative and quantitative arguments on the assumptions concerning particular components of demographic and labour supply changes to a large extent reproduce the ones presented in the aforementioned research (Bijak, 2004; Bijak et al., 2004; Saczuk, 2004). The exceptions concern the addition of Ukraine, for which new scenarios have been developed, and a whole set of new assumptions concerning international migration flows. The current document specifies the assumptions for the 2004 forecast with special attention paid to these ones which differ in comparison to the assumptions made for the 2002 forecast. The forecast was prepared using the MULTIPOLES (MULTIstate POpulation model for multiLEvel Systems) model of population dynamics (for a detailed description of the model itself, see Kupiszewska and Kupiszewski, 2005). 1.2. Assumptions on fertility
Assumptions on target total fertility rates (TFR; children born per women aged 15–49) for 2054 are knowledge-based and as consistent as possible with other similar forecasts or projections (Eurostat, 2005; United Nations, 2007; national studies). The whole methodology and target values roughly follow the ones proposed in Bijak (2004), the only exceptions being Portugal (target TFR value modified downwards by 0.1 due to recent fertility decline in that country) and Ukraine (new addition). For the purpose of the current study, four clusters of countries have been identified, according to their common past TFR development patterns or to their cultural and geographical proximity. The following cluster-specific target TFRs have been assumed:
1.4 for South-Eastern and Eastern European countries (Romania, Ukraine); 1.5 for Central Europe (Czech Republic, Hungary, Poland, Slovakia), and for Italy; 1.6 for Portugal; 1.8 for the United Kingdom.
In addition, an alternative high-fertility scenario has been prepared, where the values derived using the methodology described below have been additionally cumulatively increased by 0.01 a year, so as to reach targets higher than base targets by 0.5 child per woman. The baseline 2004 TFR values and the 2054 targets have been bridged in the following way. Initially, until 2024, a polynomial Hermite interpolation was used, ensuring a smooth passage from the initial values to the target values reduced by 0.05, as well as from the initial slope (α = TFR2004–TFR2003) to the default zero. Afterwards, the 2024 and 2054 values were bridged linearly. The matrix formula for the Hermite interpolation is TFRt = st’· H · b, where
5
t = 2005, …, 2024, st = (t–2004) / 20, st’ = [st3 st
2 st 1], b’ = [TFR2004 TFR2054–0.05 α 0], and the Hermite coefficient matrix H is equal to:
2 –2 1 1 –3 3 –2 –1
H = 0 0 1 0
1 0 0 0
The 2004 sex and age-of-mother structures of births have been simplistically assumed constant throughout the forecast horizon. 1.3. Assumptions on mortality
The assumptions are based on the life expectancy at birth (e0, LE). In all countries under study mortality improvements are envisaged, resulting in an increase of LE for both sexes. We assume that in relatively high-mortality regimes these improvements can be mainly attributed to the reduction of age-specific mortality rates in the age group 0–19, in the first place concerning infant mortality. For most cases under study, however, mortality reductions are assumed to be equally distributed among all age groups. Only in the lowest-mortality countries, where due to technological life-saving developments infant mortality has been reduced to the levels close to the “biological minimum”, leaving hardly any room for further improvements, are the mortality decreases assumed to affect primarily adults (people aged 20 years or more). Historical data series on life expectancy have been collected from the Council of Europe (2005) yearbook, supplemented with Eurostat data for the lowest-mortality (highest-life expectancy) countries, including Japan. The 1960–2004 series have been examined in order to approximate a linear trend of the maximum LE, following the proposition of Oeppen and Vaupel (2002). The estimated trends for both sexes (LEt = 0.170 t – 262.88 for males, LEt = 0.216 t – 347.97 for females) were used to extrapolate maximum life expectancy until about 80 (males) and 85 years (females). Afterwards, the increase in maximum life expectancy is assumed to slow down. Contrary to Oeppen and Vaupel (2002), it can be argued that the linear increase of life expectancy in the 20th century was due to the decline in infant and child mortality, where currently there is not much left to improve (E. Tabeau, personal communication). Therefore, for the longer period the trend slope for males was reduced by 20%. For females the initial trend slope was reduced by 20% for 7 further years, by 40% for the next 10 years and by 60% for the remainder of the forecast period. The differentiation was made between the sexes, as a slow convergence of life expectancies for males and females was assumed, while the initial trend slope for females was greater than for males, which would produce the opposite effect.
6
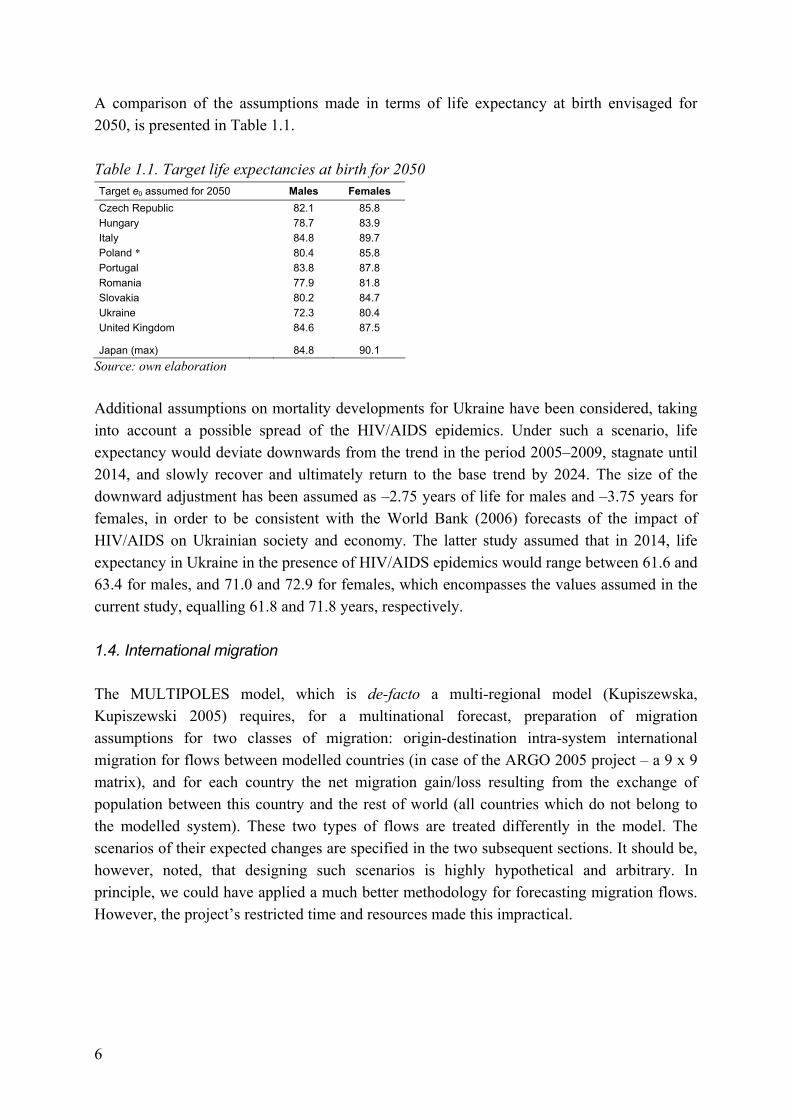
A comparison of the assumptions made in terms of life expectancy at birth envisaged for 2050, is presented in Table 1.1. Table 1.1. Target life expectancies at birth for 2050 Target e0 assumed for 2050 Males Females Czech Republic 82.1 85.8 Hungary 78.7 83.9 Italy 84.8 89.7 Poland * 80.4 85.8 Portugal 83.8 87.8 Romania 77.9 81.8 Slovakia 80.2 84.7 Ukraine 72.3 80.4 United Kingdom 84.6 87.5
Japan (max) 84.8 90.1 Source: own elaboration Additional assumptions on mortality developments for Ukraine have been considered, taking into account a possible spread of the HIV/AIDS epidemics. Under such a scenario, life expectancy would deviate downwards from the trend in the period 2005–2009, stagnate until 2014, and slowly recover and ultimately return to the base trend by 2024. The size of the downward adjustment has been assumed as –2.75 years of life for males and –3.75 years for females, in order to be consistent with the World Bank (2006) forecasts of the impact of HIV/AIDS on Ukrainian society and economy. The latter study assumed that in 2014, life expectancy in Ukraine in the presence of HIV/AIDS epidemics would range between 61.6 and 63.4 for males, and 71.0 and 72.9 for females, which encompasses the values assumed in the current study, equalling 61.8 and 71.8 years, respectively. 1.4. International migration
The MULTIPOLES model, which is de-facto a multi-regional model (Kupiszewska, Kupiszewski 2005) requires, for a multinational forecast, preparation of migration assumptions for two classes of migration: origin-destination intra-system international migration for flows between modelled countries (in case of the ARGO 2005 project – a 9 x 9 matrix), and for each country the net migration gain/loss resulting from the exchange of population between this country and the rest of world (all countries which do not belong to the modelled system). These two types of flows are treated differently in the model. The scenarios of their expected changes are specified in the two subsequent sections. It should be, however, noted, that designing such scenarios is highly hypothetical and arbitrary. In principle, we could have applied a much better methodology for forecasting migration flows. However, the project’s restricted time and resources made this impractical.
7
1.4.1. Migration within the system of ARGO-9 countries
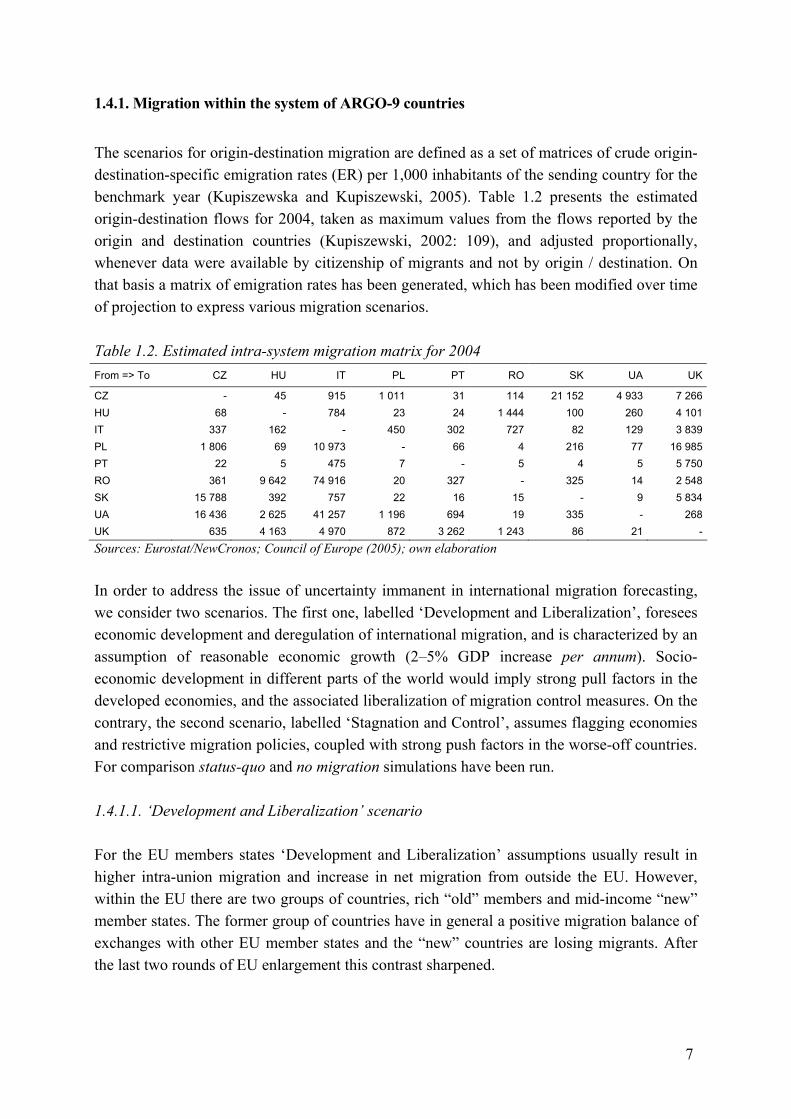
The scenarios for origin-destination migration are defined as a set of matrices of crude origin-destination-specific emigration rates (ER) per 1,000 inhabitants of the sending country for the benchmark year (Kupiszewska and Kupiszewski, 2005). Table 1.2 presents the estimated origin-destination flows for 2004, taken as maximum values from the flows reported by the origin and destination countries (Kupiszewski, 2002: 109), and adjusted proportionally, whenever data were available by citizenship of migrants and not by origin / destination. On that basis a matrix of emigration rates has been generated, which has been modified over time of projection to express various migration scenarios. Table 1.2. Estimated intra-system migration matrix for 2004 From => To CZ HU IT PL PT RO SK UA UK
CZ - 45 915 1 011 31 114 21 152 4 933 7 266HU 68 - 784 23 24 1 444 100 260 4 101IT 337 162 - 450 302 727 82 129 3 839PL 1 806 69 10 973 - 66 4 216 77 16 985PT 22 5 475 7 - 5 4 5 5 750RO 361 9 642 74 916 20 327 - 325 14 2 548SK 15 788 392 757 22 16 15 - 9 5 834UA 16 436 2 625 41 257 1 196 694 19 335 - 268UK 635 4 163 4 970 872 3 262 1 243 86 21 -Sources: Eurostat/NewCronos; Council of Europe (2005); own elaboration In order to address the issue of uncertainty immanent in international migration forecasting, we consider two scenarios. The first one, labelled ‘Development and Liberalization’, foresees economic development and deregulation of international migration, and is characterized by an assumption of reasonable economic growth (2–5% GDP increase per annum). Socio-economic development in different parts of the world would imply strong pull factors in the developed economies, and the associated liberalization of migration control measures. On the contrary, the second scenario, labelled ‘Stagnation and Control’, assumes flagging economies and restrictive migration policies, coupled with strong push factors in the worse-off countries. For comparison status-quo and no migration simulations have been run. 1.4.1.1. ‘Development and Liberalization’ scenario For the EU members states ‘Development and Liberalization’ assumptions usually result in higher intra-union migration and increase in net migration from outside the EU. However, within the EU there are two groups of countries, rich “old” members and mid-income “new” member states. The former group of countries have in general a positive migration balance of exchanges with other EU member states and the “new” countries are losing migrants. After the last two rounds of EU enlargement this contrast sharpened.
8
It is difficult to assess how economic development will affect the “new” to “old” migration flows, as there will be two processes occurring in parallel: economic development creates jobs and stimulates flows from poorer “new” to richer “old” countries. At the same time this development reduces unemployment and increases salaries, diminishing therefore two important push factors in the “new” countries: unemployment and low salaries. In consequence we assumed that the economic development-related increase in migration will be moderate, starting at 5% in 2005–2009 and reducing over time by 0.5% per each five-year forecast period, ultimately stabilising after 2029. The reduction is justified by the assumption that over time economies of “new” countries will grow faster than economies of “old” countries, thereby reducing the incentive to migrate. We also assume no increase in migration within the groups of “old” and “new” countries. Migration from Ukraine to “old” EU member states will be growing moderately until 2029 (by 2.5% per each forecast step), and destinations will slowly be shifting from “new” to “old” countries. We also assumed that migration to Ukraine and Romania will remain unchanged, despite growing emigration from these countries. Return migration from EU-8 to EU-15 countries will initially grow slowly, as a result of increased return migration, to stabilize after 20 years. In the short term, the key factor controlling migration will be whether labour markets of “old” member states open to migrants from “new” member states. Within the first forecast step (2005–2009) there will come the end of the 3–year period of the “2 – 3 – 2 years” scheme of restrictions. We assume that all countries except Germany and Austria will lift restrictions by the end of April 2009. However, we think that most of those who wanted to emigrate from the “old” to “new” (2004 enlargement) countries will turn out to have already done so in the period 2004–2006 and that the increase in outflow will occur predominantly in the first forecast period. We assumed the increase to be 4–5-fold, not taking into account short-term migration. In the second forecast period we assumed a moderate increase in flows to Germany which will have to lift restrictions in 2011, associated with a relative decrease in flows to the UK. Later, it is assumed that the lack of legal restrictions will have no impact on flows. Among the ARGO-9 EU countries, the Czech Republic, Poland and Slovakia did not impose any restrictions on labour migration by Romanian citizens, while Hungary and Italy liberalised only few sectors of the economy. We assumed that the increase in emigration from Romania will affect all destination countries except Ukraine. This is to express our belief that lifting administrative restrictions by poorer EU countries will have a similar effect as the attraction of rich countries, and to acknowledge the existence of a sizable Hungarian minority in Romania. It is also assumed that most of the “old” EU member states will lift restrictions on labour migration by Romanian citizens after 5 years. Similar scenarios to that of migration from EU-8 to EU-15 are envisaged, though the expected short-term increase will be smaller than in the former case, mostly because a lot of Romanian migrants either already emigrated or will emigrate before the lifting of restrictions takes place. An increase in migration to the

9
“old” EU member states will be at the expense in migration to the EU-8. Emigration from Romania will also decrease faster than in the case of the EU-8 countries, to express our belief that it is unlikely that very high outflows could be maintained for a long time. In all cases it is assumed that after 2029 the flows will stabilize. This is due to difficulties in reasonably predicting changes of such a volatile variable as international migration. 1.4.1.2. ‘Stagnation and Control’ scenario In the “Stagnation and Control” scenario we assumed that in general the direction of flows will remain the same as in “Development and Liberalization” scenario, but the changes in their intensity will decrease by half. This reduction will be much smaller for the changes of outflows of migrants from “new” to “old” EU member states, pending the removal of restrictions on mobility of labour: only to 70–80% as compared with values assumed for “Development and liberalization” scenario. Return flows of migrants will remain unchanged, as they are less dependent on the economic cycle (a silent assumption in the scenario setting is that economic growth and decline occurs with the same intensity in all countries simultaneously). 1.4.2. Net external migration scenarios from other countries of the world
The second migratory variable, for which assumptions are made, is net ‘external’ migration (NM) of particular countries, concerning population exchange with all countries outside the ARGO-9 area (‘rest of the world’). For statistical reasons the MULTIPOLES is designed to take assumptions on the crude numbers of migrants, not migration rates (see Kupiszewska and Kupiszewski, 2005) for exchanges with the rest of the world. For the purpose of scenario-setting, the NM aggregate was decomposed into two additive components: migration balance with non-ARGO countries of the EU and EFTA (NMEur), and net migration from the other parts of the world (NMOth). The forecast steps are five-year, with time index t = 0, 1, …, 10 for the periods 2000–2004, 2005–2009, …, 2050–2054, respectively. The projected NMt values are yearly arithmetic averages for the particular periods. The initial values for 2004 have been estimated as total net migration, as reported by the countries themselves, less net migration within the ARGO-9 system. The methodology of initial data estimation therefore follows Kupiszewski (2002: 109). As the forecast is based on the five-year averages, the values for the ‘zero’ period of the forecast, i.e. 2000–2004 (NM0), are calculated as weighted averages of respective yearly values, with weights wt for particular years t equalling: w2000 = 0.10, w2001 = 0.15, w2002 = 0.20, w2003 = 0.25, and w2004 = 0.30 (exceptions: Italy and Ukraine – countries with several missing observations, for which the weights wt have been proportionally adjusted, and Portugal, for which an arithmetic average for 2003–2005 has been used, calculated from the national data).
10
Assumptions on target values of migration balance with the outside world for the period are knowledge-based and follow the rationale presented below, both for migration within the EU and EFTA (NMEur), and for flows from other parts of the world (NMOth). Also here, two scenarios are considered: ‘Development and Liberalization’, and ‘Stagnation and Control’. 1.4.2.1. ‘Development and Liberalization’ scenario
a) ‘External’ migration within the EU and EFTA, NMEur Czech Republic, Hungary and Italy. A moderate increase (25%) in net migration
throughout the forecast horizon is assumed, due to increasing intra-European mobility following favourable socio-economic developments.
Poland and Slovakia. It is expected that almost all EU and EFTA countries will lift restriction on mobility of labour in 2009, with the exception of Germany and Austria, which will likely do so in 2011, and Switzerland in 2014. This would result in increasing net emigration in the two first forecast periods (2005–2009 and 2010–2014) by a factor of 1.25, followed by a decline to a zero balance by 2024, and a subsequent increase of net migration gains, due to growing return migration, ultimately reaching the levels from the initial period (2000–2004), only with the opposite (plus) sign.
Portugal. Portugual’s positive migration balance is to some extent fuelled by return migration. It is assumed that favourable economic condition will increase this category of migrants. Another factor is retirement migration, which may increase as Portugal will be a destination competing with France and Spain. For that reason, we assume a 50% increase from the initial level for 2000–2004.
Romania. Strong demand for labour in EU countries and an income gap will drive emigration from Romania. As most EU member states decided to keep restrictions on labour migration for Romanian citizens, and this will last most likely until 2012, in the first forecast period (2005–2009) only a moderate increase by 50% in migration loss is expected, mostly fuelled by unrestricted forms of labour migration (i.e. delivery of services and self-employment). In the second forecast period (2010–2014) a very substantial outflow, larger by a factor of three is expected, as all restrictions will be most likely lifted in this period. The target value is assumed to be 1.5 of the initial value.
Ukraine. Uncertain economic prospects for Ukraine, particularly for economic reforms, and a strong demand for labour in EU countries will result in a net migration loss, for which we assume no change in magnitude by the end of the forecast horizon.
United Kingdom. Negative net migration in the UK is mainly fuelled by retirement emigration to France and Spain. Financial resources of these migrants are saved before migration, and development over coming 50 years may increase the number of people who can afford migration. We assume an increase of the target by 50% from the initial value.

11
b) ‘External’ migration outside the EU and EFTA, NMOth Population ageing and strong demand for labour will result in an increase of net migration gain by 50% in the Czech Republic, Hungary, Romania and Slovakia, and a decrease in net migration loss by 50% in Ukraine – an emigration country. Keeping the migration balance of Ukraine below zero even under the assumption of economic development can be justified by an ever more important role of Russia as a growing petrodollar-fuelled economy with a strong demand for labour. For Italy and the United Kingdom we assumed the same target values of net immigration gains as at the beginning of the forecast period, while for Portugal – target values equal half of the initial values. The rationale for all three cases is a very high magnitude of net yearly inflows observed already at the beginning of the 21st century. In turn for Poland the initial net value of NMOth = 942 people is likely heavily underestimated – in the “Development and Liberalization” scenario we therefore expect a 15-fold increase by 2054.
1.4.2.2. ‘Stagnation and Control’ scenario
a) ‘External’ migration within the EU and EFTA, NMEur Czech Republic, Hungary, Italy and Portugal. No changes assumed. Poland ad Slovakia. The expected schedule for lifting restrictions on mobility is the
same, as in the previous scenario, yet we assume that although the demand for migrants will be weaker due to flagging economies in Western Europe, the negative push factors at source will prevail. This will result in a doubling of net emigration loss in the two first forecast periods (2005–2009 and 2010–2015). Later on we expect a slow increase to zero by the end of the forecast horizon, due to return migration, though smaller than in the previous scenario.
Romania. A moderate demand for labour in the EU countries will be compensated for by an increasing pressure to leave the country due to a poor economic situation, which will drive larger migration from Romania than in the previous scenario. Hence, we assume a double increase in migration loss in the first forecast period (2005–2009), a very substantial increase, by a factor of 3.5 in the subsequent period (2010–2014), especially as all political restrictions are likely to be lifted. The increases will be followed by a slow return to the trajectory aiming towards the target value, set to equal the initial value.
Ukraine. A stagnating Ukrainian economy is expected to be a key push migration factor, doubling the net migration loss by the end of the forecast horizon.
United Kingdom. In this scenario, we assume that the stagnation over 50 years will not lead to the increase of the number of people who could afford retirement or similar migration. Therefore, we assume no change in net migration figures.

12
b) ‘External’ migration outside the EU and EFTA, NMOth In this scenario we expect a decline in net migration gain by 50% in all countries with positive NMOth, with the exceptions of Portugal (decline by 80%) and Romania (decline by 65%), due to relatively high initial levels of immigration in two latter countries, unlikely to persist over the longer term. For Ukraine, a net migration loss is expected to increase by 50%, as compared to the initial values from 2000–2004, due to the continuing presence of unfavourable push factors fuelling emigration. The assumed values of particular net ‘external’ migration components achieved by the end of the forecast horizon are presented in Table 1.3. With the exception of post-enlargement deviations for NMEur described above (for Poland, Romania and Slovakia), the initial and target NM values have been bridged by the means of an exponential interpolation, according to the following formulae:
NMEurt = NMEur
10 + (NMEur0 – NMEur
10) · exp(–r · t), and NMOth
t = NMOth10 + (NMOth
0 – NMOth10) · exp(–r · t).
In the above equations, r denotes the growth rate of the exponential function, here assumed to be 0.25. This solution ensures a smooth passage from NM0 to NM10 and the asymptotic stabilization on the target level. Table 1.3. Net ‘external’ migration exchange with non-ARGO-9 countries: 2004 and 2054
‘Development and Liberalization‘, 2054 ‘Stagnation and Control‘, 2054 Country Average NM
2000–2004 Europe: NMEur Other: NMOth Total NM Europe: NMEur Other: NMOth Total NM Czech Rep. 7 191 894 9 431 10 324 727 3 497 4 224Hungary 5 855 1 623 6 617 8 240 1 320 2 454 3 774Italy 203 520 15 300 191 075 206 376 12 445 103 380 115 824Poland –13 148 11 778 13 054 24 832 –1 157 510 –647Portugal * 43 915 260 23 760 24 020 178 11 667 11 845Romania 8 179 –4 589 16 522 11 933 –3 145 3 068 –77Slovakia 1 803 42 2 703 2 746 –4 1 003 998Ukraine –18 739 –8 936 –5 304 –14 240 –17 138 –14 303 –31 441United King. 123 571 –14 754 133 684 118 930 –10 112 72 329 62 216
* For Portugal, an average for 2003–2005 was used as a baseline value of NM. Sources: Eurostat/NewCronos; Council of Europe (2005); Portugal: www.ine.pt; own elaboration For all migration scenarios, age and sex structures from 2004 (or latest available year) have been assumed to be constant throughout the forecast horizon. For migratory flows among the ARGO-9 countries (intra-system), eight ‘model’ age schedules have been applied. These depend on largely-defined regions of origin and destination of migrants, in all cases separately for males and females. We distinguished three such regions: Central and Eastern Europe (Czech Republic, Hungary, Poland, Romania, Slovakia and Ukraine), Southern Europe (Italy and Portugal), and the United Kingdom as a separate, one-country region. For net ‘external’ migration, country-specific age schedules have been defined in terms of percentages, summing up either to 100.0 for migration gains, or to –100.0 for loses. Such schedules have been estimated from the 2004 Eurostat data on migration by age, separately for males and females. In case no structures were available in the dataset for a given country, those from an

13
ARGO-9 country with similar migration patterns have been used instead (for Ukraine, Romanian age schedules were applied, with a minus sign). For Poland, the turn from negative to positive net migration under the “Development and Liberalization” scenario in the period 2015–2019 has been associated with a change from Polish to Romanian age schedule. The respective country-specific age schedules for external flows were calculated separately for males and females. 1.5. Assumptions on labour force participation
Assumptions on the level of economic activity (interchangeably: labour force participation) concern gross labour supply, including the unemployed and employed in any type of paid occupation, whether full-time or part-time. We expect that in the coming 50 years part-time and temporary jobs will become increasingly popular among younger people, including students, to some extent independently from the future increase of rates of enrolment in higher education. Population ageing will cause shortages of younger workers, gradually forcing more flexible employment conditions, and lead to rising retirement ages in order to prevent pension systems from bankruptcy, in both cases increasing participation rates. Assumptions on target economic activity rates for 2054, generally following the discussion in Saczuk (2004), albeit with slightly modified values, are presented in Table 4.1. For males (M), a common target has been assumed, while for females (F) the assumptions for Italy are different from those for the remaining countries under study (lower by 10 percentage points for the 20–64 years age groups, and by 5 points for the 65–74 ones, due to very low female labour participation in this country). For the United Kingdom, the target values for 15–19-year-olds has been exceptionally set at 60.0 percent, due to country-specific trends observed in the past. Additionally, Table 1.4 presents the ‘maximum activity’ (max) patterns, obtained from cross-country and cross-time (1985–2002) age-specific maxima for 27 European countries analysed in Saczuk (2004), slightly corrected downwards for groups 70–74 and 75+. Table1.4. Target age patterns of economic activity assumed for 2054 (percent of population) Pattern 15-19 20-24 25-29 30-34 35-39 40-44 45-49 50-54 55-59 60-64 65-69 70-74 75+M 30.0* 75.0 93.0 95.0 95.0 95.0 95.0 90.0 70.0 40.0 25.0 15.0 10.0M (max) 70.3 88.6 97.0 99.1 98.4 97.6 96.7 93.9 87.6 71.4 46.1 23.1 11.5
F 20.0* 65.0 80.0 85.0 85.0 85.0 85.0 75.0 60.0 40.0 25.0 15.0 5.0F (Italy) 20.0 55.0 70.0 75.0 75.0 75.0 75.0 65.0 50.0 30.0 20.0 10.0 5.0F (max) 65.6 91.0 94.5 96.4 95.9 96.5 94.9 89.9 79.0 53.4 39.5 19.8 9.9* For the United Kingdom, 60.0 percent. Source: Saczuk (2005), own computations The initial values of age-specific rates observed for 2004 are bridged with the target ones using a Hermite interpolation with the same coefficients as for fertility (see Section 1.2), in this case for the whole 50-year period. Additionally, we made an assumption of non-decreasing age-specific economic activity rates.

14
2. The futures of population and labour force in selected countries in Europe
2.1. General remarks
In recent decades European populations underwent substantial changes. The second demographic transition, a combination of changes in social and individual values with economic and social emancipation of women, has led to a considerable decrease in fertility, in many European countries to well below replacement level. Improvement of living conditions and health care allowed rising life spans and life expectancy. These two factors lead and will lead to a fall in populations and their ageing. Increasingly globalized international migration, flourishing due to decreasing legal and administrative barriers in Europe, as well as to cheap flights, became a more and more important component of population growth. In the sections below we will present how these changes might affect future populations and labour forces of these European countries, and how significantly migration moderates or accelerates them. In the previous section we outlined how, in our view, these processes will continue and develop in future, creating scenarios of change for particular components of population growth. These scenarios have been fed, together with the data on benchmark populations, to a population dynamics model, which is a convenient tool to assess the impact of these scenarios and of the interplay of changes of the components of growth on the future populations and their composition. The outcome of the exercise is the forecast of population distributed by age and sex, as well as the forecast of the number of demographic events (the assumptions are made in terms of synthetic indicators, so the model “translates” them into crude numbers). One should be also aware that forecasts rarely come true. Firstly, it is impossible to predict population changes over the long run, such as 50 years, yet 10 or 15-year forecasts have nowadays very reasonable ex-post errors. Secondly, policymakers use forecasts to modify population, social and economic policies, often leading to a substantial change of external conditions of population development. A good example of such modifications are the reforms of retirement systems sweeping across Europe. These changes occurred because population forecasters have warned for last decade or two, depending on country, that negative demographic development would jeopardize the sustainability of social security systems, unless they are modified in order to address the demographic bust. Thirdly, policy and political changes are not predictable. To give an example, the fall of communism, not dreamt of in 1985, had a profound impact on migration flows in Europe and the former USSR in the next two decades. So why make a forecast? Do they have any meaning, beyond purely academic considerations? Well, the answer is very straight: they do, as they serve as a source of valuable information for policymakers, warning what are the outcomes of predicted trends and making it possible to devise policies averting certain unwanted consequences of the predicted demographic developments.

15
Our forecast of population and labour force in nine European countries was prepared in two variants, one called “Development and Liberalization”, the other “Stagnation and Control”. In addition we run a status-quo projection and a “no migration” simulation, which are used for comparative and impact-analysis purposes. The main, most probable in our opinion, is the “Development and Liberalization” (later on DL) scenario and we will focus on the analysis of the results it generates. If we look at the trajectories of change of almost all variables, it is clear that in the first 25 years the changes are less pronounced than in the second 25 years of the forecast time. This is because of the momentum of population dynamics, the consequences of certain trends (for example of below-replacement fertility) accumulate over time and their full impact is visible only over a long perspective. However, as we are more interested in the long-term development, we will focus on the shape of the population in 2054. 2.2. Evolution of population and population age structures over time
To start with, it should be noted that under the “Development and liberalization” (DL) scenario the total population of the nine modelled countries taken together will decrease. However, the populations of particular countries will follow very different trajectories of change. The population of the United Kingdom will rise by 2054 to 115% of the 2004 level (Table 2.1). Two other countries, Italy and Portugal will also increase their populations over 50 years. For all these three countries we adopted an assumption on high net migratory inflows, especially for the former two. If one looks at the results of “no migration” simulation, it is very clear that migration is the driving force behind the population growth of all these three countries. The most dependent on immigrants is Italy, for which the gap between 2054 population under DL and “no migration” scenarios exceeds 30 percentage points. Portugal, with the difference of almost 17 percentage points, shows the lowest dependency on immigration among the three countries expected to gain population in the perspective of fifty years. The remaining 6 countries will lose population, albeit to a different degree. Ukraine, with a relatively high mortality, very low fertility and persistent negative emigration will be the country with the largest population decrease, to 57% of its original population under the DL scenario. Lack of migration would make a difference of slightly more than 6 percentage points in the final population. Another country with a substantial population decrease is Romania, which would reduce its population to 66% of original levels. Much more uniformity can be observed among Central and Eastern European populations: Czech Republic, Hungary, Poland and Slovak Republic would experience very similar reduction of original population to around 80% of the benchmark population.

16
16 Table 2.1. Population and labour force change in nine European countries according to various scenarios, 2004–2054
Variable Population (thousands) Percentage change from 2004
Scenario Base year
Development and Liberalization
Stagnation and Control No migration Development and
liberalization Stagnation and Control No migration
Year 2004 2029 2054 2029 2054 2029 2054 2029 2054 2029 2054 2029 2054 Czech Republic 10 216 9 467 8 171 9 465 8 031 9 474 7 890 92.7 80.0 92.6 78.6 92.7 77.2 Hungary 10 107 9 290 8 169 9 254 8 013 8 966 7 442 91.9 80.8 91.6 79.3 88.7 73.6 Italy 58 175 63 360 62 215 61 494 57 544 53 583 44 330 108.9 106.9 105.7 98.9 92.1 76.2 Poland 38 182 35 370 30 253 35 081 29 382 36 825 31 580 92.6 79.2 91.9 77.0 96.4 82.7 Portugal 10 502 10 992 10 518 10 801 9 976 10 054 8 798 104.7 100.1 102.9 95.0 95.7 83.8 Romania 21 685 17 620 14 342 17 661 14 054 19 582 16 023 81.3 66.1 81.4 64.8 90.3 73.9 Slovak Republic 5 382 5 055 4 344 5 094 4 354 5 241 4 493 93.9 80.7 94.6 80.9 97.4 83.5 Ukraine 47 271 36 366 27 141 36 142 26 517 38 220 30 099 76.9 57.4 76.5 56.1 80.9 63.7 United Kingdom 59 880 66 745 68 703 65 250 64 973 60 413 56 674 111.5 114.7 109.0 108.5 100.9 94.6
Variable Labour force (thousands) Percentage change
Scenario Base year
Development and Liberalization
Stagnation and Control No migration Development and
liberalization Stagnation and Control No migration
Year 2004 2029 2054 2029 2054 2029 2054 2029 2054 2029 2054 2029 2054 Czech Republic 5 170 4 516 3 475 4 517 3 384 4 534 3 287 87.3 67.2 87.4 65.4 87.7 63.6 Hungary 4 178 4 065 3 490 4 047 3 401 3 902 3 128 97.3 83.5 96.9 81.4 93.4 74.9 Italy 24 343 25 321 23 855 24 281 21 553 20 194 15 962 104.0 98.0 99.7 88.5 83.0 65.6 Poland 17 182 16 120 12 809 15 923 12 273 16 873 13 205 93.8 74.5 92.7 71.4 98.2 76.9 Portugal 5 518 5 565 4 875 5 443 4 562 4 991 3 964 100.8 88.3 98.6 82.7 90.4 71.8 Romania 9 808 8 300 6 457 8 332 6 273 9 463 7 080 84.6 65.8 85.0 64.0 96.5 72.2 Slovak Republic 2 655 2 380 1 830 2 409 1 829 2 509 1 872 89.6 68.9 90.7 68.9 94.5 70.5 Ukraine 22 553 17 983 12 190 17 829 11 813 19 129 13 623 79.7 54.1 79.1 52.4 84.8 60.4 United Kingdom 30 402 32 722 32 290 31 802 30 161 28 832 25 801 107.6 106.2 104.6 99.2 94.8 84.9
Sources: Eurostat/NewCronos; Council of Europe (2005); own elaboration

17
An alternative scenario, labelled as “Stagnation and Control” (SC), will result in an even further-going decrease of population in all analyzed countries except the Slovak Republic, for which the difference between both scenarios is very small. The realization of the SC scenario would most strongly affect Italy (the difference in the population change in both scenarios is 7.1 percentage points), the UK (6.2 percentage points) and Portugal (5.1) (Table 2.1), the first two countries with very high, and the last with relatively high, assumed migration gains. More interesting and most probably more significant than population evolution are changes in the age structures of population. There are various measures of the “age” or ageing of population, such as medium or median age, but we will use the Potential Support Ratio (PSR) showing the relation between the population aged 15 to 64 years to the population aged 65 and more. In other words, the PSR shows how many people of working age correspond to one person in the roughly-defined retirement age. This is a purely demographic measure, not taking into account the economic activity of the population. In practice nations or regions with similar PSR levels may have very different levels of economic activity. The construction of the PSR is such, that in most cases higher values (more working-age people per elderly) are “safer” for social and economic development, on the condition of a reasonably high life expectancy (the PSR may be high due to high mortality and thus low numbers of elderly). In 2004, the highest values of the PSR were observed in the Slovak Republic (6.1 people at the age 15-64 per one person at the age 65 and over), Poland (5.4) and the Czech Republic (5.1), while the lowest ones – in Portugal (4.0) and Italy (3.4) (Table 2.2). Generally, the age structures of the populations were much younger in the eastern than in the western part of the continent. Under the “Development and Liberalization” forecast scenario all the PSR values, except for the UK, drop quite uniformly to the range between 1.8 and 1.6. The relatively largest reduction of the PSR will be observed in Slovak Republic (to 27% of the original value), Poland (to 30%) and Czech Republic (to 31%), not surprising, given that now these populations are very young by European standards, while the smallest reduction, to 50%, will be observed in the UK. These changes are of fundamental significance for the social and economic futures of populations. In short, they mean that we would need to double or treble productivity to offset the impact of ageing. It is interesting to see how international migration will influence demographic ageing. Comparing the values of PSR for 2054 in the DL scenario and the “no migration” simulation (Table 2.2), we see that in all countries except Ukraine ageing, measured in terms of the PSR decrease, is higher in the “no migration” simulation. Consequently, in the long term migration will have a moderating impact on ageing, albeit this impact will not be very substantial and in most cases (except for Italy and the UK) does not exceed 10%2.
2 Importantly, it is assumed here that in a long-term perspective all ARGO-9 countries which are EU member
states will have net migration gains.

18
Another important and frequently used measure of ageing is the number of the oldest-old (here defined as people aged 80 years or more). Their number is expected to increase very significantly in the 50-year perspective. In the Slovak Republic, the expected increase will be by a factor of 3.9 (from 125 thousand in 2004 to 483 thousand in 2054), in Poland by a factor of 3.7, whereas the lowest increases will occur in Ukraine (2.2 times) and Hungary (2.6 times). Migration has here a moderately mitigating impact in the current receiving countries and accelerating in the sending ones, de facto contributing to deeper inequalities between richer and poorer regions. In the future, more oldest-old will affect the needs for elderly care and nursing personnel, already a driver for both legal and illegal labour migration. It is interesting to examine how the ageing of the society translates into the number of demographic events. All countries, except for the UK, have and will continue to have negative natural increase (the number of deaths will exceed the number of births). In all countries except the UK the number of births will drop. The largest decrease will occur in Ukraine and Romania, where in the period 2050–2054 we expect to have respectively only 43% and 47% of the number of births recorded in the period 2000–2004. This decrease is only slightly deeper than the decrease in population in these countries, and is due to older age structures than initially. In other countries the decrease will vary between 83% and 58% of the benchmark year value. In policy terms, the increase in fertility intensity should be one of main priorities of governments. There is a broad agreement among researchers that pro-natalist policies are both expensive and do not guarantee a success, though in demographic terms they are the most desirable policies under an expected regime of below-replacement fertility (Grant et al. 2004). One has to be aware that these are policies which accrue benefits only in long term, as a new-born baby enters the labour market around 18–23 years from birth. 2.3. Evolution of labour force and labour force age structures over time
The change in population and its age structure is one of the factors determining the size and structure of the labour force. Another factor is the change in labour force participation, which was assumed to increase in all countries. It should be recalled that we assumed a significant increase in the labour force participation over the next 50 years, especially in the countries characterized with low participation in 2004. Over the forecast horizon we will see a shrinking labour force in all countries considered except the United Kingdom. In all countries but Hungary, which was characterized by a very low level of economic activity in 2004, the shrinking of the labour force is will occur faster than the overall population (in the UK, the labour force is growing slower than the population). The only country in which we forecast rising overall labour supply in the “Development and Liberalization” scenario is the UK. This increase would amount to 1.9 million, reaching 32.3 million by 2054 (increase by 6%). However, if there was no migration, the labour force would

19
drop by 15%, from 30.4 million in 2004 to 25.8 million in 2054 (Table 2.1). This simple calculation shows the importance of labour migration for developments labour force in the UK. In all other countries there will be a decrease in the labour force, albeit to a different degree. Italy, with high immigration assumed, will experience in the DL scenario only a marginal decrease, however in the no-migration simulation labour force decline would be 34%. By 2054, Hungary and Portugal are likely to experience a moderate decrease in the labour force (respectively to 83.5% and 88.3% of the 2004 value), whereas Ukraine should be prepared to see a very dramatic drop to 54.1% of the initial size of its labour supply, that is to 12.2 million. Slovak Republic, Romania and Poland can be expected to reach between 66 and 69% of their original labour forces. Moreover, migration has a profound diversifying impact on the labour force changes: in the DL scenario the difference between the highest and the lowest percentages of the original 2004 labour force at the end of forecast period (2054) was 52.1 percentage points. In the “no migration” simulation the relevant value was only 24.5 percentage points (Table 2.1). The “Stagnation and Control” forecast scenario results in more numerous labour forces for net emigration countries Poland, Romania and Ukraine than under the “Development and Liberalization” assumptions, and less numerous for net immigration countries like Italy, Portugal and the UK. This is a direct consequence of lower migration flows assumed in the SC scenario. It also illustrates the direct result of migration: it shifts labour from poorer to more affluent countries, and, on the assumption of high productivity of migrants, increasing and petrifying economic and social inequality. In order to investigate the structural aspects of labour force changes we use two support ratios. The first is the Economic Support Ratio (ESR), defined as the ratio of the number of economically active people aged 15–64 years to the number of economically inactive people aged 65 years and over. This ratio tells us how many economically active people of working age support one inactive person of retirement age. The other ratio is Labour Market Support Ratio (LMSR), defined as the number of people economically active aged 15 years and over divided by the number of people economically inactive in the same age group. This indicator focuses on the ability of the economically active part of the population to support the inactive part. The LMSR is an essential indicator of the situation on the labour market. As in the case of the Potential Support Ratio (PSR), larger values are usually more desirable from the demographic, economic and policy point of views. As shown in Table 2,2, the Economic Support Ratio (ESR) varied in 2004 between 2.2 (Italy) and 4.3 (Slovak Republic). Over the 50 years of forecast under the “Development and Liberalization” scenario they will converge to values between 1.2 (Italy) and 1.9 (the United Kingdom). This convergence hides quite divergent dynamics of changes: In 2054 the ESR in the Slovak Republic will have only 32.6% of its 2004 value, and similarly reduced will be the

20
ratios for Poland and the Czech Republic. The lowest reductions in the ESR will be observed in Hungary and the United Kingdom (in both cases to 56% of initial 2004 values). Migration generally has a positive impact on the ESR – in all countries except Ukraine values of ESR forecasted for 2054 are smaller in the no-migration simulation than in the DL scenario, though differences are smaller than 10%. The only exception to this rule was Italy, for which migration increases its ESR by almost 20%. The initial values of the Labour Market Support Ratio (LMSR) in 2004 vary between 0.95 (Italy) and 1.7 (Portugal). The other country with an LMSR below 1 in 2004 is Hungary. In other words, in 2004 in these two countries there were more inactive people than active. The results of the forecast (the “Development and Liberalization” scenario) show that in all investigated countries the ratio will drop until 2054. However in some countries, like Hungary, Romania and Italy the reduction would be moderate, by no more than 20%, whereas in others, like the Slovak and Czech Republics the drop would be close to 40%. Perhaps surprisingly the absence of migration (as in the no-migration simulation) would have a limited impact on the values of the ratio. In all countries except Ukraine the simulated no-migration LMSR values are lower in 2054 than in the DL scenario. The most visible impact of migration would concern the LMSR in Italy (9.1 percentage points) and the UK (5.9).

21
21
Table 2.2 Support ratios: “Development and Liberalization”, “Stagnation and Control” scenarios, and “No migration” simulation, 2004–2054
Scenario Development and Liberalization Stagnation and control no migration Indicator PSR * ESR ** LMSR *** PSR ESR LMSR PSR ESR LMSR Year 2004 2029 2054 2004 2029 2054 2004 2029 2054 2029 2054 2029 2054 2029 2054 2029 2054 2029 2054 2029 2054
Czech Republic 5.07 2.65 1.57 3.76 2.12 1.36 1.48 1.19 0.92 2.65 1.53 2.12 1.33 1.20 0.91 2.66 1.48 2.13 1.28 1.20 0.88
Hungary 4.42 2.96 1.83 2.71 2.12 1.53 0.96 1.02 0.95 2.95 1.79 2.11 1.49 1.02 0.93 2.88 1.72 2.06 1.44 1.00 0.91
Italy 3.44 2.46 1.58 2.24 1.68 1.22 0.95 0.83 0.76 2.38 1.48 1.61 1.14 0.81 0.73 2.06 1.32 1.39 1.02 0.74 0.68
Poland 5.36 2.75 1.63 3.67 2.14 1.41 1.18 1.10 0.92 2.72 1.57 2.12 1.36 1.10 0.89 2.83 1.59 2.21 1.37 1.12 0.90
Portugal 3.99 2.69 1.65 3.82 2.63 1.68 1.65 1.40 1.12 2.65 1.58 2.58 1.61 1.38 1.09 2.47 1.49 2.41 1.53 1.32 1.05
Romania 4.76 3.19 1.83 3.65 2.64 1.67 1.17 1.18 1.03 3.19 1.75 2.64 1.61 1.18 1.00 3.49 1.66 2.89 1.53 1.23 0.98
Slovak Republic 6.14 3.01 1.66 4.32 2.31 1.41 1.48 1.18 0.91 3.05 1.65 2.34 1.40 1.20 0.90 3.16 1.63 2.44 1.38 1.23 0.89
Ukraine 4.40 3.30 1.79 3.21 2.66 1.60 1.28 1.31 1.02 3.27 1.75 2.63 1.57 1.30 1.01 3.45 1.84 2.78 1.64 1.35 1.04
United_Kingdom 4.12 2.85 2.08 3.37 2.46 1.90 1.63 1.40 1.23 2.79 1.99 2.40 1.82 1.37 1.19 2.56 1.85 2.20 1.69 1.29 1.13
* PSR: Population Support Ratio [Pop. (15–64) / Pop. (65+)]; ** ESR: Economic Support Ratio [Active (15–64) / Inactive (65+)]; *** LMSR: Labour Market Support Ratio [Active (15+) / Inactive (15+)]. Source: own elaboration

22
3. Critical assessment of results and conclusions
To summarize: the future demographic development of these 9 European countries will be unequal: some countries, with high net migration gains (Italy and the United Kingdom) will moderately increase their populations, whereas most of the countries, especially in Central and Eastern Europe, are likely to lose population, some very substantially. The countries in Central and Eastern Europe, relatively young at the outset of forecast, will undergo over time much sharper changes than the countries of Western Europe, which started such changes much earlier. A very far-going forecast of population decline in Ukraine is the combination of high emigration and high mortality, partly induced by the HIV/AIDS epidemics. This does not have to come true, as the epidemics may be quelled. Such a forecast should be treated as a warning rather than a forecast sensu stricto, provided that appropriate policies are introduced. Ageing, however, will be an universal process, covering all analyzed countries. Its speed will vary, but in all countries it will be a decisive element of coming economic and social challenges. Migration will have a moderating effect on ageing, but transfers of population from poor to rich countries will be likely to increase disparities between these countries. The description of future trends above is quite technical, focussing on numbers and indicators. Migration is a factor protecting Western European countries from much faster depopulation. This concerns the UK and Italy, but also to a lesser extend Portugal. In Central Europe emigration to the West is balanced in a long term by immigration from third countries. However, it is not the depopulation which should concern policy makers. The worrying feature of future populations is the consequences of ageing. Ageing itself is a process composed of two factors: increasing longetivity, which is an immense success of humanity, and declining fertility. Nevertheless, the speed of ageing should be a concern, as it may jeopardize the stability of social security schemes and health and care systems (Kupiszewski, Bijak, Nowok 2006). Declining labour force and changes in labour force structures should also worry policymakers. They will be more rapid in Central European than in Western European countries, partly due to initial younger age structures in the former, partly due to migration flows from Central to Western Europe. Increasingly fewer and fewer working people will have to support more and more economically inactive people. This is solely due to ageing, as the age-specific labour force activity rates were assumed to increase quite significantly over the forecast period. Migration may also have a positive effect on the relation between the economically active and economically inactive populations, but its impact is not very large, except for countries assumed to have very high economic immigration. Changes in the age composition of the population, if rapid, may result in insolvent retirement social security systems and cause intergenerational injustice linked with transformation from systems with defined benefits to systems with defined contributions (younger generations will have to cover the costs of
23
already legally binding rights to defined benefits payment of older generation and simultaneously pay into their own defined contribution schemes). Another study (Bijak, Kupiszewska, 2006) shows that the major aim of policy makers should be to increase the working lives of the population. Such task would entail increasing the retirement age, curbing early-retirement schemes, promoting legislation allowing for elasticity in employment conditions and practices and last, but not least, changing social attitudes to older workers. Neither increase in net migration nor in fertility (nor both), will be as efficient as increasing years worked before retirement, at least in the perspective of the coming four or five decades. Carefully-managed migration inflows may help alleviate short-term problems in labour markets, but will not make it possible to sustain the age structures of population. Hence, migration policies are not a panaceum for deficient labour markets, but rather a measure complementing other policies, which on the supply side should focus on increasing the labour force participation and improvement of labour force quality and education, whereas on the demand side should eliminate wherever possible the “3D” jobs (Dirty, Dangerous and Dull), replacing them with automation and robots. Obviously a big enigma, rather hard to forecast in long term, is the balance between supply and demand on the labour markets in, say, 50 years from now. We do not know what new professions will emerge (who imagined 50 years ago such jobs as, for example, web-page designers?), how far the globalization of labour markets will go and to what extend the jobs which are not transferable geographically will eventually become transferable (a good example of a progress difficult to assess is surgery, where remote operations are now growing in number). After reading this paper a reader may ask, how robust are these findings? Any population forecast depends on the adopted assumptions of the future evolution of particular components of change. A forecast of the labour force depends also on assumed changes in age-specific labour force participation rates. The key question a forecaster should ask is, what are the risks of different developments of components of change and labour force participation? The most predictable is the trajectory of life expectancy. Obviously it may rise more or less sharply, but in fact the only really debatable issue is the life expectancy adopted for Ukraine, which followed the WHO AIDS / HIV development scenario. If this scenario is false and the scope of HIV / AIDS proliferation is smaller than we assumed (that is what the Ukrainian national forecasters do), their population and labour force would be considerable higher than forecast. One may therefore say that our assumption concerns the worst-case scenario, although in the World Bank (2006) study on which the mentioned assumptions are based, it is considered as the most likely one. Changes in fertility are quite difficult to predict in a perspective longer than one generation, mainly because they to a large extent depend on social beliefs, values and norms, and are rather hard influence by policy measures. Hence, we assumed a small increase in these values,

24
but there is some serious research suggesting that declines in fertility may be a self-sustaining process (e.g., Lutz, Skirbekk and Testa 2006)3. Migration, which is very sensitive to such factors as economic development, political changes and migration policy (however limited only to recruitment policies of the receiving countries), is a less predictable factor. Who in the early 1980s would predict the fall of communism and the shaping of a new migration system in Europe, with migration flows from Central Europe to Western Europe still dominating the migration scene? In our forecasts, two assumptions, critical for our forecast, may not come true. The first one is the assumption of sustained high migration gains of the UK and Italy. The key question is, how many migrants can the receiving societies take? The conflict theory (Blalock 1967) and a recent research of Putnam (2007) suggest that too many foreigners may lead to social tensions, therefore at some stage receiving societies may wish to reduce immigration in order to prevent inter-group tensions. Another critical assumption is on transferring Central European countries from net emigration to immigration countries. We have made this assumption looking at the historical experiences of countries in Southern Europe and Ireland. Membership of the European Union is a powerful impulse for the economy and sets the economic development on a stable upward trajectory. However, a number of global threats, a detailed discussion of which is beyond the scope of this paper, may derail economic growth for some time and change the assumed migration regimes. To conclude, results of this forecast should be taken with a certain scepticism. They are not bound to come true, but they should be carefully studied by policymakers. This is because they clearly show what are the consequences of certain demographic and migration trends and give a hint which changes in population and migration policies are most important.
3 We are grateful to Steffen Angenendt for bringing to our attention this issue.

25
References
Bijak J. (2004). Fertility and mortality scenarios for 27 European countries 2002–2052.
Working Paper 3/2004. Warsaw: CEFMR. Bijak J., Kupiszewska D. (2006). Demographic and Labour Market Policy Options for the
Ageing Europe. Paper presented to the Third International Conference on Population Geographies, Liverpool, United Kingdom, 19–21 June 2006.
Bijak J., Kupiszewski M., Kicinger A. (2004). International migration scenarios for 27 European countries 2002–2052. Working Paper 4/2004. Warsaw: CEFMR.
Blalock Jr. H. M. (1967). Toward a Theory of Minority-group Relations. New York: John Wiley & Sons.
Council of Europe (2005). Demographic Yearbook: Recent Demographic Developments in Europe 2005. Strasbourg: Council of Europe.
Eurostat (2005). Population projections for the European Union 2004–2050. Luxembourg: Eurostat.
Grant J., Hoorens S., Sivadasan S., van het Loo M., DaVanzo J., Hale L., Gibson S., Butz W. (2004). Low Fertility and Population Ageing. Causes, Consequences and Policy Options. Santa Monica – Leiden – Cambridge – Berlin: RAND Corporation.
Kupiszewska D., Kupiszewski M. (2005). A revision of the traditional multiregional model to better capture international migration: The MULTIPOLES model and its applications. Working Paper 10/2005. Warsaw: CEFMR.
Kupiszewski M. (2002). Modelowanie dynamiki przemian ludności w warunkach wzrostu znaczenia migracji międzynarodowych [The role of international migration in the modelling of population dynamics]. Warsaw: Institute of Geography and Spatial Organization, Polish Academy of Sciences.
Kupiszewski M., Bijak J., Nowok B. (2006). Impact of future demographic trends in Europe. Working Paper 6/2006. Warsaw: CEFMR.
Lutz W., Skirbekk V., Testa M. R. (2006). The Low-Fertility Trap Hypothesis: Forces that May Lead to Further Postponement and Fewer Births in Europe. Vienna Yearbook of Population Research: 167–192.
Oeppen J., Vaupel J. (2002). Broken Limits to Life Expectancy. Science, 296: 1029–1031. Putnam R. D. (2007). E Pluribus Unum: Diversity and Community in the Twenty-first
Century The 2006 Johan Skytte Prize Lecture. Scandinavian Political Studies 30(2): 137–174.
Saczuk K. (2004). Labour force participation scenarios for 27 European countries 2002–2052. Working Paper 5/2004. Warsaw: CEFMR.
United Nations (2007). World Population Prospects: 2006 Revision. New York: UN Population Division.
World Bank (2006). Socioeconomic Impact of HIV / AIDS in Ukraine. Washington, DC: World Bank.


CEFMR Working Papers Series
1/2003: M. Kupiszewski , Consequences of EU enlargement for freedom of movement between Council of Europe Member States, ISBN 83-920313-0-X.
2/2003: M. Kupiszewski, D. Kupiszewska, Internal migration component in subnational population projections in Member States of the European Union, ISBN 83-920313-1-8.
3/2003: M. Kupiszewski, J. Bijak, K. Saczuk, R. Serek, Komentarz do założeń prognozy ludności na lata 2003–2030 przygotowywanej przez GUS, ISBN 83-920313-2-6.
4/2003: K. Saczuk, A development and critique of the concept of replacement migration, ISBN 83-920313-3-4.
5/2003: I. Koryś, Migration Trends in Selected EU Applicant Countries: Poland, ISBN 83-920313-4-2.
1/2004: A. Kicinger, K. Saczuk, Migration policy in the European perspective – development and future trends, ISBN 83-920313-5-0.
2/2004: A. Kicinger, International migration as a non-traditional security threat and the EU responses to this phenomenon, ISBN 83-920313-6-9.
3/2004: J. Bijak, Fertility and mortality scenarios for 27 European countries, 2002–2052, ISBN 83-920313-7-7.
4/2004: J. Bijak, M. Kupiszewski, A. Kicinger, International migration scenarios for 27 European countries, 2002–2052, ISBN 83-920313-8-5.
5/2004: K. Saczuk, Labour force participation scenarios for 27 European countries, 2002–2052, with Annex, ISBN 83-920313-9-3.
1/2005: J. Bijak, D. Kupiszewska, M. Kupiszewski, K. Saczuk, Impact of international migration on population dynamics and labour force resources in Europe, with Annex, ISBN 83-921915-0-1.
2/2005: A. Kicinger, Unia Europejska wobec zagadnienia integracji imigrantów, ISBN 83-921915-1-X.
3/2005: I. Koryś, Dimensions of Integration: Migrant Youth in Poland, ISBN 83-921915-2-8.
4/2005: A. Kicinger, Polityka emigracyjna II Rzeczpospolitej, ISBN 83-921915-3-6.
5/2005: B. Nowok, D. Kupiszewska, Official European statistics on international migration flows: availability, sources and coverage, ISBN 83-921915-4-4.
6/2005: J. Bijak, Bayesian methods in international migration forecasting, ISBN 83-921915-5-2.
7/2005: D. Kupiszewska, B. Nowok, Comparability of statistics on international migration flows in the European Union, ISBN 83-921915-6-0.
8/2005: B. Nowok, Evolution of international migration statistics in selected Central European countries, ISBN 83-921915-7-9.
9/2005: A. Kicinger, Between Polish interests and the EU influence – Polish migration policy development 1989–2004, ISBN 83-921915-8-7.
10/2005: D. Kupiszewska, M. Kupiszewski, A revision of a traditional multiregional model to better capture international migration: The MULTIPOLES model and its applications, ISBN 83-921915-9-5.
1/2006: M. Kupiszewski, J. Bijak, Ocena prognozy ludności GUS 2003 z punktu widzenia aglomeracji warszawskiej, ISBN 83-60462-00-3.
2/2006: M. Mazur-Rafał, Zmiana paradygmatu w niemieckiej polityce imigracyjnej w latach 1998–2004? Wnioski dla Polski, ISBN 83-60462-01-1.
3/2006: J. Bijak, I. Koryś, Statistics or reality? International migration in Poland, ISBN 83-60462-02-X.

4/2006: J. Bijak, Forecasting international migration: Selected theories, models, and methods, ISBN 83-60462-03-8
5/2006: I. Koryś, Między instrumentalnym a symbolicznym wymiarem posiadania drugiego obywatel-stwa, ISBN 83-60462-04-6
6/2006: M. Kupiszewski, J. Bijak, B. Nowok, Impact of future demographic trends in Europe, ISBN 83-60462-05-4
1/2007: A. Kicinger, A. Weinar (eds.), State of the Art of the Migration Research in Poland, ISBN 978-83-60462-06-5
2/2007: J. Bijak, A. Kicinger, M. Kupiszewski, współpraca P. Śleszyński, Studium metodologiczne oszacowania rzeczywistej liczby ludności Warszawy, ISBN 978-83-60462-07-2
3/2007: M. Kupiszewski (ed.), Demographic developments, labour markets and international migration in Poland – policy challenges, ISBN 978-83-60462-08-9
4/2007: J. Bijak, M. Kupiszewski, Population and labour force forecast for nine European countries: assumptions and results, ISBN 978-83-60462-09-6
All CEFMR Working Papers are available at: «www.cefmr.pan.pl»


ISSN 1732-0631 ISBN 978-83-60462-09-6
Printed in Poland