population and social security in brazil: an … · 8213, that these changes were fully...
TRANSCRIPT

112
POPULATION AND SOCIAL SECURITY IN BRAZIL: AN ANALYSIS WITH EMPHASIS ON CONSTITUTIONAL CHANGES
Kaizô Iwakami BeltrãoSonoe Sugahara PinheiroFrancisco Eduardo Barreto de Oliveira
Originally published by Ipea in March 2002 as number 862 of the series Texto para Discussão.

DISCUSSION PAPER
112B r a s í l i a , J a n u a r y 2 0 1 5
Originally published by Ipea in March 2002 as number 862 of the series Texto para Discussão.
POPULATION AND SOCIAL SECURITY IN BRAZIL: AN ANALYSIS WITH EMPHASIS ON CONSTITUTIONAL CHANGES
Kaizô Iwakami Beltrão1 Sonoe Sugahara Pinheiro2 Francisco Eduardo Barreto de Oliveira3
1. From Ence/IBGE – National School of Statistics – National Institute of Geography and Statistics - Brazil.2. From UFRJ – National University of Rio de Janeiro - Brazil.3. From Ipea – Institute of Applied Economic and Social Research - Brazil.

DISCUSSION PAPER
A publication to disseminate the findings of research
directly or indirectly conducted by the Institute for
Applied Economic Research (Ipea). Due to their
relevance, they provide information to specialists and
encourage contributions.
© Institute for Applied Economic Research – ipea 2015
Discussion paper / Institute for Applied Economic
Research.- Brasília : Rio de Janeiro : Ipea, 1990-
ISSN 1415-4765
1. Brazil. 2. Economic Aspects. 3. Social Aspects.
I. Institute for Applied Economic Research.
CDD 330.908
The authors are exclusively and entirely responsible for the
opinions expressed in this volume. These do not necessarily
reflect the views of the Institute for Applied Economic
Research or of the Secretariat of Strategic Affairs of the
Presidency of the Republic.
Reproduction of this text and the data it contains is
allowed as long as the source is cited. Reproductions for
commercial purposes are prohibited.
Federal Government of Brazil
Secretariat of Strategic Affairs of the Presidency of the Republic Minister Roberto Mangabeira Unger
A public foundation affiliated to the Secretariat of Strategic Affairs of the Presidency of the Republic, Ipea provides technical and institutional support to government actions – enabling the formulation of numerous public policies and programs for Brazilian development – and makes research and studies conducted by its staff available to society.
PresidentSergei Suarez Dillon Soares
Director of Institutional DevelopmentLuiz Cezar Loureiro de Azeredo
Director of Studies and Policies of the State,Institutions and DemocracyDaniel Ricardo de Castro Cerqueira
Director of Macroeconomic Studies and PoliciesCláudio Hamilton Matos dos Santos
Director of Regional, Urban and EnvironmentalStudies and PoliciesRogério Boueri Miranda
Director of Sectoral Studies and Policies,Innovation, Regulation and InfrastructureFernanda De Negri
Director of Social Studies and Policies, DeputyCarlos Henrique Leite Corseuil
Director of International Studies, Political and Economic RelationsRenato Coelho Baumann das Neves
Chief of StaffRuy Silva Pessoa
Chief Press and Communications OfficerJoão Cláudio Garcia Rodrigues Lima
URL: http://www.ipea.gov.brOmbudsman: http://www.ipea.gov.br/ouvidoria

SUMMARY
RESUMO
ABSTRACT
1 - INTRODUCTION ...................................................................................................... 1
2 - SPACIAL DISTRIBUTION OF THE BRAZILIAN POPULATION ....................................... 1
3 - EVOLUTION OF BRAZILIAN SOCIAL SECURITY LEGISLATION.................................... 2
4 - EVOLUTION OF RURAL POPULATION: ACTIVE ANDBENEFICIARIES ....................................................................................................... 6
5 - EVOLUTION OF URBAN POPULATION: ACTIVE AND BENEFICIARIES ...................... 12
6 - PARTICIPATION OF THE ELDERLY IN RURAL FAMILIES CLASSIFIED BY PERCAPITA FAMILY INCOME ...................................................................................... 16
7 - PARTICIPATION OF THE ELDERLY IN URBAN FAMILIES CLASSIFIED BY PERCAPITA FAMILY INCOME ...................................................................................... 18
8 - PARTICIPATION OF INCOME FROM THE ELDERLY IN RURAL FAMILY INCOME....... 19
9 - PARTICIPATION OF INCOME FROM THE ELDERLY IN URBAN FAMILY INCOME...... 22
10 - PER CAPITA RURAL FAMILY INCOME WITH AND WITHOUT THE ELDERLY ........... 24
11 - PER CAPITA URBAN FAMILY INCOME WITH AND WITHOUT THE ELDERLY .......... 29
12 - COMMENTS AND CONCLUSIONS........................................................................ 32
BIBLIOGRAPHY .......................................................................................................... 35
RESUMO
Este texto compara a situação da população brasileira desagregada por condição dedomicílio (urbano/rural) em dois instantes do tempo, 1988 e 1998, vis-à-vis aprevidência e a assistência social, utilizando informações das PNADs. Principia comuma visão panorâmica da evolução do sistema de seguridade social brasileiro, comênfase na previdência social, concentrando-se nas mudanças mais recentes. Ainda quea Constituição de 1988 tenha modificado as regras de elegibilidade e o valor dosbenefícios tanto para a população urbana quanto rural, foi somente com a Lei 8.213,de julho de 1991, que essas mudanças foram inteiramente implementadas. Sãocomparadas, por sexo e idade individual, as taxas de atividade e de recebimento debenefícios antes e depois da mudança de legislação para a população urbana e a rural.Na população urbana considera-se a formalização da relação de trabalho. Comparam-se também, as estruturas familiares, a participação da renda dos idosos na renda dafamília e a sua relevância no orçamento familiar.

ABSTRACT
This paper analyses the situation of the Brazilian population disaggregated byurban/rural condition with respect to Social Insurance and Social Assistance withemphasis on recent changes. It starts with a historical overview of the system, butconcentrates on new provisions mandated by the 1988 Constitution. The 1988Constitution defined new rules with regard to eligibility conditions and benefit valuesfor both the rural and urban population. But it was only in July 1991, with Law8213, that these changes were fully implemented. We compare, by sex and individualage, activity rates and probability of receiving benefits, before and after the changes inlegislation for the urban and rural population. For the urban population we take intoconsideration the formalization of work ties. We compare, also in two instances intime, family structure and the importance of the income of the elderly in the familybudget.

1
1 - INTRODUCTIONBrazilian legislation dealing with Social Security rights has undergone lengthy andsinuous evolutionary steps both forwards and backwards. With a total of 20 millionbeneficiaries receiving benefits (as of December 2000), expansion of coverage hasrepresented a major achievement with respect to universalizing the system, reductionof inequality and eradication of absolute poverty in Brazil (mainly in rural areas,nowadays with 7 million pensioners). On the other hand, the 1988 Constitutionsoftened rules for eligibility to benefits, as well as doubling the value of minimumSocial Security and Social Assistance benefits. This paper is aimed at making acomparative analysis of the situation of the Brazilian population, disaggregated byurban and rural condition, with regard to Social Security in two moments in time: in1988, i.e., under the rules prior to the enactment of new constitutional directives;and ten years later, in 1998, when these had been fully deployed. Our aim, therefore,is to address the following questions:
• Has Social Security coverage improved?
• Have the new directives of the 1988 Constitution allowed for a reduction inpoverty and in inequality among either the urban or the rural population?
• Has there been gender differentiation in the Social Security System?
Section 2 briefly discusses the evolution of the Brazilian population,disaggregated by urban and rural condition; Section 3 presents a historical overviewof the Brazilian Social Security Legislation. Sections 4 to 11 compare the situation ofthe population with regard to work and Social Security benefits from different pointsof view in two moments in time: 1988 and 1998, i.e., before and after thedeployment of the Constitutional changes of 1988, first for the rural population andthen for their urban counterpart. Finally, in Section 12, we have conclusions andcomments.
2 - SPACIAL DISTRIBUTION OF THE BRAZILIAN POPULATIONThe Brazilian population that was mostly rural in the 40’s (see Graph 1) is primarilyurban today. The degree of urbanization followed a logistic curve with values close to30% in 1940 (date of first Census with information on rural/urban condition ofhouseholds) crossing the 80% mark in the year 2000 (the last available Censuscount). The rural1 population in spite of the high emigration rate to urban areasmanaged to keep up a positive rate of increase until 1970; from then on the ruralpopulation count declined in absolute values by an annual rate of approximately0.84%.
1 We have adopted here the IBGE – Instituto Brasileiro de Geografia e Estatística (Brazilian Central Statistical Office)definition for household condition: “According to the location of the household, the situation can be classified as urbanor rural according to municipal Laws currently in effect. In the Urban category are classified urbanized and non-urbanizedareas corresponding to cities (municipal seats), to villages (districts) or to isolated urban areas. The Rural categoryencompasses all areas located outside of these limits, including rural clusters of urban extensions, villages and hamlets.”This definition overestimates the urban population and, conversely, underestimates the rural population.

2
GRAPH 1
Percentage of Urban Population in Total Population (Degree ofUrbanization): BRAZIL — 1940/2000
0%
10%
20%
30%
40%
50%
60%
70%
80%
90%
100%
1930 1940 1950 1960 1970 1980 1990 2000 2010
Source: IBGE, Census 1940, 1950, 1960, 1970, 1980, 1991, 1996 and 2000.
The indicators of spatial distribution of the Brazilian Population show anincrease in the concentration of population in urban areas and in big cities.Approximately 81.2% of the Brazilian population were living in urban areas in 2000and these were heavily concentrated along the coast. The percentage of thepopulation living in cities with more than 20 thousand inhabitants rose from 16% in1940 to 80% in 2000. Around 17% of the Brazilian population were living, in theyear 2000, in just two metropolitan areas: São Paulo and Rio de Janeiro.
Even considering the relatively modest position of the rural population inBrazil, vis-à-vis the urban population, it is worth noting that given the country’scontinental dimensions, we are talking about a contingent of 31.8 millioninhabitants (by September 2000). The entire Brazilian population totaled 170million inhabitants on the same date.
3 - EVOLUTION OF BRAZILIAN SOCIAL SECURITYLEGISLATION
As in most Latin American countries, the first initiatives with regard to socialinsurance were aimed at covering special groups such as the military and civil publicservants. It was not, though, until 1923 that the first law was passed granting someprivate sector workers (railroad workers) pensions and health benefits. During mostof the following decade the system evolved as a very fragmented, company-based,low-coverage set of isolated programs, operating under a full capitalization regime.
During the 30’s and 40’s these isolated programs were consolidated into sector-wide systems. For example, bank employees had their own “Institute”, as well as theemployees of the industrial sector, transportation sector, federal-level public servantsand so on. It should be noted that this movement roughly coincides with the first
3
efforts to industrialize the nation. It also coincides with the emergence of the labormovement in Brazil, although most of the unions were under severe State control.All the Institutes originally operated under a full capitalization regime with atripartite costing scheme (employer, employee and State). Very soon it became clearthat the state would never be able to fulfill its commitment; in addition, reserveswere often mismanaged. As a result, by the 60’s the whole system shifted to a purelypay-as-you-go defined benefit scheme.
Only in 1964, after 14 years of debate in Congress, was a Social SecurityOrganic Law approved, unifying benefit and costing schemes among the variousInstitutes. Two years later, a National Social Security Institute (INPS) was created,replacing the old Institutes and incorporating their revenues and expenditures, aswell as the assets and liabilities. At that time, most urban workers, includingemployers and the self-employed were theoretically covered by the system. Inpractice, coverage was below 50% for the salaried population, and no more than10% for the employed and the self-employed.
Contributions were set at 8% for both employer and employee, with amaximum contributory salary equivalent to ten minimum wages.2 The FederalGovernment would transfer revenues from general taxes in order to coveradministrative costs and eventual deficits.
Retirement benefits were granted according to the following general rules:
a) By age: 65 for males and 60 for females, provided they had been contributingto the system for at least five years;
b) By length of service:3 35 years for males and 30 years for females, with no agelimits, for the full benefit.4 Proportional retirement could be obtained with five yearsless of work.
c) By special conditions, depending on the nature of the job. Divers,underground miners and other hazardous, unhealthy and arduous professions couldretire with as few as 15 years of service.
d) By disability, at any age. If the cause of the disability was work-related5 therewas a workmen’s compensation program.
Other short duration benefits were also included in the law such as sicknessallowance, accident allowance, family allowance and maternity leave. Most of thebenefits had a 95% theoretical replacement rate up to a ceiling that was equivalent toroughly ten minimum wages. In practice, replacement rates were lower and variedalong time, as the benefit formula did not correct the last 12 contribution salaries forinflation. Workmen’s compensation benefits were based on the last salary previous to
2 Actually, the law established a fixed nominal value. As a result, numerous adjustments by decree were needed tocompensate for the erosion due to inflation..3 Also known as “seniority benefits”.4 Teachers could retire with full benefits five years earlier.5 Later, even accidents occurring on the way to or from the workplace were included.
4
the accident date and would give 100% replacement, subject to the ceiling.Maternity leave would guarantee the full salary up to three months from child birth.6
Other lump sum benefits were also added such as:
a) Funeral allowance; and
b) Child delivery allowance.
As for unemployment, the country used to have provisions in its labor lawsguaranteeing a worker on-the-job stability after ten years of continuous service. Ofcourse, the provision backfired, as most workers would be fired just prior to thecompletion of the required period. In the 60’s, integrating a set of comprehensivereforms, this system was abolished. In its place a compulsory contribution of 8% ofthe workers’ salary7 to be credited by his employer in an individual capitalizedaccount — FGTS — in the National Housing Bank (BNH) was created. Thesecontributions would earn a 3% real interest rate per year,8 on top of a full inflationcorrection of the capitalized asset. In case of involuntary dismissal the worker coulddraw from this account (lump sum); he/she could also draw from it to buy or buildhis/her house and, in case of death, it was considered as a bequest to his/herdescendants. Since the closing of BNH in the late 80’s, the Federal Savings Bank —Caixa Econômica Federal (CEF) administers the program.
Later on, in 1990, another unemployment insurance scheme was implemented,since most workers were unable to accumulate substantial amounts in their accounts.As a matter of fact, high turnover workers — those who by definition need thebenefit the most — were the ones that were unable to accumulate any sizeableamount in their accounts. Considering this fact, the new program would provide anemployment benefit of 50% of average covered earnings during the last three monthsprior to dismissal with a ceiling of three minimum wages payable for at most fourmonths.9 The program is administered by the Ministry of Labor.
Despite various attempts, in the 60´s, to include the rural population in theprogram, it was only in 1974 that an effective coverage was achieved. A flat benefit ofhalf a minimum wage was granted to rural workers at the age of 65 or to the disabledat any age, without any waiting period. Medical assistance was also supplied, mostlythrough contracts with private and philanthropic hospitals. The cost of the programwas financed by a special contribution of 2.4% levied on the urban wage bill, plus acontribution of 2.5% levied on the first commercialization of rural products. Aspecific institution — Funrural — was created to manage the new program.
Also in 1974, a Social Insurance and Social Assistance Ministry was created, as adismemberment of the previous Ministry of Labor.
During the 70’s, social assistance cash benefits (also half a minimum wage) werealso created to cover both the urban and rural non-insured 70-year-olds and older,and the disabled with no other sources of income.
6 It was later modified so as to allow the woman to choose the period in which to use the three months’ paid leave.7 No ceiling.8 For a while 4%, 5% and 6% depending on how long the job duration had been.9 With a 60-day waiting period.

5
From 1978 to 1990 the institutional setup was of functional specialization, withthe previous institutions ( INPS and Funrural) rearranged as follows:
• The new INPS, to take care of benefit payments and professionalrehabilitation for both the urban and rural insured, as well as paying social assistancecash benefits.
• Inamps, to take care of health services (mostly curative) for the urban andrural insured.
• Iapas, basically to collect contributions and manage assets.
• LBA, Funabem and Dataprev, respectively, to provide social assistance servicefor the needy, social assistance service for the abandoned and/or juvenile delinquentsand a supporting data processing agency.
The next step towards universalization was taken through the 1988Constitution that reflected increasing social concerns after almost 20 years of militaryrule. As a defense against eventual violation of rights, a large number of socialinsurance provisions regarding what was now called “Regime Geral de PrevidênciaSocial” — RGPS were embedded in the Constitution itself.
In general, the new basic provisions were:
a) introduction of the Social Security concept, as an integrated set of socialinsurance, health and social assistance;
b) creation of a unified Social Security budget, financed by contributions leviedon salaries, gross business revenues, business profits, lotteries and by transfers ofgeneral tax revenues;
c) health as a universal citizenship right;
d) doubling of all social assistance and rural benefit values;
e) reduction of five years in age limits for rural benefits;
f) recalculation of all benefit values so as to recompose their original value;10
g) full inflation indexing of all contribution salaries used in the benefitcalculation formulas at the time of concession;
h) full inflation indexing of all benefit values so as to preserve their “real value”;
i) values of the minimum social insurance and social assistance benefits equaledto the minimum wage; and
j) universalization of the benefit for the entire rural population. Men andwomen were both given equal access.
As can be seen, these were very generous provisions, based on social justicevalues. Unfortunately, they turned out to be very costly over time.
Nevertheless, it was only with the advent of Law 8213 dated July 24, 1991 thatthese modifications became totally binding. The law that “deals with Social Security
10 Benefit values have been severely eroded by inflation. The new provision mandated a recalculation of their value basedon the number of minimum wages at the date of the concession.
6
and Benefit Plans and other provisions,” guarantees retirement eligibility by old agein article 48: “… reducing these limits to 60 and 55 years of age for rural workers,respectively, for men and women …”. Establishing the benefit value in the currentlegislation equal to that of the minimum wage was deemed unnecessary. Even so thisright was reiterated in article 33 of Law 8213 and the value was immediately put inpractice.
Aside from another institutional reform in 1990, when all the health activitieswere transferred to the Ministry of Health and a single social insurance institutionwas created - INSS, no real major changes occurred until 1995.11 To try to containthe increasing deficit, the Government proposed a Constitutional Amendmentregarding Social Security. It was voted only in December 1998 and had noimmediate effect, except to eliminate proportional retirement for length of service fornew entrants in the labor force, to define a minimum age for retirement for civilservants and to open the way for new benefit formulae. Later, a Law nicknamedFator Previdenciário (Social insurance factor) defining a complicated formula tocalculate pensions for length of service retirement was promulgated.12 The formulaincluded a list of actuarial variables such as life expectancy, years of work, age and soon, but had no actuarial theory backing it. The government had expected people topostpone retirement due to the smaller pension. Effects of this ConstitutionalAmendment and of the new law have not been made visible so far and will not beanalyzed in this text.
4 - EVOLUTION OF RURAL POPULATION: ACTIVE ANDBENEFICIARIES
Graph 2 shows the evolution of selected segments of the total rural population,namely, the economically active population (EAP) and beneficiaries (socialsecurity and social welfare recipients), for the period 1970/2000. Despite thesystematic drop in total rural population (9.2 million between 1970 and 2000), theEAP remained quite stable (a drop of 0.9 million for the same period — 0.25%decrease per annum), a consequence of an older population profile. In tandem,there is vigorous initial growth of the inactive segment vis-à-vis the activeworkforce. The rising numbers of beneficiaries in the rural social security segmentare also in great evidence, the result of lower age for eligibility established in the1988 Constitution (considering as well the four-year delay in promulgation ofcomplementary laws).
11 Beginning of President Fernando Henrique Cardoso’s first term. Later on, new Constitutional amendments were votedand new complemenay laws based on these amendments were established. It is way too soon to perceive the effect ofthese changes in the population.12 With a transition period to be implemented and a pro-rata value between the old formula and the new one during thetransition.

7
GRAPH 2
Total Rural Population, Economically Active and Beneficiaries: Brazil — 1970/2000
0
5
10
15
20
25
30
35
40
45
1965 1970 1975 1980 1985 1990 1995 2000 2005
in m
illio
ns
POPULATION EAP BENEFICIARIES
Source: IBGE, Census 1940, 1950, 1960, 1970, 1980, 1991, 1996 and 2000.
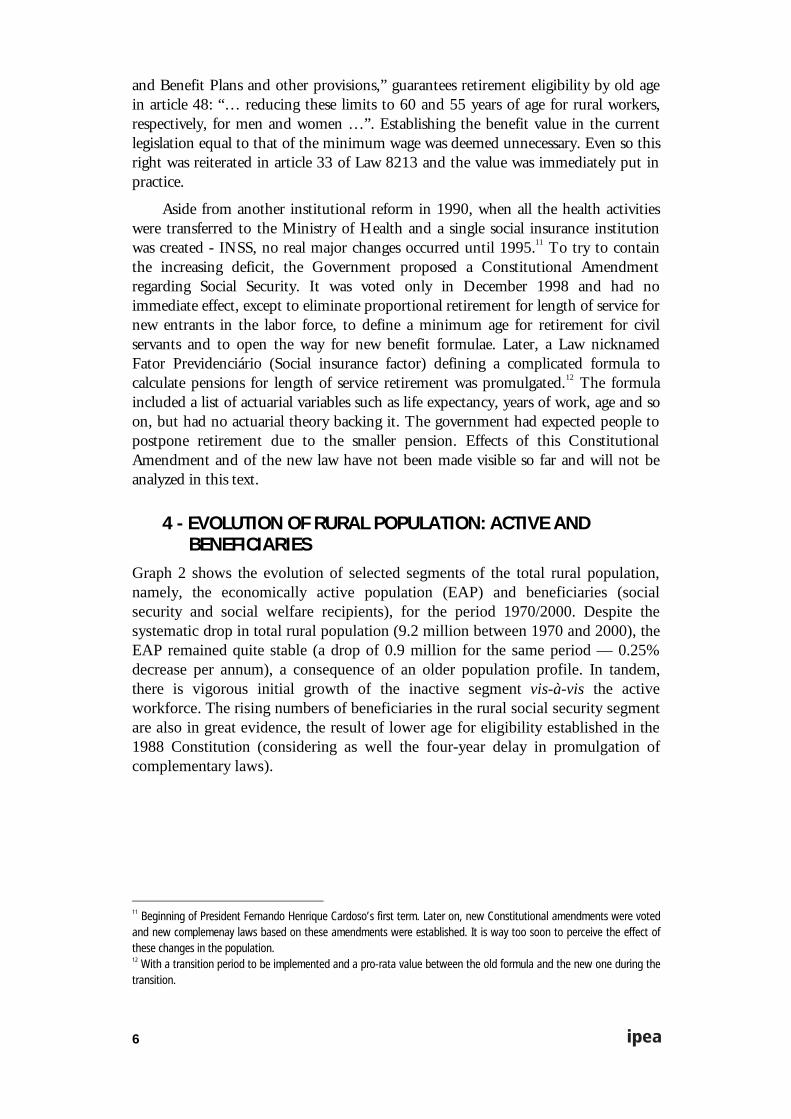
Graphs 3 and 4 present the ten-year-and-over rural population distributedaccording to age, sex and condition of benefit/activity, respectively, for 1988 (theyear the new Constitution was promulgated) and 1998 (ten years later and after allthe Constitutional provisions had already been implemented). It is worthwhilenoting that these figures were extracted from a sample survey, the NationalHousehold Survey — Pesquisa Nacional por Amostra de Domicílios (PNAD) —collected by IBGE and are, therefore, based on the same definition for “rural” as theone given by that agency,13 as Social Security records for the population of ruralpensioners do not allow tallying by sex. Consequently, not all those who receivebenefits from rural social security are included herein nor are all those tabulated asreceiving benefits necessarily rural workers. Furthermore, it does not include ruralareas in the Northern Region (excepting the State of Tocantins). We have opted fordisaggregating data as “workers actively working at least 40 hours a week,” “workersactively working less than 40 hours a week,” “beneficiaries still in activity,” “retirees,”“survivors benefit beneficiaries” and “inactive individuals with no income.”14
13 As previously noted, IBGE adopts the administrative definition of areas considered urban and rural for the municipallevel. On principle, all municipal, district and village seats are considered urban and so are their population. The conceptof rural workforce used here is not the usual definition of labor force working on agriculture, cattle handling and fisheryactivities, but of workforce living in rural areas. It does not include the “bóias-frias”, urban dwellers working in ruralactivities.14 “Workers actively working at least 40 hours a week” were defined as those who had worked 40 hours or more on theweek of the survey and who received no pensions; conversely, “workers actively working less than 40 hours a week”were defined as those who had worked less than 40 hours on the week of the survey and who received no pensions aswell; the “beneficiaries still in activity” were defined as those who had monthly income from their main occupation andwho also collected pensions; the “inactive individuals with no income” were defined as those who did not work and hadnil monthly income from all possible sources.
8
GRAPH 3
Ten-Year-Old-and-Over Rural Population Distributed According to Age, Sex andCondition of Benefit/Activity: Brazil — 1988
100% 80% 60% 40% 20% 0% 20% 40% 60% 80% 100%
10
20
30
40
50
60
70
80
90A
ge
EAP>=40 hrs EAP<40 hrs EAP&BENEF. RETIREES SURVIVORS BENEFIT RETIR.&SURVIVORS' NO INCOME
females males
Source: PNAD 1988.
At first glance one is to a certain extent surprised at the high incidence of maleindividuals who claimed to keep on working in spite of collecting a pension, eventhose at later stages of life both in 1988 and in 1998. For instance in 1988approximately 44% of men at the age of 70 continued to be active, though on socialsecurity benefits. Although the value of benefits increased, doubled based on thenumber of minimum wages,15 the same pattern is evident in 1998. This fact may beviewed as a social bias, since society in general associates a positive value to the“vigorous” elderly who, despite their years, continue to work.
The age distribution for the rural female working population in 1988 is bimodalboth for the ones declaring to work 40 or more hours a week and for those workingless than that. This is typical in societies where women quit work during thereproductive period and resume work after the children are of school age. The samepattern is not noticeable in 1998: the age distribution for the female workforcewidens, increases, and the double peaks are barely visible among women working 40or more hours a week. For the total female workforce the shape is very similar to thedistribution for the male workforce, only on a lower level. In both years considered,the male workforce presents a bell-shaped curve with a retraction in size for thesecond date.
15 The fact remains that using the number of minimum wages as the measurement referential is really inadequate for thepurpose of making a deeper assessment. It would be necessary to establish a scale that could reflect the purchasingpower of pensioners at both moments in time under consideration. This is, unfortunately, outside of the scope of thiswork. The actual value, corrected by INPC, was used as proxy (see Table 2 in Section 8).
9
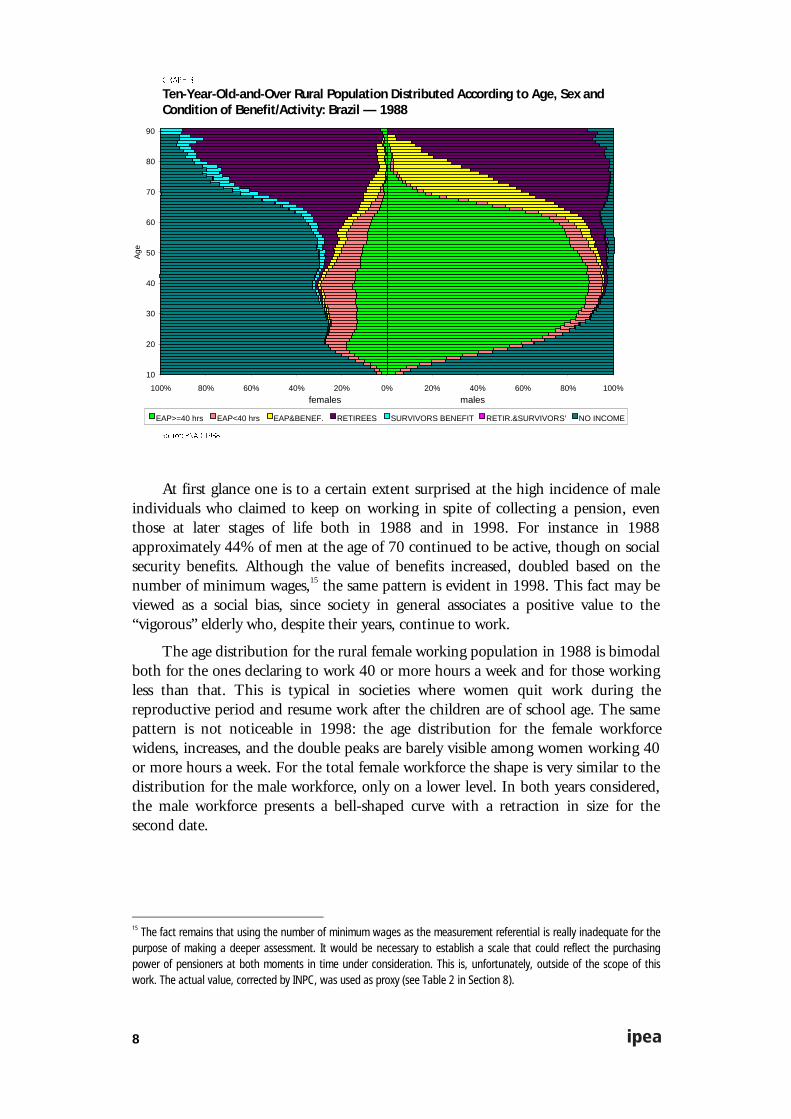
GRAPH 4
Ten-Year-Old-and-Over Rural Population Distributed According to Age, Sex andCondition of Benefit/Activity: Brazil — 1998
100% 80% 60% 40% 20% 0% 20% 40% 60% 80% 100%
10
20
30
40
50
60
70
80
90A
ge
EAP>=40 hrs EAP<40 hrs EAP&BENEF. RETIREES SURVIVORS' BENEF. RETIR.&SURVIVORS' NO INCOME
females males
Source: PNAD 1998.
There is a problem in Brazil with regard to measuring female activity mainly inthe countryside, though the problem occurs in the city as well. This is because thework of women is not valued as highly as that of men and is thus not accuratelyreported during interviews. Besides, more often, a woman’s work is restricted to theregion around the house, there included the plot of land used for subsistence and it isnot associated with economic activity. The activity rates presented by women onboth occasions are consistently below 40% for all ages for the two years under study.However, the beneficiary incidence rate is quite high, even back in 1988 whenlegislation included only the head of household, probably denoting a “leakage” fromthe categories of “recipients of social welfare” and “survivor beneficiaries” to“retirees.” Note, too, the rising rates as of 60 years of age (in this case it is probablyrelated to urban benefits or disability retirement, as the age for eligibility was 65),affecting roughly 80% of those around 80 years of age.
Since the new legislation went into effect before 1998, data for this calendaryear shows a clear retraction in the number of the non-beneficiary EAP (see Graph4). On the other hand, there was an expansion in beneficiaries and — especially inthe case of men — of beneficiaries still in activity. The new incidence rateconfiguration for retirement benefits among the female population also became quitevisible. Unlike what happened in 1988, when rates had been rising slowly since 60years of age, we have in 1998 rapid growth as of 55 years of age, affecting the same80% incidence rate later on at 60 years of age. There is growth in incidence rate, too,among older women, with respect to survivors’ benefits.
Comparing activity rates for men and women in 1988 (see Graph 5) we findever greater ratios according to age, ranging from twice as great for the 15 to 20 agebracket to six or seven times at more advanced ages. In other words, as previously

10
mentioned, the rural workforce is male to the extreme. However, the same does nothold true for benefits. The graph of the ratio of user rates of benefits between menand women is roughly S-shaped: at early ages (under 20) incidence is greater amongmen (not shown in the graph), perhaps due to disability retirement. From then on,female incidence is ever greater (due to the concession of survivors’ benefits), untilthe ratio hits a low mark at around the age of 26, at which point it begins to increaseagain. From age 63 on, the greater incidence of benefits goes once again to men (dueto legislation that restricted the benefit to the heads of household) and reaches arelative maximum at age 70, with the male/female ratio decreasing from this age on.
GRAPH 5
Ratio of Activity Rates and Receipt of Benefits between Sexes: Rural Brazil1988 and 1998 — Males/Females (Log Scale)
0,1
1,0
10,0
20 30 40 50 60 70 80
Mal
e R
ate/
Fem
ale
Rat
e
EAP 1988 PENSIONERS 1988 EAP 1998 PENSIONERS 1998
Source: PNAD 1988; PNAD 1998.
These observations can lead to certain interesting conclusions about theinterrelationship between work and the rural Social Security system in Brazil. Notethat at first one might suppose that the distribution of benefits between men andwomen would reflect that of the EAP. As was shown, this was not the case: there isutter male dominance in the labor market, whereas, on the side of benefits, there ismuch larger participation of women. This means that rural women, though notdeclared workers, somehow or other manage to claim and obtain social securitybenefits.
The ratio of male and female activity rates in 1998 (see Graph 5) are quitesimilar to those observed in 1988 in most active age brackets; the really greatdifferences are found in the population over 70. In other words, the sex ratio in theworkforce remained practically unaltered during the period under study. There are,however, considerable changes in the ratio of male and female beneficiaries: there aretwo minima and both occur at more advanced ages (30 and 56 years of age in 1998as compared to 26 years of age in 1988) but as of 65 years of age the values growcloser together and the ratio is closer to one. Whatever the case may be, the

11
conclusion remains the same: despite slight (declared) participation in the workforce,women have high participation with regard to rural Social Security benefits.
In order to appreciate the change that occurred during this ten-year period,Graph 6 presents the ratio of 1998 and 1988 activity rates and receipt of benefits foreach sex for the rural population. The later entry of rural workers (both males andfemales) into the labor market is clearly visible from a comparative analysis of activityrates and usufruct of benefits in 1998 and 1988, as seen by ratios less than one formales of all working ages (it does go above one for ages above 77) and for women upto 22. It also shows a change in the labor market. Males are showing a lower activityrate and females, between 22 and 50 years of age, a higher activity rate. On the otherhand, in the case of benefits, ratios are above one for almost all ages for both menand women (the exceptions are women above 87 years of age). In other words, thereare a greater proportion of retirees in 1998 than in 1988 for each age bracketconsidered. Though it is difficult to isolate the effects of new constitutionalprovisions on rural social security and assistance in order to prove them the sole causeof change, it is very likely that they have in fact played a major role. By reducingeligibility age for retirement, these provisions seem to have provoked a boom in theproportional share of pensioners. For instance, at 60 years of age, the proportion ofretired women in the rural area is, in 1998, roughly three times that in 1988; formen, the ratio between the proportions of retirees in the same age bracket isapproximately 2.3.
GRAPH 6
Ratio of Activity Rates and Receipt of Benefits between 1998 and 1988 for eachSex — Brazil
0
1
2
3
4
20 30 40 50 60 70 80
Age
1998
Rat
e/19
88 R
ate
male EAP female EAP male PENSIONERS female PENSIONERS
Source: PNAD 1988; PNAD 1998.

12
5 - EVOLUTION OF URBAN POPULATION: ACTIVE ANDBENEFICIARIES
Graph 7 shows the evolution of the total urban population, for the same segmentsand instances in time of the ones used for the rural population in Graph 2. Despitethe systematic increase in total urban population (85.7 million between 1970 and2000), the EAP did not maintain the same growth rate, a consequence of an olderpopulation profile and a later entry age in the labor market of the young population.The rising numbers of beneficiaries in the urban social security segment are alsosomething to worry about, a result of weak eligibility conditions for retirement.16
GRAPH 7
Total Urban Population, Economically Active and Beneficiaries: Brazil — 1970/2000
0
20
40
60
80
100
120
140
160
1965 1970 1975 1980 1985 1990 1995 2000 2005
in m
illio
ns
POPULATION EAP BENEFICIARIES
Source: IBGE, Census 1940, 1950, 1960, 1970, 1980, 1991, 1996 and 2000.
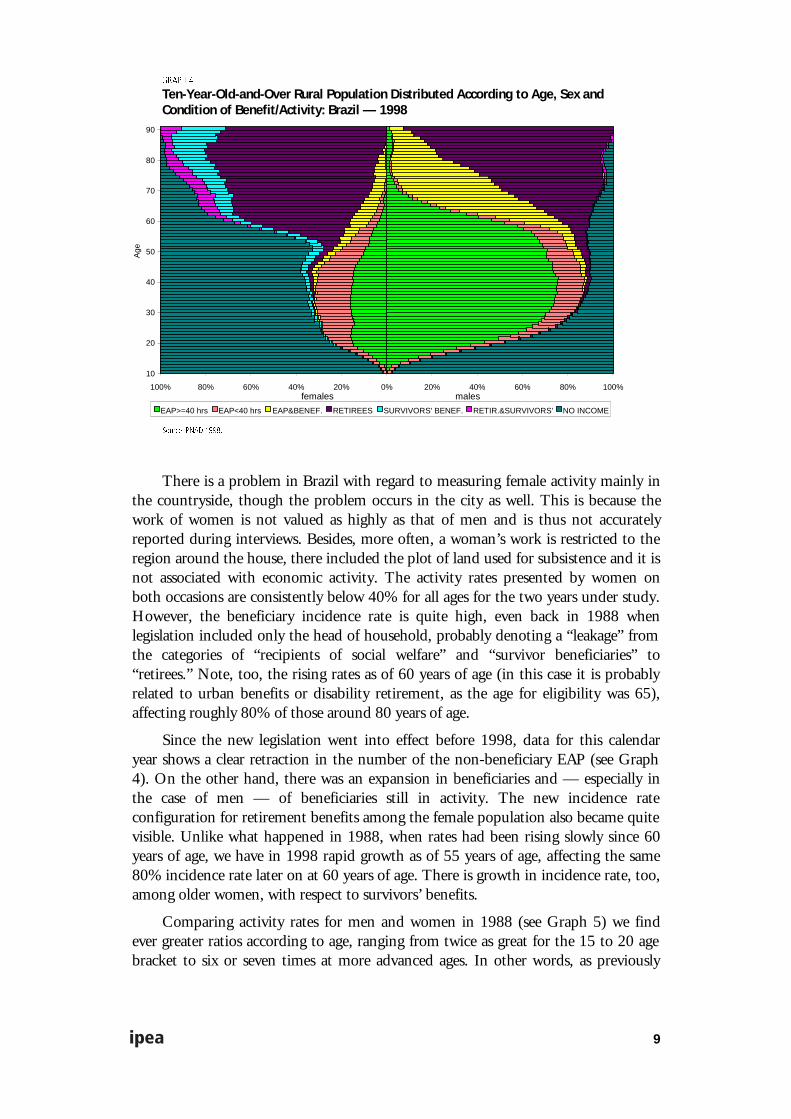
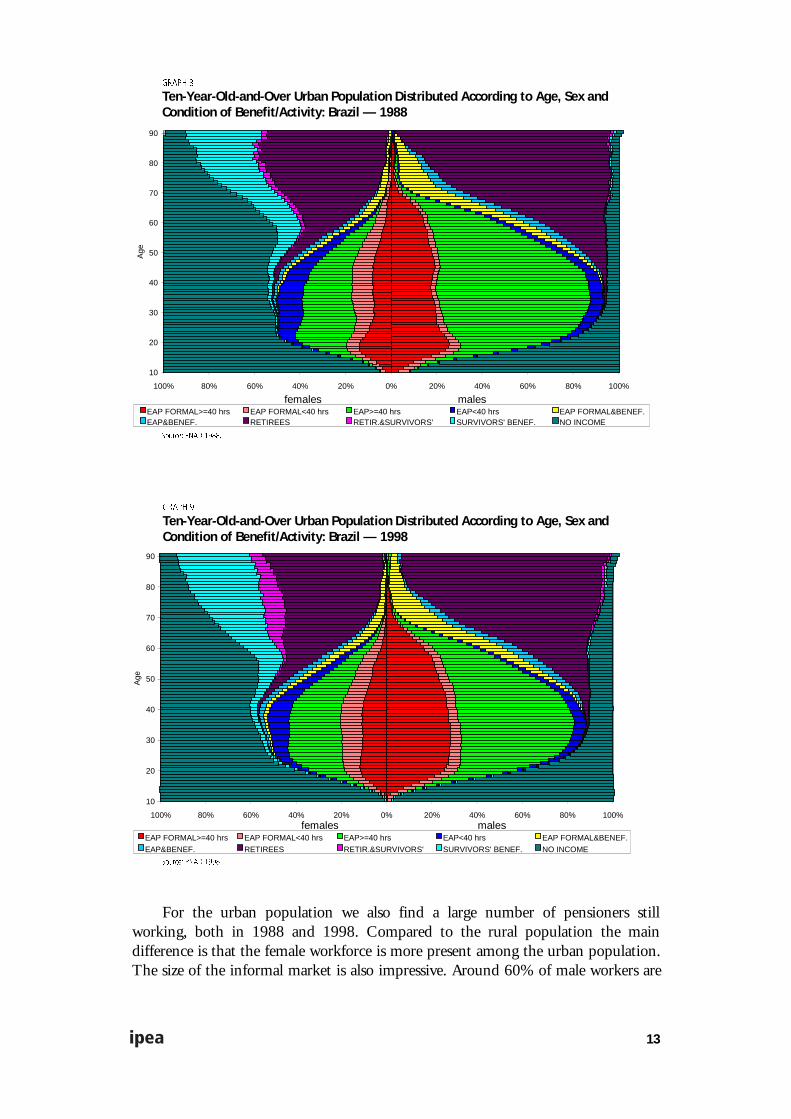
Graphs 8 and 9 present analogous information to the one displayed in Graphs 3and 4, except that now it refers to the urban17 population and is further disaggregatedaccording to the pertinence of workers in the formal or informal labor market.18
16 Brazil is one of seven countries in the world that offers “Length of Service Retirement”. Males can retire with 35 yearsof work and females with 30. Half of the pensioners retiring by “Length of Service” do so before they turn 55 years ofage.17 Note once again that urban workers in this text are the ones living in urban areas.18 For the purpose of this paper individuals that as employees have a formal work relationship (“carteira assinada” —work contract) and as self-employed or employers contribute to the Social Security System were considered as part ofthe formal labor market.
13
GRAPH 8
Ten-Year-Old-and-Over Urban Population Distributed According to Age, Sex andCondition of Benefit/Activity: Brazil — 1988
100% 80% 60% 40% 20% 0% 20% 40% 60% 80% 100%
10
20
30
40
50
60
70
80
90A
ge
EAP FORMAL>=40 hrs EAP FORMAL<40 hrs EAP>=40 hrs EAP<40 hrs EAP FORMAL&BENEF.EAP&BENEF. RETIREES RETIR.&SURVIVORS' SURVIVORS' BENEF. NO INCOME
females males
Source: PNAD 1988.
GRAPH 9
Ten-Year-Old-and-Over Urban Population Distributed According to Age, Sex andCondition of Benefit/Activity: Brazil — 1998
100% 80% 60% 40% 20% 0% 20% 40% 60% 80% 100%
10
20
30
40
50
60
70
80
90
Age
EAP FORMAL>=40 hrs EAP FORMAL<40 hrs EAP>=40 hrs EAP<40 hrs EAP FORMAL&BENEF.
EAP&BENEF. RETIREES RETIR.&SURVIVORS' SURVIVORS' BENEF. NO INCOME
females males
Source: PNAD 1998.
For the urban population we also find a large number of pensioners stillworking, both in 1988 and 1998. Compared to the rural population the maindifference is that the female workforce is more present among the urban population.The size of the informal market is also impressive. Around 60% of male workers are
14
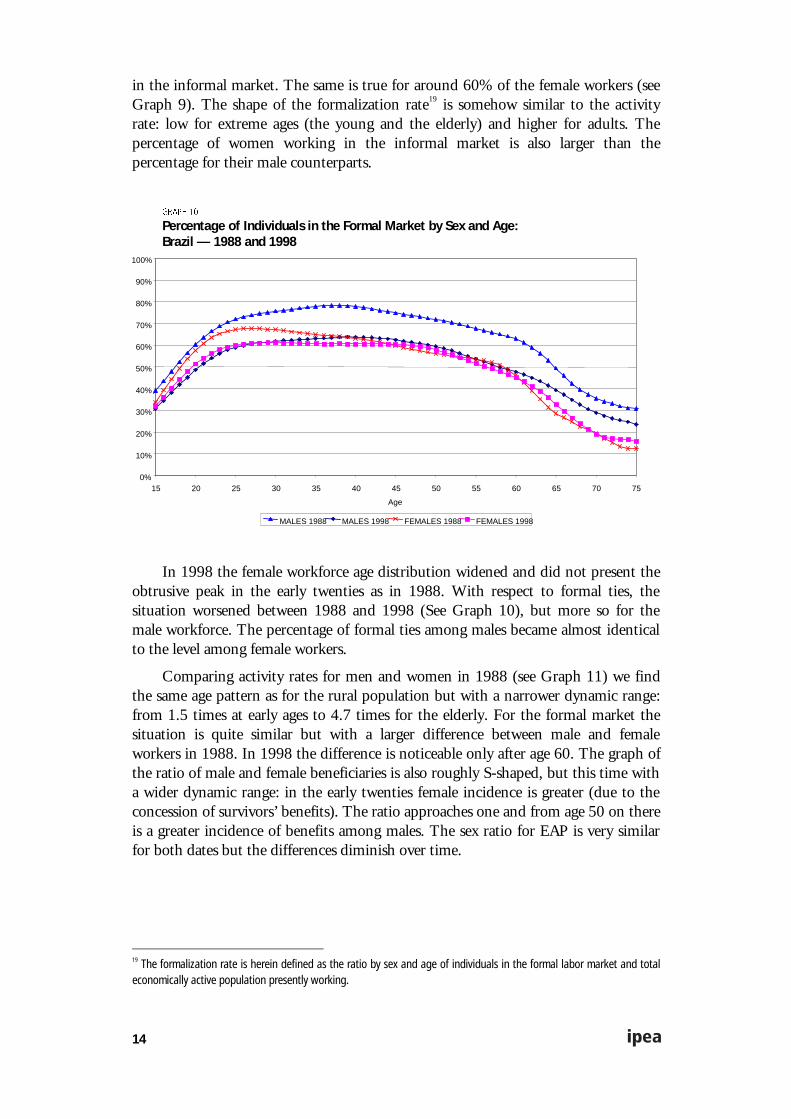
in the informal market. The same is true for around 60% of the female workers (seeGraph 9). The shape of the formalization rate19 is somehow similar to the activityrate: low for extreme ages (the young and the elderly) and higher for adults. Thepercentage of women working in the informal market is also larger than thepercentage for their male counterparts.
GRAPH 10
Percentage of Individuals in the Formal Market by Sex and Age:Brazil — 1988 and 1998
0%
10%
20%
30%
40%
50%
60%
70%
80%
90%
100%
15 20 25 30 35 40 45 50 55 60 65 70 75
Age
MALES 1988 MALES 1998 FEMALES 1988 FEMALES 1998
In 1998 the female workforce age distribution widened and did not present theobtrusive peak in the early twenties as in 1988. With respect to formal ties, thesituation worsened between 1988 and 1998 (See Graph 10), but more so for themale workforce. The percentage of formal ties among males became almost identicalto the level among female workers.
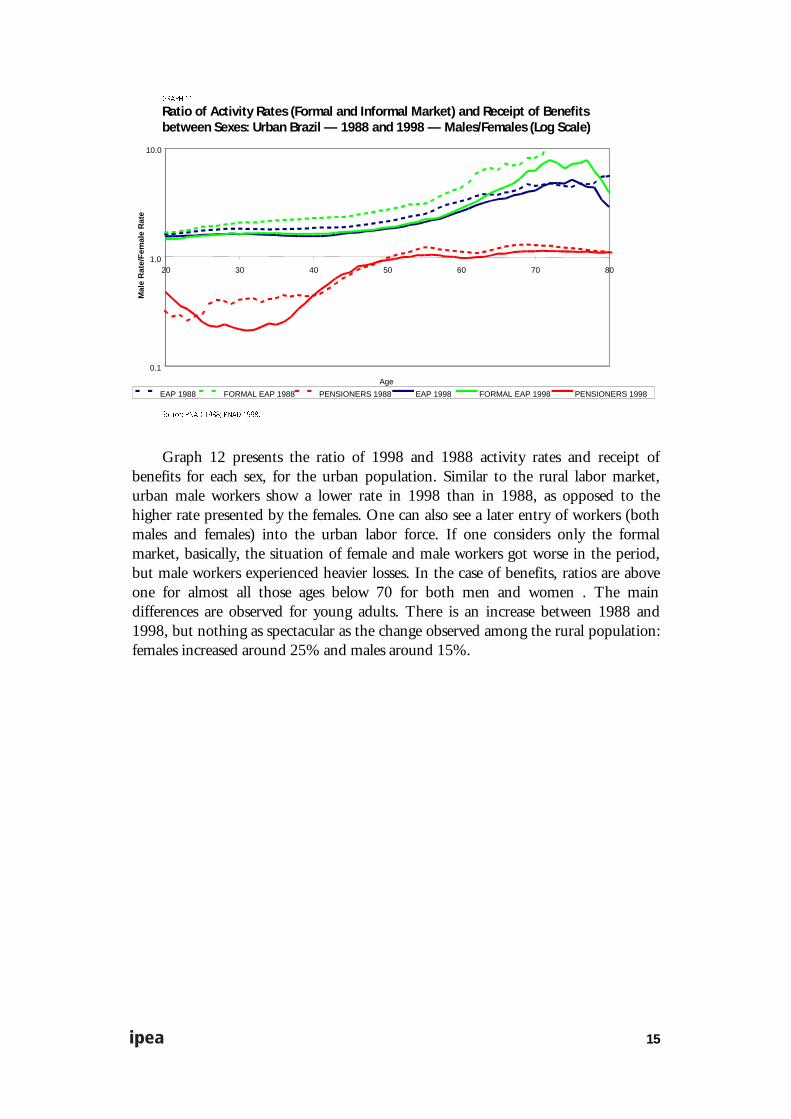
Comparing activity rates for men and women in 1988 (see Graph 11) we findthe same age pattern as for the rural population but with a narrower dynamic range:from 1.5 times at early ages to 4.7 times for the elderly. For the formal market thesituation is quite similar but with a larger difference between male and femaleworkers in 1988. In 1998 the difference is noticeable only after age 60. The graph ofthe ratio of male and female beneficiaries is also roughly S-shaped, but this time witha wider dynamic range: in the early twenties female incidence is greater (due to theconcession of survivors’ benefits). The ratio approaches one and from age 50 on thereis a greater incidence of benefits among males. The sex ratio for EAP is very similarfor both dates but the differences diminish over time.
19 The formalization rate is herein defined as the ratio by sex and age of individuals in the formal labor market and totaleconomically active population presently working.
15
GRAPH 11
Ratio of Activity Rates (Formal and Informal Market) and Receipt of Benefitsbetween Sexes: Urban Brazil — 1988 and 1998 — Males/Females (Log Scale)
0.1
1.0
10.0
20 30 40 50 60 70 80
Age
Mal
e R
ate/
Fem
ale
Rat
e
EAP 1988 FORMAL EAP 1988 PENSIONERS 1988 EAP 1998 FORMAL EAP 1998 PENSIONERS 1998
Source: PNAD 1988; PNAD 1998.
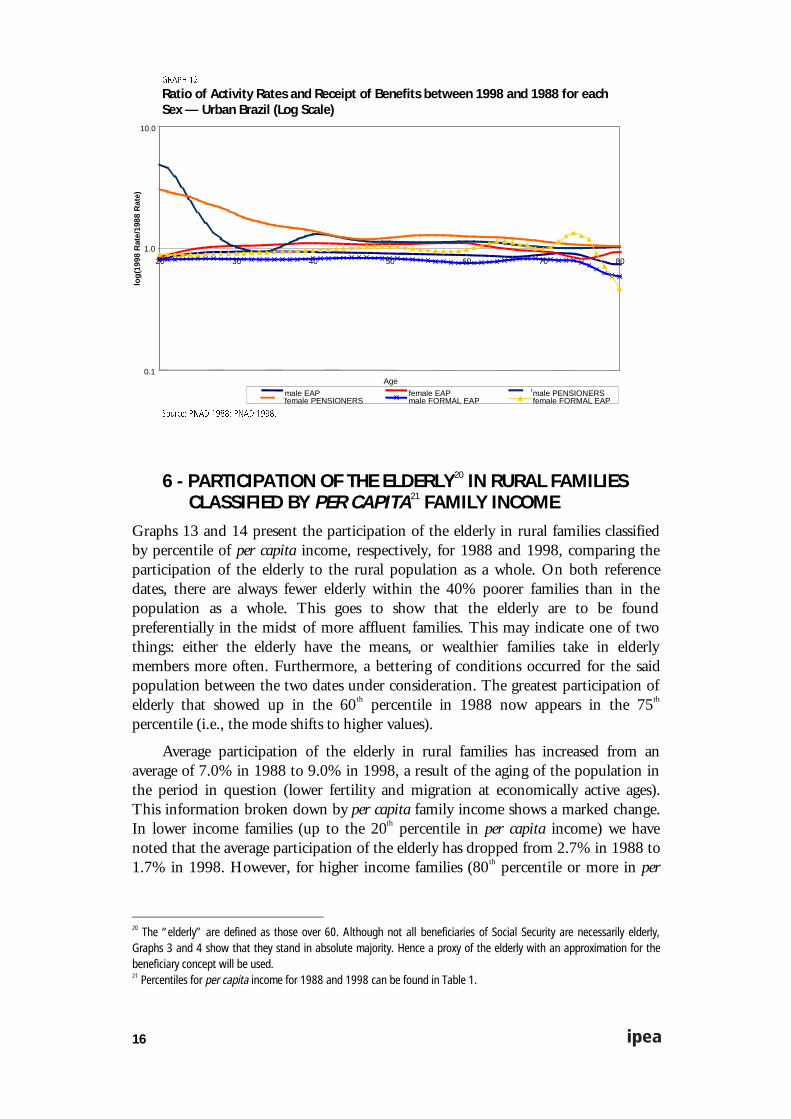
Graph 12 presents the ratio of 1998 and 1988 activity rates and receipt ofbenefits for each sex, for the urban population. Similar to the rural labor market,urban male workers show a lower rate in 1998 than in 1988, as opposed to thehigher rate presented by the females. One can also see a later entry of workers (bothmales and females) into the urban labor force. If one considers only the formalmarket, basically, the situation of female and male workers got worse in the period,but male workers experienced heavier losses. In the case of benefits, ratios are aboveone for almost all those ages below 70 for both men and women . The maindifferences are observed for young adults. There is an increase between 1988 and1998, but nothing as spectacular as the change observed among the rural population:females increased around 25% and males around 15%.
16
GRAPH 12
Ratio of Activity Rates and Receipt of Benefits between 1998 and 1988 for eachSex — Urban Brazil (Log Scale)
0.1
1.0
10.0
20 30 40 50 60 70 80
Age
log(
1998
Rat
e/19
88 R
ate)
male EAP female EAP male PENSIONERSfemale PENSIONERS male FORMAL EAP female FORMAL EAP
Source: PNAD 1988; PNAD 1998.
6 - PARTICIPATION OF THE ELDERLY20 IN RURAL FAMILIESCLASSIFIED BY PER CAPITA21 FAMILY INCOME
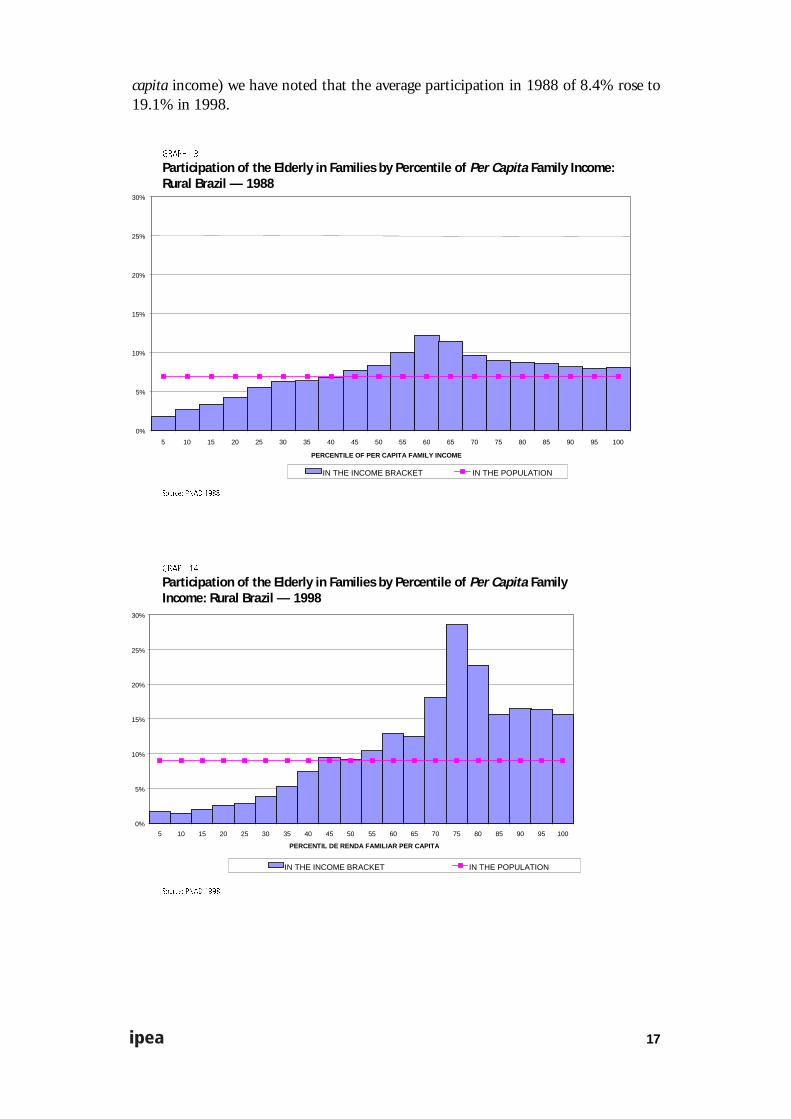
Graphs 13 and 14 present the participation of the elderly in rural families classifiedby percentile of per capita income, respectively, for 1988 and 1998, comparing theparticipation of the elderly to the rural population as a whole. On both referencedates, there are always fewer elderly within the 40% poorer families than in thepopulation as a whole. This goes to show that the elderly are to be foundpreferentially in the midst of more affluent families. This may indicate one of twothings: either the elderly have the means, or wealthier families take in elderlymembers more often. Furthermore, a bettering of conditions occurred for the saidpopulation between the two dates under consideration. The greatest participation ofelderly that showed up in the 60th percentile in 1988 now appears in the 75th
percentile (i.e., the mode shifts to higher values).
Average participation of the elderly in rural families has increased from anaverage of 7.0% in 1988 to 9.0% in 1998, a result of the aging of the population inthe period in question (lower fertility and migration at economically active ages).This information broken down by per capita family income shows a marked change.In lower income families (up to the 20th percentile in per capita income) we havenoted that the average participation of the elderly has dropped from 2.7% in 1988 to1.7% in 1998. However, for higher income families (80th percentile or more in per
20 The “elderly” are defined as those over 60. Although not all beneficiaries of Social Security are necessarily elderly,Graphs 3 and 4 show that they stand in absolute majority. Hence a proxy of the elderly with an approximation for thebeneficiary concept will be used.21 Percentiles for per capita income for 1988 and 1998 can be found in Table 1.
17
capita income) we have noted that the average participation in 1988 of 8.4% rose to19.1% in 1998.
GRAPH 13
Participation of the Elderly in Families by Percentile of Per Capita Family Income:Rural Brazil — 1988
0%
5%
10%
15%
20%
25%
30%
5 10 15 20 25 30 35 40 45 50 55 60 65 70 75 80 85 90 95 100
PERCENTILE OF PER CAPITA FAMILY INCOME
IN THE INCOME BRACKET IN THE POPULATION
Source: PNAD 1988.
GRAPH 14
Participation of the Elderly in Families by Percentile of Per Capita FamilyIncome: Rural Brazil — 1998
0%
5%
10%
15%
20%
25%
30%
5 10 15 20 25 30 35 40 45 50 55 60 65 70 75 80 85 90 95 100
PERCENTIL DE RENDA FAMILIAR PER CAPITA
IN THE INCOME BRACKET IN THE POPULATION
Source: PNAD 1998.
18
In 1988 and 1998, for the 45th percentile and above, the presence of the elderlyin families is greater than in the rural population as a whole, the inverse happeningbefore the above mentioned percentile.
In summary, there is an ever-growing concentration of the elderly in ruralfamilies with higher income levels. It is noticeable that though the averageparticipation of the elderly in rural families for the period 1988/98 has risen, thisgrowth has been quite lopsided when considering per capita income brackets. Thiscorroborates the fact that it is the elderly who have been responsible for theeconomic improvement of the families they belong to.
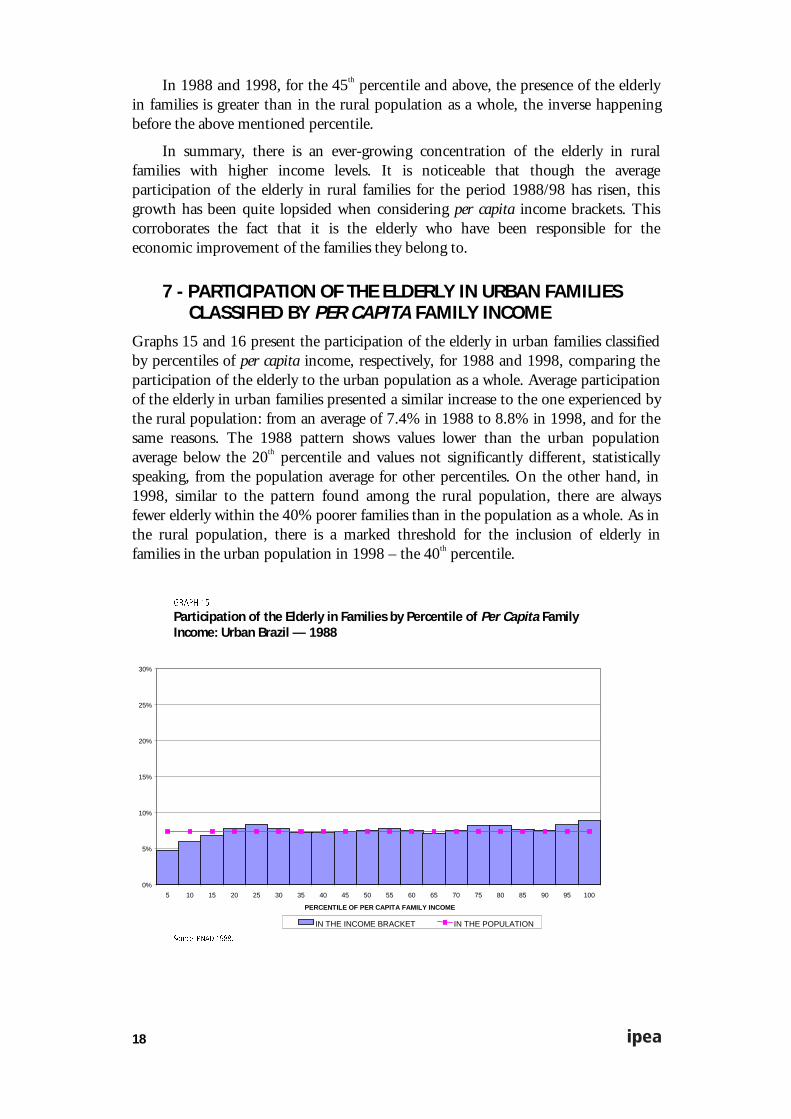
7 - PARTICIPATION OF THE ELDERLY IN URBAN FAMILIESCLASSIFIED BY PER CAPITA FAMILY INCOME
Graphs 15 and 16 present the participation of the elderly in urban families classifiedby percentiles of per capita income, respectively, for 1988 and 1998, comparing theparticipation of the elderly to the urban population as a whole. Average participationof the elderly in urban families presented a similar increase to the one experienced bythe rural population: from an average of 7.4% in 1988 to 8.8% in 1998, and for thesame reasons. The 1988 pattern shows values lower than the urban populationaverage below the 20th percentile and values not significantly different, statisticallyspeaking, from the population average for other percentiles. On the other hand, in1998, similar to the pattern found among the rural population, there are alwaysfewer elderly within the 40% poorer families than in the population as a whole. As inthe rural population, there is a marked threshold for the inclusion of elderly infamilies in the urban population in 1998 – the 40th percentile.
GRAPH 15
Participation of the Elderly in Families by Percentile of Per Capita FamilyIncome: Urban Brazil — 1988
0%
5%
10%
15%
20%
25%
30%
5 10 15 20 25 30 35 40 45 50 55 60 65 70 75 80 85 90 95 100
PERCENTILE OF PER CAPITA FAMILY INCOME
IN THE INCOME BRACKET IN THE POPULATION
Source: PNAD 1988.

19
GRAPH 16
Participation of the Elderly in Families by Percentile of Per Capita FamilyIncome: Urban Brazil — 1998
0%
5%
10%
15%
20%
25%
30%
5 10 15 20 25 30 35 40 45 50 55 60 65 70 75 80 85 90 95 100
PERCENTILE OF PER CAPITA FAMILY INCOME
IN THE INCOME BRACKET IN THE POPULATION
Source: PNAD 1998.
8 - PARTICIPATION OF INCOME22 FROM THE ELDERLY INRURAL FAMILY INCOME
Graphs 17 and 18 show the partic-,
ipation of income from pensions in overall rural family income, by incomepercentiles in 1988 and 1998, as compared with this participation in the ruralpopulation as a whole. Similar to the increase in participation of the elderly thatoccurred in the period, there was also a growth in income: from 7.0% in 1988 to18.0% in 1998. Note that in 1988 the elderly contributed to the family incomeexactly their apportioned share, i.e., the percentage of elderly in the populationexactly matches their contribution to the family income and conversely their averageincome equaled the rural population’s average income. In 1998, though, theycontributed with twice as much. This increase can be broken down into two parts: a)increase in the proportion of elderly population and therefore a parallel increase ofelderly members (retirees and survivors’ beneficiaries) in rural families; and b) rise inaverage income of the elderly. It is worthwhile to note that there was relative increasein income of the elderly since the aging of the population accounts for the increase offrom 7.0% to 9.0% in the physical presence of the elderly in the families. The other9.0% increase may have been caused by the increase in the individual value ofbenefits perceived. In other words, even taking into account the aging-of-populationcomponent, the rise in participation of the elderly in rural family income in Brazilmay be credited to the 1988 Constitution, which doubled the value of the benefit interms of minimum wages and lowered the eligibility age.
22 When dealing with the elderly income we are refering exclusively to pensions.

20
GRAPH 17
Participation of Pensions on Total Family Income by Percentile of PerCapita Family Income: Rural Brazil — 1988
0%
5%
10%
15%
20%
25%
30%
35%
5 10 15 20 25 30 35 40 45 50 55 60 65 70 75 80 85 90 95 100
PERCENTILE OF PER CAPITA FAMILY INCOME
IN THE INCOME BRACKET IN THE POPULATION
Source: PNAD 1988.
In terms of economic participation, differently from what occurred withphysical presence, the representation is roughly an inverted U-shape: there is lessrelative contribution in family income of the elderly in extreme percentiles (in thepoorer and richer families). In 1988 it is actually rather flat, slightly m-shaped butdropping at the extreme groups.
GRAPH 18
Participation of Pensions on Total Family Income by Percentile of Per CapitaFamily Income: Rural Brazil — 1998
0%
5%
10%
15%
20%
25%
30%
35%
5 10 15 20 25 30 35 40 45 50 55 60 65 70 75 80 85 90 95 100
PERCENTILE OF PER CAPITA FAMILY INCOME
IN THE INCOME BRACKET IN THE POPULATION
Source: PNAD 1998.
In lower income families (up to 20% percentile in per capita income) we havenoted that the average contribution of the elderly to the family income was 7.4% oftotal income in both years under study: 1988 and 1998. However, for higher income

21
families (80th or more in per capita income) we have noted that the averageparticipation in 1988 of 5.2% rose to 18.2% in 1998. Even though the incomeparticipation of the elderly in the family income for these income brackets is not ashigh as for the rural population as a whole (it is below average), the increase issizeable as it more than tripled in value. In short, the presence of elderly members inthe family is associated with improved income despite the fact that the incomeparticipation of the elderly in family income may not always be as high as the incomeof other family members for the more affluent groups.
Actually the per capita income reflects an increase in real terms23 from 1988 to1998 in all percentiles, with the exception of the 5th percentile. This can be seen inTable 1, which shows the percentiles as a fraction of the legal minimum wage at thetime of the survey and in reais of September 1998. Note, too, that this increase canbe observed despite the deterioration of the minimum wage in real terms (Table 2and Graph 32).
TABLE 1
Percentiles of Per Capita Family Income for the Rural Population in 1988 and 1998 as aFraction of the Minimum Wage in Force during the Month of the Survey in Reais ofSeptember 1998
Fraction of Minimum Wage R$ of September 1998 (INPC)
1998 1988 1998 1988
5 0.044 0.064 5.77 6.83
10 0.130 0.124 16.88 13.09
15 0.182 0.171 23.67 18.09
20 0.229 0.211 29.78 22.36
25 0.273 0.245 35.44 25.96
30 0.311 0.284 40.38 30.05
35 0.360 0.323 46.74 34.22
40 0.428 0.368 55.67 39.03
45 0.492 0.414 63.91 43.85
50 0.541 0.465 70.34 49.28
55 0.616 0.519 80.10 55.02
60 0.691 0.581 89.89 61.53
65 0.782 0.645 101.60 68.34
70 0.900 0.738 117.04 78.21
75 0.998 0.850 129.70 90.02
80 1.085 1.002 141.01 106.16
85 1.288 1.211 167.47 128.30
90 1.617 1.533 210.23 162.42
95 2.221 2.175 288.67 230.49
100 5.993 5.190 779.15 549.89
Source: PNAD 1988 and 1998, IBGE.
23 Using the INPC from IBGE as the measure of inflation.
22
TABLE 2
Minimum Wage
Current Values Constant Values (INPC) September/1998
September/1988 15,552.00 105.95
September/1998 130.00 130.00
Source: Social Security Statistics Yearbook (Anuário Estatístico da Previdência Social), MPAS, 1998.
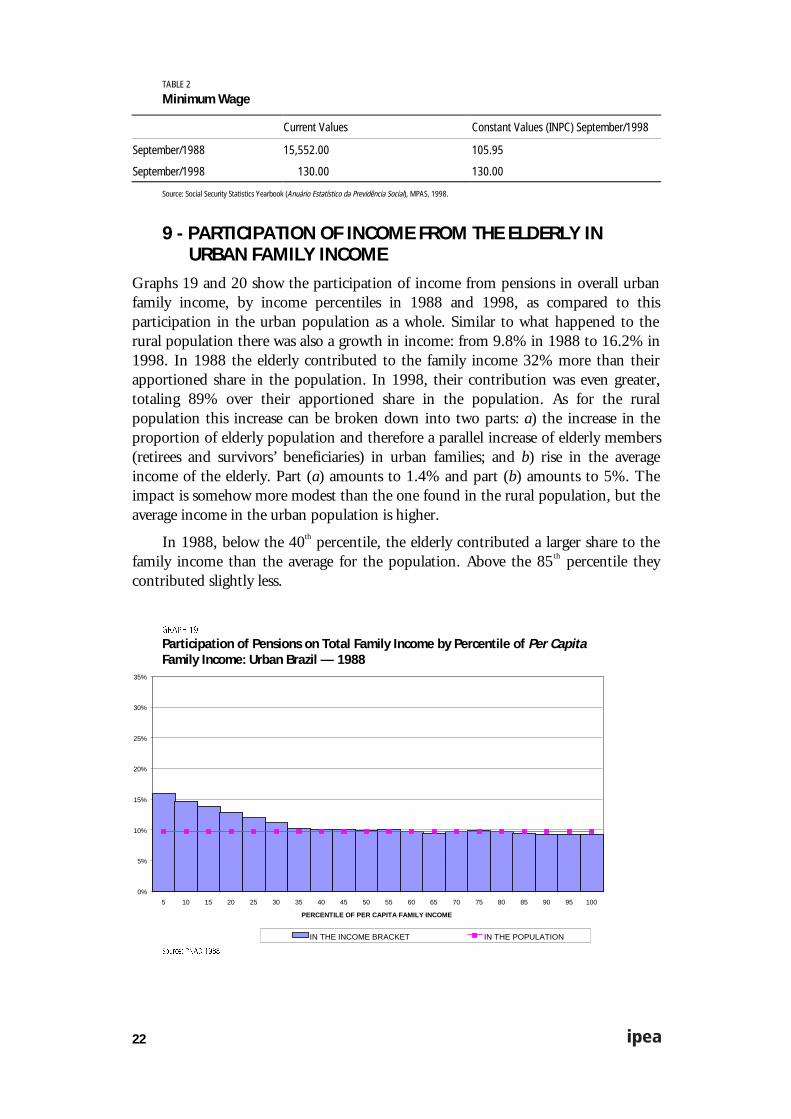
9 - PARTICIPATION OF INCOME FROM THE ELDERLY INURBAN FAMILY INCOME
Graphs 19 and 20 show the participation of income from pensions in overall urbanfamily income, by income percentiles in 1988 and 1998, as compared to thisparticipation in the urban population as a whole. Similar to what happened to therural population there was also a growth in income: from 9.8% in 1988 to 16.2% in1998. In 1988 the elderly contributed to the family income 32% more than theirapportioned share in the population. In 1998, their contribution was even greater,totaling 89% over their apportioned share in the population. As for the ruralpopulation this increase can be broken down into two parts: a) the increase in theproportion of elderly population and therefore a parallel increase of elderly members(retirees and survivors’ beneficiaries) in urban families; and b) rise in the averageincome of the elderly. Part (a) amounts to 1.4% and part (b) amounts to 5%. Theimpact is somehow more modest than the one found in the rural population, but theaverage income in the urban population is higher.
In 1988, below the 40th percentile, the elderly contributed a larger share to thefamily income than the average for the population. Above the 85th percentile theycontributed slightly less.
GRAPH 19
Participation of Pensions on Total Family Income by Percentile of Per CapitaFamily Income: Urban Brazil — 1988
0%
5%
10%
15%
20%
25%
30%
35%
5 10 15 20 25 30 35 40 45 50 55 60 65 70 75 80 85 90 95 100
PERCENTILE OF PER CAPITA FAMILY INCOME
IN THE INCOME BRACKET IN THE POPULATION
Source: PNAD 1988.
23
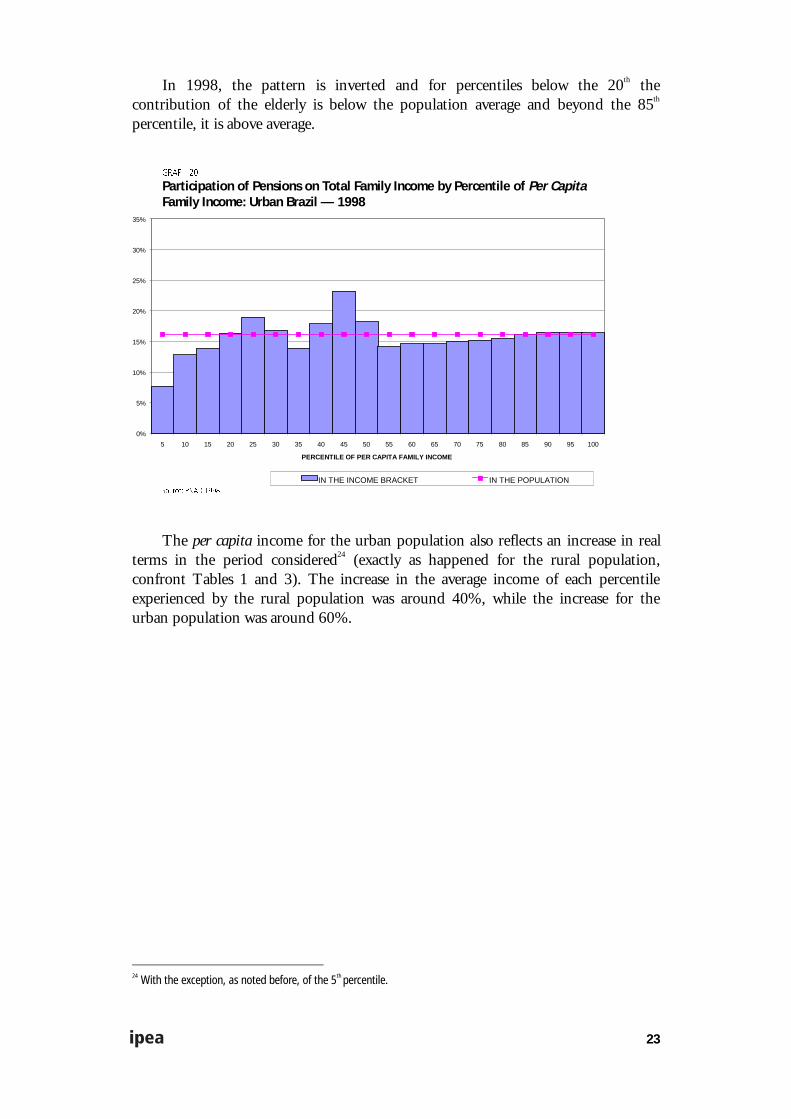
In 1998, the pattern is inverted and for percentiles below the 20th thecontribution of the elderly is below the population average and beyond the 85th
percentile, it is above average.
GRAPH 20
Participation of Pensions on Total Family Income by Percentile of Per CapitaFamily Income: Urban Brazil — 1998
0%
5%
10%
15%
20%
25%
30%
35%
5 10 15 20 25 30 35 40 45 50 55 60 65 70 75 80 85 90 95 100
PERCENTILE OF PER CAPITA FAMILY INCOME
IN THE INCOME BRACKET IN THE POPULATIONSource: PNAD 1998.
The per capita income for the urban population also reflects an increase in realterms in the period considered24 (exactly as happened for the rural population,confront Tables 1 and 3). The increase in the average income of each percentileexperienced by the rural population was around 40%, while the increase for theurban population was around 60%.
24 With the exception, as noted before, of the 5th percentile.
24
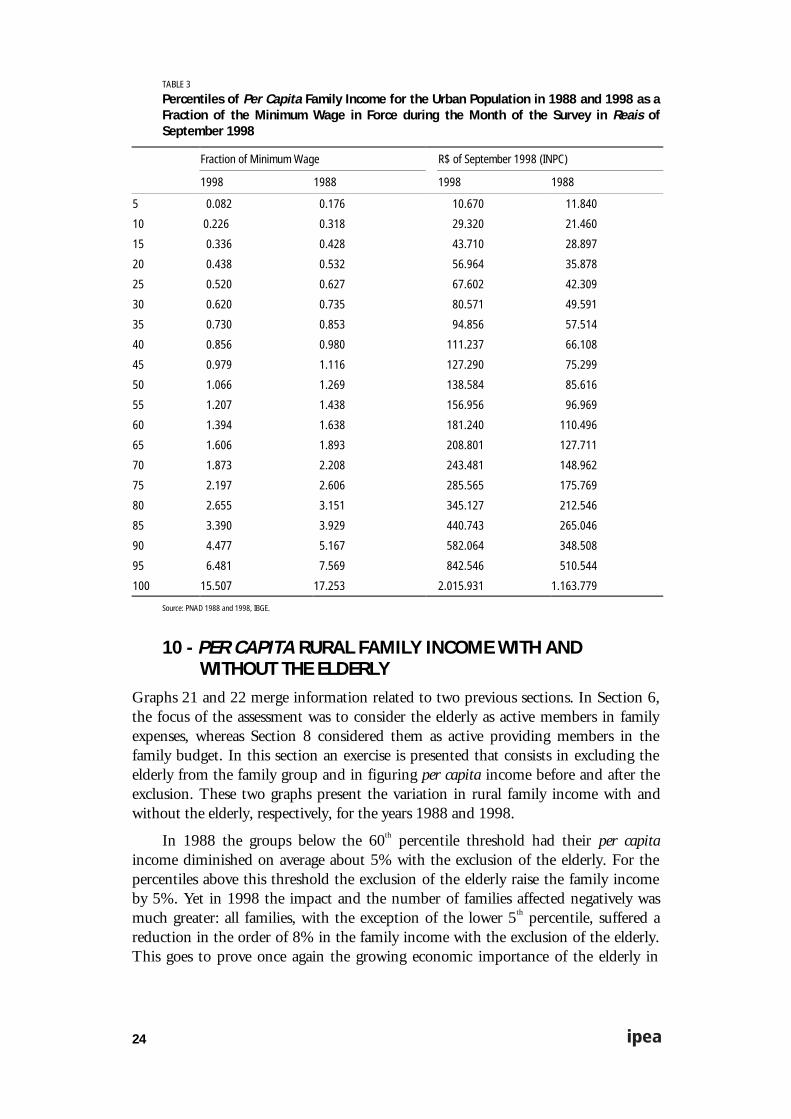
TABLE 3
Percentiles of Per Capita Family Income for the Urban Population in 1988 and 1998 as aFraction of the Minimum Wage in Force during the Month of the Survey in Reais ofSeptember 1998
Fraction of Minimum Wage R$ of September 1998 (INPC)
1998 1988 1998 1988
5 0.082 0.176 10.670 11.840
10 0.226 0.318 29.320 21.460
15 0.336 0.428 43.710 28.897
20 0.438 0.532 56.964 35.878
25 0.520 0.627 67.602 42.309
30 0.620 0.735 80.571 49.591
35 0.730 0.853 94.856 57.514
40 0.856 0.980 111.237 66.108
45 0.979 1.116 127.290 75.299
50 1.066 1.269 138.584 85.616
55 1.207 1.438 156.956 96.969
60 1.394 1.638 181.240 110.496
65 1.606 1.893 208.801 127.711
70 1.873 2.208 243.481 148.962
75 2.197 2.606 285.565 175.769
80 2.655 3.151 345.127 212.546
85 3.390 3.929 440.743 265.046
90 4.477 5.167 582.064 348.508
95 6.481 7.569 842.546 510.544
100 15.507 17.253 2.015.931 1.163.779
Source: PNAD 1988 and 1998, IBGE.
10 - PER CAPITA RURAL FAMILY INCOME WITH ANDWITHOUT THE ELDERLY
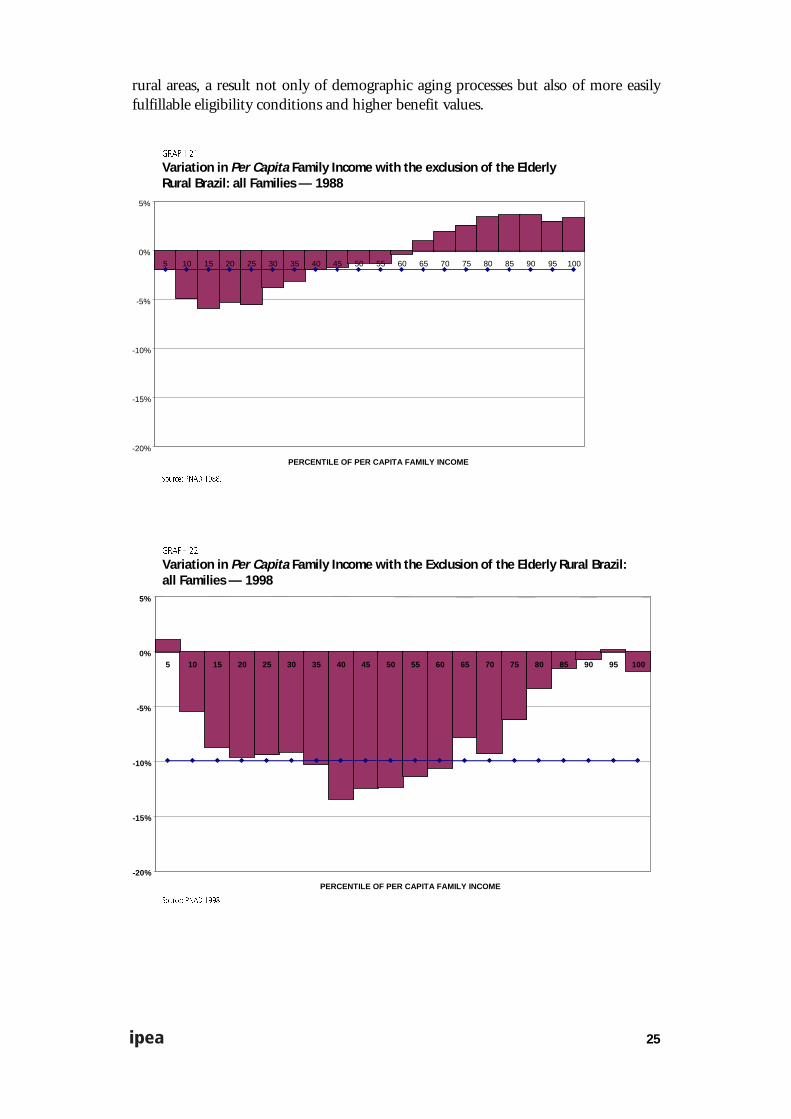
Graphs 21 and 22 merge information related to two previous sections. In Section 6,the focus of the assessment was to consider the elderly as active members in familyexpenses, whereas Section 8 considered them as active providing members in thefamily budget. In this section an exercise is presented that consists in excluding theelderly from the family group and in figuring per capita income before and after theexclusion. These two graphs present the variation in rural family income with andwithout the elderly, respectively, for the years 1988 and 1998.
In 1988 the groups below the 60th percentile threshold had their per capitaincome diminished on average about 5% with the exclusion of the elderly. For thepercentiles above this threshold the exclusion of the elderly raise the family incomeby 5%. Yet in 1998 the impact and the number of families affected negatively wasmuch greater: all families, with the exception of the lower 5th percentile, suffered areduction in the order of 8% in the family income with the exclusion of the elderly.This goes to prove once again the growing economic importance of the elderly in
25
rural areas, a result not only of demographic aging processes but also of more easilyfulfillable eligibility conditions and higher benefit values.
GRAPH 21
Variation in Per Capita Family Income with the exclusion of the ElderlyRural Brazil: all Families — 1988
-20%
-15%
-10%
-5%
0%
5%
5 10 15 20 25 30 35 40 45 50 55 60 65 70 75 80 85 90 95 100
PERCENTILE OF PER CAPITA FAMILY INCOME
Source: PNAD 1988.
GRAPH 22
Variation in Per Capita Family Income with the Exclusion of the Elderly Rural Brazil:all Families — 1998
-20%
-15%
-10%
-5%
0%
5%
5 10 15 20 25 30 35 40 45 50 55 60 65 70 75 80 85 90 95 100
PERCENTILE OF PER CAPITA FAMILY INCOME
Source: PNAD 1998.
26
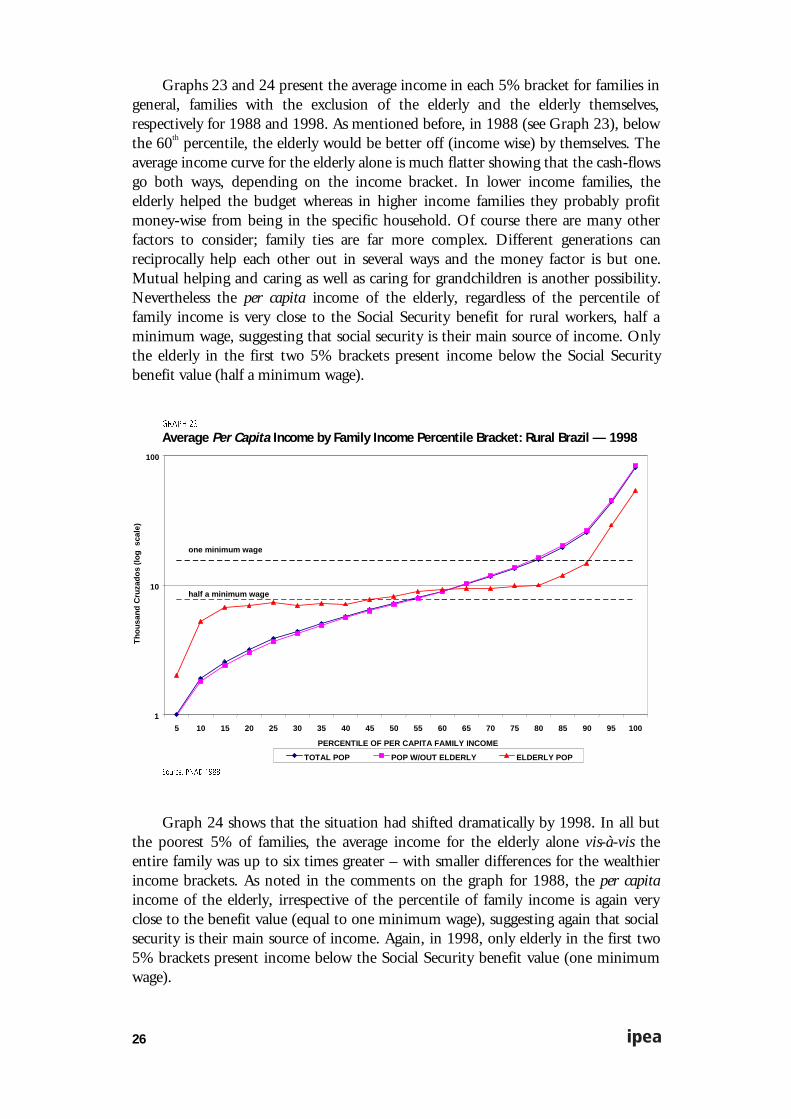
Graphs 23 and 24 present the average income in each 5% bracket for families ingeneral, families with the exclusion of the elderly and the elderly themselves,respectively for 1988 and 1998. As mentioned before, in 1988 (see Graph 23), belowthe 60th percentile, the elderly would be better off (income wise) by themselves. Theaverage income curve for the elderly alone is much flatter showing that the cash-flowsgo both ways, depending on the income bracket. In lower income families, theelderly helped the budget whereas in higher income families they probably profitmoney-wise from being in the specific household. Of course there are many otherfactors to consider; family ties are far more complex. Different generations canreciprocally help each other out in several ways and the money factor is but one.Mutual helping and caring as well as caring for grandchildren is another possibility.Nevertheless the per capita income of the elderly, regardless of the percentile offamily income is very close to the Social Security benefit for rural workers, half aminimum wage, suggesting that social security is their main source of income. Onlythe elderly in the first two 5% brackets present income below the Social Securitybenefit value (half a minimum wage).
GRAPH 23
Average Per Capita Income by Family Income Percentile Bracket: Rural Brazil — 1998
1
10
100
5 10 15 20 25 30 35 40 45 50 55 60 65 70 75 80 85 90 95 100
PERCENTILE OF PER CAPITA FAMILY INCOME
Tho
usan
d C
ruza
dos
(log
sca
le)
TOTAL POP POP W/OUT ELDERLY ELDERLY POP
Source: PNAD 1988.
one minimum wage
half a minimum wage
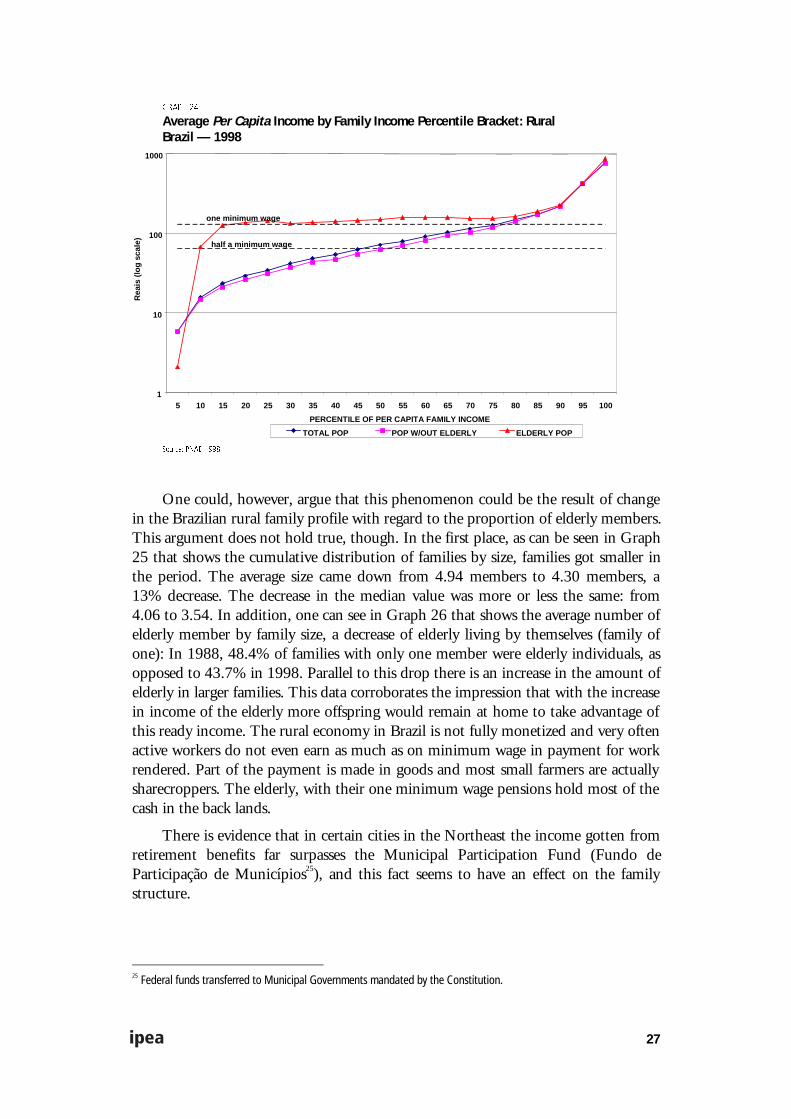
Graph 24 shows that the situation had shifted dramatically by 1998. In all butthe poorest 5% of families, the average income for the elderly alone vis-à-vis theentire family was up to six times greater – with smaller differences for the wealthierincome brackets. As noted in the comments on the graph for 1988, the per capitaincome of the elderly, irrespective of the percentile of family income is again veryclose to the benefit value (equal to one minimum wage), suggesting again that socialsecurity is their main source of income. Again, in 1998, only elderly in the first two5% brackets present income below the Social Security benefit value (one minimumwage).
27
GRAPH 24
Average Per Capita Income by Family Income Percentile Bracket: RuralBrazil — 1998
1
10
100
1000
5 10 15 20 25 30 35 40 45 50 55 60 65 70 75 80 85 90 95 100
PERCENTILE OF PER CAPITA FAMILY INCOME
Rea
is (
log
scal
e)
TOTAL POP POP W/OUT ELDERLY ELDERLY POP
Source: PNAD 1998.
one minimum wage
half a minimum wage
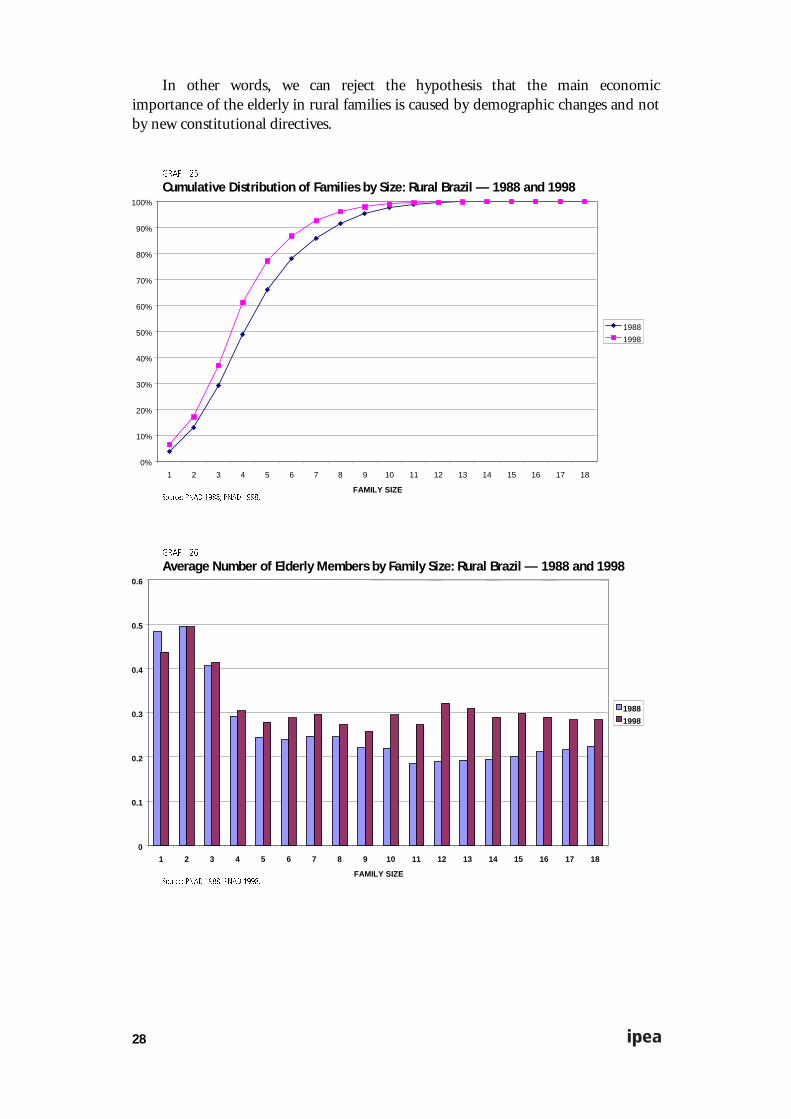
One could, however, argue that this phenomenon could be the result of changein the Brazilian rural family profile with regard to the proportion of elderly members.This argument does not hold true, though. In the first place, as can be seen in Graph25 that shows the cumulative distribution of families by size, families got smaller inthe period. The average size came down from 4.94 members to 4.30 members, a13% decrease. The decrease in the median value was more or less the same: from4.06 to 3.54. In addition, one can see in Graph 26 that shows the average number ofelderly member by family size, a decrease of elderly living by themselves (family ofone): In 1988, 48.4% of families with only one member were elderly individuals, asopposed to 43.7% in 1998. Parallel to this drop there is an increase in the amount ofelderly in larger families. This data corroborates the impression that with the increasein income of the elderly more offspring would remain at home to take advantage ofthis ready income. The rural economy in Brazil is not fully monetized and very oftenactive workers do not even earn as much as on minimum wage in payment for workrendered. Part of the payment is made in goods and most small farmers are actuallysharecroppers. The elderly, with their one minimum wage pensions hold most of thecash in the back lands.
There is evidence that in certain cities in the Northeast the income gotten fromretirement benefits far surpasses the Municipal Participation Fund (Fundo deParticipação de Municípios25), and this fact seems to have an effect on the familystructure.
25 Federal funds transferred to Municipal Governments mandated by the Constitution.
28
In other words, we can reject the hypothesis that the main economicimportance of the elderly in rural families is caused by demographic changes and notby new constitutional directives.
GRAPH 25
Cumulative Distribution of Families by Size: Rural Brazil — 1988 and 1998
0%
10%
20%
30%
40%
50%
60%
70%
80%
90%
100%
1 2 3 4 5 6 7 8 9 10 11 12 13 14 15 16 17 18
FAMILY SIZE
1988
1998
Source: PNAD 1988; PNAD 1998.
GRAPH 26
Average Number of Elderly Members by Family Size: Rural Brazil — 1988 and 1998
0
0.1
0.2
0.3
0.4
0.5
0.6
1 2 3 4 5 6 7 8 9 10 11 12 13 14 15 16 17 18
FAMILY SIZE
1988
1998
Source: PNAD 1988; PNAD 1998.
29
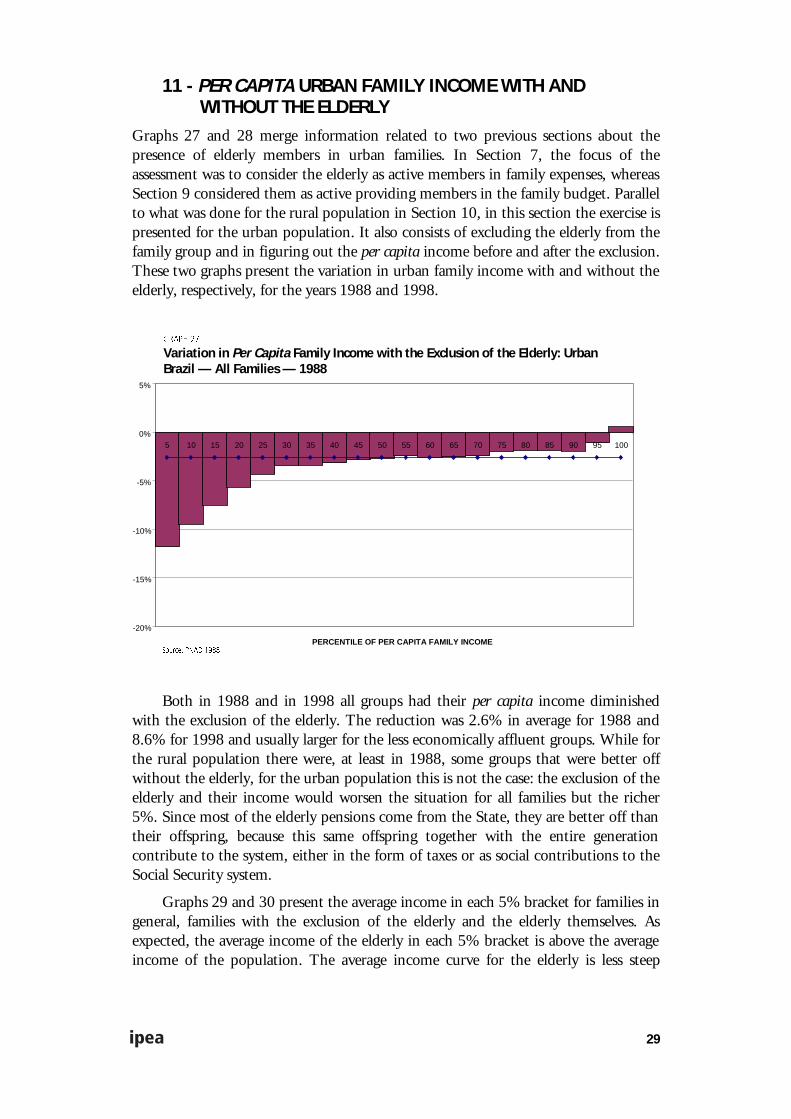
11 - PER CAPITA URBAN FAMILY INCOME WITH ANDWITHOUT THE ELDERLY
Graphs 27 and 28 merge information related to two previous sections about thepresence of elderly members in urban families. In Section 7, the focus of theassessment was to consider the elderly as active members in family expenses, whereasSection 9 considered them as active providing members in the family budget. Parallelto what was done for the rural population in Section 10, in this section the exercise ispresented for the urban population. It also consists of excluding the elderly from thefamily group and in figuring out the per capita income before and after the exclusion.These two graphs present the variation in urban family income with and without theelderly, respectively, for the years 1988 and 1998.
GRAPH 27
Variation in Per Capita Family Income with the Exclusion of the Elderly: UrbanBrazil — All Families — 1988
-20%
-15%
-10%
-5%
0%
5%
5 10 15 20 25 30 35 40 45 50 55 60 65 70 75 80 85 90 95 100
PERCENTILE OF PER CAPITA FAMILY INCOMESource: PNAD 1988.
Both in 1988 and in 1998 all groups had their per capita income diminishedwith the exclusion of the elderly. The reduction was 2.6% in average for 1988 and8.6% for 1998 and usually larger for the less economically affluent groups. While forthe rural population there were, at least in 1988, some groups that were better offwithout the elderly, for the urban population this is not the case: the exclusion of theelderly and their income would worsen the situation for all families but the richer5%. Since most of the elderly pensions come from the State, they are better off thantheir offspring, because this same offspring together with the entire generationcontribute to the system, either in the form of taxes or as social contributions to theSocial Security system.
Graphs 29 and 30 present the average income in each 5% bracket for families ingeneral, families with the exclusion of the elderly and the elderly themselves. Asexpected, the average income of the elderly in each 5% bracket is above the averageincome of the population. The average income curve for the elderly is less steep

30
showing that the income distribution among the elderly is more homogeneous thanin the population as a whole, but not as homogeneous as the distribution of theirrural counterparts. For the elderly population in families below the 25-th percentiletheir average income is below the statutory minimum benefit value (one minimumwage) possibly reflecting the more stringent eligibility rules to access social securitybenefits for the urban population.
GRAPH 28
Variation in Per Capita Family Income with the Exclusion of the Elderly: Urban Brazil— All Families — 1998
-20%
-15%
-10%
-5%
0%
5%
5 10 15 20 25 30 35 40 45 50 55 60 65 70 75 80 85 90 95 100
PERCENTILE OF PER CAPITA FAMILY INCOMESource: PNAD 1998.
GRAPH 29
Average Per Capita Income by Family Income Percentile Bracket: UrbanBrazil — 1988
1
10
100
1000
5 10 15 20 25 30 35 40 45 50 55 60 65 70 75 80 85 90 95 100
PERCENTILE OF PER CAPITA FAMILY INCOME
Tho
usan
d C
ruza
dos
(log
sca
le)
TOTAL POP POP W/OUT ELDERLY ELDERLY POP
Source: PNAD 1988.
one minimum wage
half a minimum wage
31
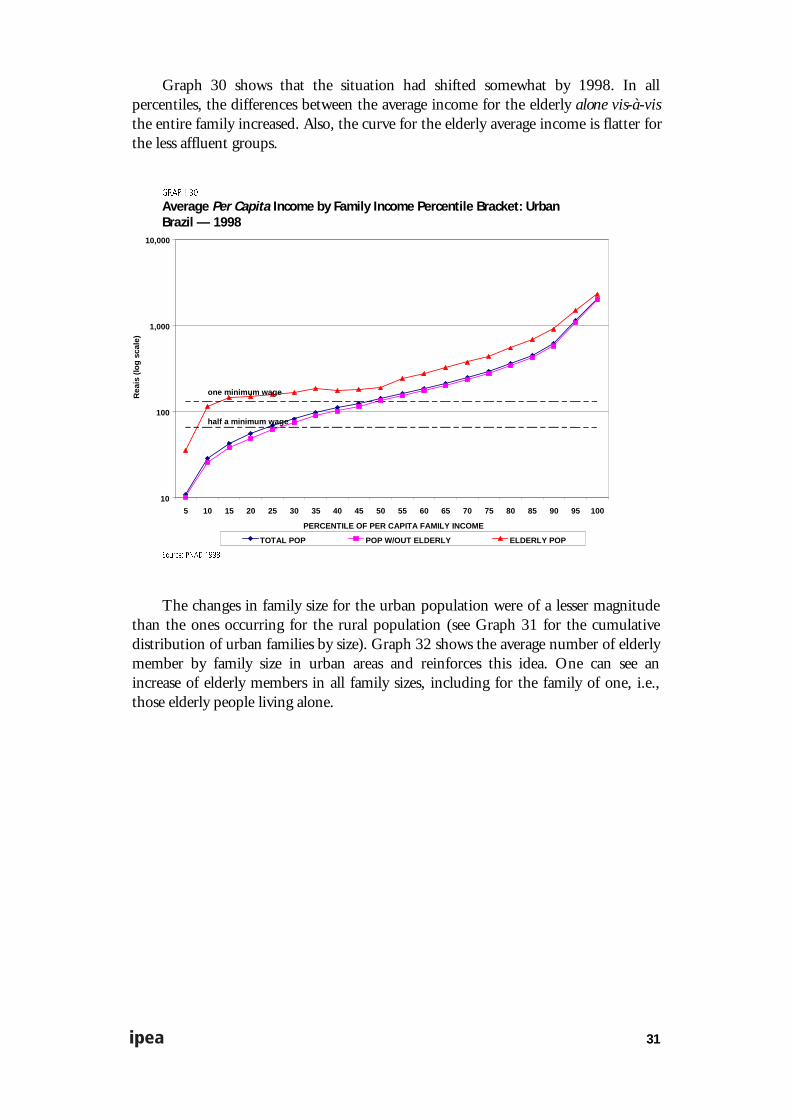
Graph 30 shows that the situation had shifted somewhat by 1998. In allpercentiles, the differences between the average income for the elderly alone vis-à-visthe entire family increased. Also, the curve for the elderly average income is flatter forthe less affluent groups.
GRAPH 30
Average Per Capita Income by Family Income Percentile Bracket: UrbanBrazil — 1998
10
100
1,000
10,000
5 10 15 20 25 30 35 40 45 50 55 60 65 70 75 80 85 90 95 100
PERCENTILE OF PER CAPITA FAMILY INCOME
Rea
is (
log
scal
e)
TOTAL POP POP W/OUT ELDERLY ELDERLY POP
Source: PNAD 1998.
half a minimum wage
one minimum wage
The changes in family size for the urban population were of a lesser magnitudethan the ones occurring for the rural population (see Graph 31 for the cumulativedistribution of urban families by size). Graph 32 shows the average number of elderlymember by family size in urban areas and reinforces this idea. One can see anincrease of elderly members in all family sizes, including for the family of one, i.e.,those elderly people living alone.

32
GRAPH 31
Cumulative Distribution of Families by Size: Urban Brazil — 1988 and 1998
0%
10%
20%
30%
40%
50%
60%
70%
80%
90%
100%
1 2 3 4 5 6 7 8 9 10 11 12 13 14 15 16 17 18 19 20 21 22 23 24 25
FAMILY SIZE
1988
1998
Source: PNAD 1988; PNAD 1998.
GRAPH 32
Average Number of Elderly Members by Family Size: Urban Brazil — 1988 and 1998
0
0.1
0.2
0.3
0.4
0.5
0.6
1 2 3 4 5 6 7 8 9 10 11 12 13 14 15 16 17 18
FAMILY SIZE
1988
1998
Source: PNAD 1988; PNAD 1998.
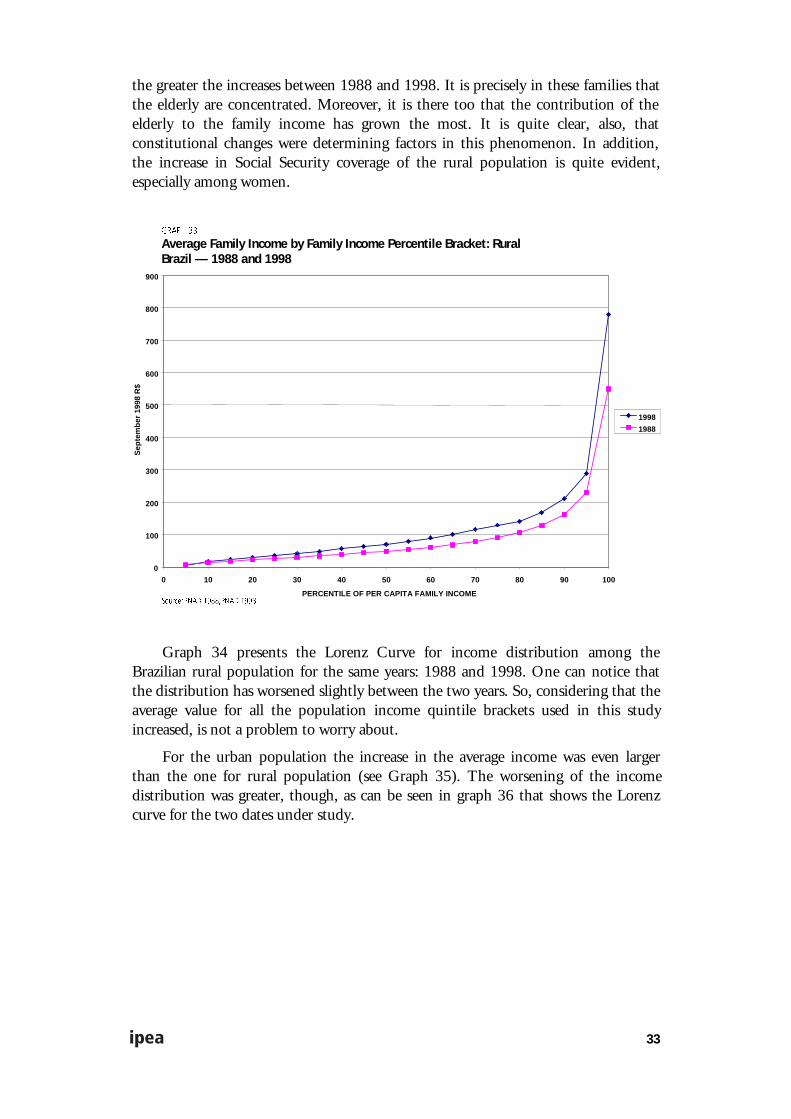
12 - COMMENTS AND CONCLUSIONSGraph 33 presents selected percentile values of per capita family income for theBrazilian rural region for the two instances in time considered in this text. All valuescorresponding to percentiles over 10 have had their value increased in real termsfrom 1988 to 1998. It is worthwhile noting as well that the higher the family income
33
the greater the increases between 1988 and 1998. It is precisely in these families thatthe elderly are concentrated. Moreover, it is there too that the contribution of theelderly to the family income has grown the most. It is quite clear, also, thatconstitutional changes were determining factors in this phenomenon. In addition,the increase in Social Security coverage of the rural population is quite evident,especially among women.
GRAPH 33
Average Family Income by Family Income Percentile Bracket: RuralBrazil — 1988 and 1998
0
100
200
300
400
500
600
700
800
900
0 10 20 30 40 50 60 70 80 90 100
PERCENTILE OF PER CAPITA FAMILY INCOME
Sep
tem
ber
1998
R$
1998
1988
Source:PNAD 1988;PNAD 1998.
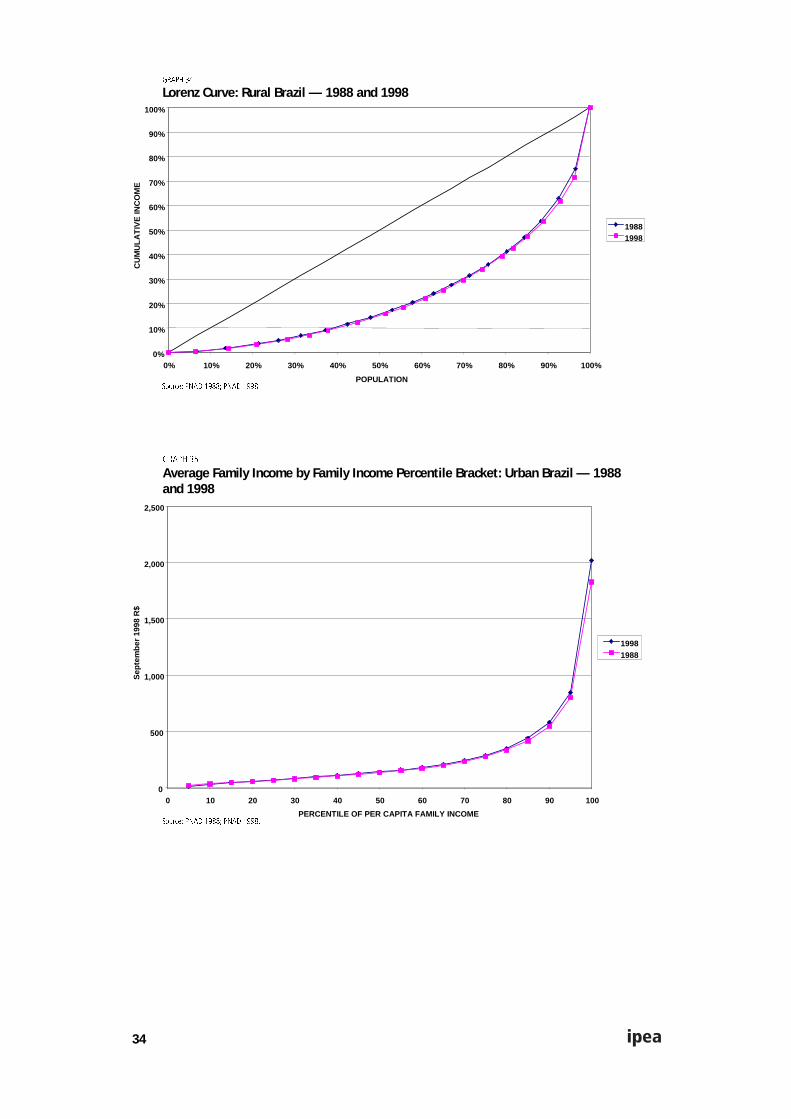
Graph 34 presents the Lorenz Curve for income distribution among theBrazilian rural population for the same years: 1988 and 1998. One can notice thatthe distribution has worsened slightly between the two years. So, considering that theaverage value for all the population income quintile brackets used in this studyincreased, is not a problem to worry about.
For the urban population the increase in the average income was even largerthan the one for rural population (see Graph 35). The worsening of the incomedistribution was greater, though, as can be seen in graph 36 that shows the Lorenzcurve for the two dates under study.
34
GRAPH 34
Lorenz Curve: Rural Brazil — 1988 and 1998
0%
10%
20%
30%
40%
50%
60%
70%
80%
90%
100%
0% 10% 20% 30% 40% 50% 60% 70% 80% 90% 100%
POPULATION
CU
MU
LAT
IVE
INC
OM
E
19881998
Source: PNAD 1988; PNAD 1998.
GRAPH 35
Average Family Income by Family Income Percentile Bracket: Urban Brazil — 1988and 1998
0
500
1,000
1,500
2,000
2,500
0 10 20 30 40 50 60 70 80 90 100
PERCENTILE OF PER CAPITA FAMILY INCOME
Sep
tem
ber
1998
R$
19981988
Source: PNAD 1988; PNAD 1998.

35
GRAPH 36
Lorenz Curve: Urban Brazil — 1988 and 1998
0%
10%
20%
30%
40%
50%
60%
70%
80%
90%
100%
0% 10% 20% 30% 40% 50% 60% 70% 80% 90% 100%
POPULATION
INC
OM
E
19881998
Source: PNAD 1988; PNAD 1998.
Even if Social Security benefits have the specific function of serving as“insurance against loss of earning capacity,” the social role that Social Security hasplayed in elevating average income, specially for the rural population, is undeniable,and, in this way, has collaborated towards mitigating poverty. Besides, for thepopulation as a whole, it is Social Security that guarantees the income for the elderlyand consequently for their family members. The 1988 Constitution and thecomplementary laws that followed were fundamental in the shaping of this newreality.
BIBLIOGRAPHYBARROS, R. P. de, MENDONÇA, R. Determinants of inequality in Brazil. Rio de
Janeiro: IPEA, jul. 1995 (Texto para Discussão, 377).
BASSIN, A. The consumer revolt – what’s in it for you? Modern Beauty Shop, Hjan,1973.
BELTRÃO, K. I., OLIVEIRA, F. E. B. de, SOUZA, M. C. et alii. MAPS: umaversão amigável do Modelo Demográfico. Rio de Janeiro: IPEA, 2000 (SemináriosDimac, 7).
BRAZIL. Constitution of the Federative Republic of Brazil. Brasilia, 1988.
—————. Decree Law 7526 dated May 7, 1945 (Organic Law of Social Services).
—————. Decree Law 276 dated February 28, 1967 (Reforming of the RuralWorkers’ Statute).
—————. Decree Law 564 dated May 1, 1969 (Basic Social Security Plan).
—————. Law 2613 dated September 23, 1955 (created the Rural Social Services).
—————. Law 4214 dated March 2, 1963 (Rural Workers’ Statute).

36
—————. Law 5694 dated August 23, 1971 (changes first item I of paragraph 4 ofarticle 64 of Law 3807 of August 26, 1960.
—————. Law 6179 dated December 11, 1974 (creates a social assistance benefit).
—————. Law 6195 dated December 19, 1974 (creates Rural Workers’ AccidentInsurance).
—————. Law 6260 dated November 6, 1975 (includes Rural employer as apotential beneficiary).
—————. Law 8213 dated July 24, 1991.
—————. Complementary Law 11 dated May 25, 1971 (Rural Workers’Assistance Program: Pró-Rural).
IBGE. National Survey by Household Sampling (PNAD), 1988.
—————. National Survey by Household Sampling (PNAD), 1998.
OLIVEIRA, F. E. B. de, BELTRÃO, K. I., DAVID, A. C. de A. Previdência,poupança e crescimento econômico: interações e perspectivas. Rio deJaneiro: IPEA, 1998 (Texto para Discussão, 607).
OLIVEIRA, F. E. B. de, BELTRÃO, K. I., MEDICI, A. C. The social security reformin Brazil: past, present and future. Rio de Janeiro, 1993 (Report for ILO).
OLIVEIRA, F. E. B. de, BEVILAQUA, A. S. A diagnosis of rural social security andassistance. Rio de Janeiro: IPEA, 1984.
Ipea – Institute for Applied Economic Research
PUBLISHING DEPARTMENT
CoordinationCláudio Passos de Oliveira
SupervisionEverson da Silva MouraReginaldo da Silva Domingos
TypesettingBernar José VieiraCristiano Ferreira de AraújoDaniella Silva NogueiraDanilo Leite de Macedo TavaresDiego André Souza SantosJeovah Herculano Szervinsk JuniorLeonardo Hideki Higa
Cover designLuís Cláudio Cardoso da Silva
Graphic designRenato Rodrigues Buenos
The manuscripts in languages other than Portuguese published herein have not been proofread.
Ipea Bookstore
SBS – Quadra 1 − Bloco J − Ed. BNDES, Térreo 70076-900 − Brasília – DFBrazilTel.: + 55 (61) 3315 5336E-mail: [email protected]


Composed in Adobe Garamond 11/13.2 (text)Frutiger 47 (headings, graphs and tables)
Brasília – DF – Brazil


Ipea’s missionEnhance public policies that are essential to Brazilian development by producing and disseminating knowledge and by advising the state in its strategic decisions.