population distribution and abundance. region biosphere landscape ecosystem community interaction...
Post on 22-Dec-2015
220 views
TRANSCRIPT
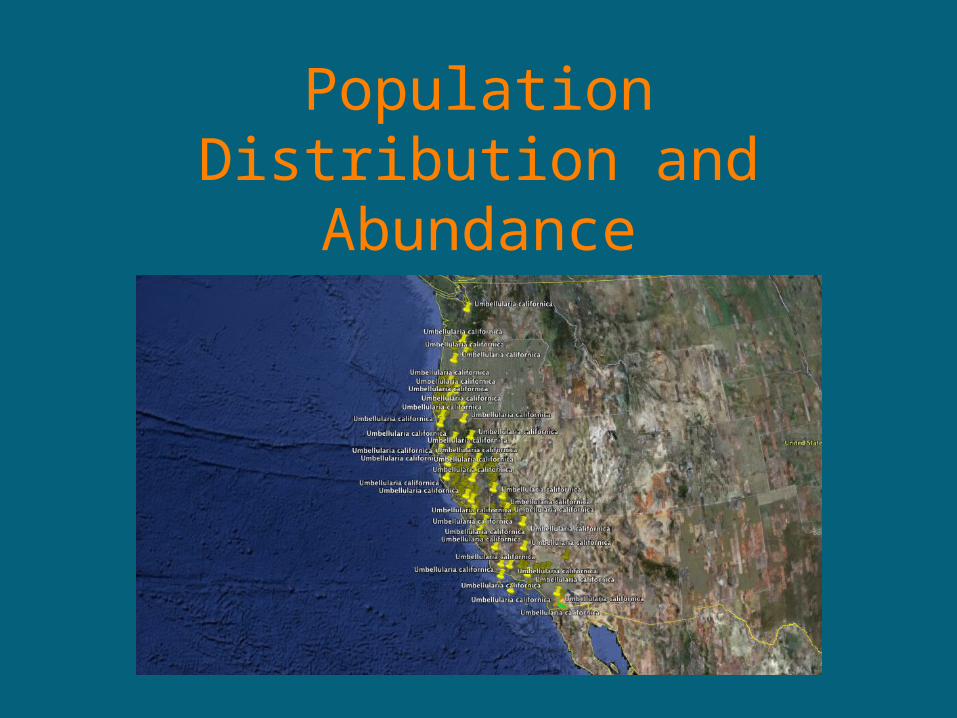
Population Distribution and Abundance
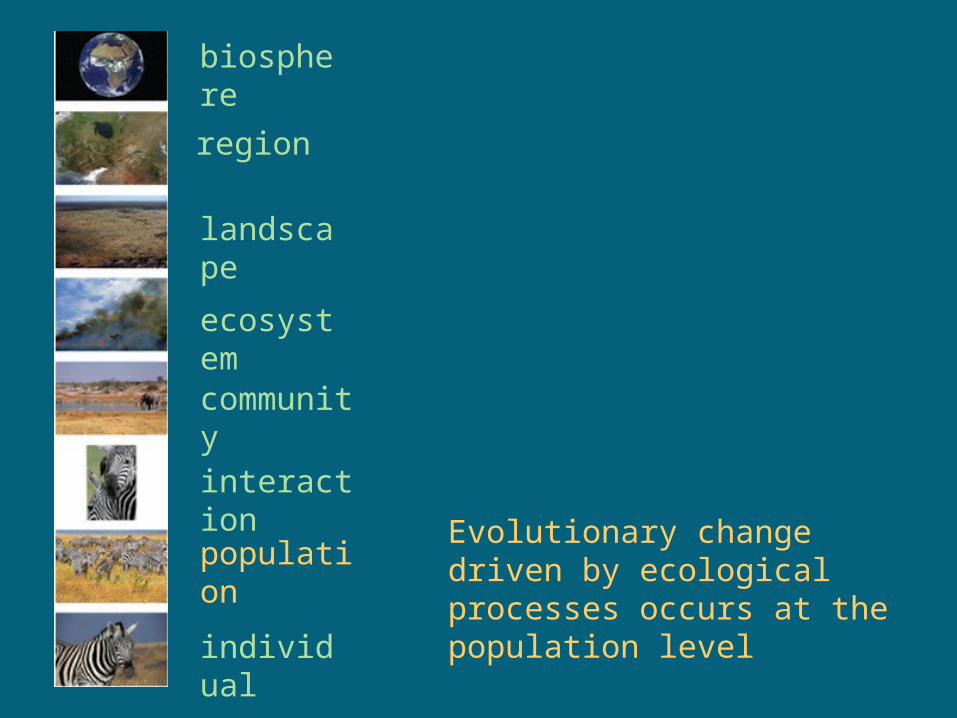
region
biosphere
landscape
ecosystem
community
interaction
population
individual
Evolutionary change driven by ecological processes occurs at the population level
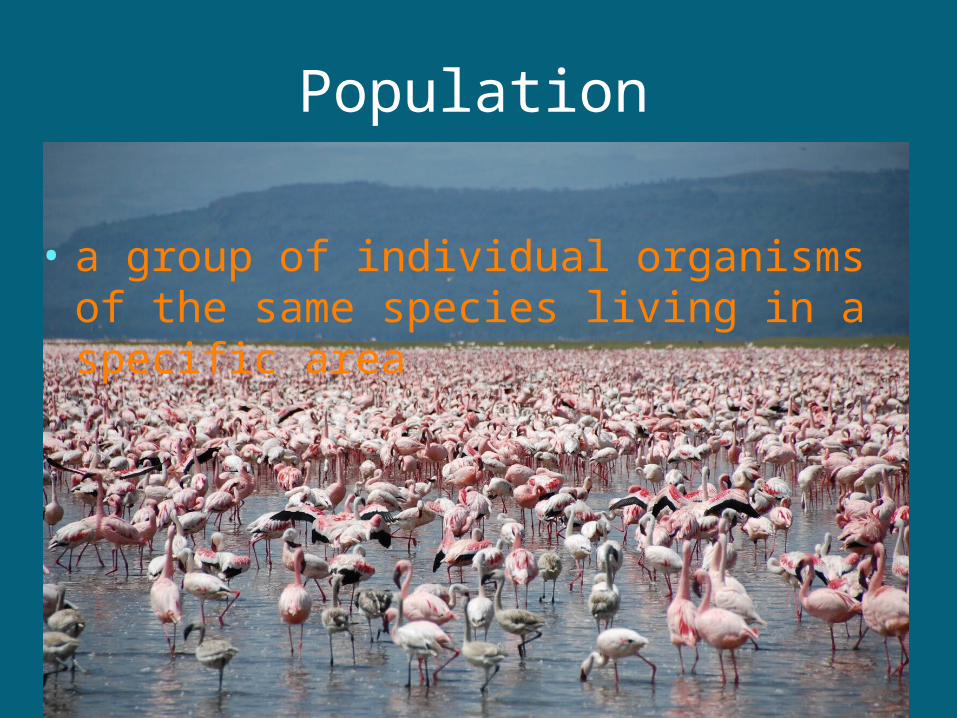
Population
• a group of individual organisms of the same species living in a specific area
Population
• Scale of area inhabited by a population varies depending on the organisms in question – could be a single mountain top or an entire continent
• Population may represent only a fraction of a species, or a single population may include all the individuals comprising a species.
Populations all share defining features:
• Distribution – physical location of individual organisms in area that the population inhabits
• Abundance – number and density of individual organisms within an area
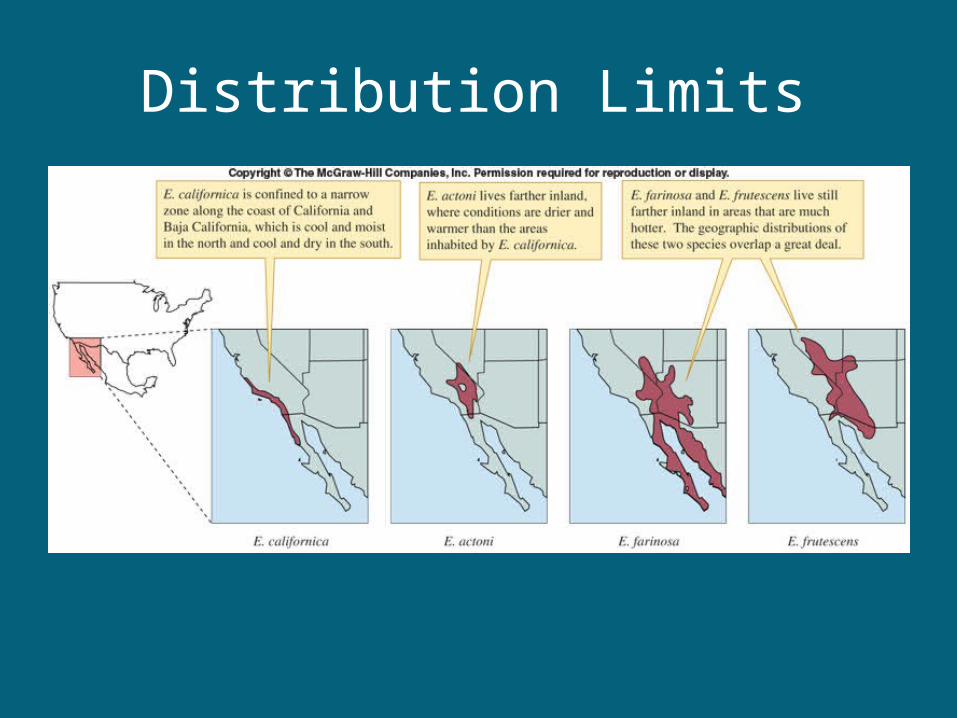
Distribution Limits
• Physical environment imposes limits on the distribution of populations• the range of environments in which a particular species can
exist is limited• at some point, the energy expended by an organism for
survival in an extreme environment exceeds the maximum energy intake that is possible for the organism
Distribution Limits

Distribution Limits
• Physical environment is not always directly responsible for limiting species distribution• climate may act indirectly through its influence on other
factors such as food production, habitat, and incidence of predators and parasites.
Distribution Limits
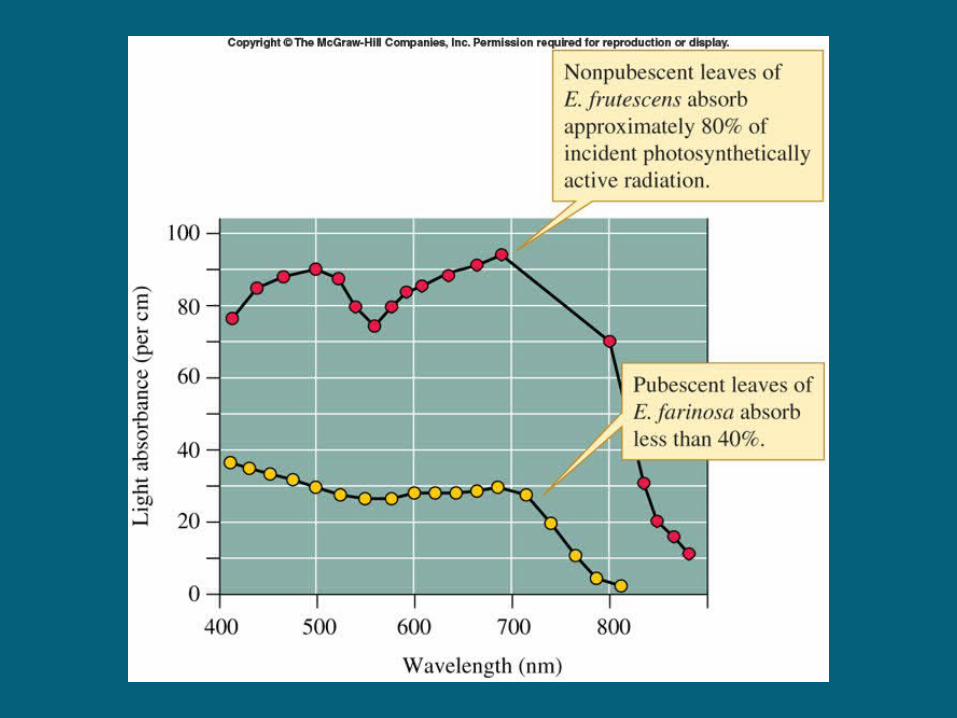
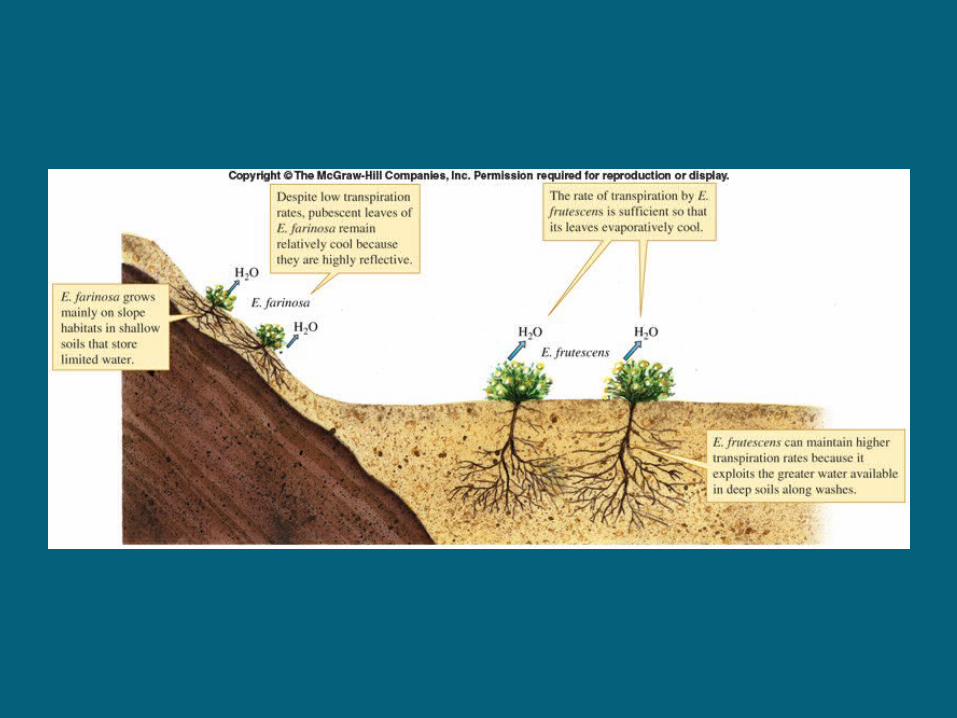
• Distribution of different species may overlap geographically, yet may be divided on a microclimatic scale
Distribution Limits
Distribution Limits
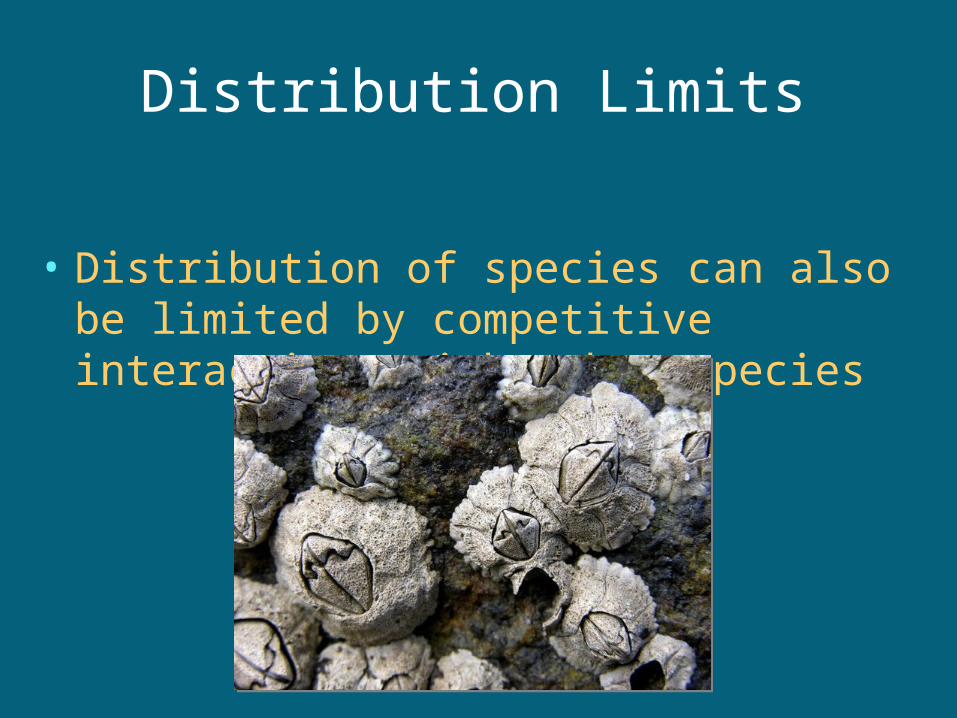
• Distribution of species can also be limited by competitive interactions with other species
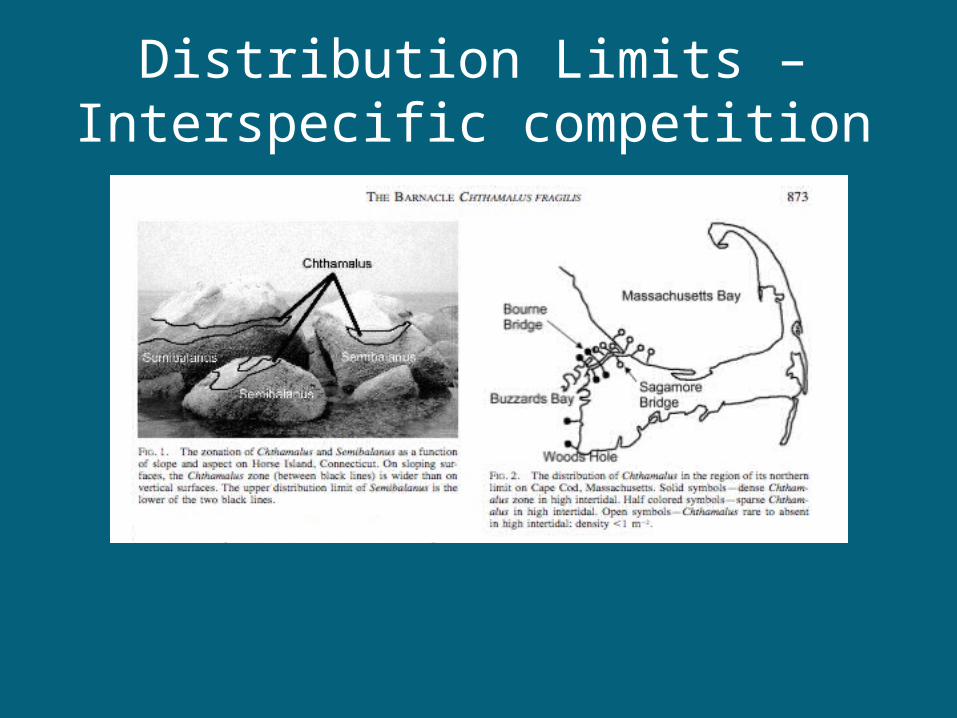
Distribution Limits – Interspecific competition
Large – and small – scale distribution of individuals within a population
• distinction between “large” and “small” scale depends on the size of the organisms being studied
• small-scale = small distances over which there is little environmental change significant to the organism under study
• large-scale = areas over which there is considerable environmental change from the perspective of the study organisms
Small – scale distribution of individuals in a population
• Random
• Regular
• Clumped
Small – scale distribution of individuals in a population
• Random, regular or clumped distributions are caused by the nature of interactions between individual organisms in a population and / or the structure of the physical environment
Small – scale distribution of individuals in a population
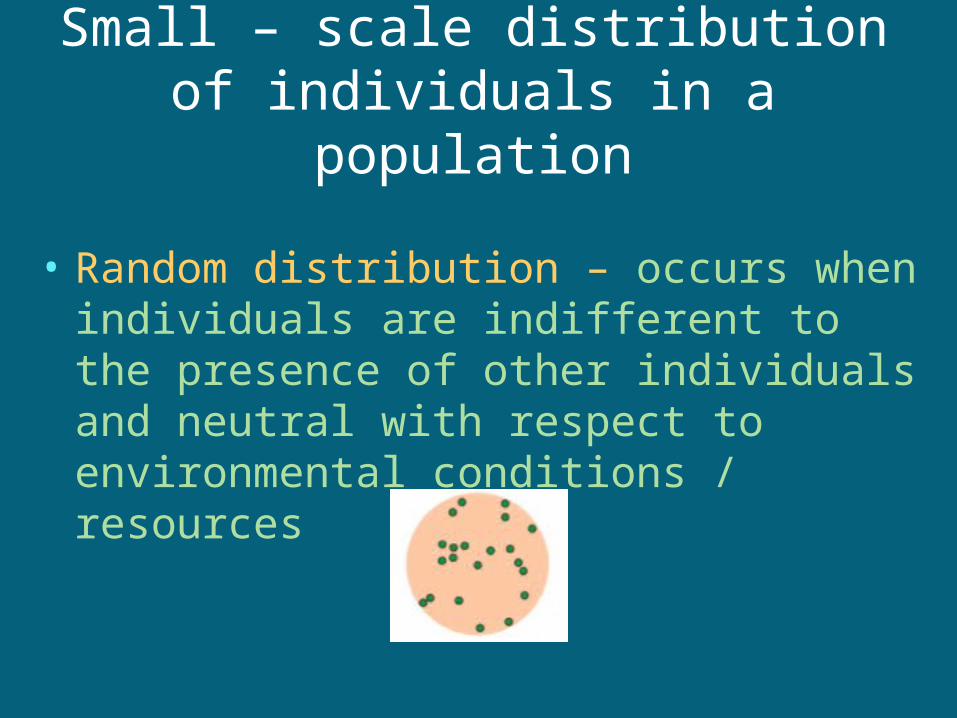
• Random distribution – occurs when individuals are indifferent to the presence of other individuals and neutral with respect to environmental conditions / resources
Small – scale distribution of individuals in a population
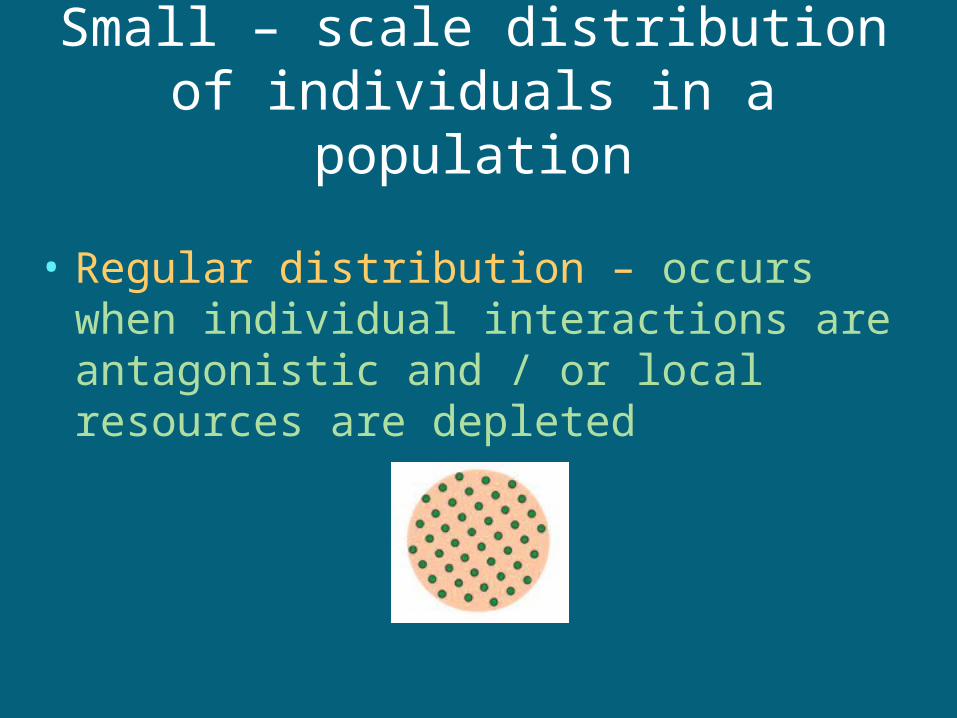
• Regular distribution – occurs when individual interactions are antagonistic and / or local resources are depleted
Small – scale distribution of individuals in a population
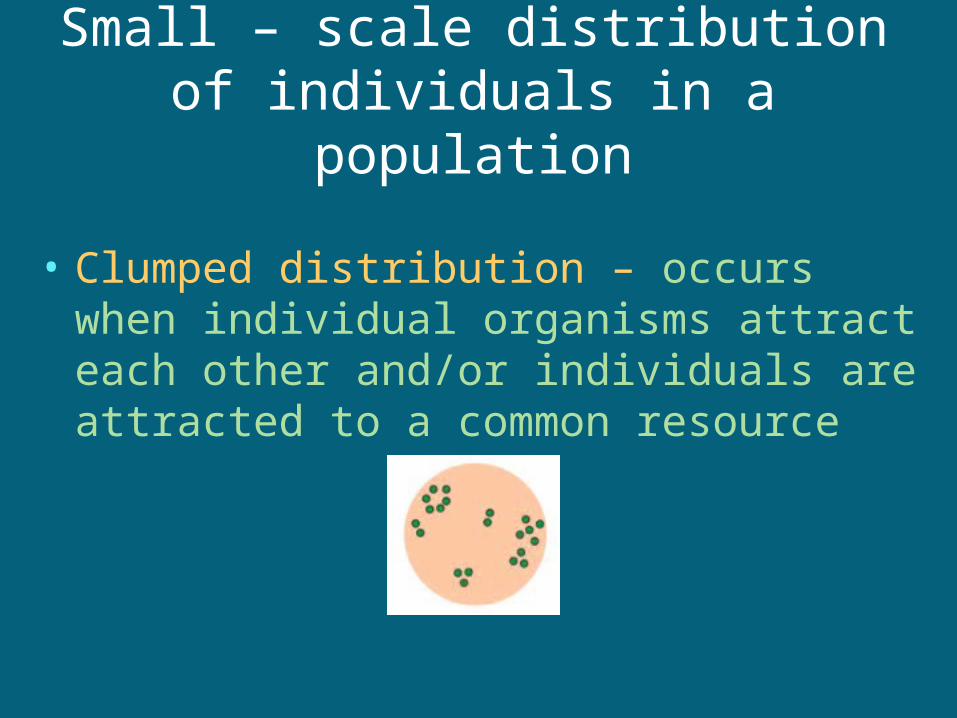
• Clumped distribution – occurs when individual organisms attract each other and/or individuals are attracted to a common resource
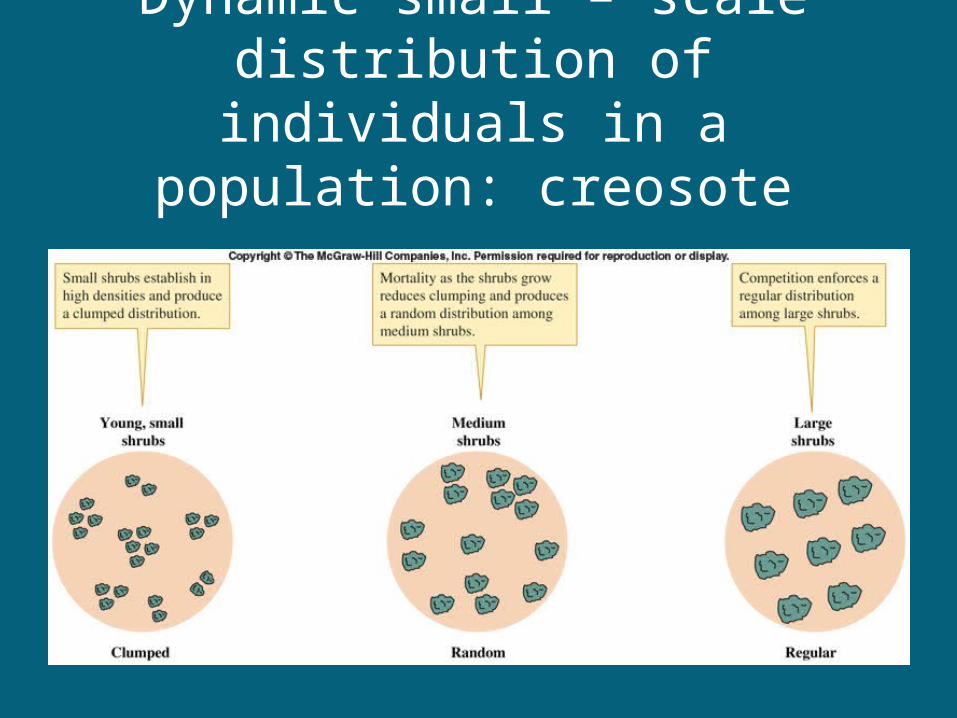
Dynamic small – scale distribution of individuals in a population: creosote
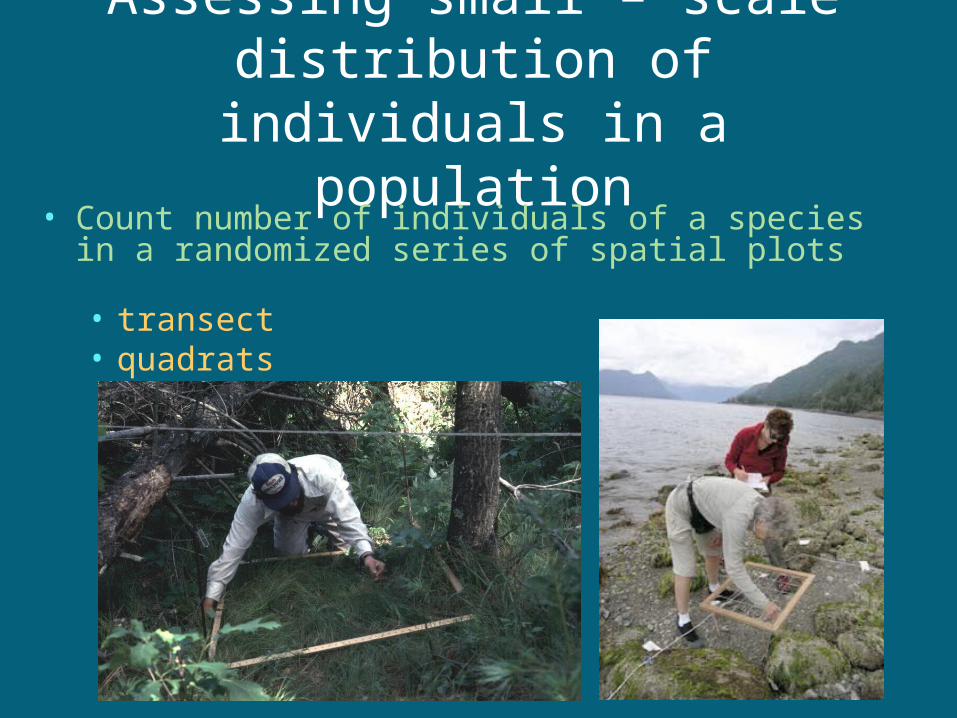
Assessing small – scale distribution of individuals in a population
• Count number of individuals of a species in a randomized series of spatial plots
• transect• quadrats
Assessing small – scale distribution of individuals in a population
• for each plot, calculate the mean (x) number of individuals of a species and determine the variance (s2) around the mean
Assessing small – scale distribution of individuals in a population
• if s2 is less than x, the distribution is regular• if s2 is greater than x, the distribution is clumped• if s2 is equal to x, the distribution is random
Large – scale patterns of population distribution
• From a large-scale perspective, population distributions always appear clumped
• individuals are concentrated around environmentally suitable, resource-rich areas
Abundance
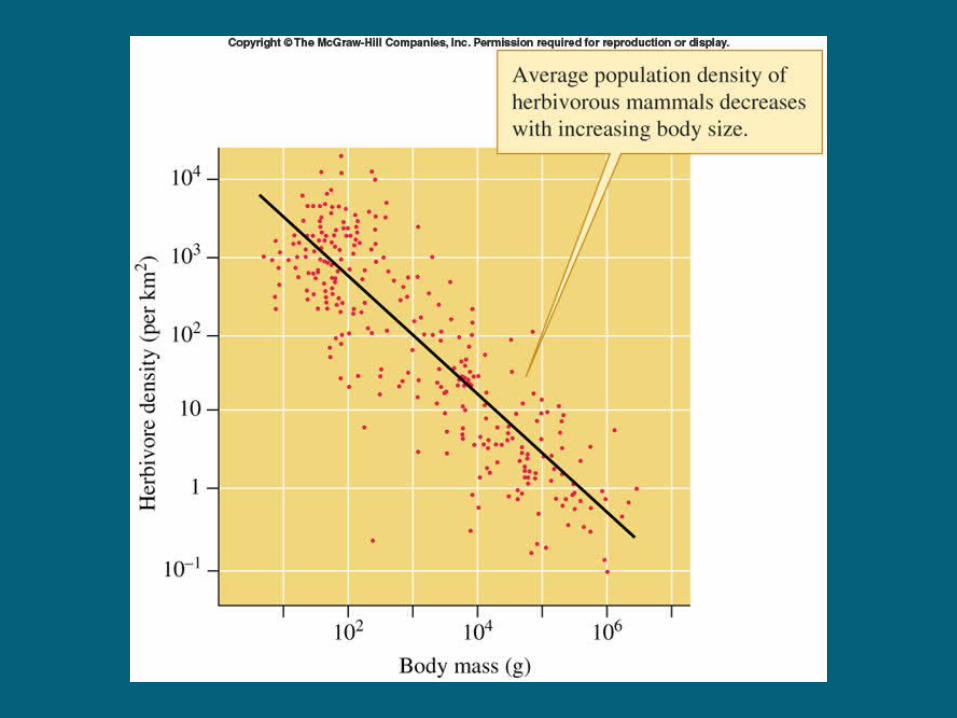
• smaller organisms tend to live at higher densities (numbers of individuals per unit area) than larger organisms
• Population density decreases as the size of organisms increases
Abundance

Abundance
• Population density decreases as the size of organisms increases – but…how much? Is the relationship the same for all types of organisms?
• aquatic invertebrates tend to live at higher densities than terrestrial invertebrates of similar size
• mammals tend to live at higher densities than birds of similar size
Abundance
• Plant population density also decreases with plant size, but population density is more dynamic, changes as plants mature and grow larger
Abundance
• Population density / organism size relationship is important to quantify, as this generalization can be used to calculate expected population densities for a species of a given size and taxonomic group.
• can determine whether a particular population is unusually abundant or sparse
Extinction
• Patterns of population distribution and abundance are a key factor determining a species’ persistence or extinction
• rare species are more prone to extinction than common species – but how are rarity and commonness determined?
Rarity
• Classification of commonness and rarity based on three factors:
1) geographic range (extensive vs. restricted)2) habitat tolerance (broad vs. narrow)3) local population size (large vs. small)
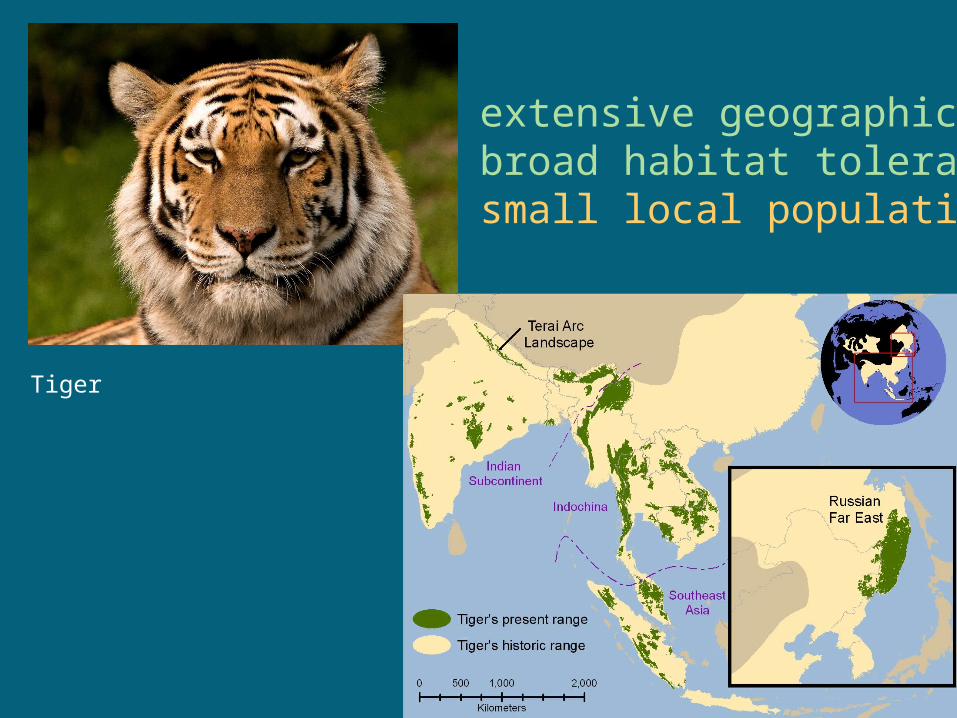
extensive geographic rangebroad habitat tolerancesmall local population size
Tiger

restricted geographic rangebroad habitat tolerancesmall local population size
Tasmanian Devil
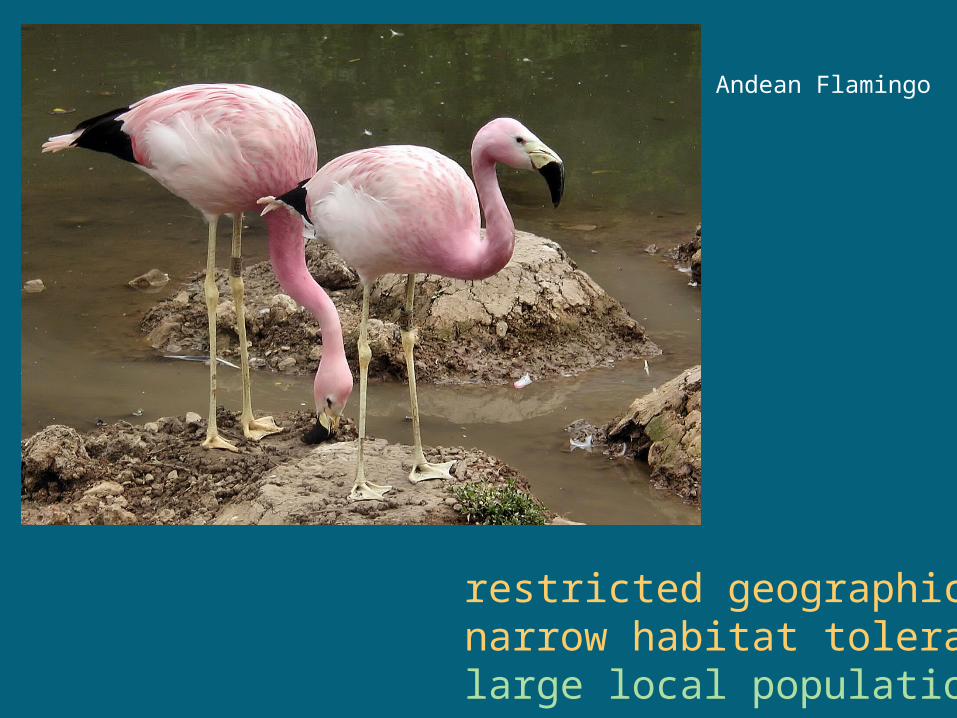
restricted geographic rangenarrow habitat tolerancelarge local population size
Andean Flamingo
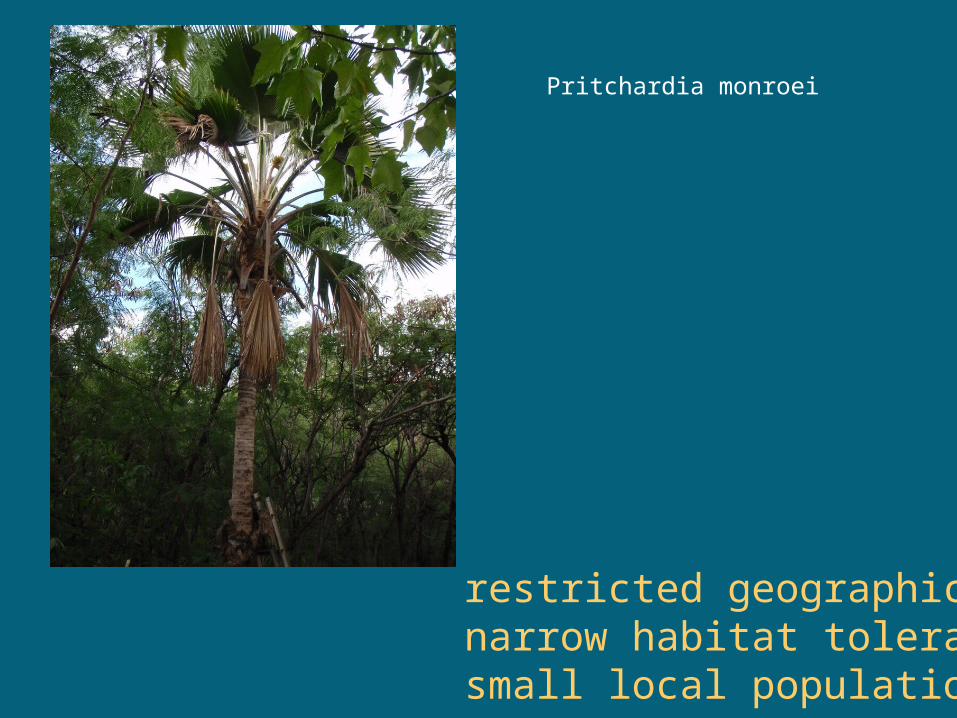
Pritchardia monroei
restricted geographic rangenarrow habitat tolerancesmall local population size
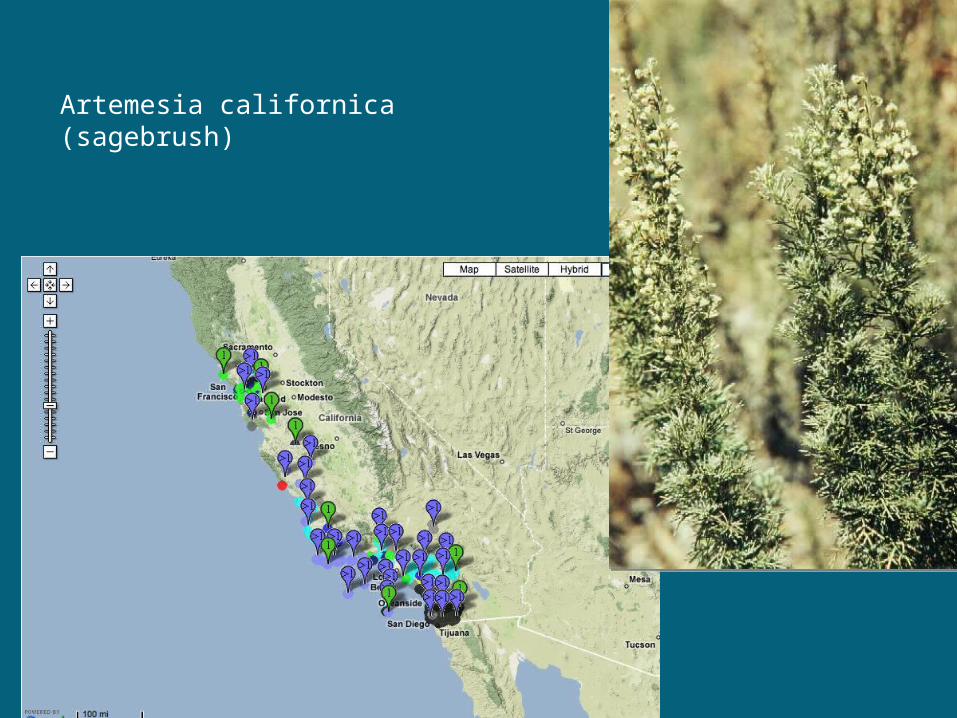
Artemesia californica (sagebrush)
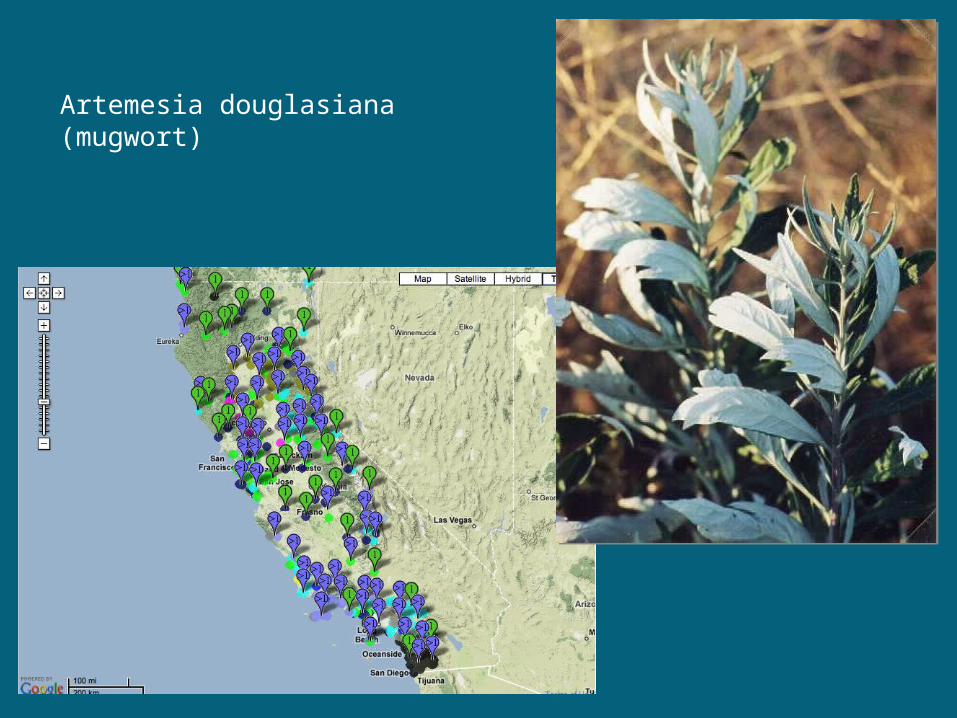
Artemesia douglasiana (mugwort)

Encelia californica
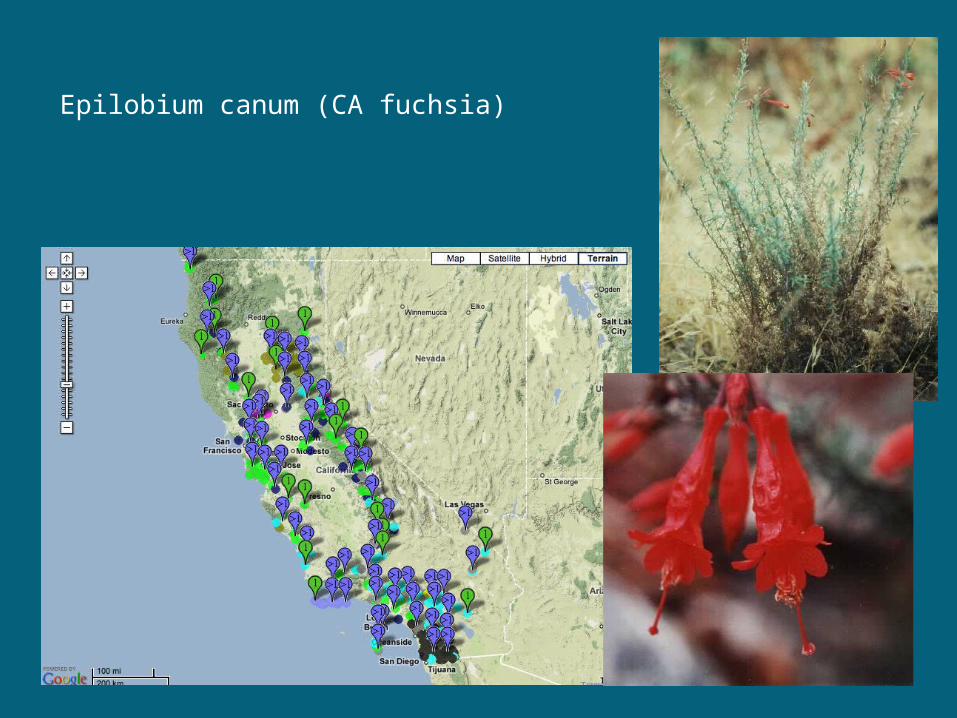
Epilobium canum (CA fuchsia)
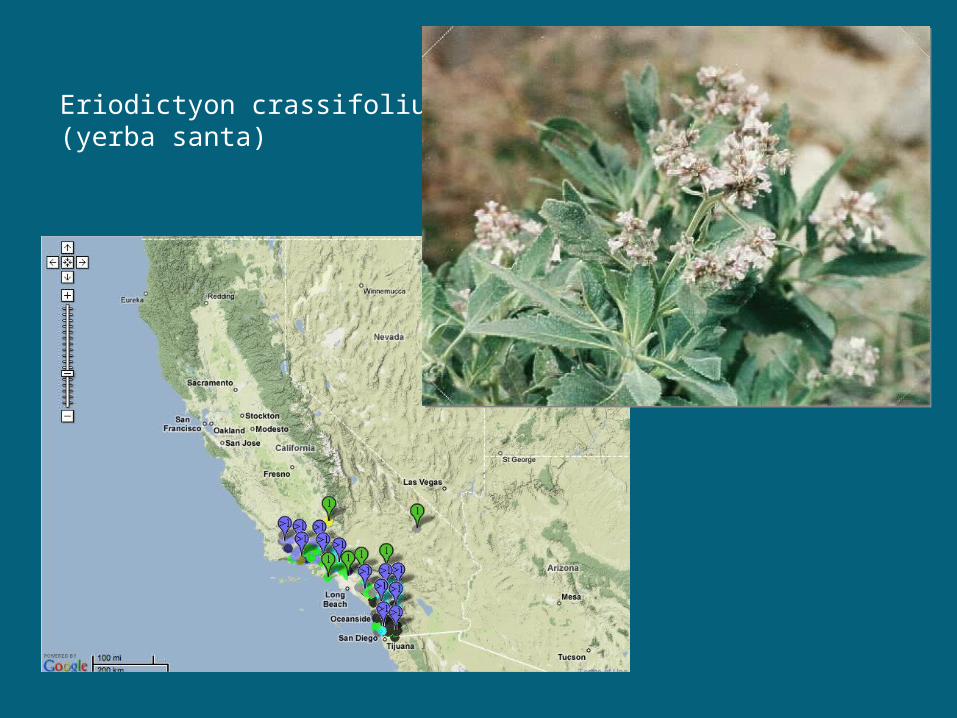
Eriodictyon crassifolium(yerba santa)
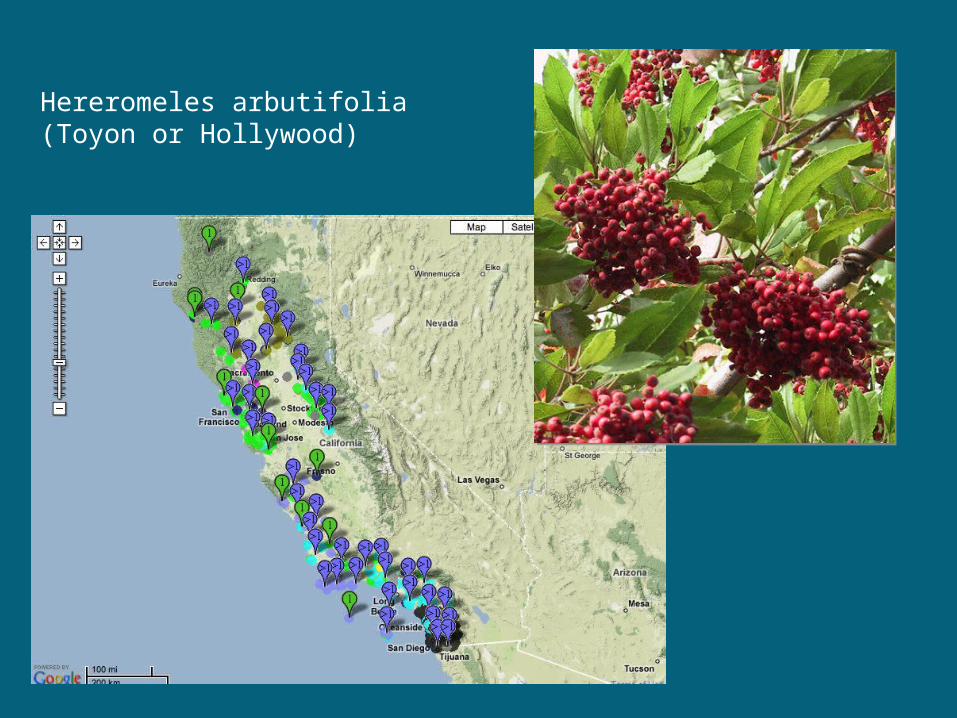
Hereromeles arbutifolia (Toyon or Hollywood)
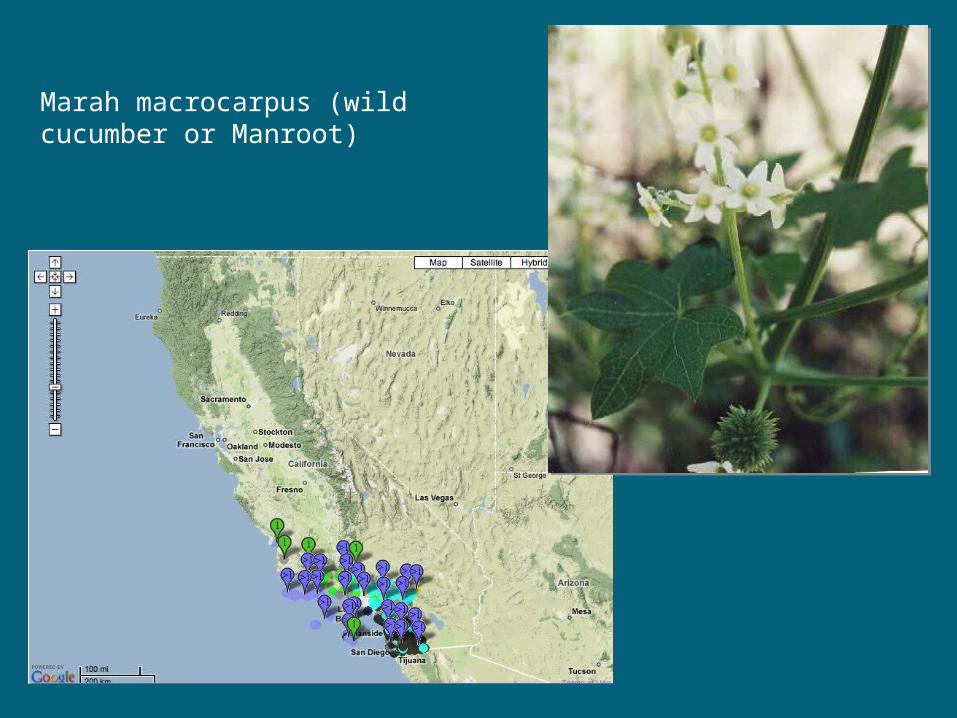
Marah macrocarpus (wild cucumber or Manroot)
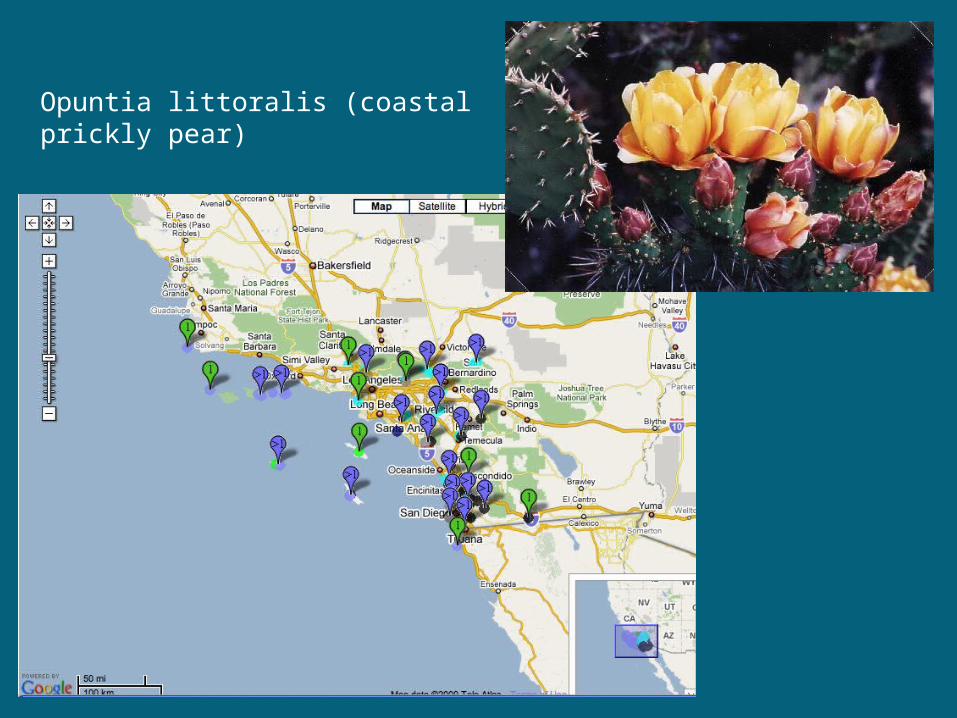
Opuntia littoralis (coastal prickly pear)
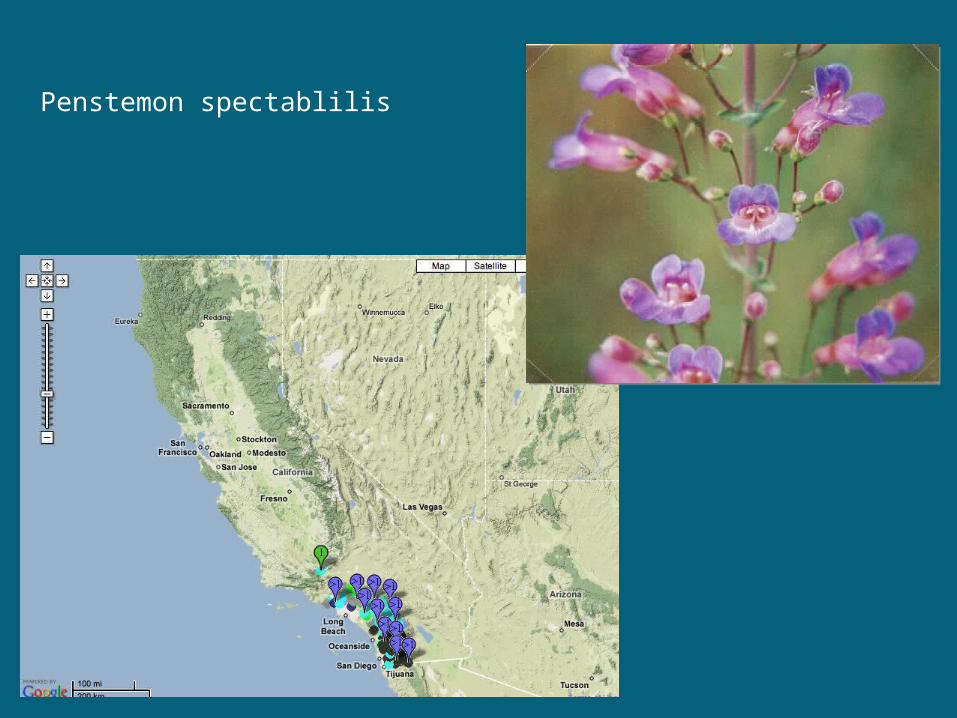
Penstemon spectablilis
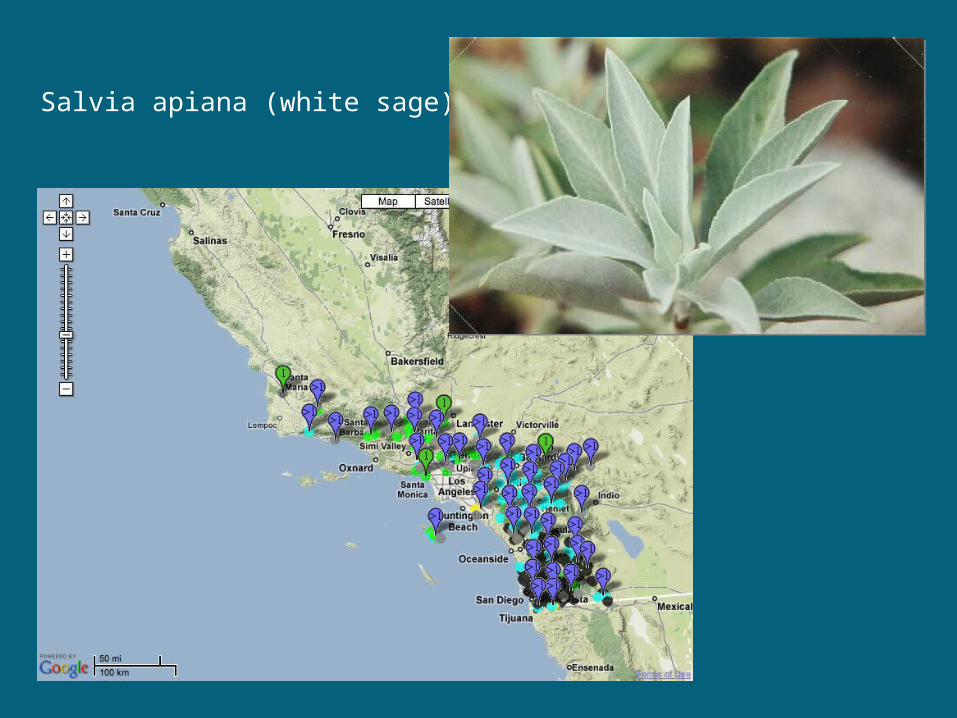
Salvia apiana (white sage)
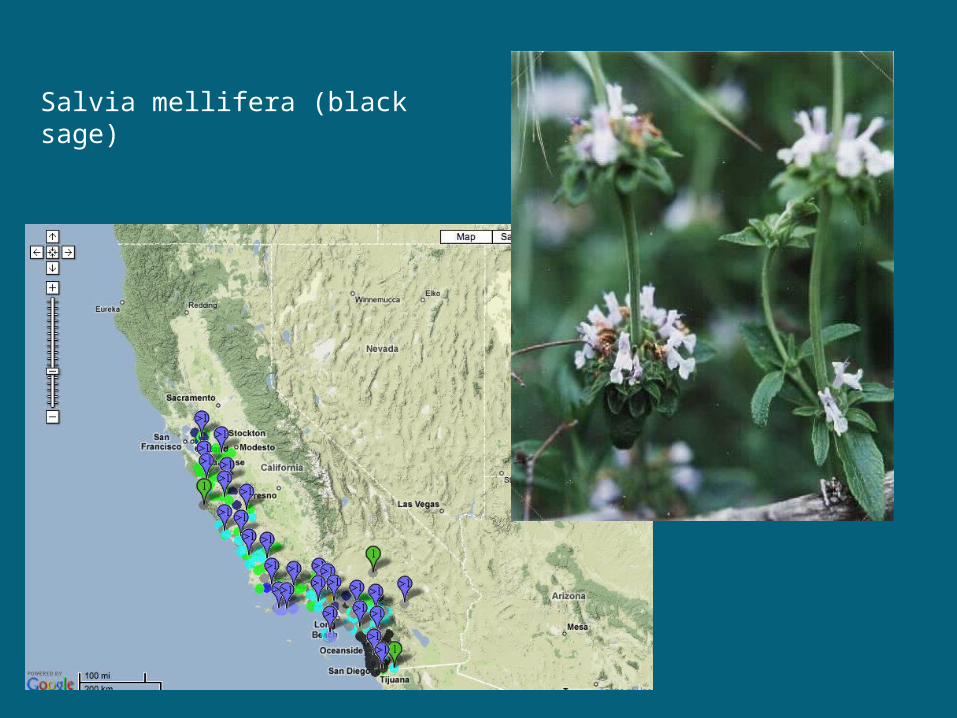
Salvia mellifera (black sage)
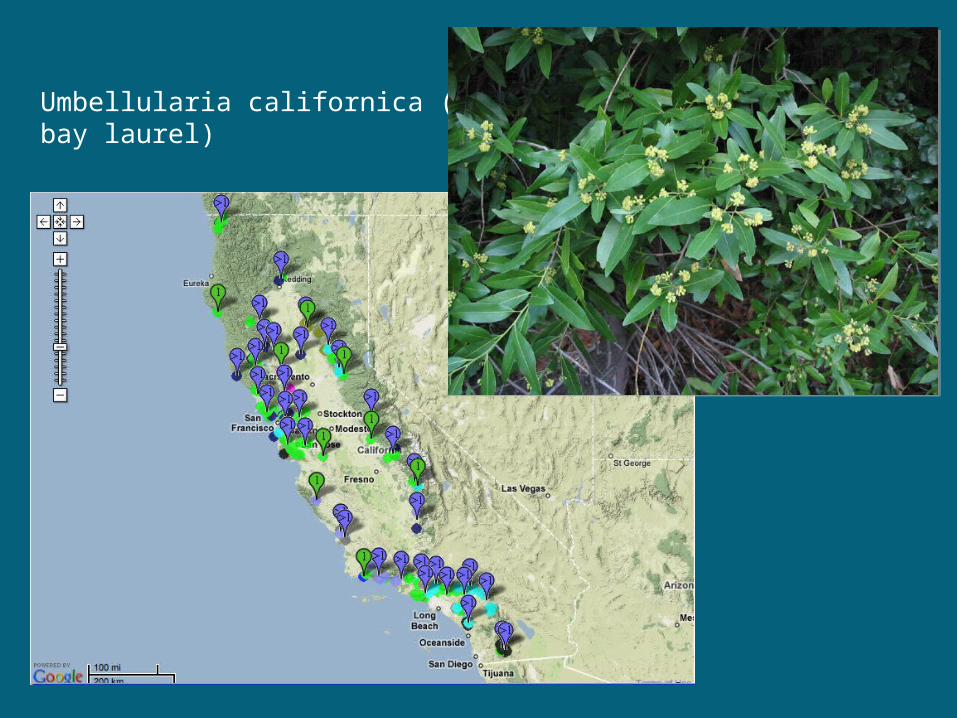
Umbellularia californica (CA bay laurel)
Population Dynamics and Growth
• Population distribution and abundance changes through time – not a static feature, but one that is in constant flux
Population Dynamics and Growth
• Patterns of population distribution and abundance arise through the dynamic balance of two types of processes:
• processes that ADD individuals to populations and those that REMOVE individuals from populations
Population Dynamics and Growth
• Immigration & births – add individuals to populations
• Emigration & deaths – remove individuals from populations
Dispersal
• movement of individuals to establish populations in new areas (range expansion)
• movement of individuals within the bounds of an established population range
• movement of individuals between spatially isolated populations